

Abstract
Ferroptosis is a non-apoptotic form of regulated cell death triggered by the discoordination of regulatory redox mechanisms culminating in massive peroxidation of polyunsaturated phospholipids. Ferroptosis inducers have shown remarkable effectiveness in killing tumor cells in vitro, yet with no obvious success in experimental animal models, with a notable exception of immune-deficient mice 1,2. This suggests the potential poorly understood contribution of ferroptosis on immune cells. Pathologically activated neutrophils (PMN), termed myeloid-derived suppressor cells (PMN-MDSC), are major negative regulators of anti-tumor immunity3–5. Here, we found that PMN-MDSC in the tumor microenvironment (TME), spontaneously die by ferroptosis. While decreasing the presence of PMN-MDSC, ferroptosis induces the release of oxygenated lipids and limits mouse and human T cell activity. In immune-competent mice, genetic and pharmacological inhibition of ferroptosis abrogates suppressive activity of PMN-MDSC, reduces tumor progression, and synergizes with immune checkpoint blockade (ICB) to suppress the tumor growth. In contrast, induction of ferroptosis in immune-competent mice promotes tumor growth. Thus, ferroptosis is a unique and targetable immunosuppressive mechanism of PMN-MDSC in the TME that can be pharmacologically modulated to limit tumor progression.
PMN-MDSC have distinct transcriptomic, proteomic, and metabolic features3–5. Functionally, PMN-MDSC are immune-suppressive 6,7 with much more potent activity in the tumors 8,9. The presence of PMN-MDSC in cancer patients is associated with poor clinical outcome and immunotherapy resistance10. Recently, a single-cell transcriptome analysis of PMN-MDSC from human colorectal cancer liver metastasis showed enrichment of ferroptotic pathway genes11 suggesting higher susceptibility of these cells to ferroptosis. Several factors can contribute to ferroptosis: a) impairment of the redox protection mechanism such as inhibition of glutathione peroxidase 4 (GPX4)/glutathione (GSH) system, b) increased esterification of polyunsaturated fatty acids (PUFA) into phospholipids (PL-PUFA) through acyl-coenzyme A chain family member 4 (ACSL4) synthetase, and 3) accumulation of ferroptosis associated lipid signals (FALIS) such as oxidized PL-PUFA catalyzed by lipoxygenases (ALOXs)12,13. Given the essentiality of GPX4/GSH mechanisms in restraining iron (ALOX)-catalyzed phospholipid peroxidation and ferroptotic death, the most commonly used types of ferroptosis inducers (1S,3R) RSL3 and Erastin as well as its analog Imidazole Ketone Erastin (IKE) target GPX4 and cystine-glutamate antiporter system xc−, respectively12. Ferroptosis results in a massive release of lipid metabolites13–15. In this study, we provide evidence that in immunocompetent hosts, ferroptosis of PMN-MDSC promotes tumor growth by restricting antitumor immunity. These findings are in stark contrast with the existing paradigm of ferroptosis as a tumor growth-limiting process.
Tumor-associated PMN-MDSC are susceptible to ferroptosis
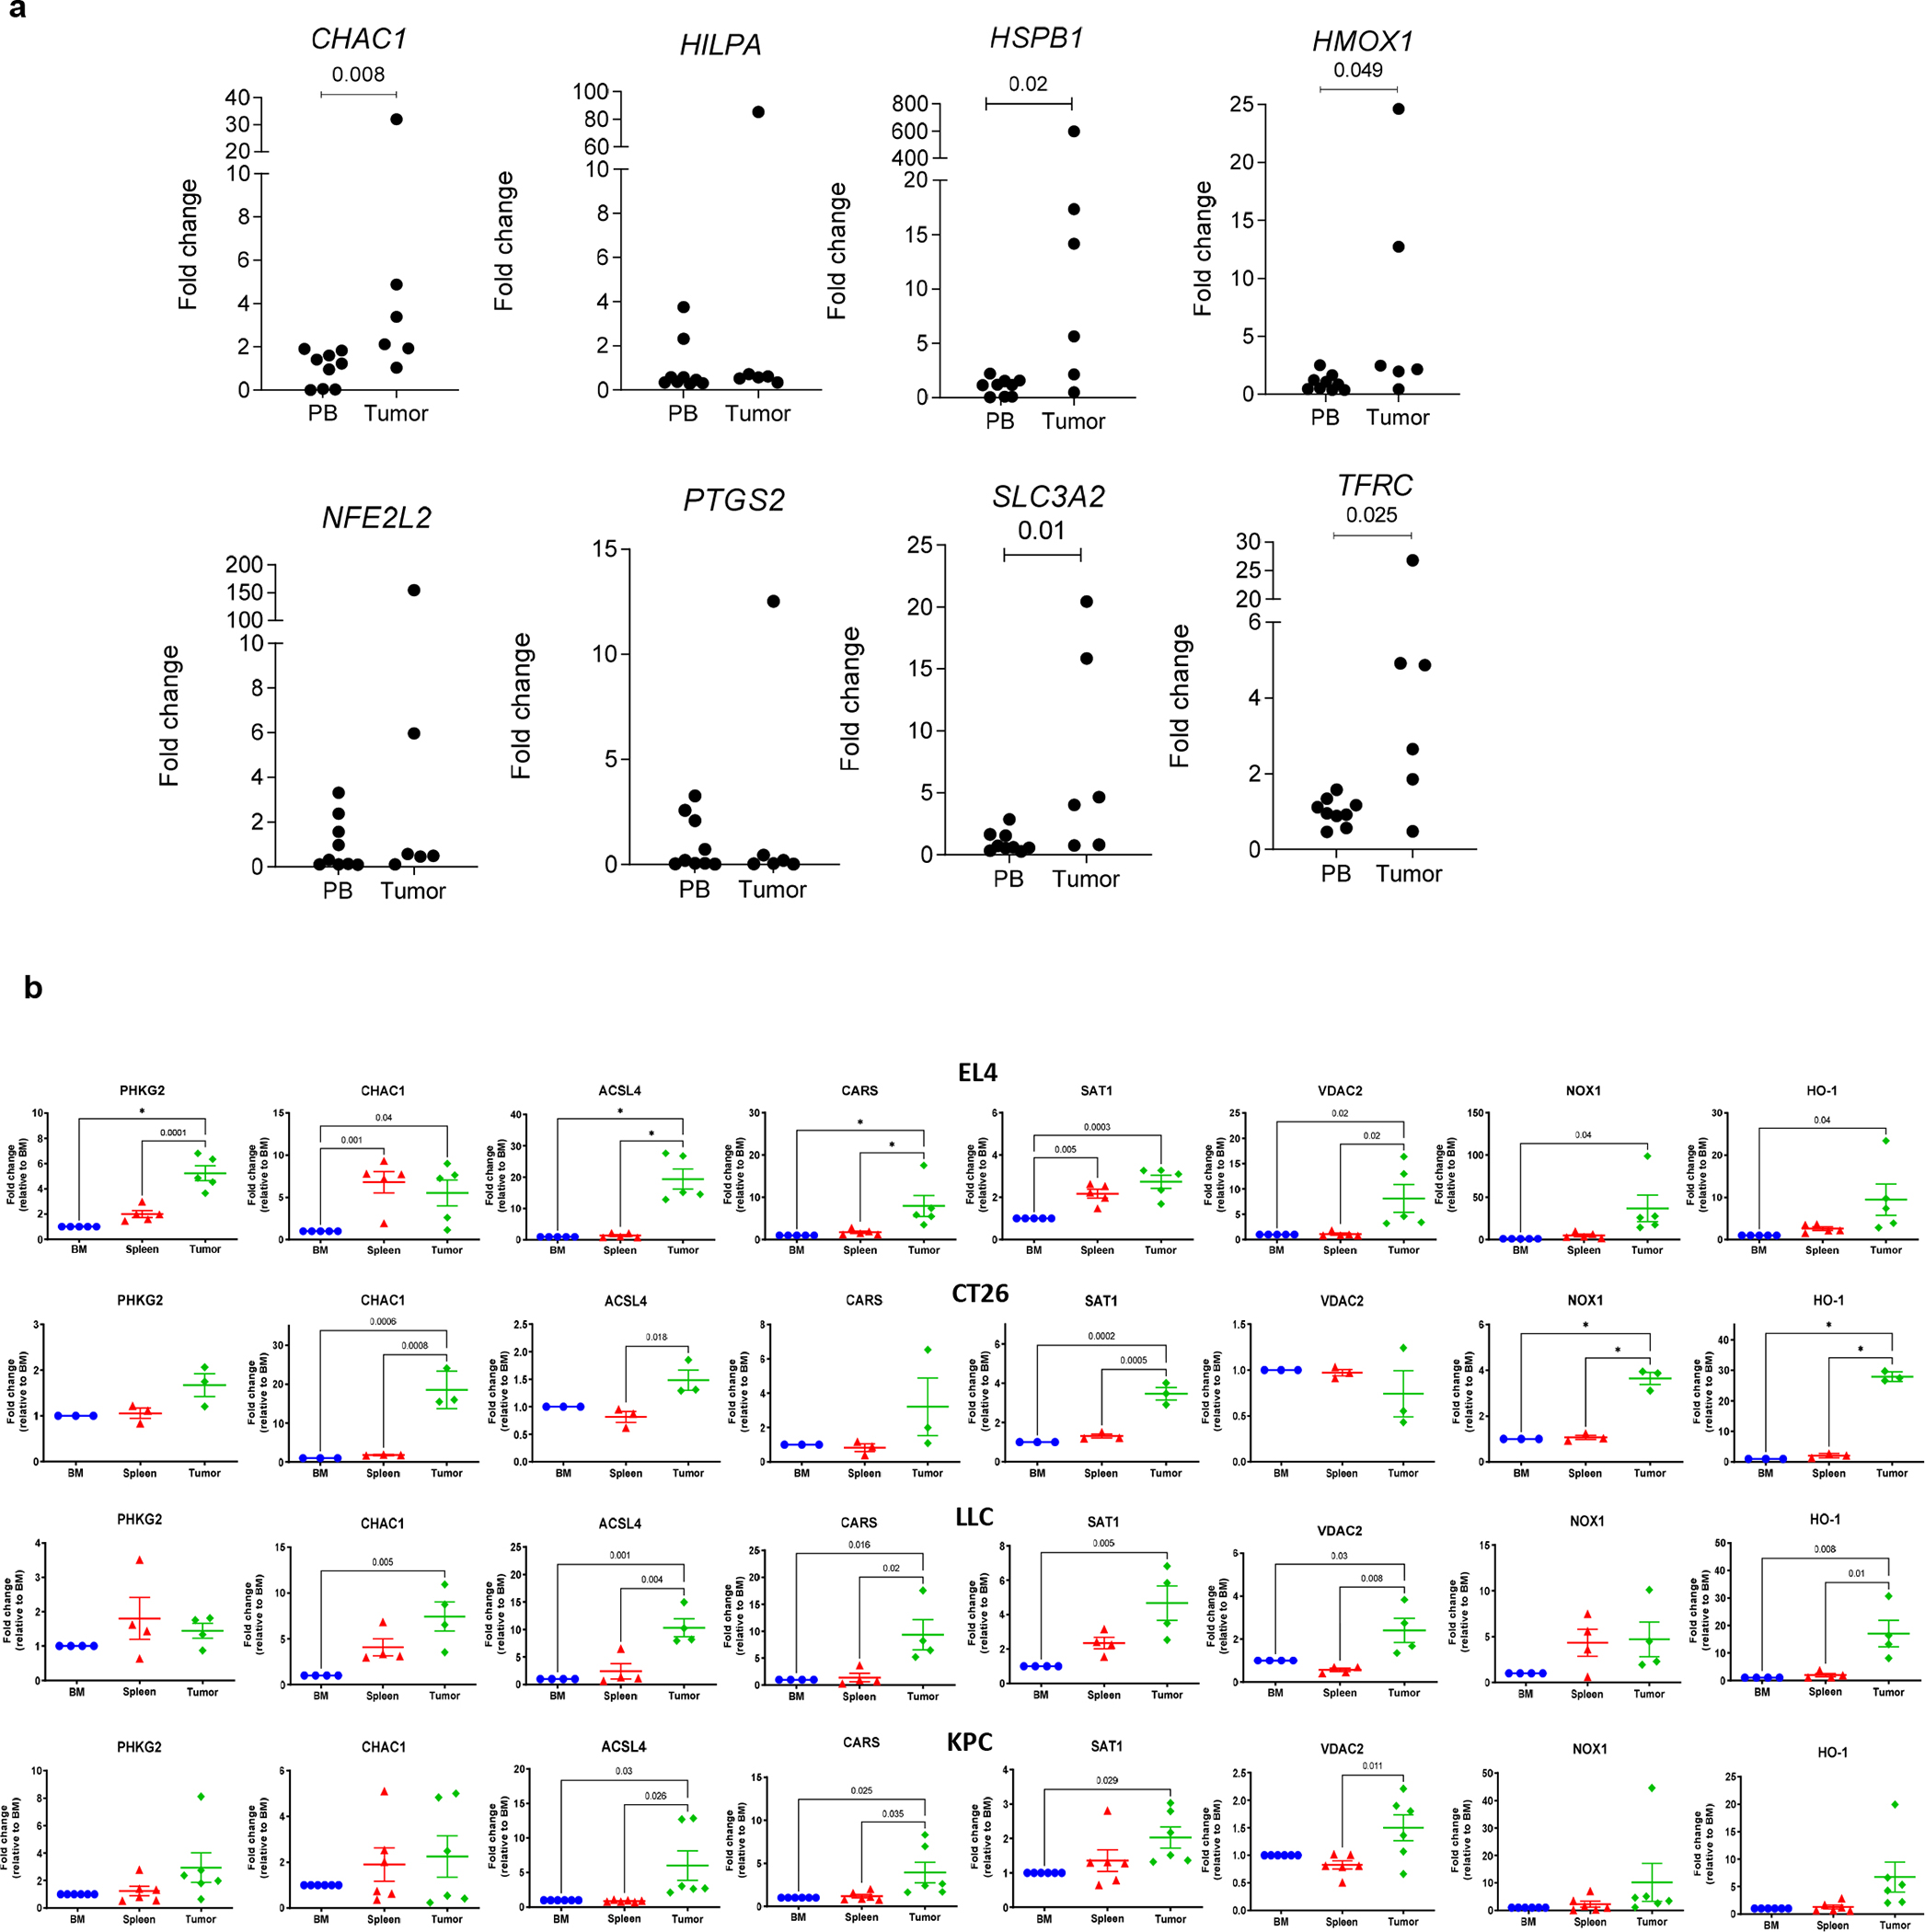
Whole transcriptomic analysis of human tumor PMN-MDSC 9 revealed up-regulation of several genes involved in the regulation of ferroptosis16 (Extended Data Fig. 1a). A similar analysis of mouse tumor PMN-MDSC demonstrated upregulation of some ferroptosis-related genes in CD14high PMN-MDSC as compared to CD14neg classical PMN9 (Extended Data Fig. 1b). We compiled a ferroptosis gene signature that consists of the 8 most changed ferroptosis genes in human PMN-MDSC RNA-seq (Extended Data Fig. 1c) and applied this to the single-cell RNAseq dataset of non-small cell lung cancer (NSCLC) patients reported previously17. Higher expression of ferroptosis signature was found in tumor PMN than in peripheral blood PMN, as well as other myeloid cells and tumor T-lymphocytes (Extended Data Fig. 1d). We validated these results in PMN-MDSC isolated from peripheral blood and tumors of patients with NCSLC and head and neck cancer (HNC) (Extended Data Fig. 2a).
In-depth analysis of ferroptosis related genes was performed in PMN-MDSC isolated from bone marrow (BM), spleen, and tumor of transplantable mouse models of EL-4 lymphoma, CT26 colon, LLC lung carcinoma, as well as in autochthonous pancreatic adenocarcinoma from transgenic KPC (KrasG12D/p53R172H, PdxCre) mice. Tumor PMN-MDSC demonstrated strong up-regulation of ferroptosis-related genes as compared to these cells isolated from BM and spleen (Extended Data Fig. 2b).
Ferroptosis is characterized by the accumulation of FALIS, oxidized phosphatidylethanolamine (PEox) containing arachidonic acid (AA-PEox) 18–20. We measured FALIS in PMN using mass-spectrometry in different tumor models. Accumulation of AA-PEox was observed in tumor PMN-MDSC as compared to the cells isolated from the spleen and BM (Fig. 1a). In contrast, little accumulation of AA-PEox was observed in tumor monocytic MDSC (M-MDSC) (Extended Data Fig. 3a). To assess the intrinsic vulnerability of PMN-MDSCs to ferroptosis in different tissues, these cells were treated with ferroptosis trigger RSL3. Tumor PMN-MDSC across different tumor models demonstrated markedly higher sensitivity to RSL3 than BM and spleen PMN-MDSC (Fig. 1b). This phenomenon was not observed in M-MDSC (Extended Data Fig. 3b). To further clarify the contribution of ferroptosis to PMN-MDSC death, cells were isolated from spleen and tumors of EL-4 TB mice and then cultured for 24 hr in the presence of inhibitors of apoptosis z-VAD-FMK (zVAD), ferroptosis (ferrostatin-1), or necroptosis (necrostatin-1). zVAD markedly improved survival of spleen PMN-MDSC, confirming contribution of apoptosis to PMN-MDSCs cell death, whereas ferroptosis or necroptosis inhibitors did not affect cell survival. In contrast, the viability of tumor PMN-MDSC was improved not only by zVAD but also by ferrostatn-1 indicating that ferroptosis contributes to the death of tumor PMN-MDSC (Fig. 1c).
Figure 1. Ferroptosis in tumor-associated PMN-MDSC.
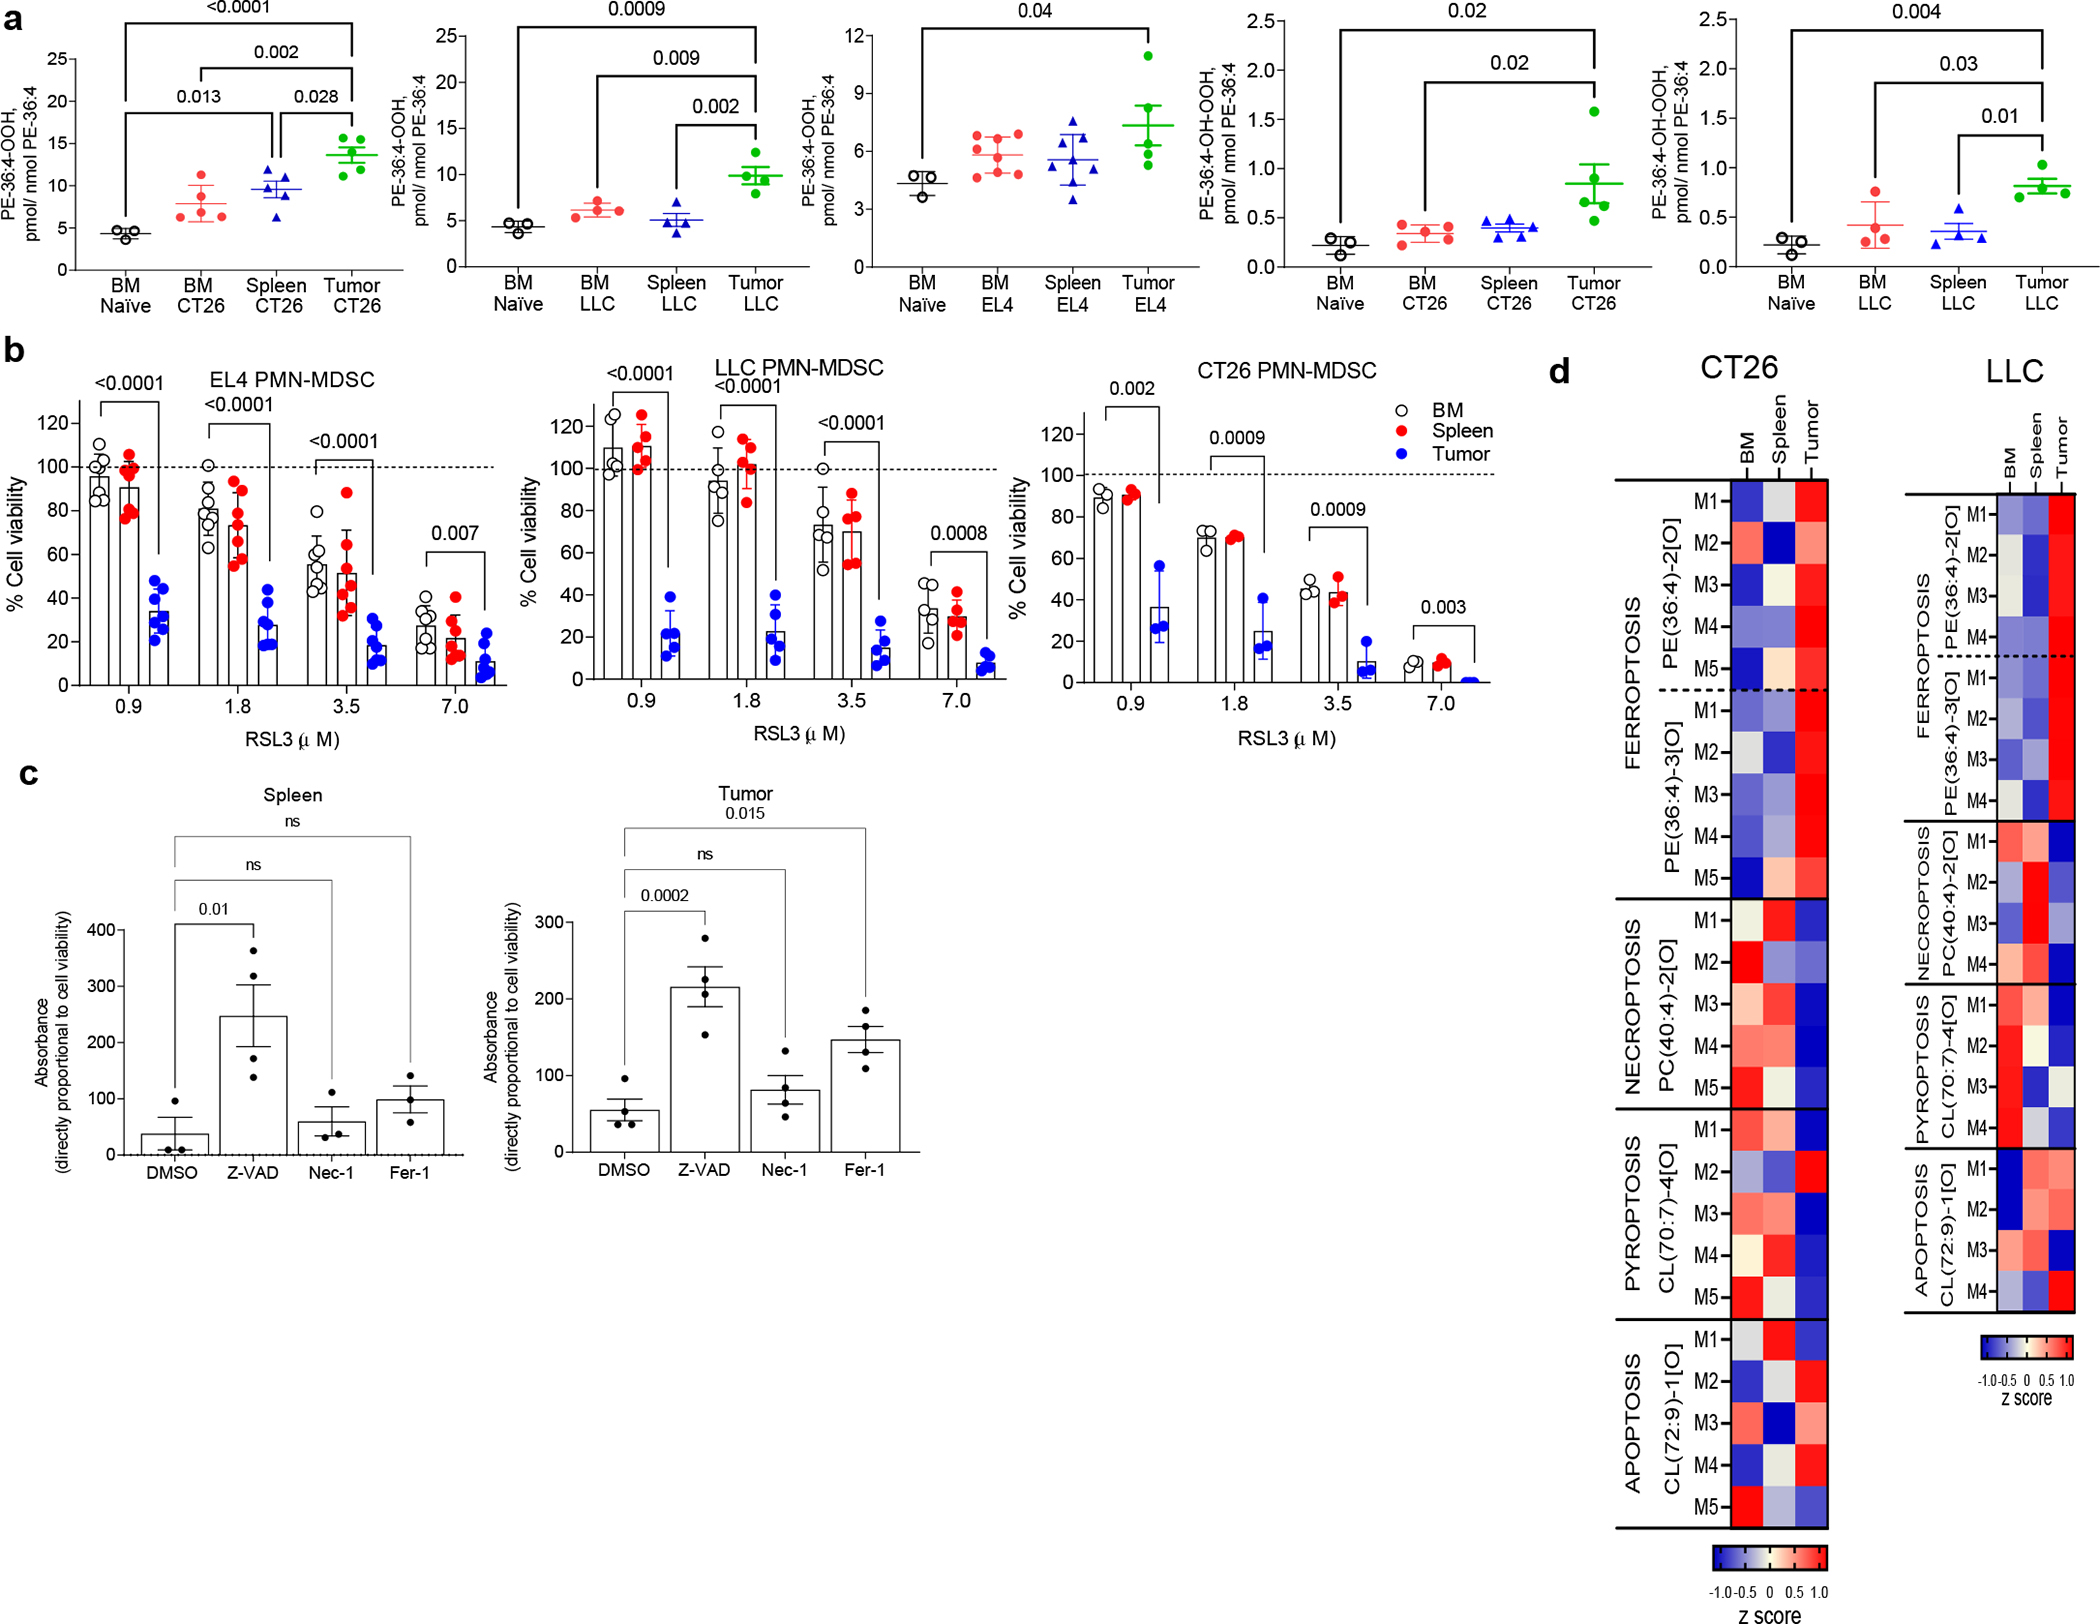
a. PE containing oxidized AA in PMN from naïve, and PMN-MDSC from bone marrow (BM) and spleen of indicated TB mice (for PE-36:4-OOH: n=3 BM naïve; n=5 CT26; n=4 LLC; n=8 EL-4 BM and spleen; n=5 EL4 tumor; for PE-36:4-OH-OOH n= 3 BM naïve; n=5 CT26; n=4 LLC). In all figures, each data point represents a biological replicate. b. PMN-MDSC collected from BM, spleenss, or tumors were incubated with RSL3 for 16 hr. Cell viability was assessed with alamarBlue Cell Viability Assay and expressed as a percent of untreated cells viability shown as a dotted line. N=7 for EL4; n=5 for LLC; n=3 for CT26. c. PMN-MDSC from the spleens and tumors of EL4 TB mice were cultured with indicated inhibitors for 24 hr: Ferrostatin-1 (Fer-1, 1 μM), Necrostatin-1 (Nec-1, 1 μM), and Z-VAD-FMK (zVad, 10 μM). Cell viability was measured using alamarBlue Cell Viability Assay. N=3 spleen, n=4 tumor. Mean ± SEM (a,c) and mean ± SD (b) are shown. P values were calculated in one-way ANOVA with Tukey’s HSD post-test. ns – not significant. d. Changes in the contents of oxygenated phospholipids associated with ferroptosis - PE(36:4)-2[O], PE(36:4)-3[O], necroptosis - PC(40:4)-2[O], pyroptosis - CL(70:7)-4[O] and apoptosis - CL(72:9)-1[O] in PMN-MDSC isolated from BM, spleens and tumors of CT26 and LLC bearing mice. Heat maps auto-scaled to z scores and coded blue (low values) to red (high values) are shown. N=5 for CT26; n=4 for LLC. The data obtained from individual mice are shown.
To further characterize the type of cell death PMN-MDSC are undergoing in different tissues, we performed global redox lipidomics analysis of PMN-MDSC. We quantitated oxygenated (PE)-(PE(36:4)-2[O], PE(36:4)-3[O]), phosphatidylcholine (PC(40:4)-2[O]), cardiolipin (CL) (CL(70:7)-4[O]) and (CL(72:9)-1[O] as characteristic signals of ferroptosis, necroptosis, pyroptosis21–23 and apoptosis24, respectively. We did not find any changes in the content of lipid-based cell death signals between cells isolated from BM of naïve and TB mice. In PMN-MDSC isolated from tumors, oxygenated PE associated with activation of ferroptosis were dominant species and their content was significantly higher compared to those detected in PMN-MDSC obtained from BM and spleen (Fig. 1d). The levels of lipid-derived signals associated with necroptotic and pyroptotic cell death pathways were not elevated in tumor PMN-MDSC. The contents of the apoptotic oxygenated lipid signal in tumor PMN-MDSC were not different from those obtained from BM and spleen PMN-MDSC (Fig. 1d). These data indicate that ferroptotic cell death pathway is a predominant type of cell death program in tumor PMN-MDSC.
CD71 (transferrin receptor) is a known cellular marker of ferroptosis 25. We confirmed its up-regulation in BM PMN treated with RSL3, but not with inducers of apoptosis or necroptosis (Extended Data Fig. 3c). Tumor PMN-MDSC, but not M-MDSC, had substantially higher expression of CD71 compared to their counterparts in the spleen (Extended Data Fig. 3d). Taken together, these data indicate that, unlike BM and spleen, tumor PMN-MDSC undergo ferroptosis.
Ferroptosis regulated suppressive function of tumor PMN-MDSC
We investigated whether ferroptosis confers suppressive function to otherwise non-immune suppressive PMN. BM PMN from tumor-free mice were treated with RSL3, or apoptosis inducer staurosporine for 2 hours then extensively washed to completely remove the drugs and used in the experiments. The viability of the PMN was not changed after 2 hr incubation with RSL3 but substantially fewer RSL3 treated PMN were alive after overnight incubation, indicating that the compounds caused expected cell death (Extended Data Fig. 3e). In functional experiments, PMN were used after the initial 2 hr incubation so as to use live cells undergoing initial stages of ferroptosis. RSL3, but not staurosporine treated PMN acquired potent suppressive activity measured as decreased proliferation of Pmel CD8+ T cells, expressing T cell receptors specific for melanoma gp100 derived peptide, in the presene of cognate peptide (Fig. 2a). To determine whether the suppressive effect was mediated by cells or soluble factors, we used supernatants from arachidonate 12/15-lipoxygenase (Alox12/15) deficient PMN isolated from (Alox12/15fl S100A8-cre) (Cre+) mice with targeted deletion in PMN and MON (Extended Data Fig. 3f). ALOX12/15 is one of the major components of ferroptosis induction. BM PMN were treated with RSL3 for 4 hr, washed extensively, and then incubated for an additional 16 hr in culture media alone. We confirmed that deletion of Alox12/15 abrogated RSL3 induced decrease in the number of PMN-MDSC in culture (Extended Data Fig. 3g). Supernatants from RSL3 treated PMN had potent suppressive activity on Pmel splenocytes. This activity was abrogated in PMN with Alox12/15 deletion (Fig. 2b). To verify the role of ferroptosis in PMN mediated T-cell suppression, we used a different ferroptosis inducer IKE, and pharmacological inhibitor of ferroptosis liproxstatin-1. BM PMN were treated with IKE for 6 hr in the presence or absence of liproxstatin-1, extensively washed, and cultured for an additional 16 hr. Supernatants were added to Pmel splenocytes stimulated with the cognate peptide. At 40 μM, IKE caused a modest effect on PMN viability (Extended Data Fig. 3h), but still suppressed T-cell proliferation. This effect was abrogated by liproxstatin-1 (Fig. 2c). At a higher concentration (50μM), IKE reduced the number of PMN (Extended Data Fig. 3i), which was reversed by liproxstatin-1. Apoptosis inhibitor Z-VAD slightly reduced the effect of IKE on survival of PMN suggesting that IKE treatment may also promote apoptosis. IKE caused strong induction of suppressive activity by PMN, which was not affected by zVAD, but substantially, albeit not completely, reversed by liproxstatin-1 (Fig. 2d). Next, we isolated PMN-MDSC from tumors of EL-4 TB mice and treated the cells with inhibitors of apoptosis, ferroptosis, and necroptosis. Antigen-specific T cells proliferation was tested in the presence of these PMN-MDSC. DMSO treated control PMN-MDSC displayed strong suppressive activity unaffected by inhibition of apoptosis or necroptosis, but abrogated by liproxstatin-1 (Fig. 2e).
Figure 2. Ferroptosis confers immunosuppressive activity to PMN.
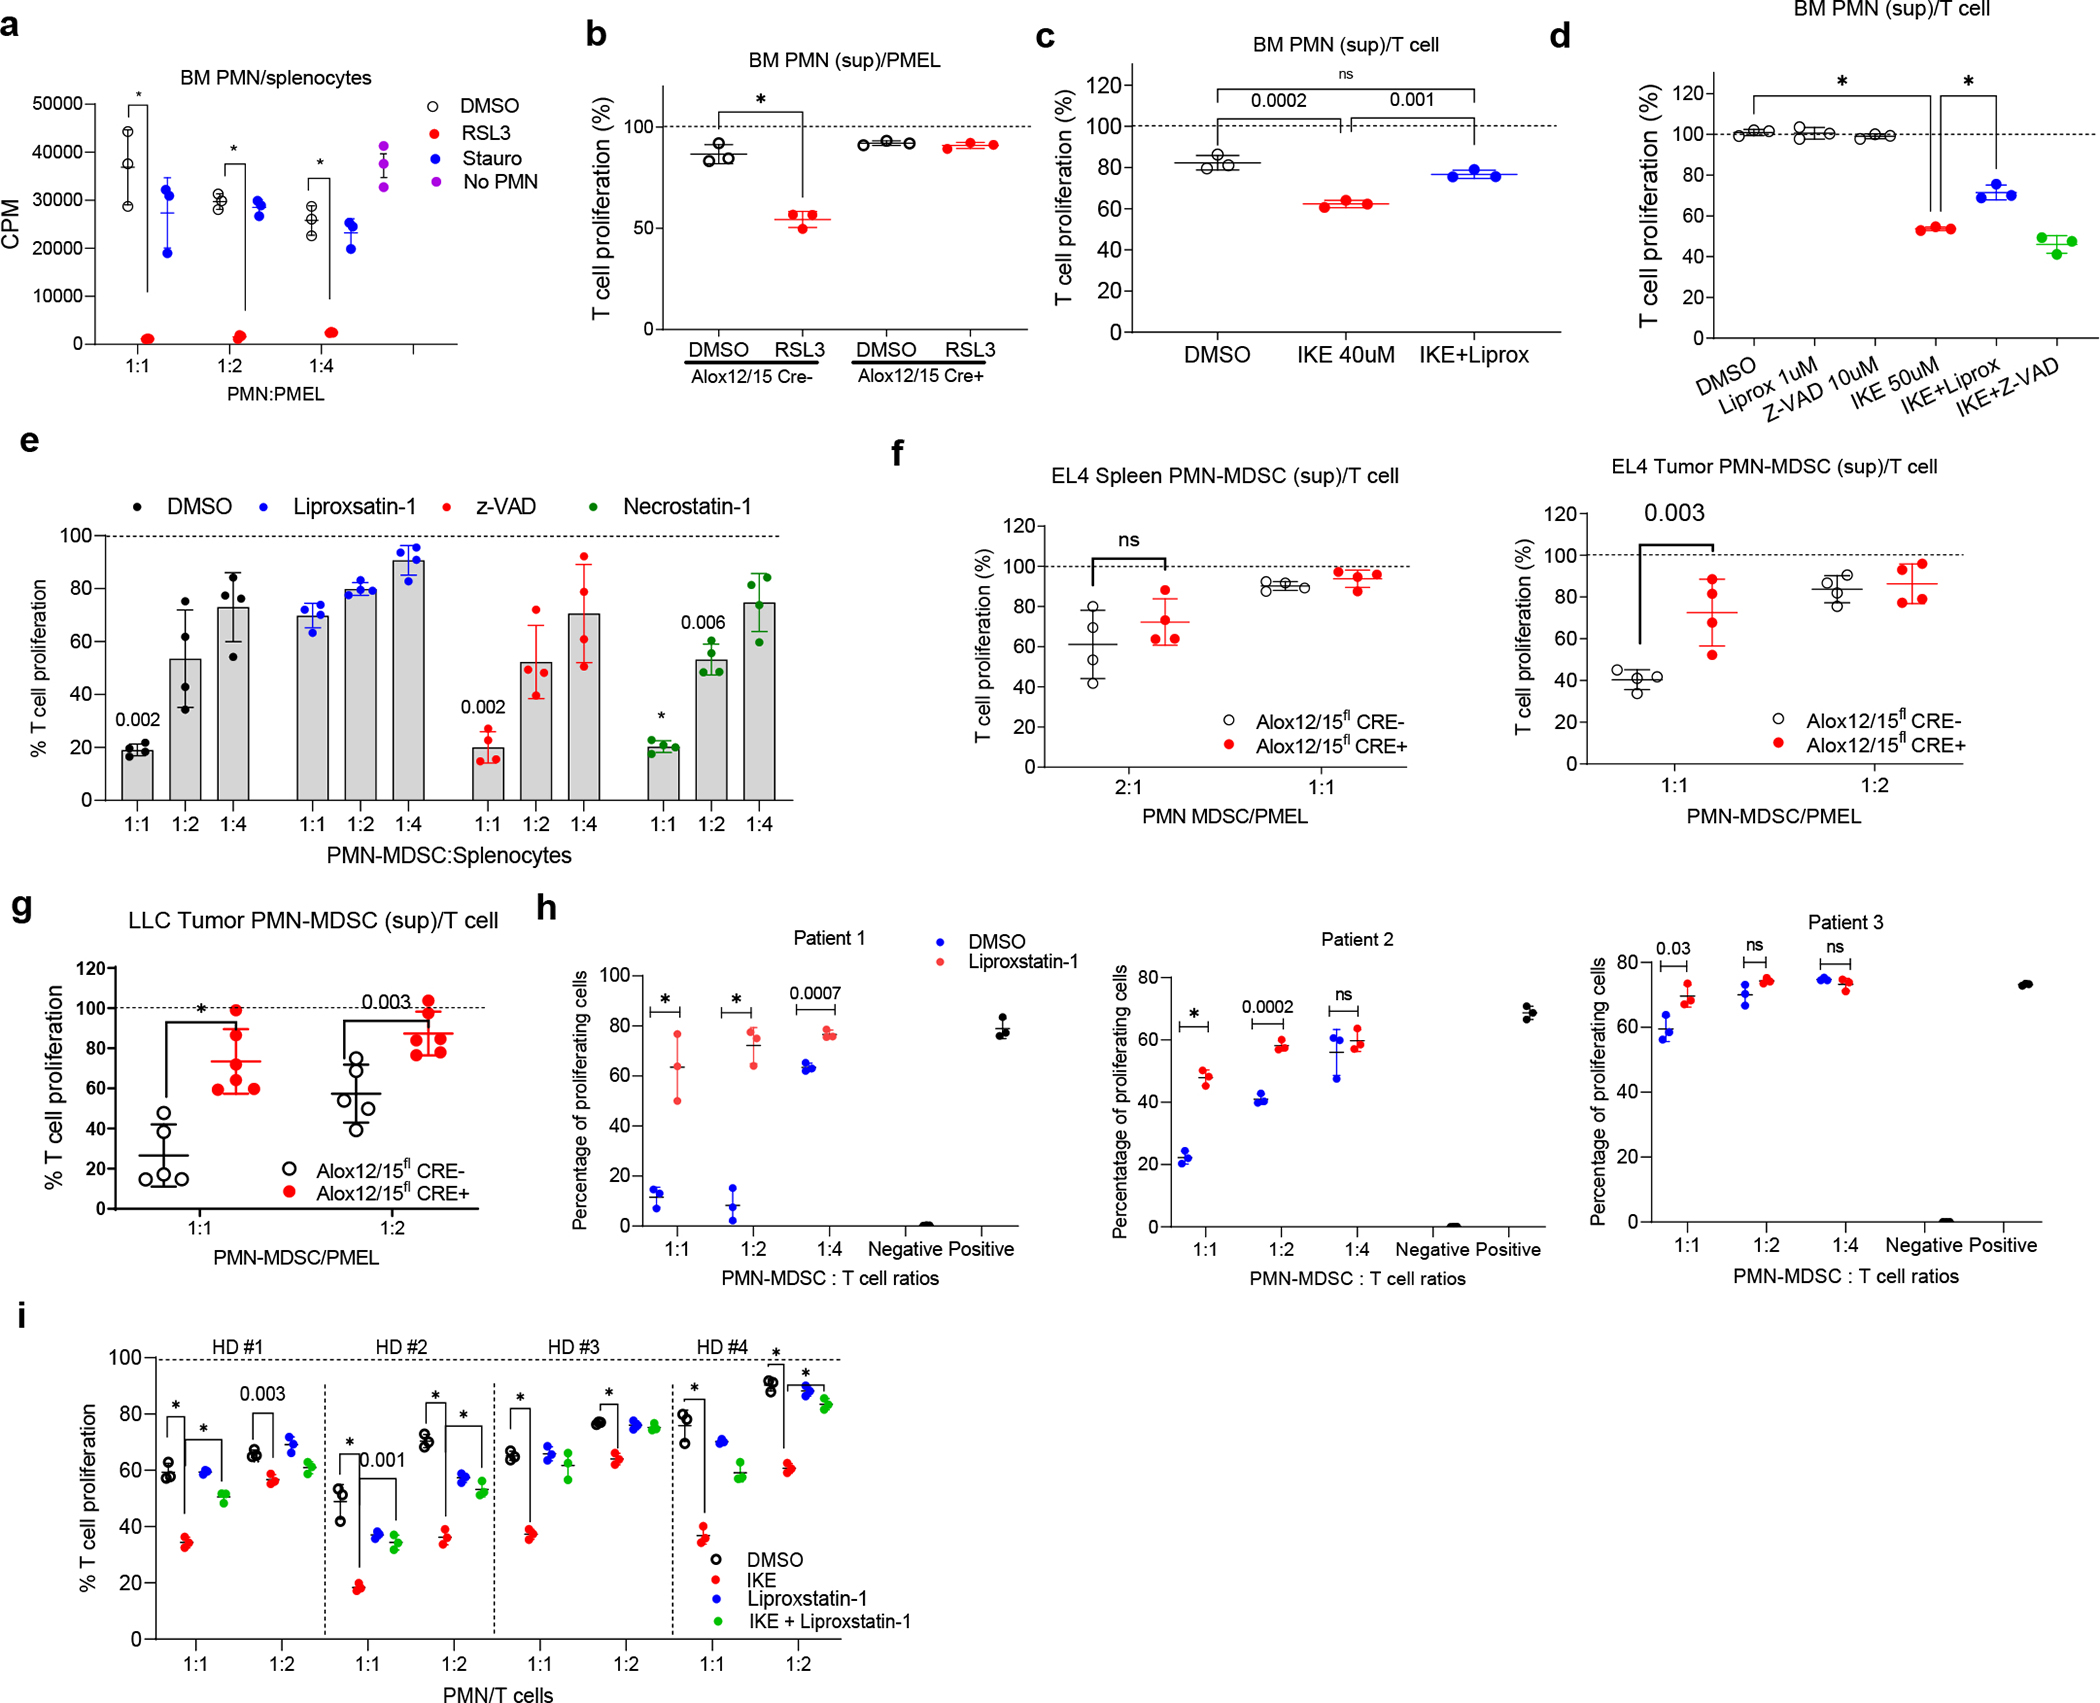
a. Suppression of Pmel splenocyte proliferation stimulated with cognate peptide by BM PMN treated with DMSO, RSL3 (20 μM), or staurosporine (100 nM) (n=3). Incorporation of [3H]thymidine: CPM - counts per min. Representative experiment of two is shown. b. Suppression of T cell proliferation by supernatant (sup) generated from BM PMN isolated from ALox12/15flCre− and ALox12/15flCre+ mice and treated with DMSO or 20 μM RSL3 for 4 hr (n=3). Dotted line - T cell proliferation stimulated with cognate peptide in the absence of supernatant. Representative experiment of three is shown. c. Suppression of T cell proliferation by supernatants generated from BM PMN from WT mice treated as shown on the graph (n=3). Representative experiment of three shown. d. Suppression of T cell proliferation by supernatant generated from BM PMN from WT mice and treated with indicated inhibitors or IKE (n=3). Representative experiment of four is shown. e. PMN-MDSC from EL4 TB mice (n=4), pre-incubated with inhibitors, and cocultured with Pmel splenocytes in the presence of cognate peptide. Dotted line - T cell proliferation in the absence of PMN-MDSC. f. Suppression of T cell proliferation by supernatants of PMN-MDSC from Alox12/15flCre− or Alox12/15flCre+ EL4-TB mice (n=4). g. Suppression of T cell proliferation by supernatants of PMN-MDSC from LLC Alox12/15flCre− and Alox12/15flCre+ TB mice (n=6). Dotted line - T cells proliferation in the absence of supernatants. h. PMN-MDSC isolated from tumors of cancer patients were cocultured with T cells in triplicates in the plates with immobilized CD3/CD28 antibodies in the presence of DMSO or Liproxstatin-1 (1 μM). Negative – no CD3/CD28 antibody. Positive – CD3/CD28 antibodies but no PMN-MDSC. i. Suppression of T cell proliferation by blood PMN isolated from healthy donors and treated with indicated compounds (n=3). The dotted line indicates T cell proliferation in the absence of PMN. In all panels, Mean ± SD are shown. One-way ANOVA with Tukey’s HSD post-test (c, d, e, i) or unpaired two-sided Student’s t-test (a, b, f, g, h) were performed. * p<0.0001.
We asked whether conditions in TME could result in ferroptosis mediated suppression by PMN-MDSC. BM PMN were exposed to tumor explant supernatants and hypoxia (0.3% O2). Hypoxia induced suppressive activity in PMN, which was abrogated by ferroptosis inhibition. In normoxia, BM PMN were not suppressive and no effect of liproxstatin-1 was observed (Extended Data Fig. 3j).
To test the contribution of ferroptosis to PMN-MDSC suppressive function in vivo, EL-4 tumors were established subcutaneously (s.c.) in Alox12/15flCre− and Alox12/15flCre+ mice. Supernatant from tumor, but not spleen, PMN-MDSC of Alox12/15flCre+mice had markedly reduced suppressive activity (Fig. 2f). Similar results were seen in LLC TB mice (Fig. 2g). No differences in the suppressive activity of supernatants from tumor M-MDSC were observed (Extended Data Fig. 3k). To further confirm these findings, we used mice with targeted deletion of pro-ferroptotic protein ACSL4 (Acsl4flS100A8Cre+) (Extended Data Fig. 3l). Deletion of the Acsl4 substantially reduced suppressive activity of supernatant from tumor PMN-MDSC but did not affect that of spleen PMN-MDSC in EL4 TB mice (Extended Data Fig. 3m). These results indicate that ferroptosis plays an important role in the immune-suppressive activity of the tumor, but not the spleen PMN-MDSC.
To validate the role of ferroptosis in PMN-MDSC mediated suppression in cancer patients, we isolated PMN-MDSC from tumor tissues of patients with HNC and uterus cancers and tested their suppressive activity against CD3/CD28 activated T cells in the presence of liproxstatin-1. PMN-MDSC suppressive activity was markedly reduced after the treatment with lirpoxstatin-1 (Fig. 2h). Further, we assessed the effect of ferroptosis induction on human PMN, isolated from the peripheral blood of healthy donors. CD3/CD28 induced T-cell proliferation was potently suppressed by IKE-treated PMN; this effect was abrogated by liproxstatin-1 (Fig. 2i). Thus, ferroptosis-mediated conversion of PMN to PMN-MDSC was also observed in human cells.
Mechanisms of ferroptosis induction in tumor PMN-MDSC
To evaluate changes in PMN during induction of ferroptosis, we performed whole transcriptome RNA sequencing of BM PMN treated for 4 hr with RSL3 or staurosporine. Ferroptosis induction by RSL3 was confirmed by up-regulation of the expression of ferroptosis-associated genes (Extended Data Fig. 4a). RSL3 treated PMN had a distinct transcriptional profile characterized by upregulation of multiple genes involved in oxidative stress, ubiquitination, and various heat shock proteins (Extended Data Fig. 4b,c). There were no changes in the expression of Arg1 and Nos2, genes typically associated with PMN-MDSC mediated suppression but treatment of PMN with RSL3 caused marked up-regulation of genes involved in the biosynthesis of prostaglandin E2 (PGE2) (Extended Data Fig. 4d). This was consistent with an increase in the production of PGE2 (Extended Data Fig. 4e).
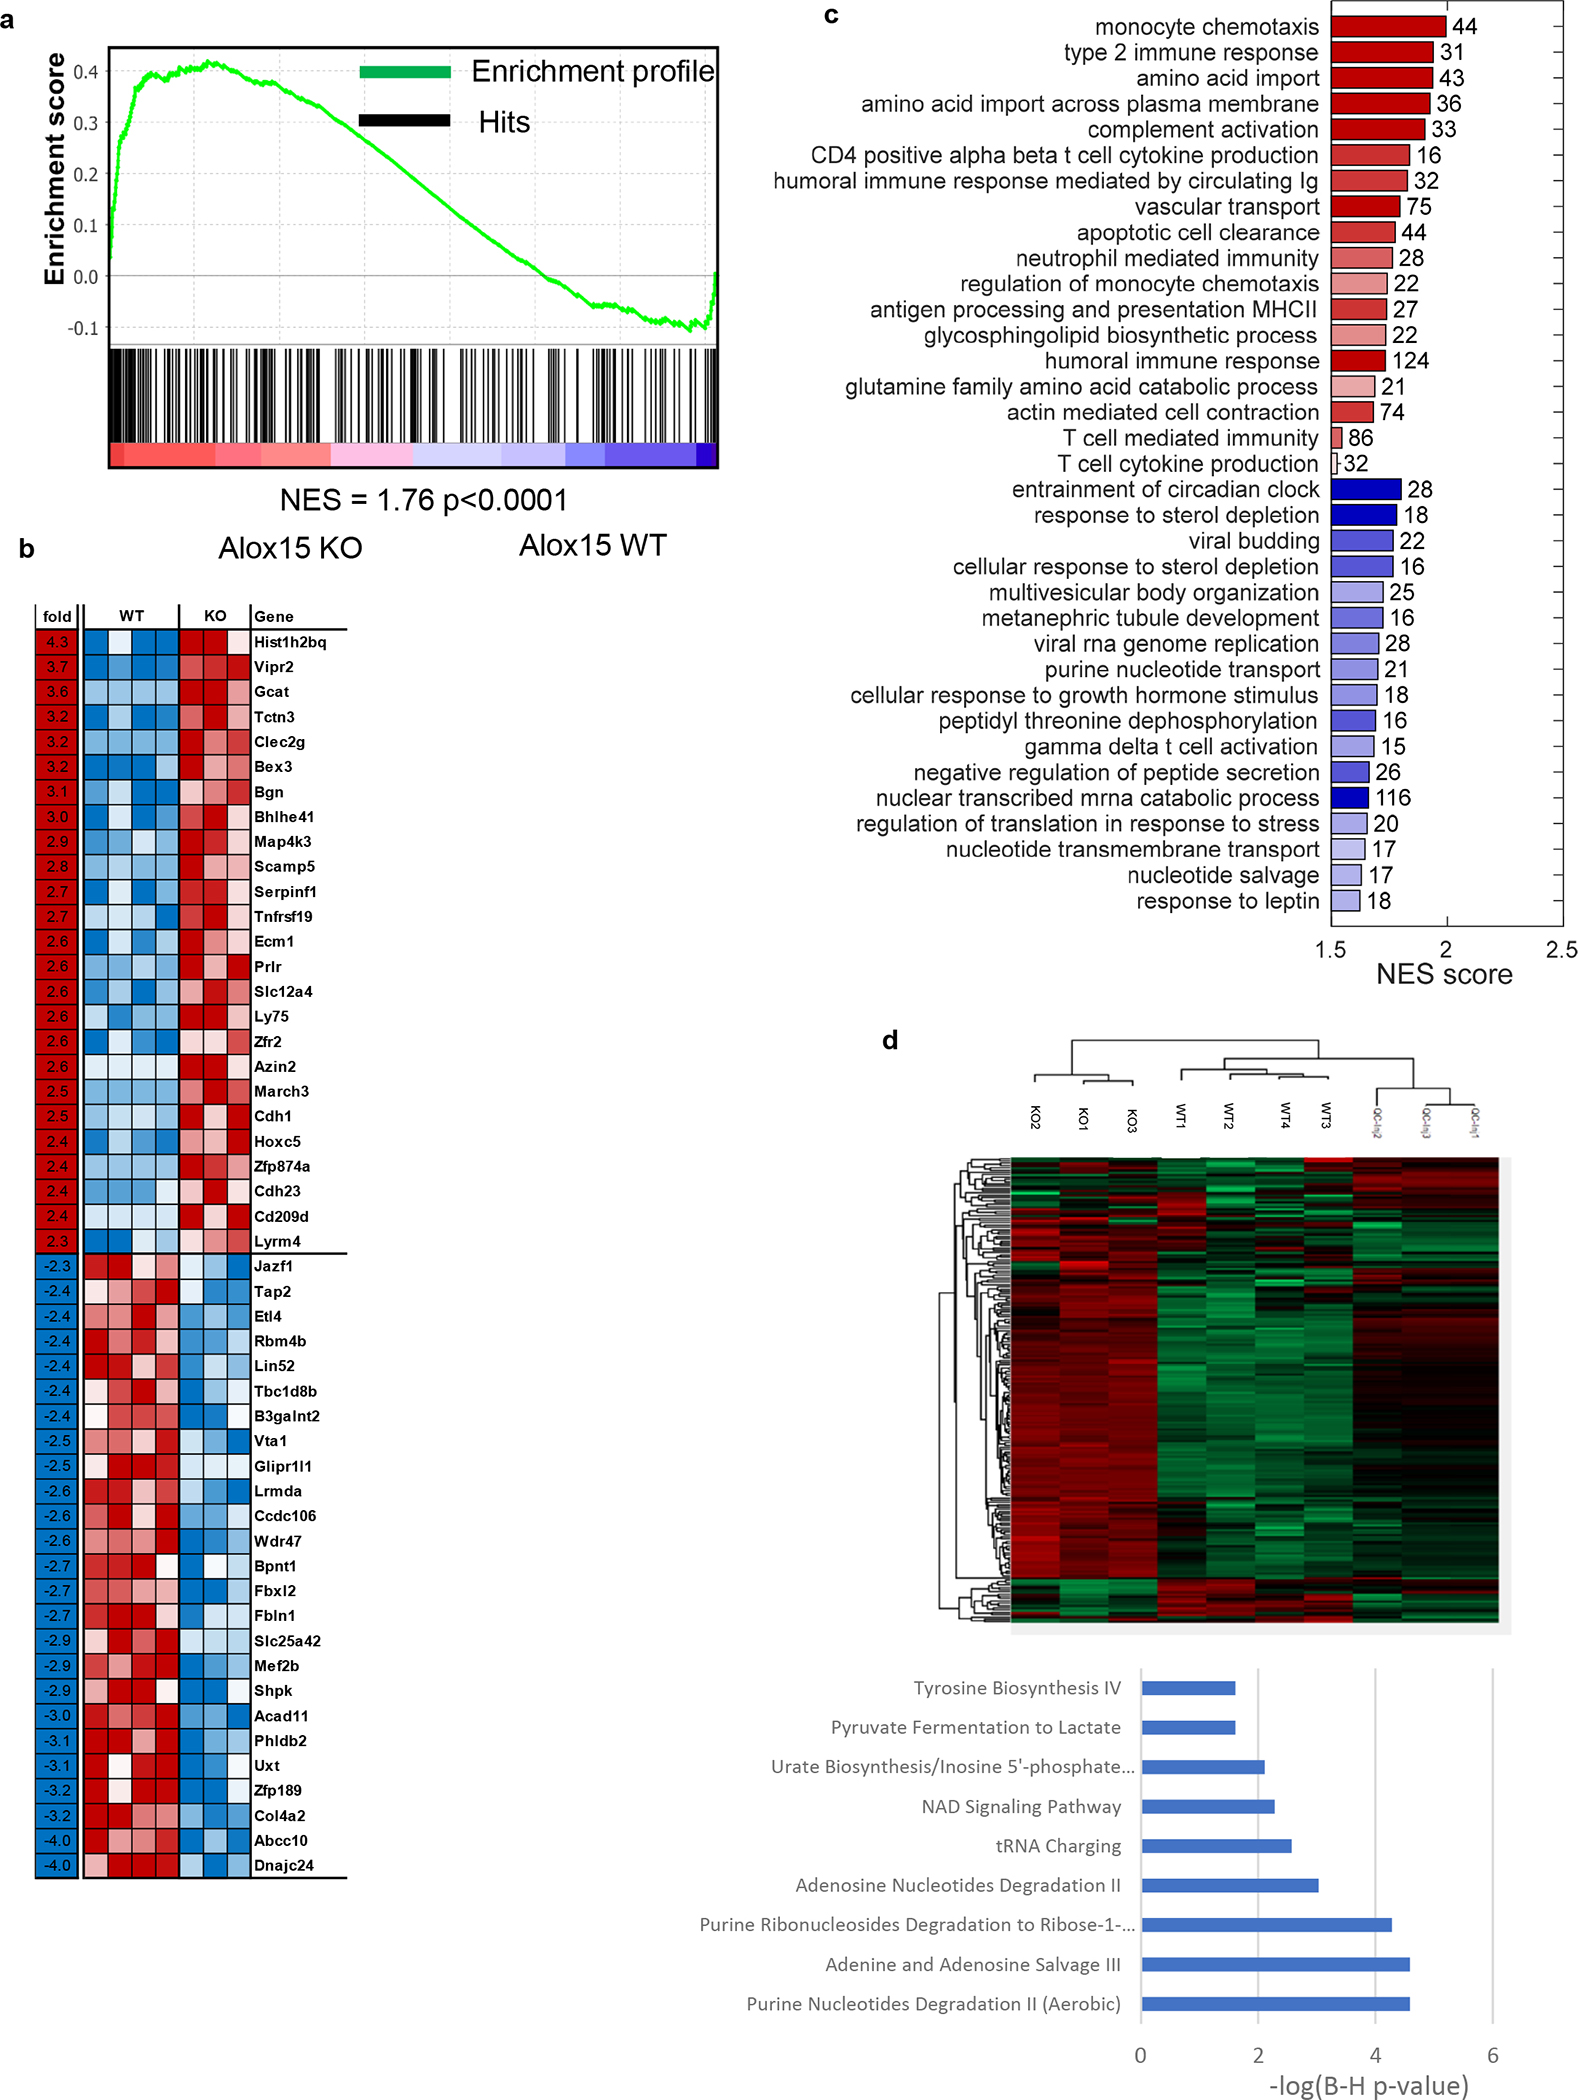
To assess the effect of ALOX12/15 deletion on gene expression profile of tumor PMN-MDSC we performed RNAseq of PMN-MDSC isolated from tumors of Alox12/15flCre− and Alox12/15flCre+ mice and used previously described PMN-MDSC signature9. GSEA analysis identified that genes specifically inhibited in PMN-MDSC (193 genes, FDR<5%, at least 5-fold) were reversed upon Alox12/15 knockout (Extended Data Fig. 5a). Gene set enrichment analysis revealed that deletion of Alox12/15 in PMN-MDSC resulted in up-regulation of genes associated with complement activation, neutrophil mediated immunity, monocyte chemotaxis, antigen processing and presentation (Extended Data Fig. 5b,c). Thus, blockade of ferroptosis in PMN-MDSC caused up-regulation of genes associated with classical activation of PMN suggesting shift in polarization of these cells from pathologically activated PMN-MDSC to classical PMN.
We also assessed the metabolome of tumor PMN-MDSC from wild-type and Alox12/15flCre+mice. 167 metabolites were significantly (q-value < 0.05) up-regulated in ferroptosis deficient PMN-MDSC compared to the control. Ingenuity Pathway Analysis (IPA) performed on differentially expressed metabolites showed up-regulation in purine nucleotides degradation pathways, including adenine and adenosine degradation, as well as NAD signaling pathway (Extended Data Fig. 5d). These results may indicate that blocking of ferroptosis in PMN-MDSC is associated with the up-regulation of pathway involved in protein synthesis and signaling.
PGE2 is directly implicated in PMN-MDSC suppressive activity 9,26. We evaluated the PGE2 production by tumor PMN-MDSC with the defect in ferroptosis (Alox12/15flCre+ or Acsl4flCre+ mice). In both models, the loss of major pro-ferroptotic genes resulted in a substantial decrease of PGE2 released by tumor PMN-MDSC (Fig. 3a). BM PMN were treated with RSL3 or IKE in the presence or absence of inhibitors of PGE2 synthetic enzymes cyclooxygenase (COX)-1 and COX-2. Alternatively, blockers of PGE2 receptors EP2 and EP4 were added to the PMN-splenocyte co-culture, to prevent PGE2 signaling in splenocytes. COX inhibitors did not change PMN counts (Fig 3b) but substantially reduced ferroptosis-induced T cell suppression. Niether COXi nor EP2/EP4 blockers completely abrogated the suppressive effect of ferroptosis induction (Fig. 3c, d) suggesting that multiple pathways may be involved in the regulation of PMN-MDSC ferroptosis-mediated suppression.
Figure 3. Mechanisms of ferroptosis induction in tumor PMN-MDSC.
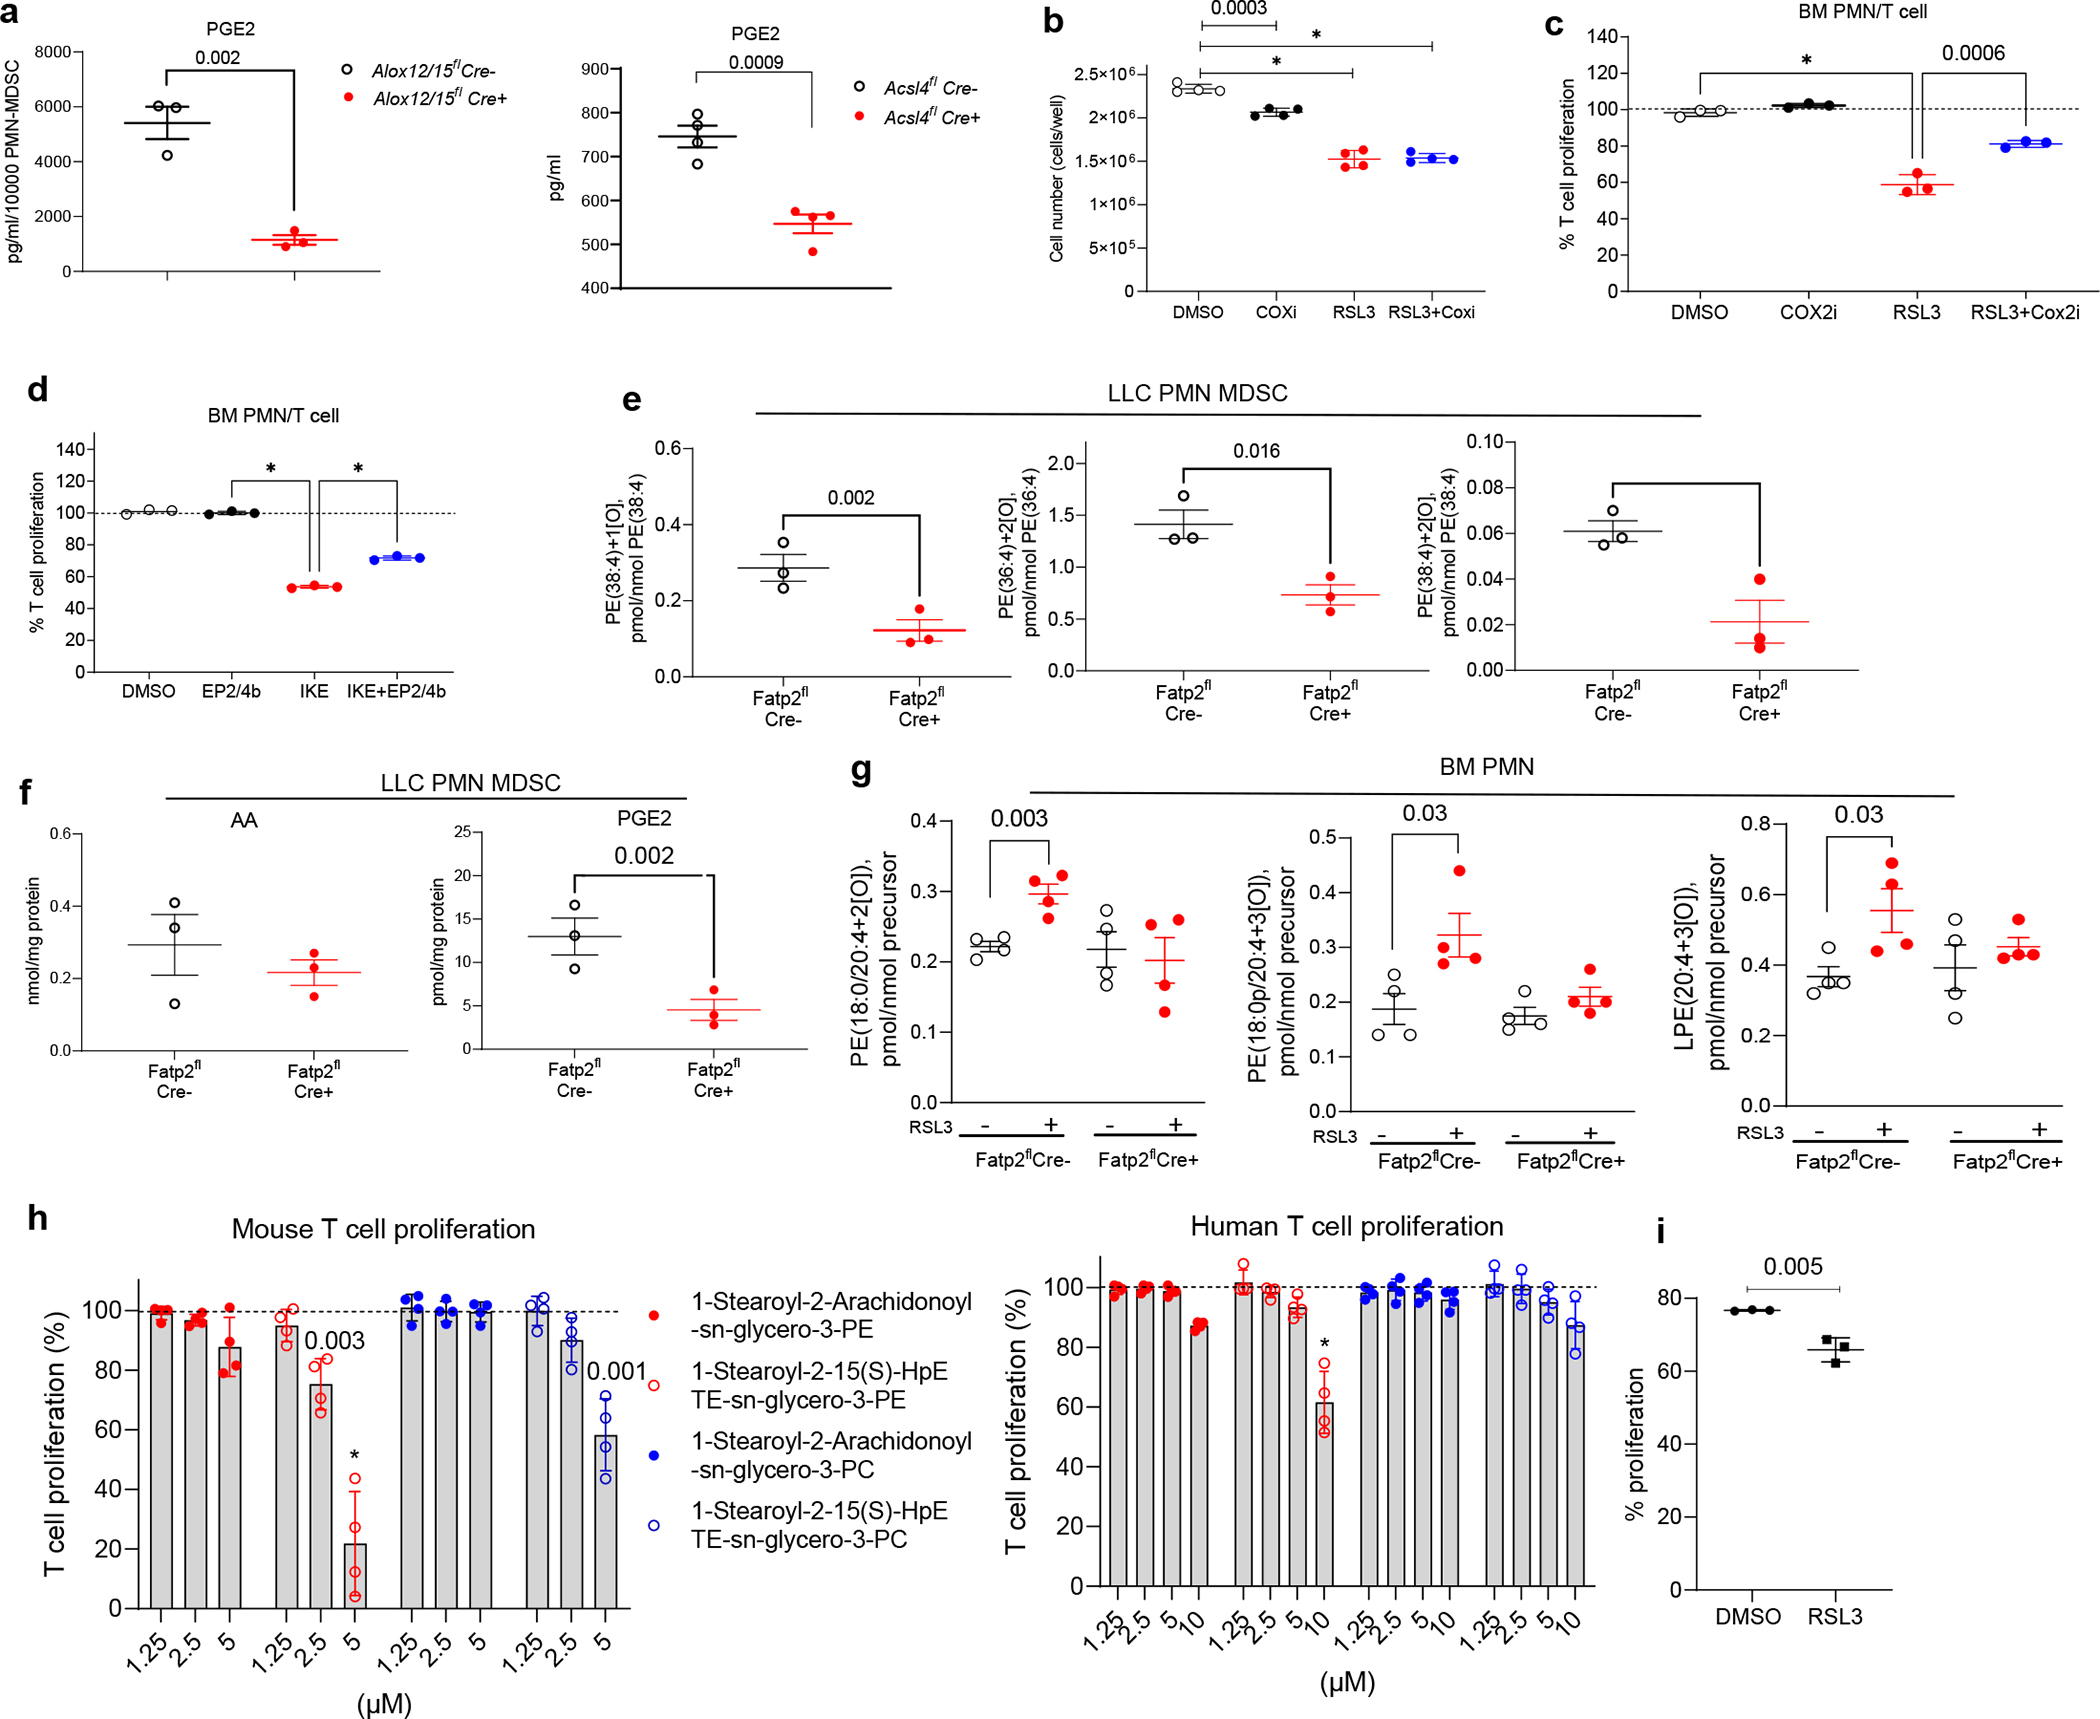
a. PGE2 in the supernatants of LLC tumor PMN-MDSC of Alox12/15flCre− and Alox12/15flCre+ mice and EL4 tumors of Acsl4flCre− and Acsl4flCre+ mice, after 48 hr incubation (n=3). b. BM PMN were treated with 20 nM of ketorolac and rofecoxib (COXi) for 1hr and then with 20 μM RSL3 for 4 hr (n=4), washed and viable cells were counted after 16 hr. c. Suppression of T cell proliferation by supernatants generated from BM PMN and treated as indicated on the graph for 4 hr (n=3). Representative experiment of three is shown. d. Suppression of T cell proliferation by supernatants generated from DMSO or 40 μM IKE treated BM PMN (for 6 hr). Cognate peptide stimulated Pmel splenocytes were incubated with supernatants for 48 hr with or without EP2 and EP4 blockers (100 nM ONO-AE3–208 and 100 nM PF-04418948, EP2/4b). T cell proliferation in the absence of PMN (100%) indicated by the dotted line. n=3. e,f. Contents of PEox molecular species (e) and free AA and PGE2 (f) assessed by LC/MS in PMN-MDSC isolated from LLC tumors of Fatp2flCre− and Fatp2flCre+ mice (n=3). g. Contents of indicated oxygenated PE assessed by LC/MS in PMN obtained from BM of Fatp2flCre− and Fatp2flCre+ mice with and without 20 μM RSL3 treatment (n=4). h. Left – Proliferation of Pmel splenocytes in the presence of cognate peptide and indicated lipids (n=4). Right – proliferation of human T cells with CD3/28 Dynabeads in the presence of indicated lipids (n=4). Dotted lines indicate T cell proliferation in the absence of lipids. i. BM PMNs were treated with DMSO or 20 μM RSL3 for 6 hr, lipids were extracted, resuspended in ethanol at 10 μM, and used for the treatment of Pmel splenocytes stimulated with cognate peptide (n=3). Mean ± SD are shown. Unpaired two-sided Student’s t-test performed in panels a, e, f, g, i, and one-way ANOVA with Tukey’s HSD post-test performed on panels b, c, d, h. * p<0.0001.
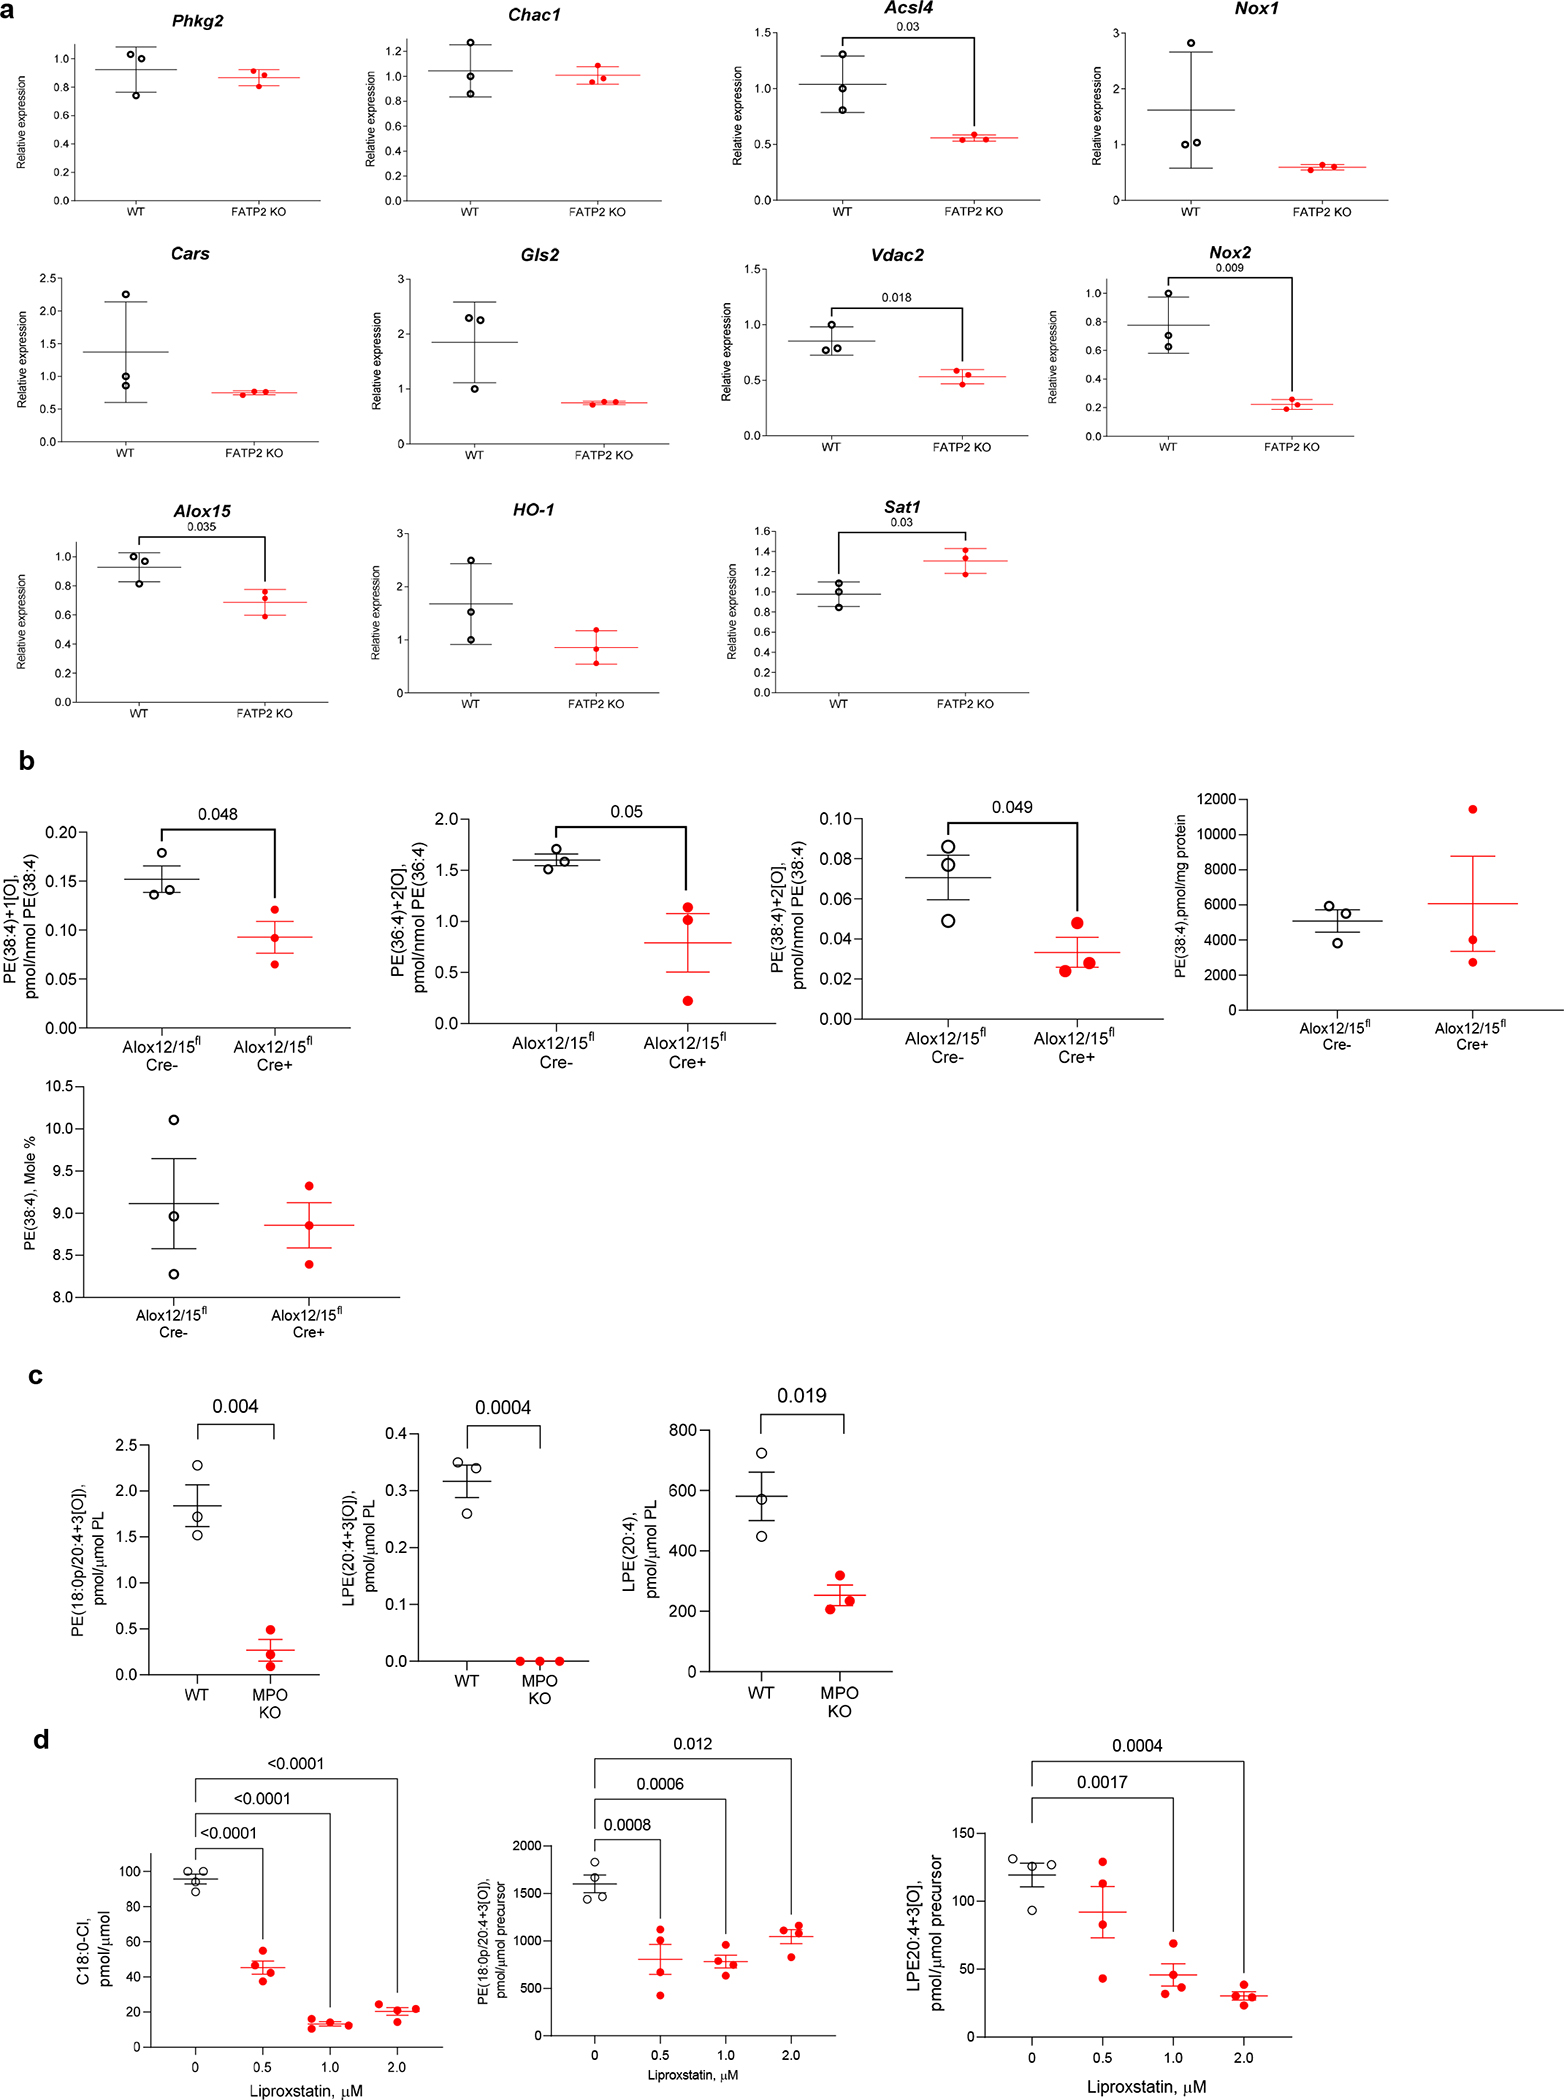
Accumulation of AA-PEox is a hallmark of ferroptosis. We previously demonstrated selective up-regulation of fatty acid transport protein FATP2 in PMN-MDSC and implicated this transporter in the increased intake of AA by PMN during their differentiation from the progenitors 27. To test whether FATP2 is involved in the induction of ferroptosis in tumor PMN-MDSC, we used a mouse model with targeted FATP2 deletion in PMN and MON (Fatp2flCre+). The expression of ferroptosis-related genes as well as levels of oxidized AA-PEox were significantly decreased in FATP2 deficient PMN-MDSC (Extended Data Fig. 6a and Fig. 3e, respectively). The effect was similar to that observed in ALox12/15fl Cre+ PMN-MDSC (Extended Data Fig. 6b) highlighting the involvement of FATP2 in the regulation of ferroptosis in PMN-MDSC. The amount of free AA was not changed, but PGE2 was substantially reduced in PMN-MDSC from Fatp2flCre+mice (Fig. 3f). We assessed whether FATP2 can regulate the induction of ferroptosis in PMN. Various PEox (as indicators of ferroptosis) were measured in BM PMN from Fatp2flCre− and Fatp2flCre+ mice treated with RSL3. As expected, RSL3 induced accumulation of PEox in PMN. However, this effect was absent in cells lacking FATP2 (Fig. 3g). Thus, up-regulation of FATP2 may play a critical role in ferroptosis induction in PMN.
Next, we investigated the possible role of oxidized phopsholipids, major products of ferroptosis on T-cell proliferation. We used four synthetic phospholipids: non-oxidized 1-Stearoyl-2-Arachidonoyl-sn-glycero-3-PE and 1-Stearoyl-2-Arachidonoyl-sn-glycero-3-PC and their oxidized counterparts: 1-Stearoyl-2–15(S)-HpETE-sn-glycero-3-PE and 1-Stearoyl-2–15(S)-HpETE-sn-glycero-3-PC. Oxidized PE and PC caused marked inhibition of mouse T-cell proliferation at 5μM concentration; no effect of non-oxidized PE and PC was observed (Fig. 3h). Human T cells were less sensitive to oxidized lipids than mouse T cells. Oxidized PE, but not non-oxidized PE caused substantial reduction of T-cell proliferation at higher concentration (10 μM) (Fig. 3h). Lipids extracted from RSL3 treated mouse BM PMN caused significant suppression of T cell proliferation (Fig. 3i). These results indicate a direct role of ferroptosis induced oxidized lipids in T-cell suppression.
In PMN-MDSC, myeloperoxidase (MPO) has a critical role in lipid oxidation. We found that the contents of PE and lysophosphatidylethanolamine (LPE) species containing AA as well as oxygenated AA in tumor PMN-MDSC isolated from LLC WT mice were significantly higher compared to those detected in tumor PMN-MDSC from MPO KO mice (Extended Data Figure 6c). Among those, species containing PGE2 were detected. In a biochemical model system, we demonstrated that these species were formed in an MPO-driven reaction and their formation was inhibited by liproxtatin-1 (Extended Data Figure 6d). These results suggest that not only free PGE2 but also its esterified into PE and LPE forms are present in PMN-MDSC. To further support this conclusion, we isolated BM PMN and induced ferroptosis with IKE in the presence of MPO inhibitor (iMPO). iMPO abrogated suppressive activity but not cell death induced by IKE (Extended Data Figure 7a). These data support the concept that ferroptosis-mediated immune suppression is nonsynonymous with cell death and can be observed before cells succumb to ferroptotic death.
Tumor PMN-MDSC had a substantially lower amount of GPX4 compared to the spleen or BM cells (Extended Data Fig. 7b). Hypoxia recapitulated decreased amount of GPX4 protein observed in tumors indicating that hypoxia-induced down-regulation of GPX4 may support ferroptosis in tumor PMN-MDSC (Extended Data Fig. 7c).
We next investigated the possibility that ferroptosis of PMN-MDSC may affect the functional activity of other cells in TME, specifically tumor associated macrophages (TAM). We used mice with deletion of MPO, which is mostly associated with PMN but not TAM, and Alox12/15flCre+mice. MON do not display signs of ferroptosis and functionally are unaffected by RSL3 treatment (Extended Data Fig. 3). This indicates, that in both mouse models ferroptosis inhibition is restricted to PMN-MDSC. In EL-4 tumors, inhibition of ferroptosis in PMN-MDSC in both mouse models resulted in dramatic reduction of FALIS and PGE2 in TAM (Extended Data Figure 7d,e). Suppressive activity of TAM was markedly reduced in MPO KO and Alox12/15flCre+ mice (Extended Data Figure 7f). These results suggest that ferroptosis of PMN-MDSC may influence the induction of ferroptosis and suppressive activity of TAM.
Ferroptosis inhibition suppresses tumor growth and is associated with positive clinical outcome
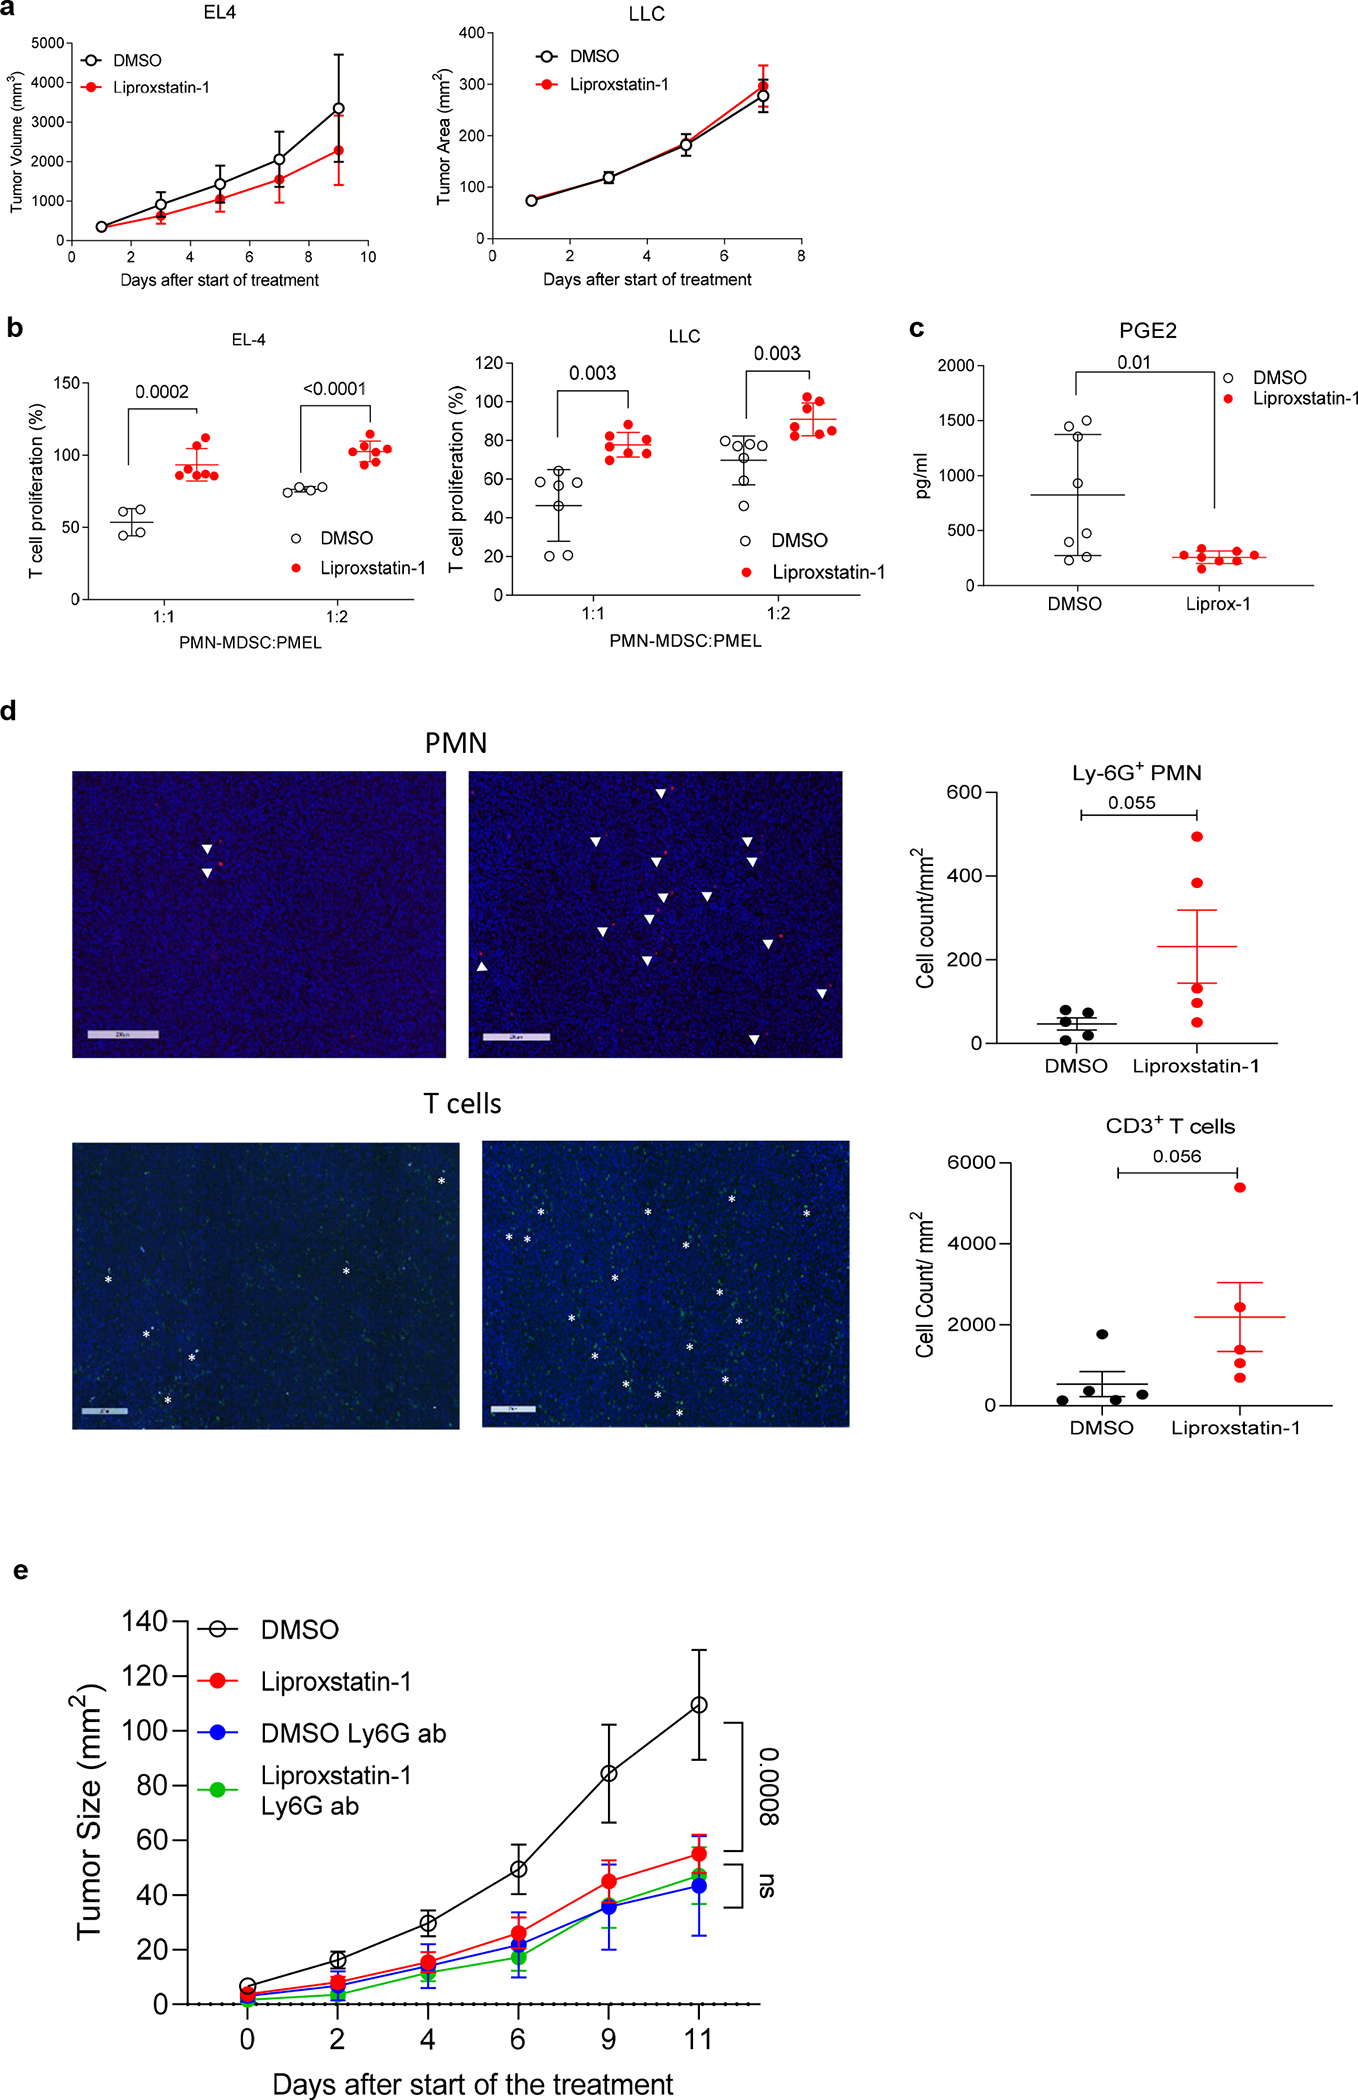
To determine the impact of pharmacological inhibition of ferroptosis on tumor growth, we used a tolerable dose of liproxstatin-1 in subcutaneously implanted EL-4 and LLC TB mice. Initially, treatment with liproxstatin-1 was started once tumors reached close to 100 mm2 and continued for 8 days. Under this condition, liproxstatin-1 did not significantly affect the growth of tumors (Extended Data Fig. 8a). However, liproxstatin-1 treatment abrogated the suppressive activity of tumor PMN-MDSC in both tumor models (Extended Data Fig. 8b). This was associated with a substantial reduction in PGE2 production by these cells (Extended Data Fig. 8c). To assess the therapeutic potential of liproxstatin-1, the treatment of mice was initiated at an earlier time, when the tumors became palpable and continued for 14 days. In both models, inhibition of ferroptosis resulted in a marked reduction in tumor growth (Fig. 4a).
Figure 4. Antitumor effect of ferroptosis inhibition.
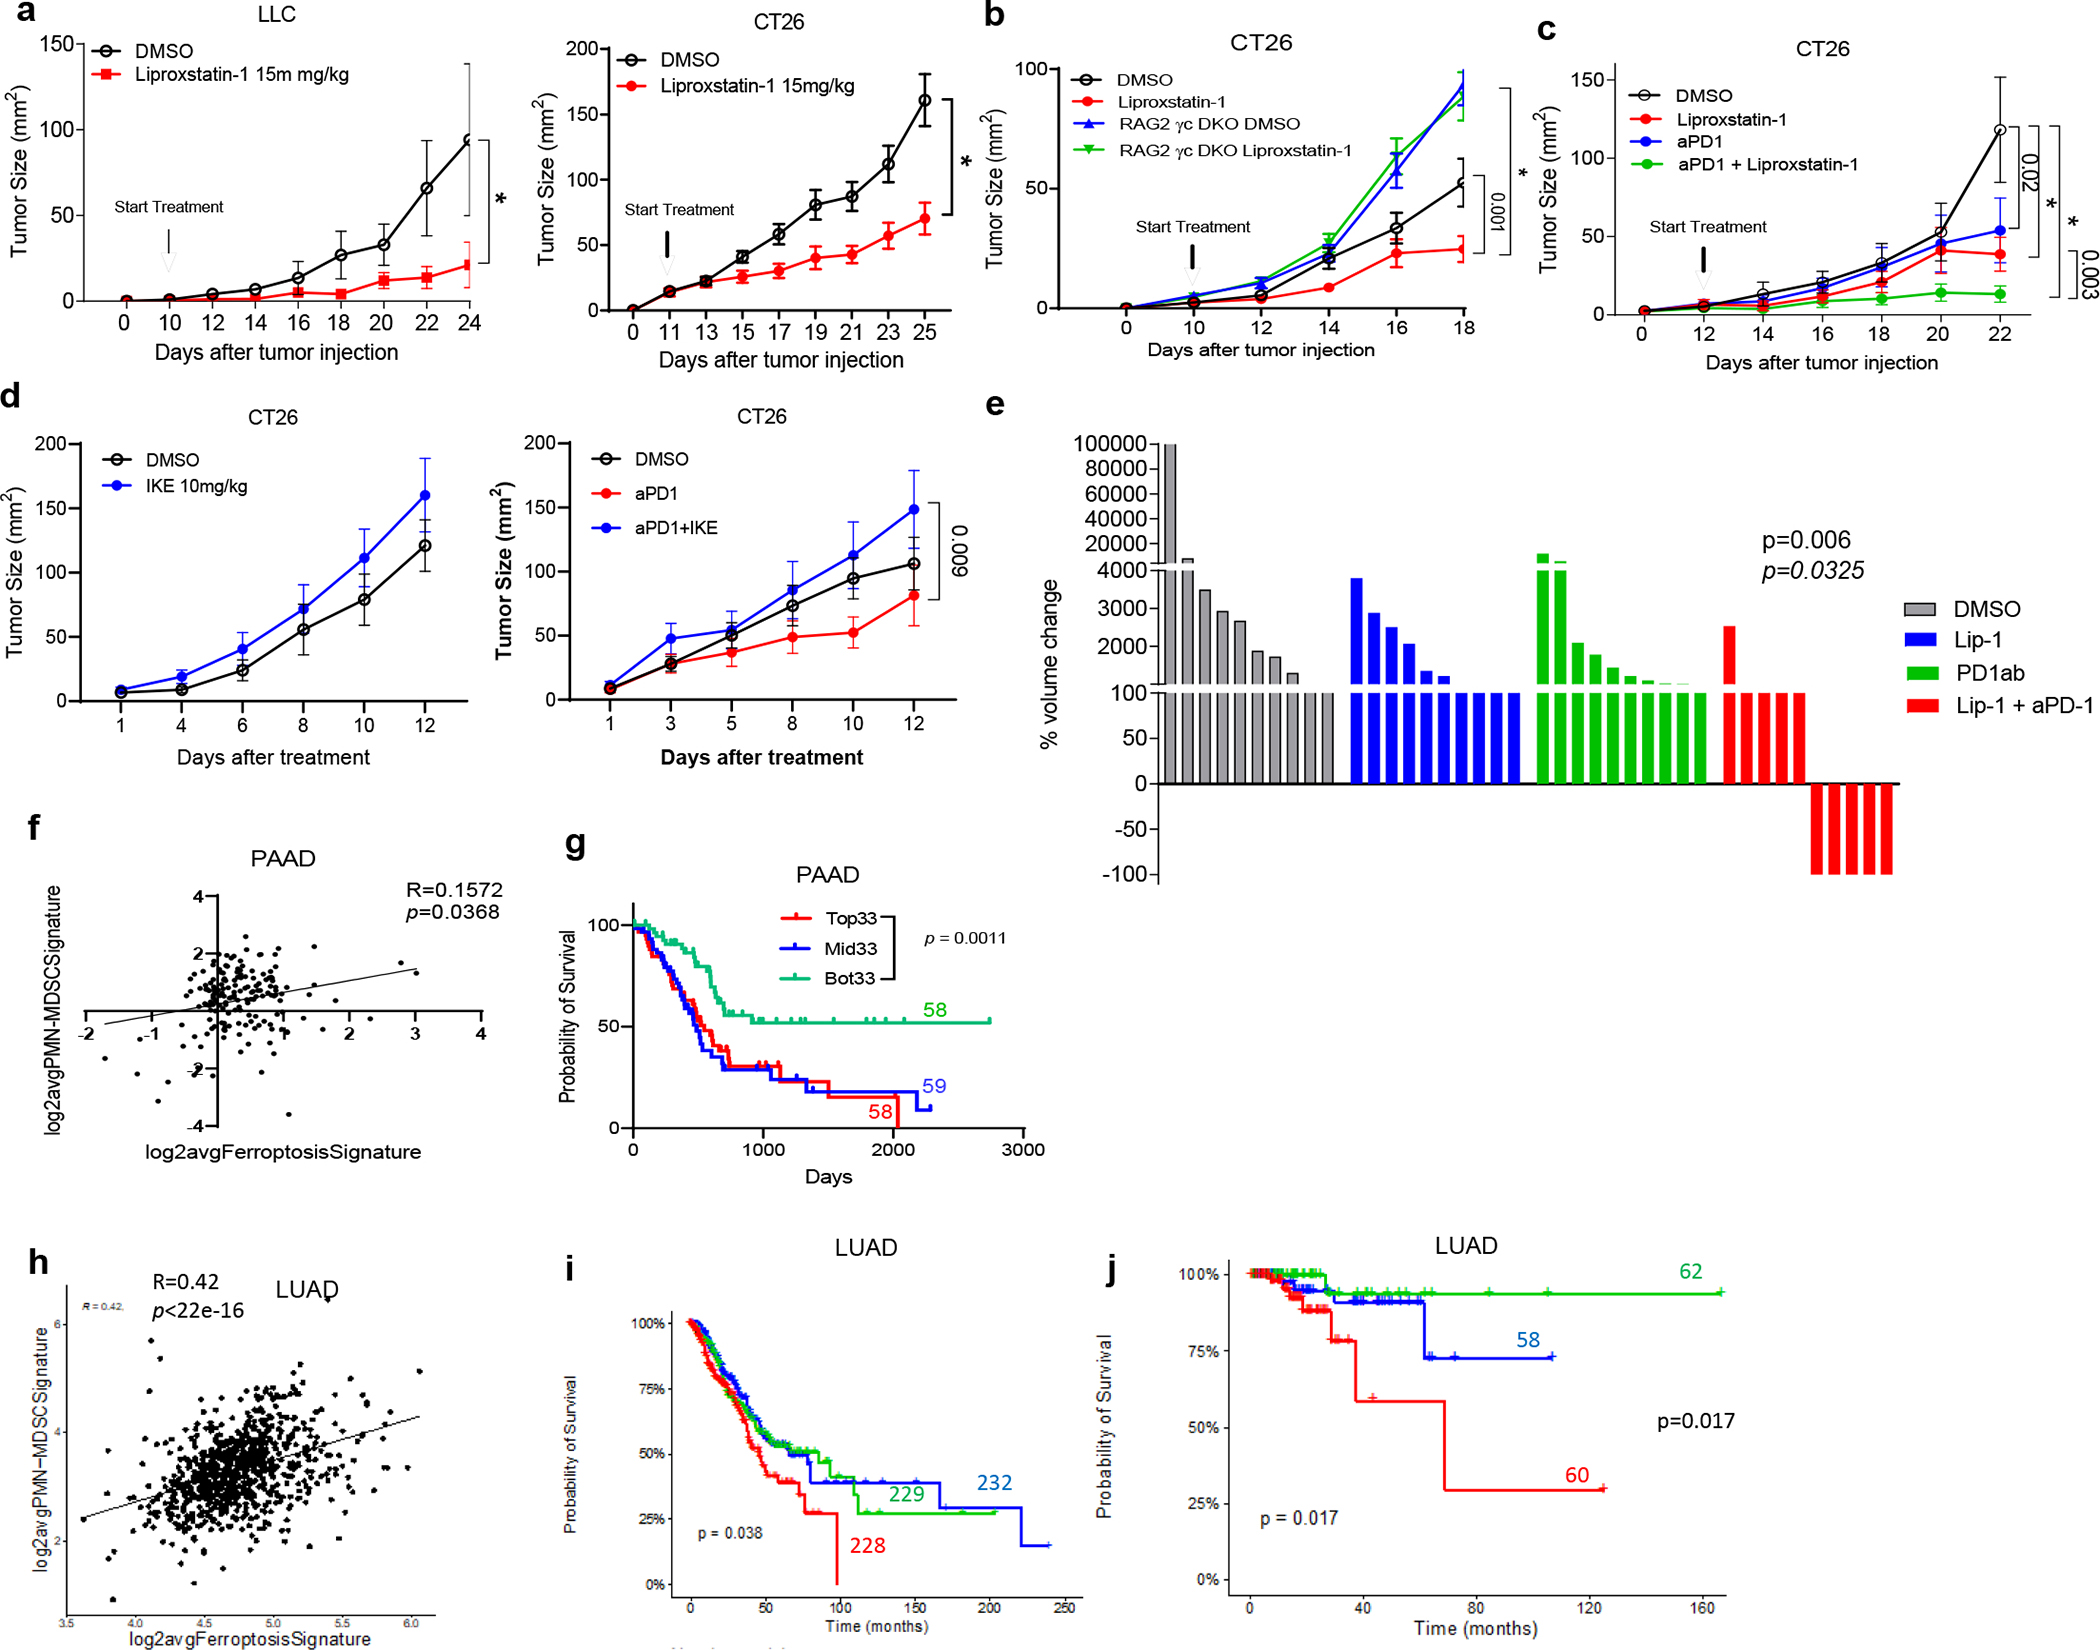
a. LLC (n=6) and CT26 (n=10) tumor growth with DMSO and 15 mg/kg liproxstatin-1 treatment. b. CT26 tumor growth in WT and RAG DKO mice with DMSO and liproxstatin-1 treatment (n=10/group). c. CT26 tumor growth in mice with indicated treatments (n=7/group). d. CT26 tumor growth in mice treated with DMSO, 10 mg/kg IKE, or anti-PD1+IKE (n=9/group). e. Subcutaneous KPC tumors growth in mice treated with DMSO, 15mg/kg liproxstatin-1, 200 μg/dose anti-PD1, or anti-PD1+liproxstatin-1 (n=10/group). Treatment started 7 days post implantation. DMSO or liproxstatin-1 group received treatment daily while PD1 group received treatment every 3 days (6 doses total). P value of proportion of mice rejected tumors calculated in Fisher exact test. P value proportion of mice with more than 200% increase in tumor volume between combination and control groups are shown. f. Correlation between ferroptosis and PMN MDSC gene signatures in pancreatic adenocarcinoma (PAAD, TCGA datasets, n=177). Spearman’s correlation coefficient was calculated. g. PAAD patient survival in thirds of ferroptosis genes expression levels based on TCGA dataset. The number of patients in each group are shown on the graph. h. Correlation between ferroptosis and PMN MDSC gene signatures in lung adenocarcinomas (LUAD, Tempus dataset, n=689). Spearman’s correlation coefficient was calculated. i. Overall survival in lung cancer patients (Tempus dataset) in top (red), mid (blue), and bottom (green) thirds of the expression level of the ferroptosis signature genes. The number of patients in each group are shown on the graph. j. Overall survival in lung cancer patients treated with immunotherapy (Tempus dataset). In panels a-d, error bars indicate SEM. Two-way ANOVA with multiple comparisons performed on panels a-d. In g, i, and j, p values were calculated between high and low thirds of gene expression using log-rank (Mantel-Cox) test. * p<0.0001.
The therapeutic effect of liproxstatin-1 was abrogated in immune deficient RAG2 γc DKO CT26 TB mice (Fig. 4b) indicating a strong immune system dependency of the treatment. A higher number of PMN-MDSC and T cells were present in liproxstatin-1 treated CT26 tumors compared to controls (Extended Data Fig. 8d). In these tumor models, liproxstatn-1 enhanced the antitumor effect of ICB with PD-1 antibody (Fig. 4c). Next, we asked if the observed antitumor effect of liproxstatin-1 is observed once PMN are depleted by using improved method of neutrophil depletion with Ly6G antibody 28. Mice were inoculated with CT26 tumor, and 10 days later were treated with Ly6G antibody, liproxstatin-1, or combination of both for additional 10 days. Treatment with Ly6G antibody or liproxstatin-1 separately reduced tumor progression. However, combination of these two compounds did not have additive effect (Extended Data Figure 8e) suggesting that PMN-MDSC may be the main mediator of liproxstatin-1 associated effect in tumors.
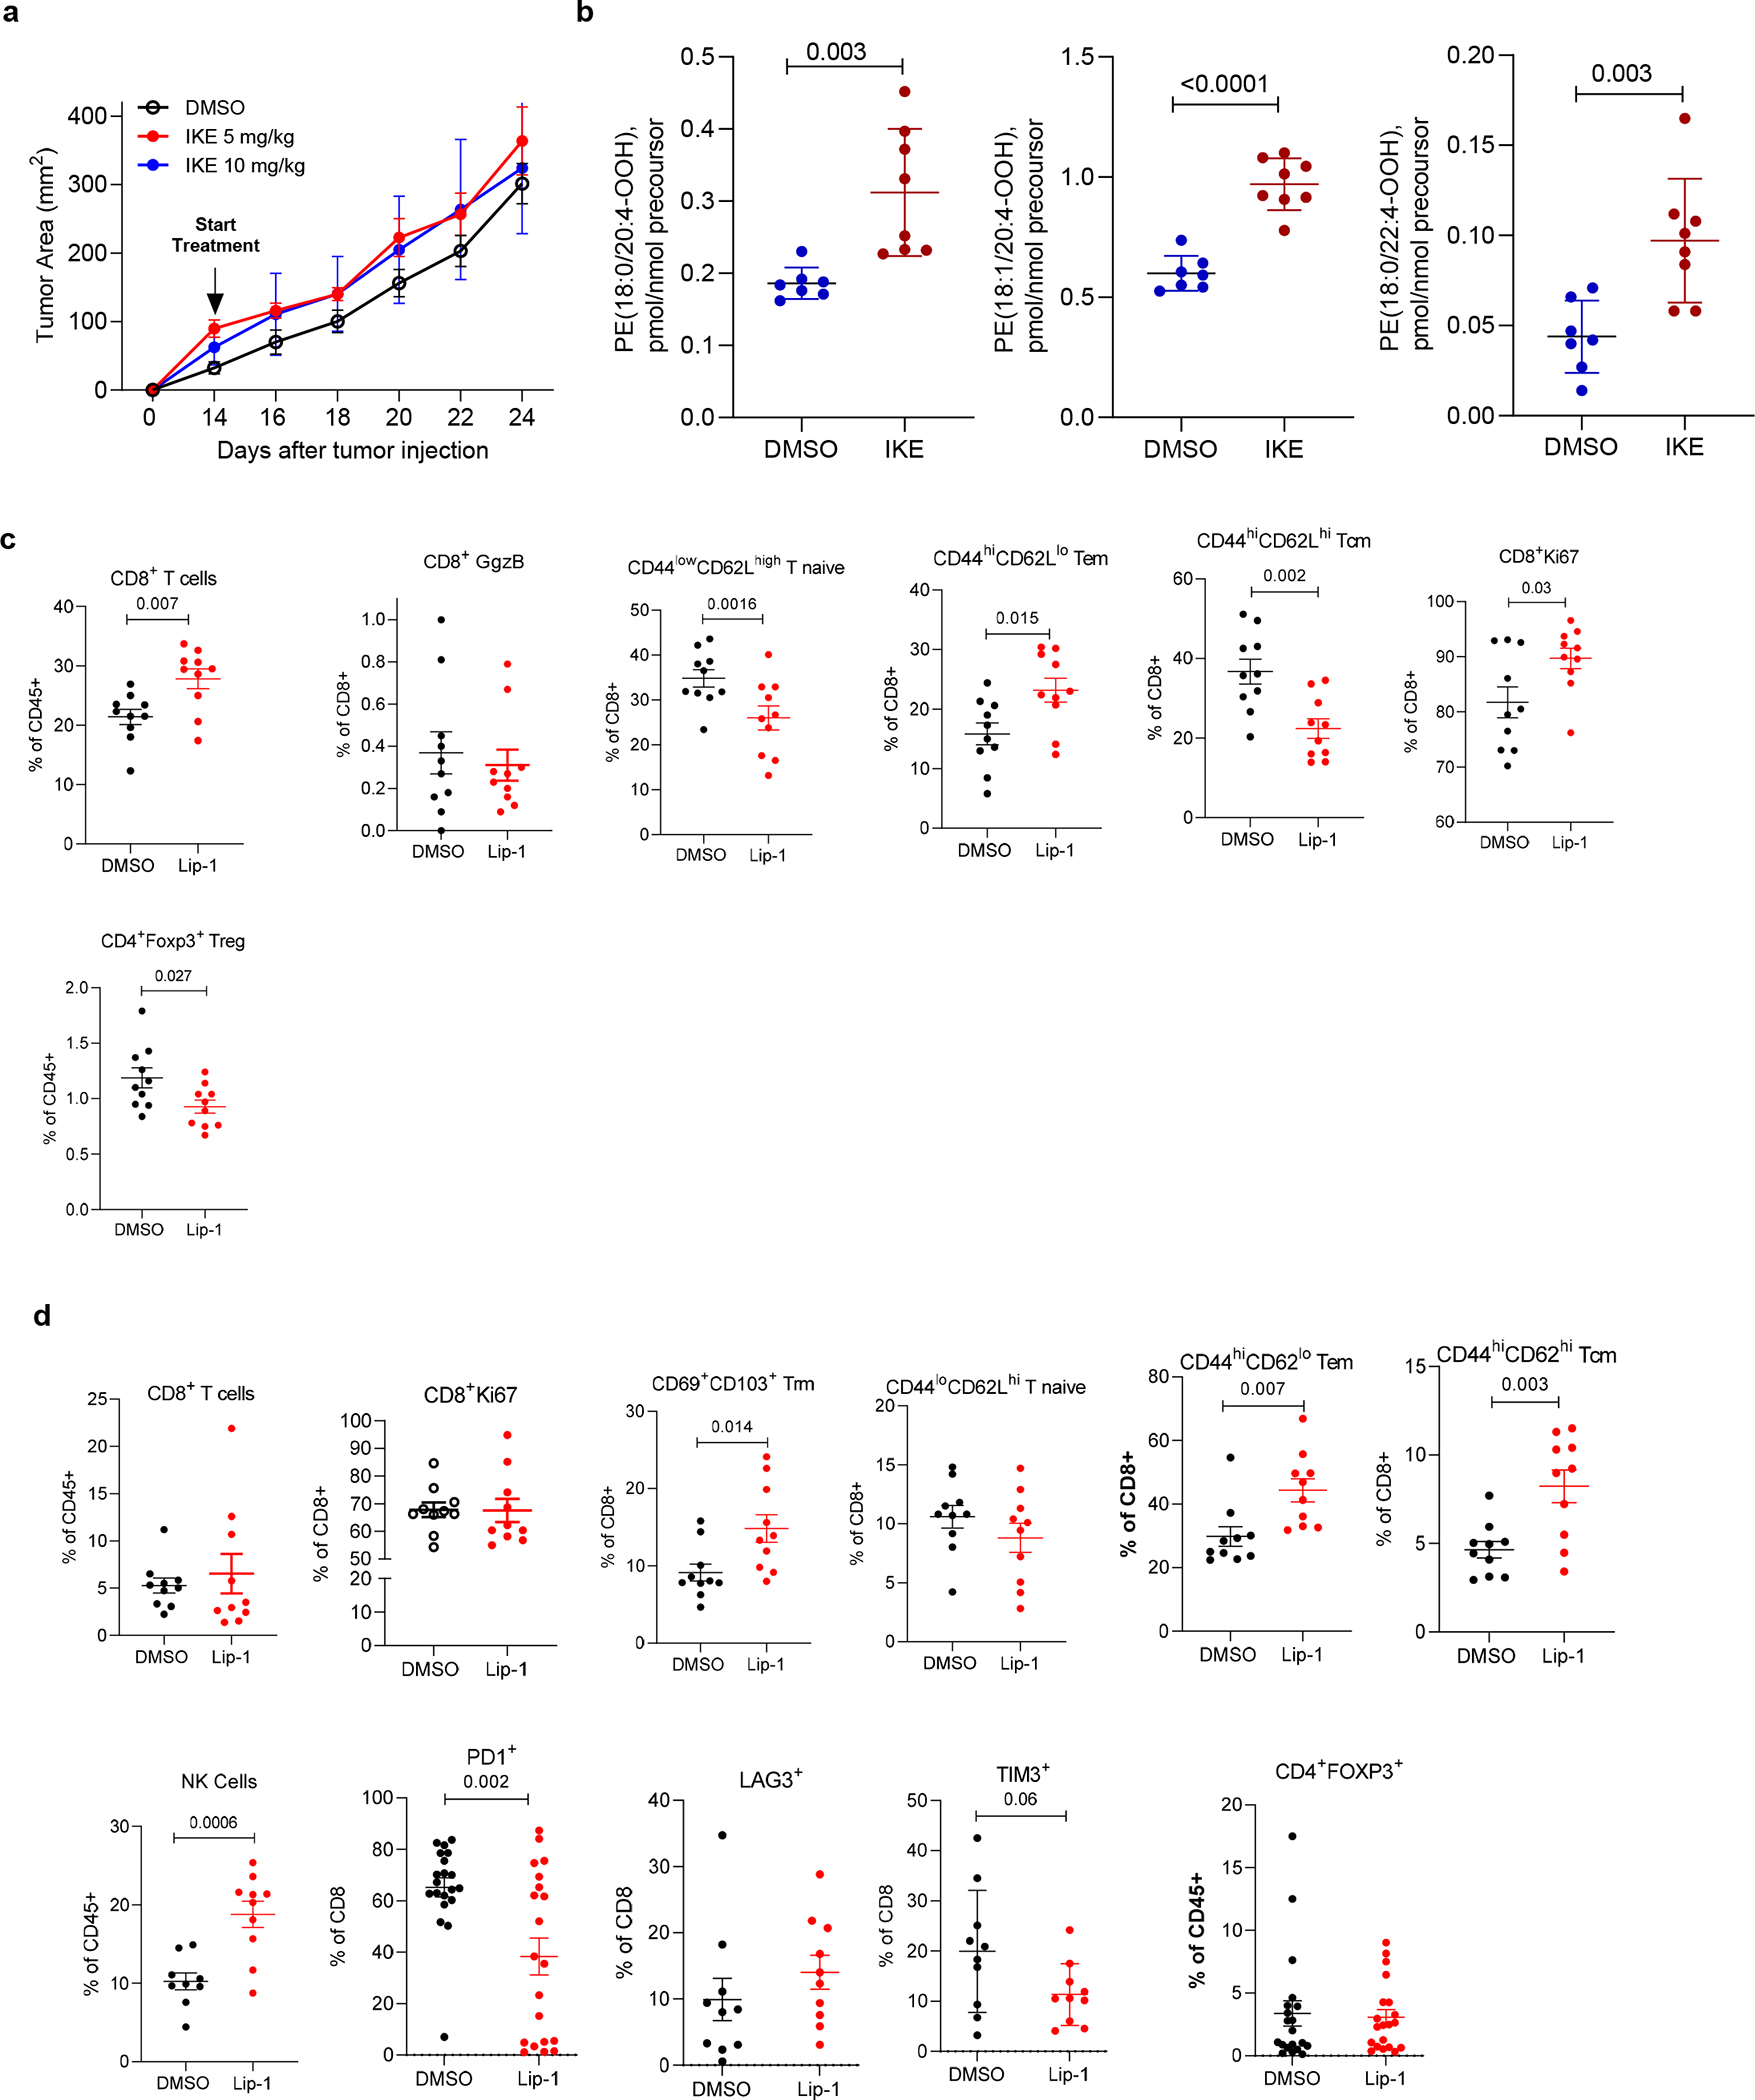
To further investigate the effect of ferroptosis on tumor growth, we induced ferroptosis in immune-competent TB mice. IKE treatment slightly increased CT26 tumor growth (Fig. 4d). These results appeared different from those previously reported for xenograft models 1,2 suggesting that in immune-competent hosts, induction of ferroptosis does not block the tumor growth. We validated this observation in the EG7 tumor model (Extended Data Fig. 9a) and confirmed that the selected dose (10 mg/kg) of IKE treatment induced ferroptosis as evidenced by a markedly elevated amount of intratumoral FALIS signals (Extended Data Figure 9b). In a different set of experiments, CT26 TB received PD-1 antibody with and without IKE (Fig. 4d). Administration of IKE promoted tumor growth even with concomitant administration of anti-PD-1.
To better understand the possible role of ferroptosis inhibition in the response to PD-1, we used PD-1 resistant pancreatic tumor cell clone from late-stage primary tumors from KPC mice. Ferroptosis inhibition synergized with anti-PD-1 and induced regressions of 50% of implanted pancreatic tumors (p=0.0325). Rapid progression (>200% volume change) was observed only in 1 out of 10 mice, whereas it was seen in 8 out of 10 control mice (p=0.006) (Fig. 4e). These results suggest that even in tumors resistant to immunotherapy, liproxstatin-1 could potentiate the effect of the PD1 antibody.
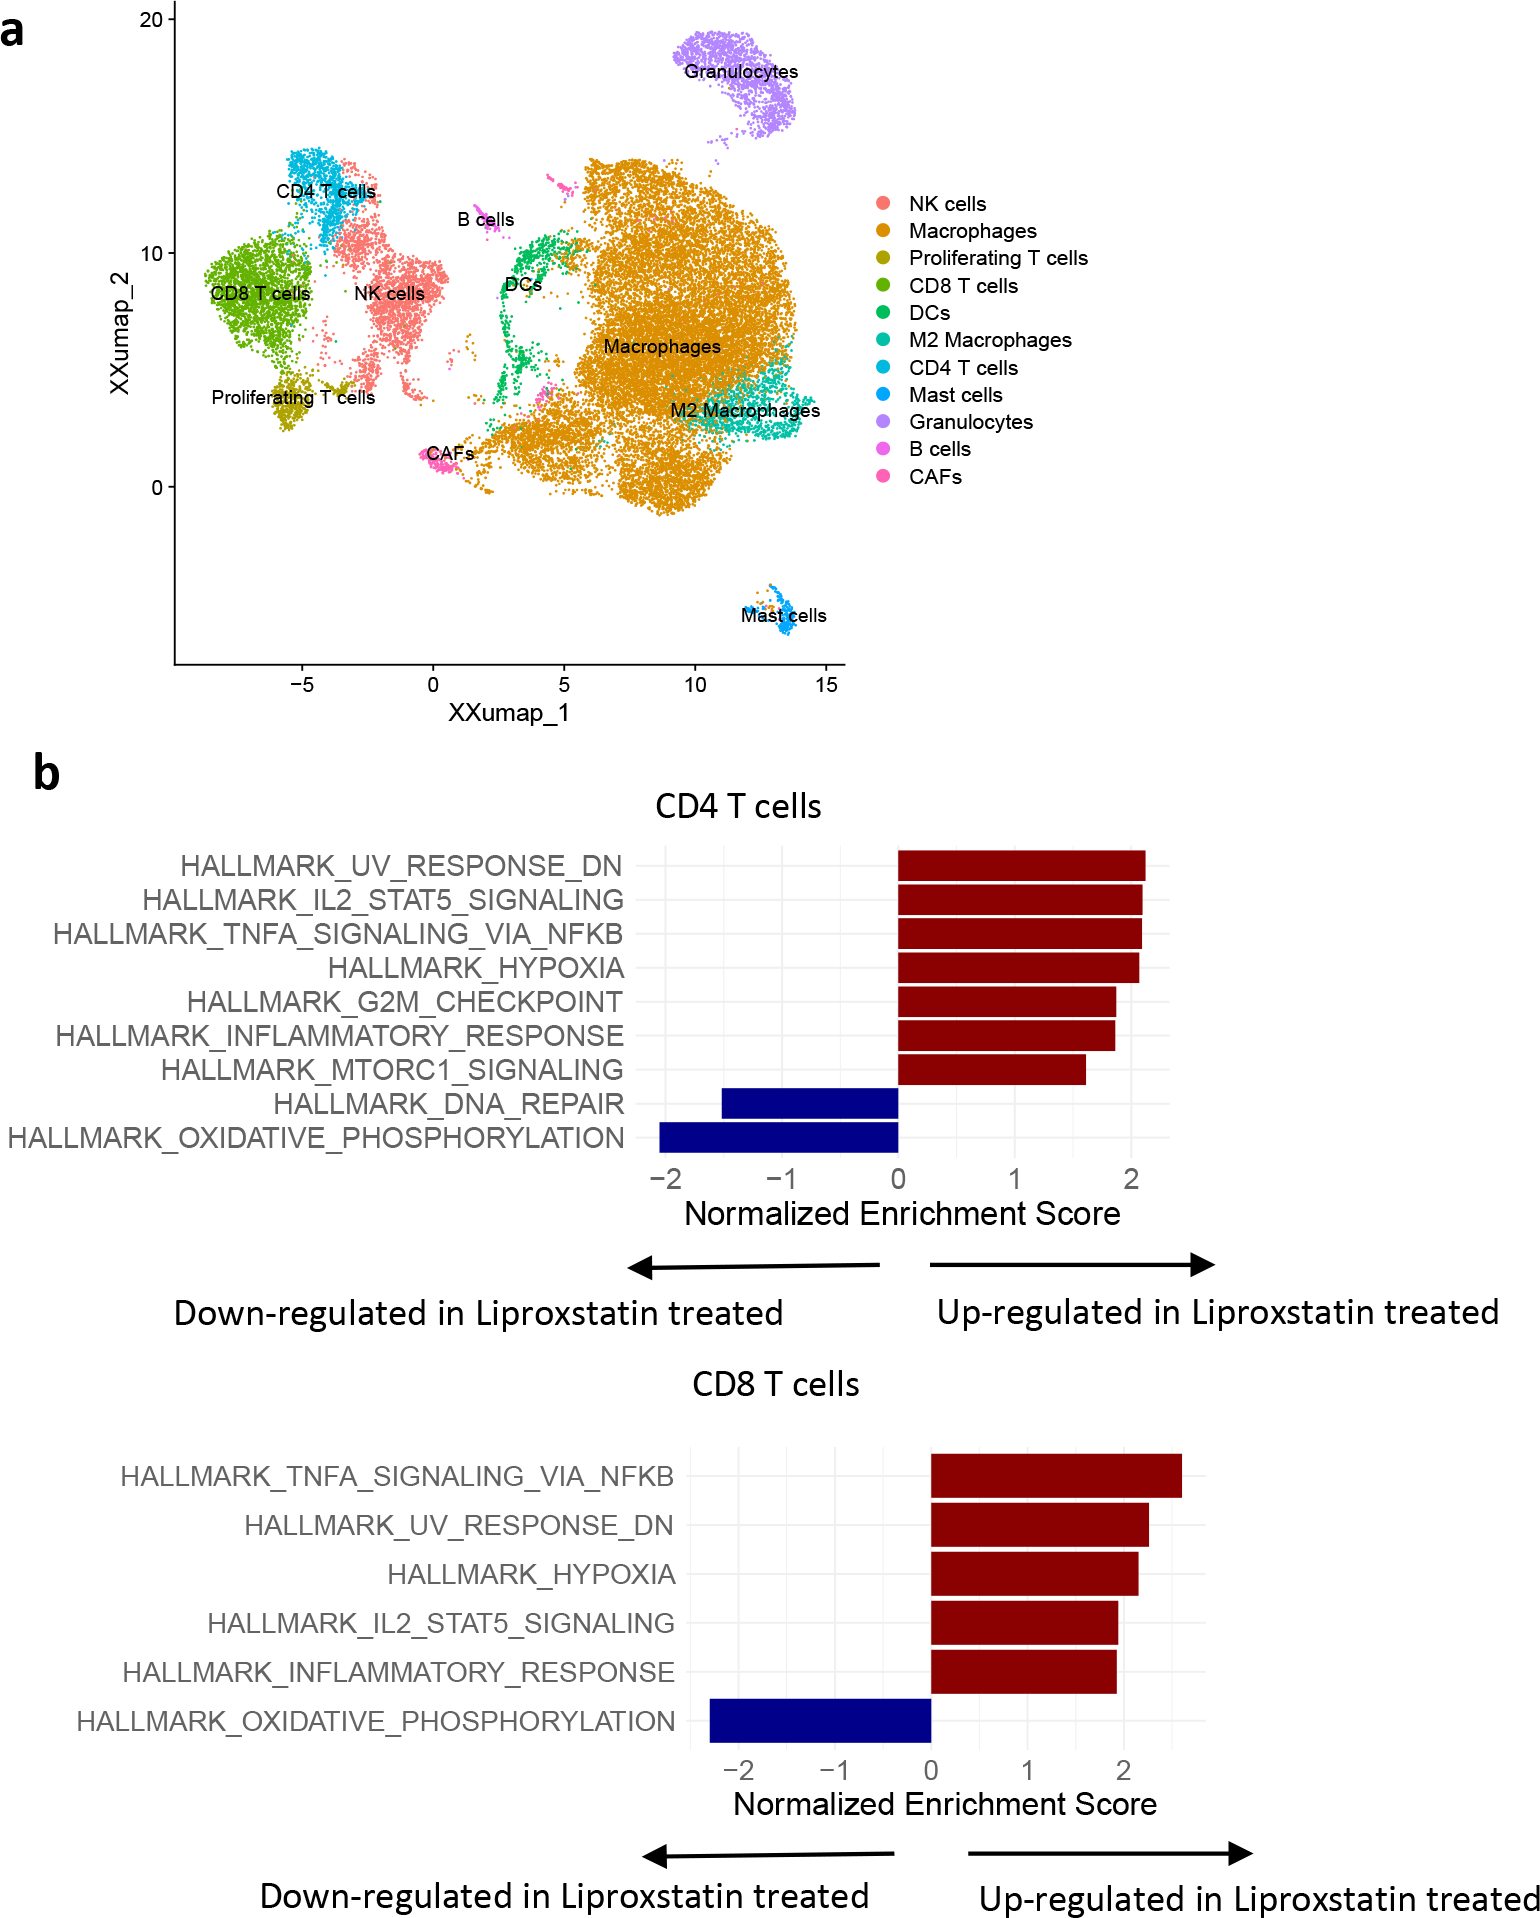
In lymph nodes, treatment with liproxstatin-1 increased the proportion of CD8+ as well as proliferating Ki67+CD8+ T cells (Extended Data Figure 9c). The effector memory T cells were markedly increased with concomitant decrease in the proportion of naïve, central memory, and regulatory T cells. In tumors, treatment with liproxstatin-1 caused significant increase in resident memory, central memory, and effector CD8+ T cells as well as NK cells (Extended Data Figure 9d). To better characterize T cells in tumors, CT26 tumor-bearing mice were treated with liproxstatin-1 for 8 days (before substantial differences in tumor size became apparent), tumors were collected and scRNAseq was performed. Populations of CD4+ and CD8+ T cells were analyzed (Extended Data Fig. 10a). In T cells from tumors of mice treated with liproxstatin-1 we observed up-regulations of hallmarks associated with IL-2 and TNFα signaling, inflammatory response, and down-regulation of oxidative phosphorylation (Extended Data Fig. 10b) indicative of T cell activation. Taken together these data indicate invigorated T cell compartment in the TME of tumors treated with ferroptosis inhibitor.
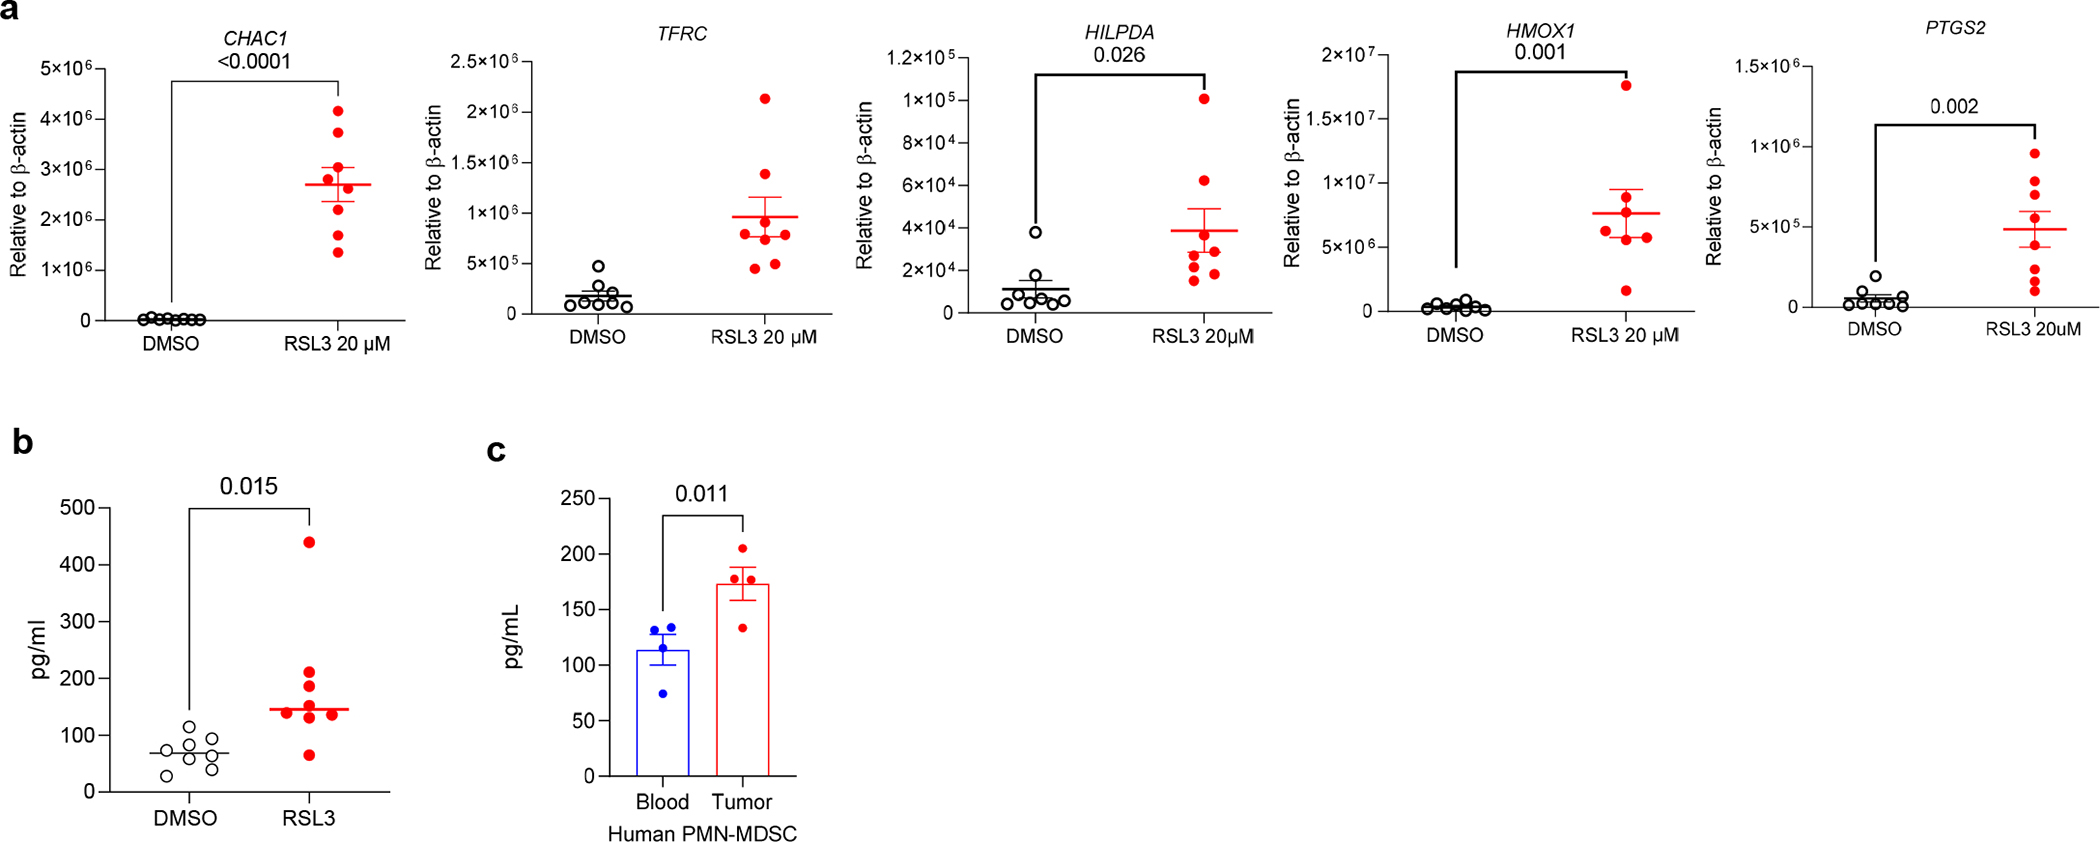
To assess the correlation of ferroptosis gene signature with clinical outcome, we used 8 ferroptosis-associated genes described in Extended Data Fig. 1c. Treatment of healthy donors peripheral blood PMN with RSL3 resulted in substantial up-regulation of those genes (Extended Data Fig. 11a) confirming their association with ferroptosis. RSL3 alco induced substantial increase in the production of PGE2 (Extended Data Fig. 11b). Consistent with these results, PGE2 production was markedly higher in PMN-MDSC isolated from NSCLCs tumors compared to peripheral blood PMN-MDSC (Extended Data Fig. 11c).
To analyze the correlation of the ferroptosis gene signature with the PMN-MDSC gene signature derived from peripheral blood PMN-MDSC9 we used The Cancer Genome Atlas (TCGA) pancreatic cancer dataset. While PMN-MDSC signature did not have overlapping genes with ferroptosis signature, we observed a positive correlation between PMN-MDSC and ferroptosis signatures (Fig. 4f) as well as increased survival in the group of patients with lower expression of ferroptosis genes (Fig. 4g). Independently, the same approach was used to analyze a cohort of lung cancer patients using Tempus real-world-evidence data set 29. Similar to the pancreatic cancer dataset analysis, we observed correlation between PMN-MDSC and ferroptosis signatures (Fig. 4h). High ferroptosis signature was associated with worse survival in these patients (Fig. 4i). An even stronger inverse association between ferroptosis and patients survival was found in the subset of patients treated with immunotherapy (patients received one of four CPB: atezolizumab, durvalumab, nivolumab, or pembrolizumab) (Fig. 4j). Highly significant positive correlation of PMN-MDSC signature with ferroptosis signature was observed in multiple tumor types from TCGA database (Extended Data Figure 12a). We observed strong association of high expression of ferroptosis signature with negative clinical outcome in patients with kidney carcinoma, uveal melanoma, thymoma, and lower grade glioma (Extended Figure 12b).
Discussion
In this study, we demonstrate that in the TME, PMN-MDSC undergo ferroptosis which renders them more immune-suppressive. Induction of ferroptosis was sufficient to convert non-suppressive PMN to immune suppressive PMN-MDSC. While ferroptosis decreases the number of PMN-MDSC in the TME, the enhanced release of immunosuppressive molecules by ferroptotic cells has an inhibitory effect on T cells. Several factors make tumor PMN-MDSC especially sensitive to ferroptosis induction. One such factor is hypoxia-mediated down-regulation of GPX4 in tumor PMN-MDSC, which facilitates the accumulation of PEox to drive ferroptosis. We also identified a novel role for AA transporter FATP2 as a positive regulator of ferroptosis in tumor PMN-MDSCs. Tumor PMN-MDSC bias for AA trafficking through FATP227 may account for the increased sensitivity of PMN-MDSC to ferroptosis compared to other myeloid cell types in the TME.
Ferroptotic PMN-MDSC exert contact-independent immune suppression, suggesting soluble factor(s)-mediated effect. This is in contrast to their functionality in peripheral lymphoid organs, where direct contact between PMN-MDSC and T cells is considered to be a dominant mechanism 30. It is known that cells dying by ferroptosis release diverse lipid mediators including PGE2 although the immunological consequences of these factors have not been previously studied 31. Moreover, PMN-MDSC in the TME are known to produce PGE2 that impairs antitumor functions of innate and adaptive immune cells 6,32. In our study, ferroptotic PMN-MDSC produced large amounts of PGE2, which was dramatically reduced in cells unable to undergo ferroptosis. Inhibition of PGE2 markedly, but incompletely, reduced ferroptosis-mediated immune suppression by PMN-MDSC indicating the contributions of PGE2 but also suggesting the possible effects of other peroxidized lipids. Our data indicate that oxidized AA-PE accumulated during ferroptosis may have direct suppressive effect on T cells, which would complement the effect of PGE2. Our data show that the release of these immune suppressive molecules take place early on during induction of ferroptosis prior to PMN-MDSC cell death. Inhibition of ferroptosis, while protecting PMN-MDSC, blocks the release of immune suppressive factors and thus promote conversion of PMN-MDSC to classical non-suppressive PMN.
Ferroptosis play a dual role in tumors. Previous studies have demonstrated that therapy-resistant cancer cells, particularly those of pro-metastatic mesenchymal type, exhibit increased sensitivity to ferroptosis 33–35. As such, ferroptosis has garnered attention as a potential therapeutic target in cancer therapy. Most of the studies, however, fail to consider the contributions of the immune system due to their reliance on xenograft mouse tumor models that lack a functional immune system 36–43. One study has demonstrated that genetic manipulation of tumor cells in vitro to decrease their sensitivity to ferroptosis made them less sensitive to IFN-γ and CTLs 44. In contrast, treatment of mice with cysteinase, a ferroptosis inducer, sensitizes tumor cells to IFN-γ and synergizes with ICB 44. Our findings suggest that the immune-suppressive effect of ferroptosis in PMN-MDSCs can outweigh in some models its tumor limiting effect in cancer cell death. This was supported, by the observation that enrichment for ferroptotic genes was associated with poor patient survival in several types of cancer. Furthermore, recent data shows that ferroptosis in tumor-infiltrating CD8+ T cells has tumor-promoting effects due to decreased T cell survival and impaired T cell function 45,46. These studies demonstrate that the complex nature of ferroptosis in the TME must be considered in the context of cells in which it occurs. Our findings raise the possibility that current efforts to translate pharmacological induction of ferroptosis in cancer cells to a clinical setting may sustain and/or amplify PMN-MDSC mediated immune-suppression, warranting cell-specific delivery of different ferroptosis inducing or inhibiting agents.
Methods
Human samples.
Peripheral blood and tumor tissues were collected from patients at Helen F. Graham Cancer Center, Wilmington, DE or University of Maryland School of Medicine, Baltimore, MD. The study was approved by the Institutional Review Boards of the Christiana Care Health System, Helen F. Graham Cancer Center, The Wistar Institutional Review Board, and AstraZeneca Instittional Review Board. All patients signed IRB-approved consent forms. Twenty patients (8 males and 12 females, age 44–88, average age 66.4±14.2) with previously untreated carcinomas of the lung, head and neck, stomach, pancreas, uterus, colon, and liver were enrolled. Peripheral blood was collected from 14 healthy volunteers at Wistar Institute and AstraZeneca after obtaining informed consent.
Mouse Models.
Animal experiments were approved by The Wistar Institute Animal Care and Use Committee as well as the University of Pennsylvania Institutional Animal Care and Use Committee. Balb/c or C57BL/6 mice (female, 6–8 weeks old) were obtained from Charles River and Jackson Laboratory. Rag2−/−γc−/−, OT-I TCR-transgenic mice (C57Bl/6-Tg(TCRaTCRb)1100mjb) (female, 6–8 week old) and PMEL TCR-transgenic mice (B6.Cg-Thy1a/Cy Tg(TcraTcrb)8Rest/J, female, 6–8 weeks old) were purchased from Jackson Laboratory. The transgenic KPC (KrasG12D/p53R172H, PdxCre) model was described previously47. Scl27a2flxS100A8-cre mice were described previously27. ALOX15fl were obtained from Jackson Laboratory and crossed with B6.Cg-Tg(S100A8-cre,-EGFP)1Ilw/J (Jackson Laboratory). ACSL4fl were described previously48 and crossed with B6.Cg-Tg(S100A8-cre,-EGFP)1Ilw/J (Jackson Laboratory). In mouse tumor models maximal tumor size approved by IACUC was 2 cm in a larger diameter. In none of the experiments were these limits exceeded. Sample size calculation was performed in advance. Studies were not blinded. In treatment experiments, mice were randomized before the start of therapy to different groups based on equal tumor size.
Reagents and cell lines.
Tumor cell lines: EL4 (lymphoma), EG7 (lymphoma), LLC (Lewis Lung Carcinoma), and CT26 (colon carcinoma) were obtained from ATCC. MC 38 (colon carcinoma) was obtained from I. Turkova, University of Pittsburgh, Pittsburgh, PA. All cells were maintained in DMEM medium supplemented with 10% fetal bovine serum (FBS, Sigma-Aldrich, St. Louis, MO) and penicillin/streptomycin at 37 °C, 5% CO2. Tumor cells were injected subcutaneously (s.c.) at 3 × 10⁵ cells or 5 × 10⁵ cells per mouse. Tumor cell lines were tested for mycoplasma contamination by using the Universal Mycoplasma detection kit (ATCC). SIINFEKL and EGSRNQDWL peptides were obtained from the American Peptide Company (Vista, CA).
Cell phenotype by flow cytometry.
Single-cell suspension was stained with Fixable Aqua Dead Cell Stain (Thermo Fisher) and Fc block anti-mouse FcgRIII/II ((CD16/CD32 (eBioscience)), or human FcR Blocking Reagent (Miltenyi Biotec) for 15 min, 4°C. After washes with buffer (PBS/2% FBS/0.5 mM EDTA), cells were stained with antibodies for 30 min, 4C for surface staining. For cytoplasmic staining, cells were incubated with Fixation & Permeabilization buffers (BD Bioscience) according to the manufacturer’s instruction. Cells were evaluated on LSRII flow cytometer and data were analyzed by Flowjo (BD) software. Examples of gating strategy are shown in Supplementary Figure 1. All flow cytometry antibodies are described in Supplementary Table 1.
Isolation of mouse cells.
Single-cell suspensions were prepared from bone marrow, spleen, and tumor followed by red blood cell removal using ammonium chloride lysis buffer. Tumor tissues were processed using Mouse Tumor Dissociation Kit according to the manufacturer’s recommendation (Miltenyi). Tumor M-MDSCs (CD45+CD11b+Ly6G−Ly6Chigh) were sorted using FACS Aria (BD Biosciences). PMN-MDSCs were purified using anti-Ly6G microbeads (Miltenyi Biotec) according to the manufacturer’s instruction or sorted using FACS Aria (CD45+CD11b+Ly6G+Ly6Clo).
Cell viability assay.
PMN-MDSCs or M-MDSCs isolated from bone marrow, spleen, or tumor were treated with different concentrations of RSL3 for 2–16 hr. Cell viability was evaluated using alamarBlue Cell Viability Reagent (Invitrogen) or by trypan blue exclusion.
Isolation of human cells.
For isolation of the total population of human blood neutrophils from healthy individuals and cancer subjects, we used the MACSxpress isolation kit (Miltenyi). For parallel isolation of PMN-MDSC and neutrophils, a double density gradient of Histopaque-1077 and Histopaque-1119 (Sigma Aldrich) was used. PMN-MDSC were isolated from low-density PBMC using CD15-beads (Miltenyi). Neutrophils were isolated from high-density gradient also using CD15-beads. Neutrophil and PMN-MDSC purity were assessed by flow cytometry and were >95%. For tumor neutrophil isolation, single-cell suspensions from tumor tissues were prepared using Human Tumor Dissociation Kit according to the manufacturer’s recommendation (Miltenyi). Tumor neutrophils were sorted using FACS Aria.
Induction of ferroptosis in neutrophils.
PMN-MDSC from tumors or BM and spleens of TB mice were incubated for 16 hours with up to 7 μM RSL3 to induce ferroptotic cell death. For T cell suppression assays, mouse neutrophils from bone marrow or human neutrophils from peripheral blood were treated with 20 μM RSL3 for 2 or 40 μM IKE for 6 hr, with or without 1 μM Liproxstatin-1, 10 μM Z-VAD-fmk, and 20 nM ketorolac and rofecoxib, at 37°C in 5% CO2. The cells were washed 3 times with media and used for T cell suppression assay. For supernatant collection, at the end of 4 or 6 hr incubation with 20 μM RSL3 or 40 μM IKE, respectively, the cells were triple washed and cultured in 96-well U bottom plates at 4 million/mL for an additional 16 hr. Collected supernatants were used for T cell suppression assay. The reagents are described in the Supplementary Table 2.
Mouse T cell suppression assay.
Isolated PMN-MDSC, M-MDSC, and ferroptotic PMN generated as described in Induction of ferroptosis in neutrophils were co-cultured for 48 hours at different ratios with either CellTrace CFSE or Violet stained or unstained splenocytes from Pmel transgenic mice in the presence of cognate peptide Pmel (EGSRNQDWL; 0.1 μg/ml). Alternatively, splenocytes were cultured in 2:1, 1:1, and 1:2 mixture of supernatant and media (supernatants collected from cultured PMN-MDSC and M-MDSC or ferroptotic PMN as described in Induction of ferroptosis in neutrophils). To block the EP2 and EP4 receptors, 100 nM ONO-AE3-208 and 100 nM PF-04418948 were added to the co-cultures. After 48 h co-culture, cells with unstained splenocytes were incubated with [3H]-thymidine (PerkinElmer) for 16–18 h, and proliferation was measured by using TopCount NXT instrument (PerkinElmer). The proliferation of CellTrace loaded splenocytes was measured by flow cytometry as dilution of CFSE or Violet stain within the CD45+CD3+CD8+ gate. The reagents are described in the Extended data Table 2.
Human T cell suppression assay with supernatant.
Human T cells were isolated using EasySep™ Human T Cell Isolation Kit (STEMCELL Technologies Inc.), and then labeled with CellTrace Violet (ThermoFisher Scientific) and cocultured with supernatant of neutrophils and 1 μL of CD3/CD28 Dynabeads (ThermoFisher Scientific) in U-bottom 96-well plates for 72 h. The proliferation of T cells was measured by flow cytometry as CellTrace Violet dilution in CD8+ cells.
Human PMN-MDSC suppression assay.
Anti-human CD3 antibody (OKT3) and anti-human CD28 antibody (CD28.2, Biolegend) were diluted in PBS at 1 μg/mL and incubated at 100 μL/well in 96-well plate for 2 hr in 37°C. The wells were washed vigorously with PBS and then used for the assay. Fresh tumor samples were digested in the presence of DMSO or Liproxstatin-1 (1 uM) using Tumor Dissociation Kit, human (Miltenyi Biotec). PMN-MDSCs were purified using anti-CD15 microbeads, and then pre-incubated for an hour with DMSO or Liproxstatin-1 (1 μM) and cocultured with cell trace-labeled T cells in the plates with immobilized CD3/CD28 antibodies. T cell proliferation was analyzed after 72 h by flow cytometry.
Quantitative real-time PCR.
RNA was extracted using Total RNA Kit according to the manufacturer’s instructions. DNase digestion was performed cDNA was generated with High-Capacity cDNA Reverse Transcription Kit (Applied Biosystems, Foster City, CA, USA). qRT-PCR was performed using Power SYBR Green PCR Master Mix (Applied Biosystems) and TaqMan Gene Expression Assay FAM (Applied Biosystems) in 96- or 384- well plates. Plates were read with ABI 7900 (Applied Biosystems). Amplifications were carried out with the primers described in Supplementary Table 3.
RNA-sequencing.
RNA-seq data was aligned using bowtie2 49 against mm10 or hg19 version of genome versions and RSEM v1.2.12 software50 was used to estimate raw read counts using Ensemble transcriptome information. DESeq2 51 was used to estimate the significance of differential expression between sample groups. Overall gene expression changes were considered significant if passed the false discovery rate FDR<5% threshold. Significant genes affected at least 2-fold were analyzed for enrichment of upstream regulators using QIAGEN’s Ingenuity® Pathway Analysis software (IPA®, QIAGEN Redwood City, www.qiagen.com/ingenuity, “Upstream Analysis” option). Only regulators with significantly enriched p<0.005 targets (at least 20) with significantly predicted activation state (activation z-score |Z|>2) were considered. RNA-Seq data are publicly available at GEO accession number GSE205371
Single cell RNA-seq analysis.
3’ gene expression was profiled at the single cell level using the 10X Genomics Single Cell 3’ v3.1 Reagent Kit (10X Genomics, Pleasanton, CA, USA). Cells were washed and diluted to ~1,000 cells/ul in 1X PBS with 0.04% BSA. 16,500 cells were loaded per reaction and GEMs (Gel Bead-in-Emulsion) were generated with the 10X Genomics Chromium Controller, followed by reverse transcription, GEM-RT cleanup, and cDNA amplification per 10X protocol. For each sample, 10μl of amplified cDNA was used as input into library construction. Samples underwent fragmentation, end repair and A-tailing, followed by adapter ligation, sample index PCR, and post-library QC per 10X protocol. Libraries were quantified on the Agilent TapeStation using the High Sensitivity D5000 ScreenTape. Libraries were diluted to 1.5nM and pooled in equal volumes. PhiX was spiked in at 1%, pool was diluted to 300pM, and sequenced on the Novaseq 6000 System (Illumina, San Diego, CA, USA) with a target of 100,000 reads per cell. Sequencing parameters were as follows: Read 1: 28 cycles; i7 Index: 10 cycles; i5 Index 10 cycles; Read 2: 90 cycles. Sequencing data were demultiplexed, aligned and quantified using the cellranger software suite (version 6.1.1) (10X Genomics, Pleasanton, CA, USA) using the mm10 genomic reference (refdata-gex-GRCh38-and-mm10-2020-A).
Cell Ranger was applied for gene expression quantification of single cells. We filtered the low-quality cells based on mitochondrial RNA percentage and number of genes (cells with >10% mitochondrial RNA percentage or have less than 50 expressed genes per cell were discarded). Finally, 27,069 cells (3589 genes and 17,709 UMIs per cell on average) were obtained for the downstream analysis. We used Scanpy toolkit52 for downstream analysis. We identified highly variable genes using Seurat R package53 and used Leiden graph-based clustering (resolution=1) to define transcriptionally similar cells. Clusters were visualized by Uniform Manifold Approximation and Projection (UMAP). The clusters were annotated by expression of canonical markers of major cell types to identify lymphoid and myeloid lineage cells. Differential expression analysis was performed using FindMarkers function with default parameters and method (Wilcoxon rank sum test). Gene set enrichment analysis was performed using fgsea R package (https://doi.org/10.1101/060012), identifying enriched differentially regulated pathways. Data are publicly available at GEO accession number GSE213861.
Analysis of Tempus dataset.
Tempus real-world-evidence data lung cohort and immunotherapy treated (malignant tumor of lung) cohort RNAseq gene expression data and clinical data 29 were obtained through AstraZeneca - Tempus Strategic Collaboration. The Kaplan-Meier method was used to evaluate the overall survival differences between groups stratified by dividing the ferroptosis signature gene expression into tertiles. The survival analysis was performed using the R survival package 54 and survival curves were plotted using the R survminer package https://cran.rproject.org/web/packages/survminer/index.html.
Metabolomics.
Analysis of metabolomics was performed at Wistar Core facility using mass-spectrometry (LC-MS). Each sample was extracted from 106 cells. Metabolite quantitation (MS peak areas) was normalized to a sample pool that was run at the beginning, middle, and end of the sample sequence to correct for instrument drift over time. Changes considered significant if they reached > 2 fold change converted from Log2 ratio and Benjamini-Hochberg corrected q-value < 0.05 with correction for multiple testing. Overall, 167 metabolites fit those criteria with most of them up-regulated in PMN-MDSC with blocked ferroptosis as compared with wild-type mice. Ingenuity Pathway Analysis (IPA) was performed on differentially expressed metabolites and metabolite names were mapped to KEGG identifiers and given as input to IPA with default settings for metabolomics analysis.
Data were submitted to Metabolomics Workbench: http://dev.metabolomicsworkbench.org:22222/data/DRCCMetadata.php?Mode=Study&StudyID=ST002160&Access=MvrS7201; http://dx.doi.org/10.21228/M87Q56
Western blot.
Cells were lysed in RIPA buffer (Sigma-Aldrich) in presence of protease inhibitor cocktail (Sigma-Aldrich), sonicated, and stored at −80°C. Whole-cell lysates were prepared and subjected to 10% SDS-PAGE and transferred to the PVDF membrane. The membranes were probed overnight at 4°C with the antibodies specific for GPX4, HIF1a, ACTIN, and GAPDH. Membranes were washed and incubated for 1 h at room temperature with a secondary antibody conjugated with peroxidase.
PGE2 Detection by ELISA.
Mouse Ly6G+ cells isolated by flow sorting from blood and tumors and human blood neutrophils isolated with MACSexpress isolation kit (Miltenyi) were seeded at 250,000–500,000 cells/ml and incubated for 3 or 48 hours. Pellets and supernatants were collected for further analysis. PGE2 concentration in supernatants was measured by using PGE2 ELISA KIT (Cayman), according to the manufacturer’s instructions.
Tumor cell injections and treatment.
3–5×10⁵ tumor cells were implanted subcutaneously into the right flank of host mice. Treatments with liproxstatin-1 started 8–10 days post-implantation. Liproxstatin-1 at 15 mg/kg/day was administered i.p for 14 days; control mice received vehicle,DMSO, alone. Anti-PD-1 antibody was initiated together with liproxstatin-1 at 200 μg/mouse i.p. every 3 days, 6 doses total. IKE was administered i.p. at 10mg/kg/day, for 14 days.
Liquid chromatography-mass-spectrometry of lipids.
Lipids were extracted from flow-sorted cells by the Folch procedure with slight modifications, under nitrogen atmosphere, at all steps. LC/ESI-MS analysis of PE species was performed on a Dionex HPLC system coupled to an Orbitrap Fusion Lumos mass spectrometer (ThermoFisher Scientific) using a normal phase column (Luna 3 μm Silica (2) 100 A, 150 × 1.0 mm, (Phenomenex) at a flow rate of 0.050 ml/min. The column was maintained at 35 °C. The analysis was performed using gradient solvents as previously described 55 To quantitatively assess oxygenated PE molecular species, lipids were separated on a C30 reverse-phase column (Accucore, 2.1mm × 25 cm, 2.6-micron particle size, Thermo Scientific). Solvent A: acetonitrile/water (50/50); Solvent B: 2-propanol/acetonitile/water (85/10/5). Both A and B solvents contained 5mM ammonium formate and 0.1% formic acid as modifiers. Gradient method was as follows: 0–40 min, 15%–50% B (linear, 5); 40–130 min, 50–100% B (linear, 5); 130–135 min, hold at 100% B; 135–140 min, 15% B (linear, 5); 140–150 min, 15% B for equilibration. The flow was maintained at 100 ul/min. The LC system was a Thermo Ultimate 3000 complete with a WPS-3000 autosampler. The column temperature was set at 35° C. Analysis of LC/MS data was performed using the software package Compound Discoverer™ (ThermoFisher) with an in-house generated analysis workflow and lipid database. Lipids were further filtered by retention time and confirmed by fragmentation mass spectrum. Deuterated PE (hexadecanoyl(d31)-2-(9Z-octadecenoyl)-sn-glycerol-3-phosphoethanolamine (PE(16:0D31/18:1)) (Avanti Polar Lipids) was used as internal standards. MS analysis of free fatty acids was performed on a Q-Exactive hybrid-quadrupole-orbitrap mass spectrometer (ThermoFisher, Inc. San Jose, CA) as previously described 55.
Bioinformatics analysis.
Raw RNAseq counts per gene and subject survival information were downloaded for tumor samples from 177 subjects included in the TCGA-PAAD project from the NCI Genomic Data Commons (https://gdc.cancer.gov). Counts were normalized for each sample as counts per million reads. To normalize per gene, the individual per-sample counts/million value was divided by the median across all samples. For each gene signature, a score for each sample was computed by averaging the gene and sample normalized values for the set of genes included in the signature. Correlations between gene signatures and survival analysis based on stratification of gene signature scores were calculated and visualized in GraphPad Prism (v9, GraphPad Software, San Diego, CA).
Statistical analysis.
Statistical analyses were conducted in GraphPad Prism 8.3.1. Two-sided paired and unpaired Student’s t-test was used for comparison of the two groups. One-way analysis of variance (ANOVA) with Tukey’s multiple comparisons test was used for comparisons of >2 groups. Tumor growth curves were analyzed using Two-way ANOVA with Tukey’s multiple comparisons test for analysis of repeated measurement data. Correlations between datasets were assessed by measurements of Spearman’s correlation coefficients. The comparison of survival curves was performed using Log-rank (Mantel-Cox) test. In all graphs, data points represent biological replicates. Data are shown as mean ± standard deviation (SD), or, whenever biological replicates are shown as the mean of technical replicates, mean ± standard error of means (SEM). In all graphs, exact p values are shown. If p was <0.0001 it was denoted as *.
Extended Data
Extended data Fig. 1. Gene expression profile of mouse and human PMN-MDSC.
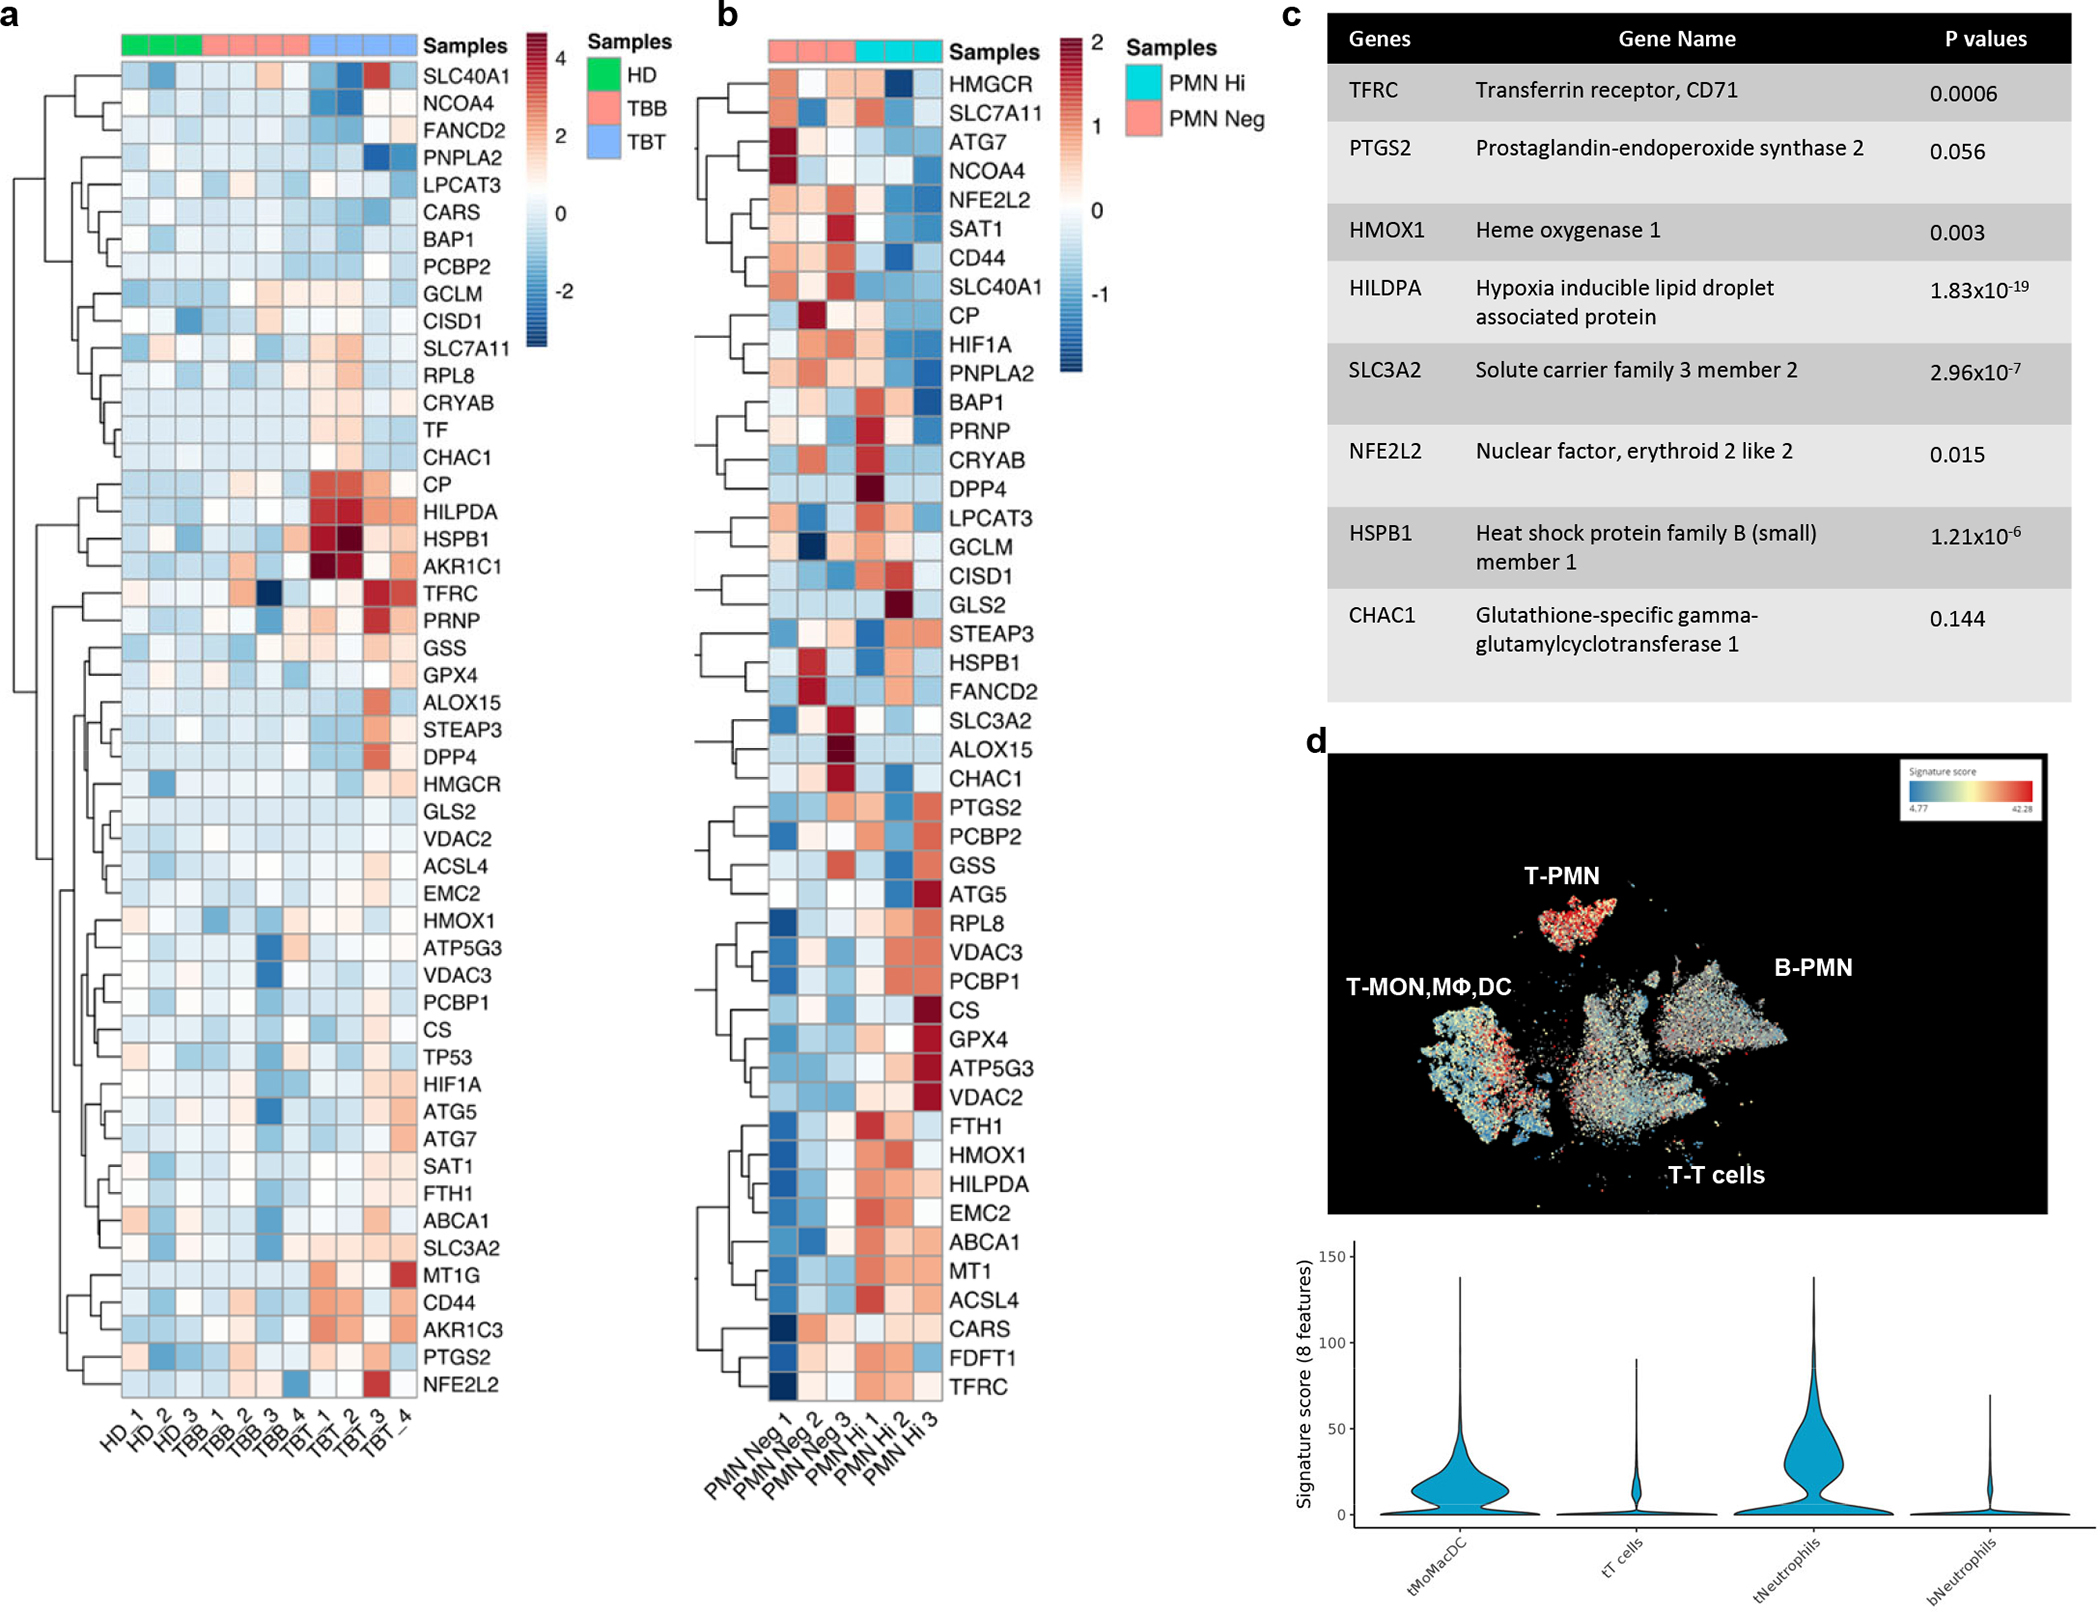
a. RNA seq of PMN-MDSC from matched blood (TBB) and tumor tissue (TBT) of lung cancer patients and peripheral blood of healthy donors (HD). Color key represents the normalized Z score. b. RNA seq of sorted CD14high and CD14− PMN-MDSC from EL-4 TB mice. Color key represents the normalized Z score. c. Ferroptosis gene signature used in further studies. P values between tumor and blood PMN samples were calculated in two-sided unpaired Student’s t-test. d. Signature score of 8 ferroptosis genes in indicated populations of cells by single cell RNAseq. Data were captured from (22). Analysis was performed using BBrowser (https://bioturing.com/).T– tumor, B – blood.
Extended data Fig. 2. Expression of ferroptosis related genes.
a. Expression of ferroptosis related genes in PMN from blood and tumor of cancer patients. qRT-PCR performed in CD11b+CD14−CD66b+ PMN isolated from blood (PB, n=9) and tumors (Tumor, n=6) of cancer patients. Ct value of housekeeping gene was subtracted from Ct value of gene of interest for each samples (dCt). The mean of dCt for PB group was calculated. Each PB and tumor sample was normalized to this value. P-values are shown in the graph (Two-sided unpaired Mann-Whitney test), non-significant p values are not shown. b. Expression of ferroptosis related genes in PMN-MDSC from indicated tumor models. qRT-PCR performed in CD11b+L6ClowLy6G+ PMN-MDSC isolated from indicated tissues from implanted (EL4, CT26, and LLC) and autochthonous (KPC) tumor bearing mice. Mean ± SEM are shown. P values were calculated in one way ANOVA with Tukey’s test for correction for multiple comparisons.* p<0.0001. Other p values are shown on graphs. N=5 for EL4 model; n=3 for CT26 model; n= 4 for LLC model; n=6 for KPC model.
Extended data Figure 3. Ferroptosis in PMN-MDSCS and M-MDSC.
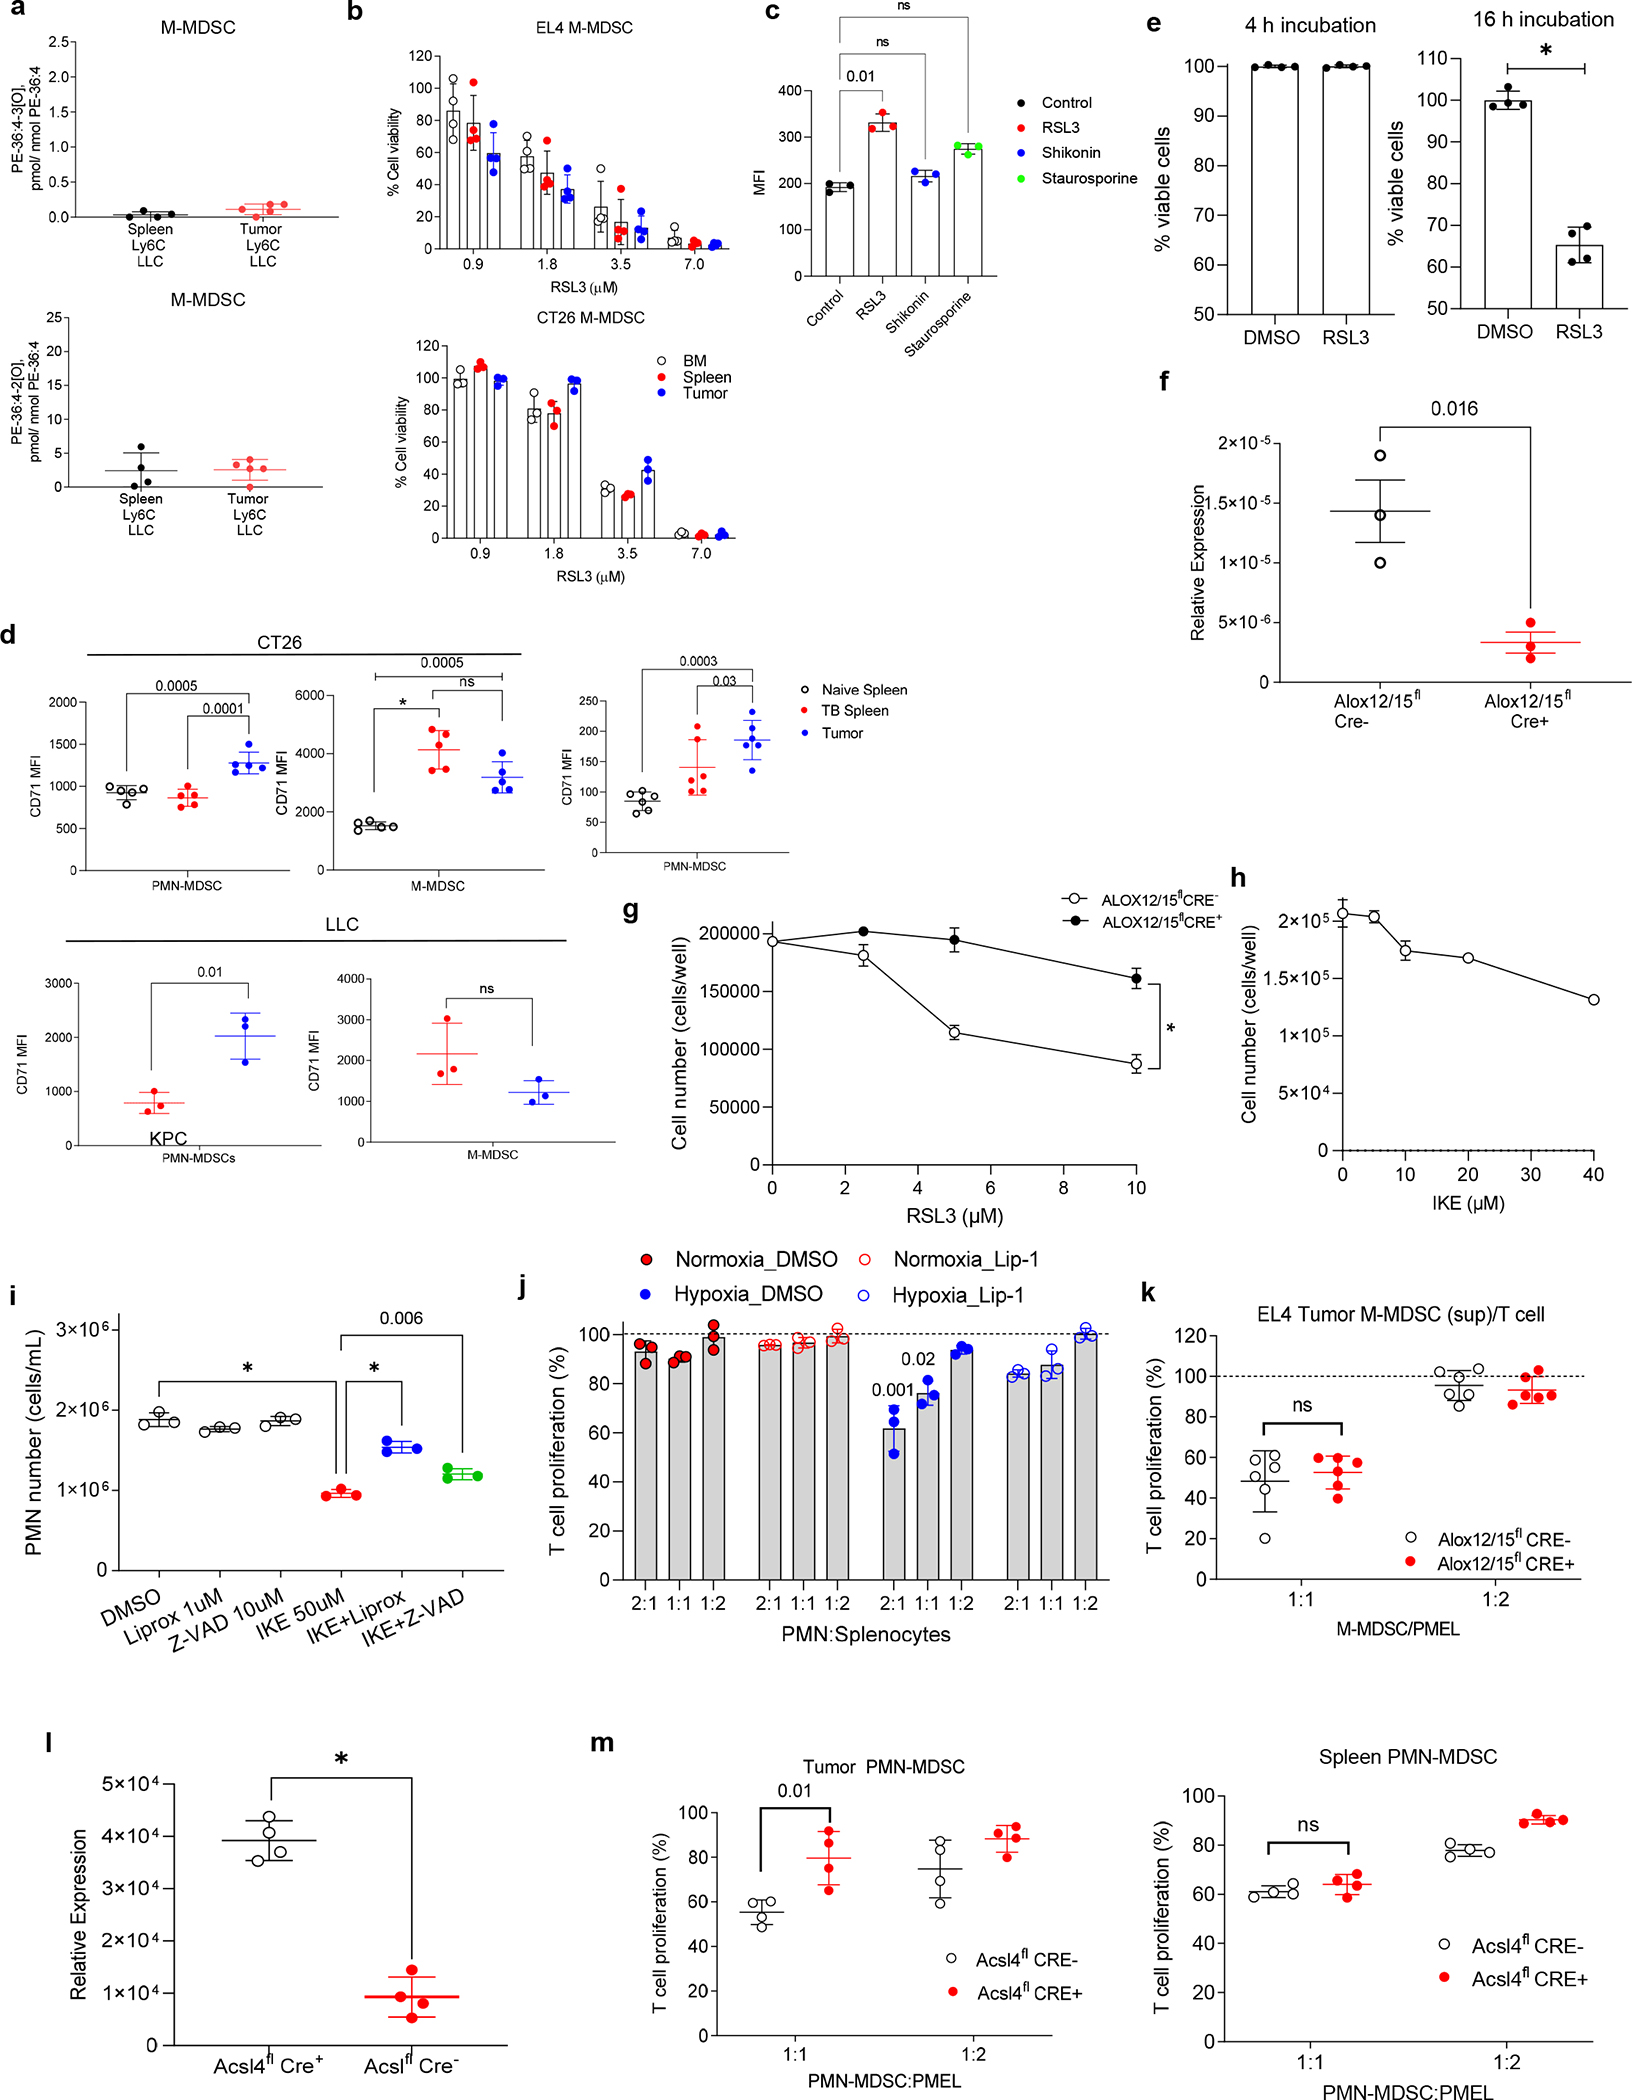
a. Content of oxygenated PE species PE(36:4-OOH) and PE(36:4-OH-OOH) in M-MDSC isolated from spleen and tumor of LLC TB mice. b. Viability of M-MDSC isolated from BM, spleen, and tumor of implanted EL4 and CT26 TB mice and treated with RSL3. Viability of the cells assessed by cell counts and expressed as a percent of untreated cell counts. c. CD71 expression in BM PMN after treatment with DMSO or various inducers of cell death for 18 hr: 20μM RSL3 for ferroptosis, 1μM Shikonin for necroptosis, and 0.25μM Staurosporine for apoptosis. Mean ± SD are shown. *P < 0.05, in one-way ANOVA. d. CD71 expression in tumor and spleen PMN-MDSC and M-MDSC. e. BM PMN were treated with DMSO or 20 μM RSL3 for 4 hr, washed extensively and proportion of live cells was counted by trypan blue exclusion method.. The washed cells were then incubated in fresh media at for additional 16 hr, and the proportion of viable cells was counted. Proportion of viable cells was calculated based on the number of the DMSO-treated cells. N=4. P values calculated in two-sided Student’s t-test (a, d middle panels), or One-way ANOVA with Tukey’s HSD post-hoc test (b, c, d) and are shown on graphs. * p< 0.0001. In all panels, mean ± SD are shown. f. Expression of Alox12/15 by qRT-PCR in PMN from Alox12/15flCre− and Alox12/15flCre+ mice. N=3. g. BM PMN-MDSC isolated from the LLC tumor bearing Alox12/15flCre− and Alox12/15flCre+ mice (n=6 per group) were treated with 0 – 10 μM RSL3 for 4 h, and then washed 3 times and followed by further 16 h incubation. Cell number was determined by trypan blue exclusion method. h. BM PMN-MDSC from the LLC TB mice were treated with IKE for 6 hr, and then washed 3 times and followed by further 16 h incubation; cell numbers determined by trypan blue exclusion (n=4). i. PMN cell counts by supernatant generated from BM PMN isolated from WT mice and treated with indicated inhibitors or IKE after pre-treatment with inhibitors (n=3/group). Representative experiment of four shown. j. BM PMN of EL-4 TB mice were cultured with 10 ng/mL GM-CSF and tumor explant supernatant for 24 hr in normoxia or hypoxia (0.3% O2) with or without 1 μM liproxstatin-1 (Lip-1) and then cocultured with cell trace-labeled PMEL splenocytes in indicated ratios, in the presence ofcognate peptide (n=3/group). T cell proliferation was evaluated as above. Two experiments with the same results were performed. One-way ANOVA with Tukey’s HSD post-test performed. P values are shown on graphs. k. Suppression of T cell proliferation by supernatants of M-MDSC isolated from EL4 tumors of Alox12/15flCre− and Alox12/15flCre+ mice (n=6/group). T cell proliferation was determined by flow cytometry as CellTrace dye dilution in CD3+CD8+ cells and expressed as a percent of CD8+ T cells stimulated in the absence of supernatants, l, m. Effect of ACSL4 deletion on suppressive activity of PMN-MDSC. l. Expression of Acsl4 in PMN from Acsl4flCre+ and Acsl4flCre− mice. N=4. m. Suppression of T cell proliferation by supernatants of PMN-MDSC isolated from tumors and spleens of Acsl4flCre− and Acsl4flCre+ EL4-TB mice. T cell proliferation was determined by flow cytometry as CellTrace dye dilution in CD3+CD8+ cells and expressed as a percent of CD8+ T cells stimulated in the absence of supernatant. N=4. Mean ± SD are shown. P values were calculated in unpaired two-sided Student’s t-test and shown on graphs. *p < 0.0001.
Extended data Figure 4. Gene changes induced by ferroptosis induction.
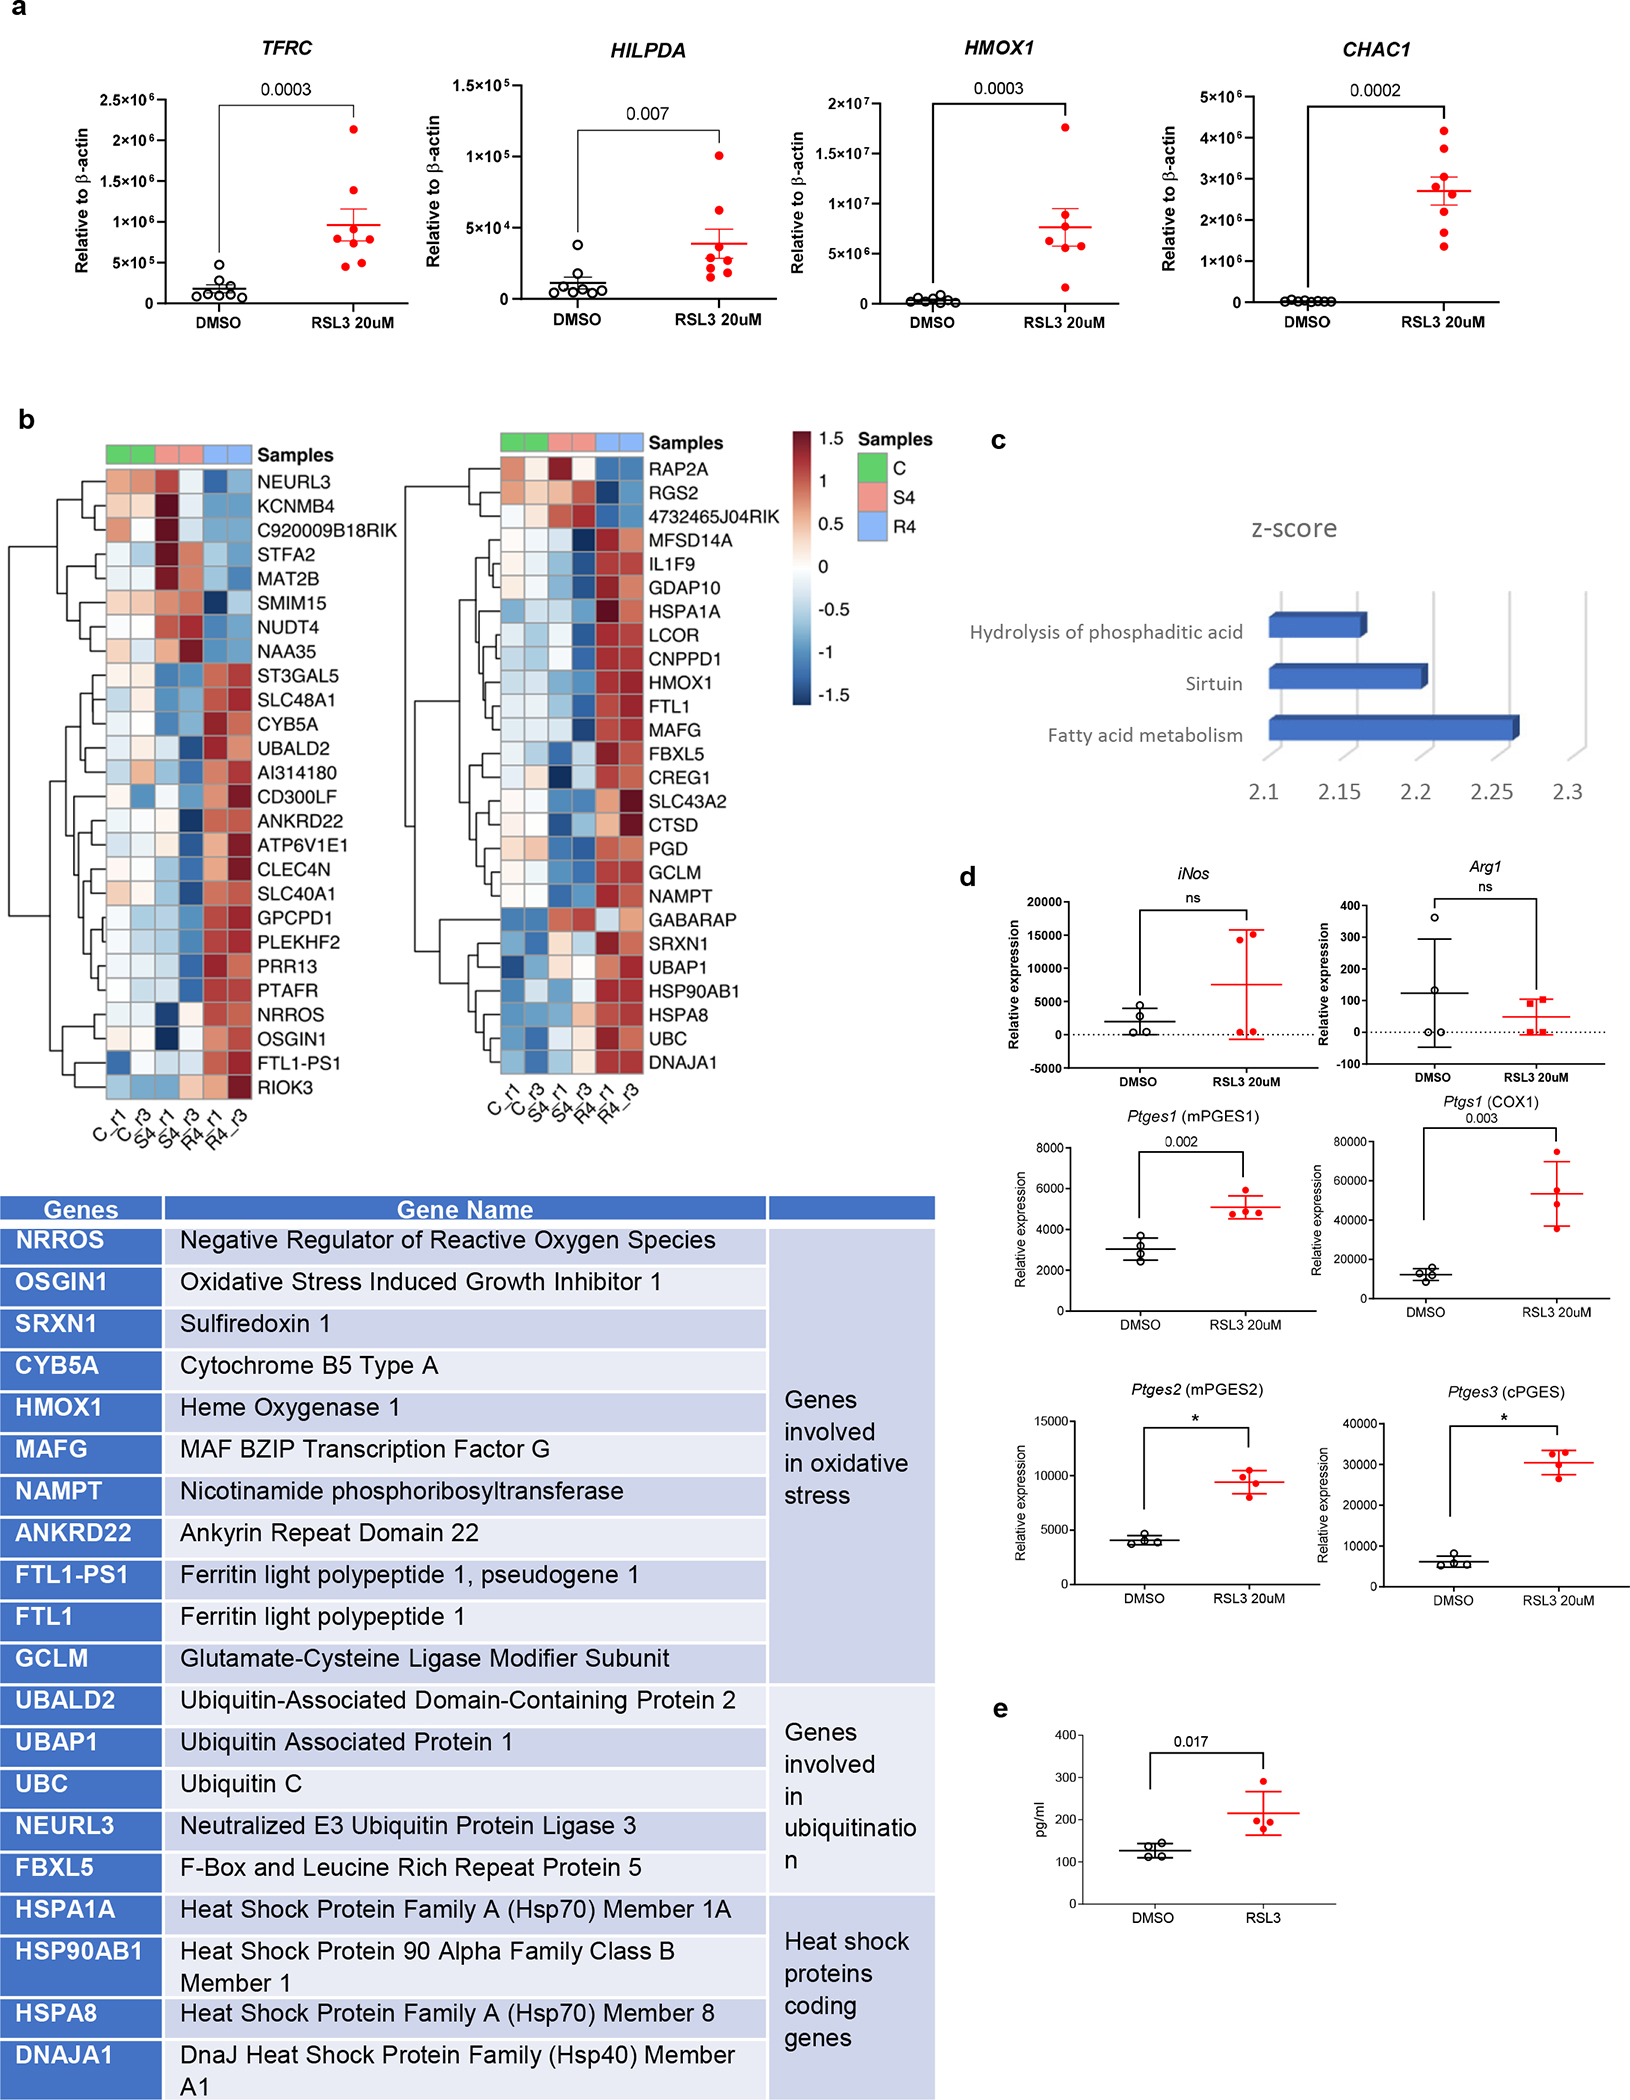
a. Expression of ferroptosis related genes measured by qRT-PCR in human BM PMN treated with RSL3. Mean ± SEM shown. P values on the graphs were calculated in unpaired two-sided Mann-Whitney test. N=8, except HMOX1 where n=7. b. RNA seq data of mice BM PMN treated for 4 hr with DMSO (C), 100nM staurosporine (S4) or 20uM RSL3 (R4). Color key represents the normalized Z score. Table shows functional attributes of the genes. c. Pathways/function changed in RSL3 treated BM PMN vs. control (DMSO) and staurosporine treated PMN; Z-score was calculated by Ingenuity Pathway Analysis where the z-score statistic is based on binomial disturution. http://pages.ingenuity.com/rs/ingenuity/images/0812%20downstream_effects_analysis_whitepaper.pdf. Only pathways that were different between groups with p<0.01 adjusted for multiple comparisons are shown. d. Expression of indicated genes in DMSO or 20uM RSL3 treated PMN measured by qRT-PCR. N=4. e. Concentration of released PGE2 levels by ELISA, in the supernatants of DMSO or 20uM RSL3 treated PMN after 8 hours. N=4. Mean ± SD shown in d,e. P values shown on graphs were calculated in unpaired two-sided Student’s t-test. *p < 0.0001
Extended data Figure 5. Effect of ALOX12/15 deletion on gene expression and metabolome of tumor PMN-MDSC.
a. GSEA enrichment analysis of ALOX12/15 KO vs control PMN-MDSC. NES, normalized enrichment score. P-value was calculated by GSEA based on permutation analysis. b, c. Transcription changes in Alox12/15 deficient PMN-MDSC. b. Top 25 up and downregulated genes. c. Gene set enrichment analysis using GSEA. NES score is shown. d. Metabolome of control and ALOX12/15 deficient tumor PMN-MDSC was evaluated by LC-MS. Ingenuity Pathway Analysis (IPA) was performed on differentially expressed metabolites - metabolites names were mapped to KEGG identifiers and given as input to IPA with default settings for metabolomics analysis. Pathways significantly up-regulated in ALOX12/15 deficient PMN-MDSC are shown. Changes considered significant if fold change >2 converted from Log2 ratio and Benjamini-Hochberg q-value corrected for multiple testing < 0.05.
Extended data Figure 6. Ferroptosis in genetically engeneered mice.
a. Ferroptosis related genes in PMN-MDSC from Fatp2flCre+ TB mice. qPCR of tumor PMN-MDSCs from Fatp2flCre− (WT) and Fatp2flCre+ (FATP2 KO) mice. N=3. Mean ± SD are shown. P values shown on graphs were calculated in unpaired two-sided Student’s t-test. b. Oxidized PE in ALOX12/15 deficient mice PMN-MDSC. Content of oxygenated (PE(38:4+1[O]) PE(38:4+2[O]) PE(36:4+2[O]) and non-oxygenated (PE(38:4) PE species in PMN MDSC isolated from LLC TB Alox12/15flCre− and Alox12/15flCre− mice tumors. N=3. Mean ± SD are shown. P values shown on graphs were calculated in unpaired two-sided Student’s t-test. c. Content of PE species containing oxygenated AA in PMN MDSC isolated from LLC TB WT and MPO KO mice. N=3. d. Liproxstatin-1 inhibits MPO (0.05U)/H2O2(50uM) induced formation of C18:0-Cl (left panel), PE-18:0p/20:4+3[O] (middle panel) and LPE(20:4+3[O]) (right panel) from PE(18:0p/20:4) in 20mM phosphate buffer containing 100 mM NaCl and 100uM DTPA, pH=7.4, after 30 min incubation at 37°C. The structure of PGE2 containing PE(18:0p/20+3[O]) was verified by three criteria (retention time (34 min), exact mass (m/z 798.5306 ± 3.3 ppm) and MS/MS fragments (m/z 798→351, 271, 189, 113). LPE(20:4+3[O]) was identified as PGE2 containing species by exact mass (m/z 548.2636 ± 3.4 ppm) and retention time (6 min). N=4. Mean ± SD are shown. P values shown on graphs were calculated in unpaired two-sided Student’s t-test (a) or one-way ANOVA with correction for multiple comparsons.
Extended data Figure 7. Ferroptosis induced PMN suppression is abrogated by inhibition of MPO.

a. BM PMNs were treated with 5 μM of MPO inhibitor (iMPO, 4-Aminobenzoic Acid Hydrazide, Cayman Chemical) for an hour followed by 6 h treatment with 40 μM IKE. The cells were washed 3 times then incubated with fresh media for 16 h. Supernatant was used for T cell proliferation assay. PMEL splenocytes were labeled with CellTrace dye and stimulated with cognate peptide in the presence of 50% of supernatant for 48 hr. Left panel - T cell proliferation measured by flow cytometry N=3. Four separate experiments are shown. Right panel – number of cells recovered after the incubation with IKE. N=4. Mean ± SD are shown. P values shown on graphs were calculated by one-way ANOVA with correction for multiple comparisons. * p<0.0001. b, c. GPX4 expression in tumor PMN-MDSC. b. GPX4 protein expression by Western blotting, in PMN-MDSC from BM, spleen and tumor of CT26 and EL4 TB mice. Results from individual mice are shown. c. GPX4 protein expression in BM PMN treated with increasing concentrations of supernatants obtained from tumor explants (TES) maintained under normoxic or hypoxic conditions. Three experients witt the same results were performed. For gel source data, see Supplementary Figure 1. d–f. Regulation of ferroptosis and suppressive activity in TAM by PMN-MDSC. TAM (CD11b+Ly6G− Ly6Clow F4/80+) were sorted from EL4 tumor. d. Contents of oxygenated phospholipid ferroptotic cell death signals, PE(38:4+2[O]) and PE (38:5+2[O]), in TAM isolated from WT, ALOX12/15 KO and MPO KO mice. n=4, p values were calculated in unpaired two-sided Student’s t-test, * - p<0.05, ** - p<0.01, *** - p<0.001. e. PGE2 contents in TAM from WT and ALOX KO mice (left panel) and WT and MPO KO mice (right panel). n=4, Mean ± SD are shown. P values were calculated in unpaired two-sided Student’s t-test. f. TAM isolated from S100A8-cre x ALOX12/15fl mice and their littermate controls were co-cultured with cell trace-labeled OT-1 splenocytes in the presence of 0.025 ng/mL SIINFEKL peptide. T cell proliferation was analyzed by flow cytometry after 2 days incubation. Proliferation of T cells in the absence of TAM in each experiment was set as 100%. Mean ± SD are shown. P values were calculated in two-sided unpaired Student’s t-test. (n=4)
Extended data Figure 8. Effect of liproxstatin-1 treatment on PMN-MDSC in vivo.
a. Tumor growth curve of DMSO and 15mg/kg liproxstatin-1 treated EL-4 and LLC TB mice (n=4/group). b. Suppression of T cell proliferation by PMN-MDSC isolated from tumors of EL-4 or LLC TB mice treated with liproxstatin-1. T cell proliferation was determined by flow cytometry as CellTrace dye dilution in CD3+CD8+ cells and expressed as a percent of CD8+ T cells stimulated in the absence of PMN-MDSC. N=4 DMSO group, n=7 Liproxstatin-1 group. c. PGE2 amount in supernatants after 3 hr incubation of PMN-MDSC isolated from CT-26 TB mice treated with DMSO or liproxstatin-1 mice for 8 days. N=8 d. Numbers of PMN (red staining, some stained cells indicated by white aroowheads) and T cells (green staining, some stained cells indicated by white astersks) by IF in tumors from DMSO and Liproxstatin-1 treated TB mice. N=5. Mean ± SEM shown in a and d, and mean ± SD in b-c. Unpaired, two-sided Stident’s t test was used in b and c, and two-sided Mann-Whitney test in d. e. Effect of PMN depletion on antitumor activity of liproxstatin-1. CT26 tumor cells were implanted subcutaneously into Balb/c mice. Mice were treated with DMSO or 15 mg/kg Liproxstatin-1 with or without Ly6G depletion starting from day 10 post inoculation (DMSO and Lirpoxstatin-1 groups n=10; DMSO Ly6G and Lyproxstatin-1 Ly6G groups n=8). Ly6G depletion was initiated 7 days post inoculation with 200μg/mouse anti-Ly6G (1A8) and 50μg/mouse anti-rat kappa light chain (MAR 18.5) every 3 days. Mean ± SD are shown. P values were calculated in two-way ANOVA.
Extended data Figure 9. Effect of IKE treatment on tumor growth and phenotype of T cells in liproxstatin-1 treated mice.
a. EG7 tumor growth in C57BL/6 mice treated with IKE (n=5/group). b. LC/MS quantitative assessment of ferroptotic cell death signals (PE(18:0/20:4-OOH), PE(18:1–20:4-OOH) and PE(18:0/22:4-OOH) in tumors from IKE treated CT26 TB mice. N=7 in DMSO group; N=8 in IKE group. Mean ± SEM shown in a and mean ± SD in b. P were determined by unpaired two-sided Student’s t-test. c,d. Phenotype of T cells in liproxstatin-1 treated mice. Flow cytometric analysis of percentages of subsets of T cells in CT26 TB mice c. lymph nodes and d. tumors 8 days after treatment with DMSO or liproxstatin-1. (n=10–20/group). Mean ± SD are shown. P values calculated in two-sided unpaired Student’s t test. Tem – effector memory T cells, Tcm – central memory T cell, and Trm-tissue resident memory T cells.
Extended data Figure 10. Single cell RNAseq of tumor tissues.
CT26 TB mice were treated with liproxstatin-1 for 8 days. Tumors were collected and analyzed by scRNAseq. a. UMAP visualization of cell populations; b. Gene set enrichment analysis of differentially expressed genes at adjusted p value <0.01 for liproxstatin-1 treated vs DMSO treated CD4+ and CD8+ T cells. Enrichment p-values were calculated as described in fgsea R package and p-values were adjusted using Benjamini-Hochberg method.
Extended data Figure 11. Induction of ferroptosis in human PMN.
a. qRT-PCR measurements of ferroptosis related genes in DMSO or 20uM RSL3 treated PMN isolated from peripheral blood of healthy individuals. N=8. b. PGE2 levels measured by ELISA in supernatants of DMSO or 20uM RSL3 treated PMN isolated from peripheral blood of healthy individuals. N=8 c. PGE2 levels measured by ELISA in supernatants of PMN-MDSC isolated from peripheral blood and tumors of patients with NSCLC. N=4. Mean ± SD are shown. P values were determined by unpaired two-sided Student’s t-test.
Extended data Figure 12. Correlation of ferroptosis signature with PMN-MDSC signature and clinical outcome in cancer patients.
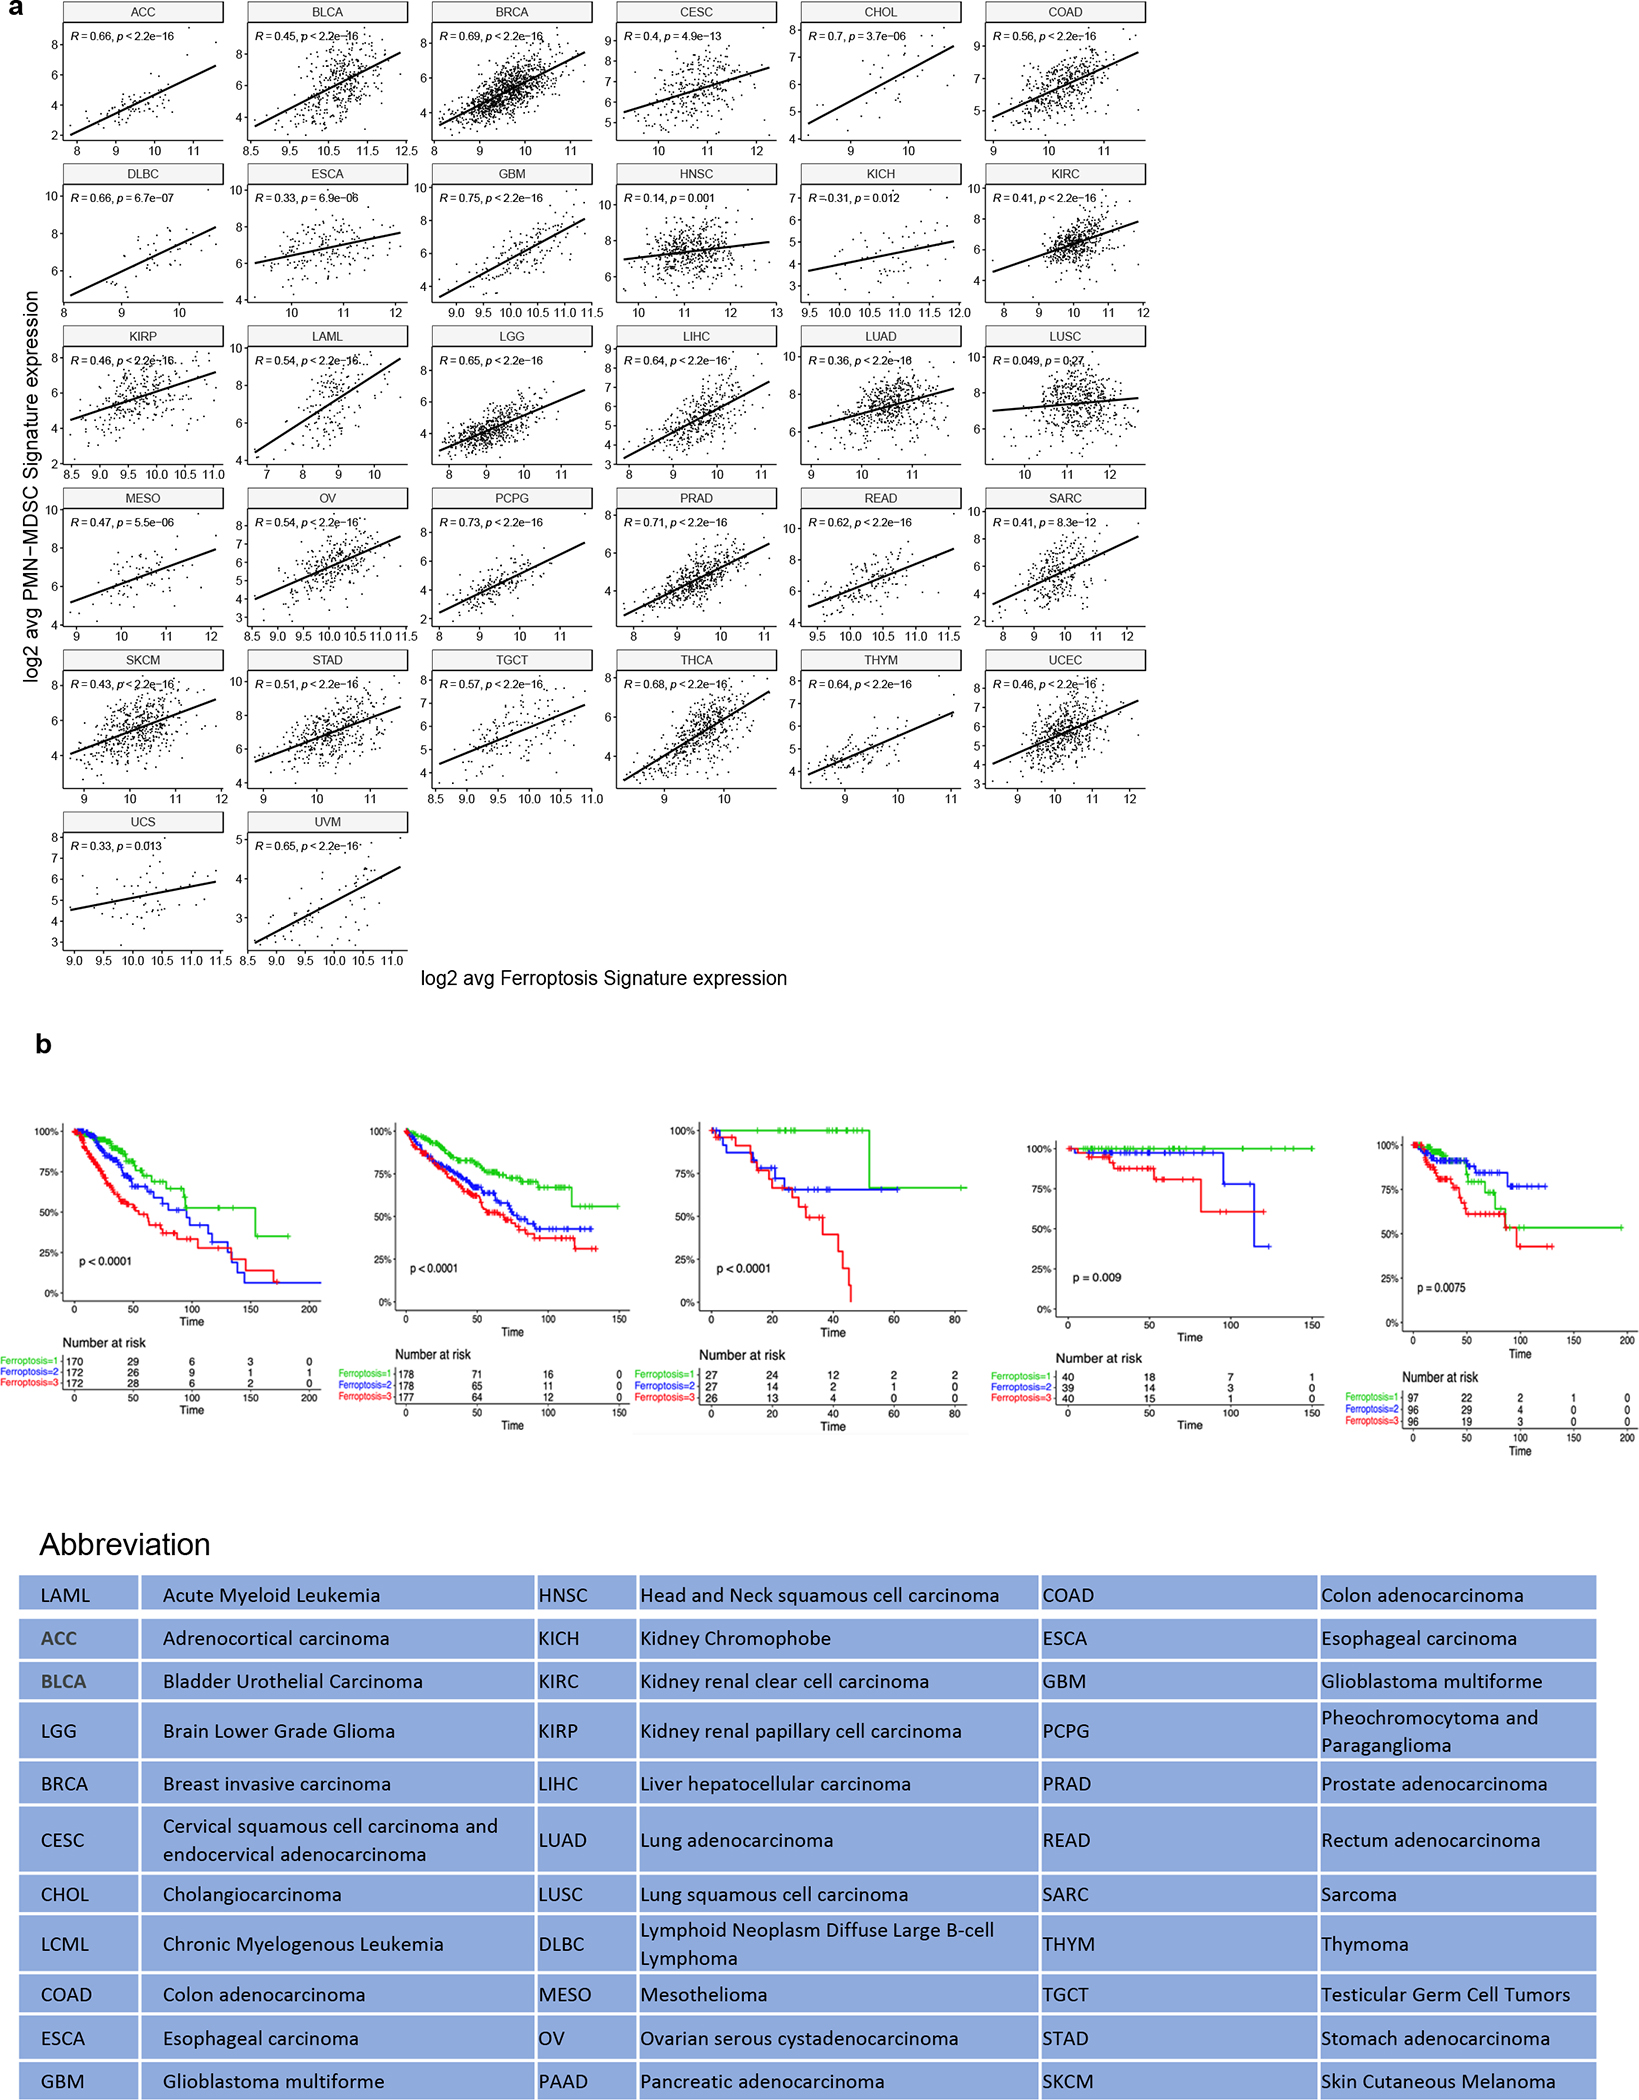
The data were obtained from TCGA database. a. Correlation between ferroptosis and PMN-MDSC signatures in patients with various tumors. Spearman’s correlation coefficient and associated probability (p value) was calculated. b. Association of ferroptosis signature and clinical outcome. Patient survival in top, mid, and bottom thirds of ferroptosis genes expression levels based on TCGA dataset. The number of patients in each group are shown on the graph. P values were calculated between high and low or intermediate third of gene expression using log-rank (Mantel-Cox) test.
Extended data Table 1. List of antibodies and gating strategies.
All antibodies are commercially available and were validated based on information provided by the supplier. Titration experiments were performed prior to the study
Supplementary Material
Acknowledgments
We would like to thank AstraZeneca Production Informatics and Tempus teams for providing RNAseq and clinical datasets, as well as Nick Barkas and Chris Rand, AstraZeneca Oncology Data Science for assistance in perfrming scRNAseq experiments. We thank Erin Bonner for technical assistance.
Funding:
This work was supported:
National Institute of Health grant AI156924 (VEK),
National Institute of Health grant CA243142 (VEK)
National Institute of Health grant CA165065 (VEK),
National Institute of Health grant 2T32DK007780-21 (RK),
National institute of Health grant R01 CA266342 (YN and VEK)
The University of Pennsylvania Biomedical Graduate Studies Program (RK),
The Wistar Institute Animal and Flow cytometry core facilities under Cancer Center Support Grant - P30 CA010815 (YN)
National Institute of Health grant P30-CA016520 (RHV)
National Institute of Health grant R01-CA-229803-01 (RHV)
National Institute of Health grant P30DK046200 (AG)
National Institute of Health grant DK108722 (AG)
Footnotes
Competing interests:
AH, GK, KH, RAH, NC, and DIG are employee and stakeholders of AstraZeneca.
Data and materials availability:
All data are available and all figures are supplied with raw data. RNAseq data were deposited to GEO, accession number GSE205371, scRNAseq data to GEO accession number GSE213861. Metabalomic data were submitted to Metabolomics Workbench: http://dev.metabolomicsworkbench.org:22222/data/DRCCMetadata.php?Mode=Study&StudyID=ST002160&Access=MvrS7201; http://dx.doi.org/10.21228/M87Q56. All data are publicly available.
References
- 1.Dierge E et al. Peroxidation of n-3 and n-6 polyunsaturated fatty acids in the acidic tumor environment leads to ferroptosis-mediated anticancer effects. Cell metabolism 33, 1701–1715 e1705, doi: 10.1016/j.cmet.2021.05.016 (2021). [DOI] [PubMed] [Google Scholar]
- 2.Zou Y et al. Plasticity of ether lipids promotes ferroptosis susceptibility and evasion. Nature 585, 603–608, doi: 10.1038/s41586-020-2732-8 (2020). [DOI] [PMC free article] [PubMed] [Google Scholar]
- 3.Condamine T, Mastio J & Gabrilovich DI Transcriptional regulation of myeloid-derived suppressor cells. J Leukoc Biol, doi: 10.1189/jlb.4RI0515-204R (2015). [DOI] [PMC free article] [PubMed] [Google Scholar]
- 4.Wang W, Xia X, Mao L & Wang S The CCAAT/Enhancer-Binding Protein Family: Its Roles in MDSC Expansion and Function. Frontiers in immunology 10, 1804, doi: 10.3389/fimmu.2019.01804 (2019). [DOI] [PMC free article] [PubMed] [Google Scholar]
- 5.Ostrand-Rosenberg S, Beury DW, Parker KH & Horn LA Survival of the fittest: how myeloid-derived suppressor cells survive in the inhospitable tumor microenvironment. Cancer Immunol Immunother 69, 215–221, doi: 10.1007/s00262-019-02388-8 (2020). [DOI] [PMC free article] [PubMed] [Google Scholar]
- 6.Veglia F, Perego M & Gabrilovich D Myeloid-derived suppressor cells coming of age. Nat Immunol 19, 108–119, doi: 10.1038/s41590-017-0022-x (2018). [DOI] [PMC free article] [PubMed] [Google Scholar]
- 7.Condamine T, Ramachandran I, Youn JI & Gabrilovich DI Regulation of tumor metastasis by myeloid-derived suppressor cells. Annual review of medicine 66, 97–110, doi: 10.1146/annurev-med-051013-052304 (2015). [DOI] [PMC free article] [PubMed] [Google Scholar]
- 8.Kumar V, Patel S, Tcyganov E & Gabrilovich DI The Nature of Myeloid-Derived Suppressor Cells in the Tumor Microenvironment. Trends Immunol 37, 208–220, doi: 10.1016/j.it.2016.01.004 (2016). [DOI] [PMC free article] [PubMed] [Google Scholar]
- 9.Veglia F et al. Analysis of classical neutrophils and polymorphonuclear myeloid-derived suppressor cells in cancer patients and tumor-bearing mice. J Exp Med 218, doi: 10.1084/jem.20201803 (2021). [DOI] [PMC free article] [PubMed] [Google Scholar]
- 10.Zhou J, Nefedova Y, Lei A & Gabrilovich D Neutrophils and PMN-MDSC: Their biological role and interaction with stromal cells. Semin Immunol 35, 19–28, doi: 10.1016/j.smim.2017.12.004 (2018). [DOI] [PMC free article] [PubMed] [Google Scholar]
- 11.Zhang Y et al. Single-cell transcriptome analysis reveals tumor immune microenvironment heterogenicity and granulocytes enrichment in colorectal cancer liver metastases. Cancer Lett 470, 84–94, doi: 10.1016/j.canlet.2019.10.016 (2020). [DOI] [PubMed] [Google Scholar]
- 12.Hadian K & Stockwell BR SnapShot: Ferroptosis. Cell 181, 1188–1188 e1181, doi: 10.1016/j.cell.2020.04.039 (2020). [DOI] [PMC free article] [PubMed] [Google Scholar]
- 13.Chu B et al. ALOX12 is required for p53-mediated tumour suppression through a distinct ferroptosis pathway. Nat Cell Biol 21, 579–591, doi: 10.1038/s41556-019-0305-6 (2019). [DOI] [PMC free article] [PubMed] [Google Scholar]
- 14.Kuang F, Liu J, Xie Y, Tang D & Kang R MGST1 is a redox-sensitive repressor of ferroptosis in pancreatic cancer cells. Cell Chem Biol 28, 765–775 e765, doi: 10.1016/j.chembiol.2021.01.006 (2021). [DOI] [PubMed] [Google Scholar]
- 15.Yan B et al. Membrane Damage during Ferroptosis Is Caused by Oxidation of Phospholipids Catalyzed by the Oxidoreductases POR and CYB5R1. Mol Cell 81, 355–369 e310, doi: 10.1016/j.molcel.2020.11.024 (2021). [DOI] [PubMed] [Google Scholar]
- 16.Stockwell BR et al. Ferroptosis: A Regulated Cell Death Nexus Linking Metabolism, Redox Biology, and Disease. Cell 171, 273–285, doi: 10.1016/j.cell.2017.09.021 (2017). [DOI] [PMC free article] [PubMed] [Google Scholar]
- 17.Zilionis R et al. Single-Cell Transcriptomics of Human and Mouse Lung Cancers Reveals Conserved Myeloid Populations across Individuals and Species. Immunity 50, 1317–1334 e1310, doi: 10.1016/j.immuni.2019.03.009 (2019). [DOI] [PMC free article] [PubMed] [Google Scholar]
- 18.Yang WS & Stockwell BR Ferroptosis: Death by Lipid Peroxidation. Trends in cell biology 26, 165–176, doi: 10.1016/j.tcb.2015.10.014 (2016). [DOI] [PMC free article] [PubMed] [Google Scholar]
- 19.Tyurina YY et al. “Redox lipidomics technology: Looking for a needle in a haystack”. Chem Phys Lipids 221, 93–107, doi: 10.1016/j.chemphyslip.2019.03.012 (2019). [DOI] [PMC free article] [PubMed] [Google Scholar]
- 20.Kapralov AA et al. Redox lipid reprogramming commands susceptibility of macrophages and microglia to ferroptotic death. Nature chemical biology 16, 278–290, doi: 10.1038/s41589-019-0462-8 (2020). [DOI] [PMC free article] [PubMed] [Google Scholar]
- 21.Kagan VE et al. Oxidized arachidonic and adrenic PEs navigate cells to ferroptosis. Nature chemical biology 13, 81–90, doi: 10.1038/nchembio.2238 (2017). [DOI] [PMC free article] [PubMed] [Google Scholar]
- 22.Gaschler MM et al. FINO2 initiates ferroptosis through GPX4 inactivation and iron oxidation. Nature chemical biology 14, 507–515, doi: 10.1038/s41589-018-0031-6 (2018). [DOI] [PMC free article] [PubMed] [Google Scholar]
- 23.Wiernicki B et al. Excessive phospholipid peroxidation distinguishes ferroptosis from other cell death modes including pyroptosis. Cell death & disease 11, 922, doi: 10.1038/s41419-020-03118-0 (2020). [DOI] [PMC free article] [PubMed] [Google Scholar]
- 24.Mao G et al. Mitochondrial Redox Opto-Lipidomics Reveals Mono-Oxygenated Cardiolipins as Pro-Apoptotic Death Signals. ACS Chem Biol 11, 530–540, doi: 10.1021/acschembio.5b00737 (2016). [DOI] [PMC free article] [PubMed] [Google Scholar]
- 25.Feng H et al. Transferrin Receptor Is a Specific Ferroptosis Marker. Cell reports 30, 3411–3423 e3417, doi: 10.1016/j.celrep.2020.02.049 (2020). [DOI] [PMC free article] [PubMed] [Google Scholar]
- 26.He YM et al. Transitory presence of myeloid-derived suppressor cells in neonates is critical for control of inflammation. Nat Med 24, 224–231, doi: 10.1038/nm.4467 (2018). [DOI] [PMC free article] [PubMed] [Google Scholar]
- 27.Veglia F et al. Fatty acid transport protein 2 reprograms neutrophils in cancer. Nature 569, 73–78, doi: 10.1038/s41586-019-1118-2 (2019). [DOI] [PMC free article] [PubMed] [Google Scholar]
- 28.Boivin G et al. Durable and controlled depletion of neutrophils in mice. Nature communications 11, 2762, doi: 10.1038/s41467-020-16596-9 (2020). [DOI] [PMC free article] [PubMed] [Google Scholar]
- 29.Beaubier N et al. Clinical validation of the Tempus xO assay. Oncotarget 9, 25826–25832, doi: 10.18632/oncotarget.25381 (2018). [DOI] [PMC free article] [PubMed] [Google Scholar]
- 30.Gabrilovich DI Myeloid-Derived Suppressor Cells. Cancer Immunol Res 5, 3–8, doi: 10.1158/2326-6066.CIR-16-0297 (2017). [DOI] [PMC free article] [PubMed] [Google Scholar]
- 31.Yang WS et al. Regulation of ferroptotic cancer cell death by GPX4. Cell 156, 317–331, doi: 10.1016/j.cell.2013.12.010 (2014). [DOI] [PMC free article] [PubMed] [Google Scholar]
- 32.Zelenay S et al. Cyclooxygenase-Dependent Tumor Growth through Evasion of Immunity. Cell 162, 1257–1270, doi: 10.1016/j.cell.2015.08.015 (2015). [DOI] [PMC free article] [PubMed] [Google Scholar]
- 33.Viswanathan VS et al. Dependency of a therapy-resistant state of cancer cells on a lipid peroxidase pathway. Nature 547, 453–457, doi: 10.1038/nature23007 (2017). [DOI] [PMC free article] [PubMed] [Google Scholar]
- 34.Hangauer MJ et al. Drug-tolerant persister cancer cells are vulnerable to GPX4 inhibition. Nature 551, 247–250, doi: 10.1038/nature24297 (2017). [DOI] [PMC free article] [PubMed] [Google Scholar]
- 35.Tsoi J et al. Multi-stage Differentiation Defines Melanoma Subtypes with Differential Vulnerability to Drug-Induced Iron-Dependent Oxidative Stress. Cancer Cell 33, 890–904 e895, doi: 10.1016/j.ccell.2018.03.017 (2018). [DOI] [PMC free article] [PubMed] [Google Scholar]
- 36.Zhang Y et al. Imidazole Ketone Erastin Induces Ferroptosis and Slows Tumor Growth in a Mouse Lymphoma Model. Cell Chem Biol 26, 623–633 e629, doi: 10.1016/j.chembiol.2019.01.008 (2019). [DOI] [PMC free article] [PubMed] [Google Scholar]
- 37.Badgley MA et al. Cysteine depletion induces pancreatic tumor ferroptosis in mice. Science 368, 85–89, doi: 10.1126/science.aaw9872 (2020). [DOI] [PMC free article] [PubMed] [Google Scholar]
- 38.Yi J, Zhu J, Wu J, Thompson CB & Jiang X Oncogenic activation of PI3K-AKT-mTOR signaling suppresses ferroptosis via SREBP-mediated lipogenesis. Proc Natl Acad Sci U S A 117, 31189–31197, doi: 10.1073/pnas.2017152117 (2020). [DOI] [PMC free article] [PubMed] [Google Scholar]
- 39.Shiromizu S et al. Dosing Time-Dependent Changes in the Anti-tumor Effect of xCT Inhibitor Erastin in Human Breast Cancer Xenograft Mice. Biol Pharm Bull 42, 1921–1925, doi: 10.1248/bpb.b19-00546 (2019). [DOI] [PubMed] [Google Scholar]
- 40.Wu X et al. Regulation of GSK3beta/Nrf2 signaling pathway modulated erastin-induced ferroptosis in breast cancer. Mol Cell Biochem 473, 217–228, doi: 10.1007/s11010-020-03821-8 (2020). [DOI] [PubMed] [Google Scholar]
- 41.Shibata Y, Yasui H, Higashikawa K, Miyamoto N & Kuge Y Erastin, a ferroptosis-inducing agent, sensitized cancer cells to X-ray irradiation via glutathione starvation in vitro and in vivo. PloS one 14, e0225931, doi: 10.1371/journal.pone.0225931 (2019). [DOI] [PMC free article] [PubMed] [Google Scholar]
- 42.Huo H et al. Erastin Disrupts Mitochondrial Permeability Transition Pore (mPTP) and Induces Apoptotic Death of Colorectal Cancer Cells. PloS one 11, e0154605, doi: 10.1371/journal.pone.0154605 (2016). [DOI] [PMC free article] [PubMed] [Google Scholar]
- 43.Yang Y et al. Nedd4 ubiquitylates VDAC2/3 to suppress erastin-induced ferroptosis in melanoma. Nature communications 11, 433, doi: 10.1038/s41467-020-14324-x (2020). [DOI] [PMC free article] [PubMed] [Google Scholar]
- 44.Wang W et al. CD8+ T cells regulate tumour ferroptosis during cancer immunotherapy. Nature 569, 270–274, doi: 10.1038/s41586-019-1170-y (2019). [DOI] [PMC free article] [PubMed] [Google Scholar]
- 45.Ma X et al. CD36-mediated ferroptosis dampens intratumoral CD8(+) T cell effector function and impairs their antitumor ability. Cell metabolism 33, 1001–1012 e1005, doi: 10.1016/j.cmet.2021.02.015 (2021). [DOI] [PMC free article] [PubMed] [Google Scholar]
- 46.Xu S et al. Uptake of oxidized lipids by the scavenger receptor CD36 promotes lipid peroxidation and dysfunction in CD8(+) T cells in tumors. Immunity 54, 1561–1577 e1567, doi: 10.1016/j.immuni.2021.05.003 (2021). [DOI] [PMC free article] [PubMed] [Google Scholar]
- 47.Bayne LJ et al. Tumor-derived granulocyte-macrophage colony-stimulating factor regulates myeloid inflammation and T cell immunity in pancreatic cancer. Cancer Cell 21, 822–835 (2012). [DOI] [PMC free article] [PubMed] [Google Scholar]
References in Methods
- 48.Killion EA et al. A role for long-chain acyl-CoA synthetase-4 (ACSL4) in diet-induced phospholipid remodeling and obesity-associated adipocyte dysfunction. Mol Metab 9, 43–56, doi: 10.1016/j.molmet.2018.01.012 (2018). [DOI] [PMC free article] [PubMed] [Google Scholar]
- 49.Langmead B & Salzberg SL Fast gapped-read alignment with Bowtie 2. Nat Methods 9, 357–359, doi: 10.1038/nmeth.1923 (2012). [DOI] [PMC free article] [PubMed] [Google Scholar]
- 50.Li B & Dewey CN RSEM: accurate transcript quantification from RNA-Seq data with or without a reference genome. BMC bioinformatics 12, 323, doi: 10.1186/1471-2105-12-323 (2011). [DOI] [PMC free article] [PubMed] [Google Scholar]
- 51.Love MI, Huber W & Anders S Moderated estimation of fold change and dispersion for RNA-seq data with DESeq2. Genome biology 15, 550, doi: 10.1186/s13059-014-0550-8 (2014). [DOI] [PMC free article] [PubMed] [Google Scholar]
- 52.Wolf FA, Angerer P & Theis FJ SCANPY: large-scale single-cell gene expression data analysis. Genome biology 19, 15, doi: 10.1186/s13059-017-1382-0 (2018). [DOI] [PMC free article] [PubMed] [Google Scholar]
- 53.Hao Y et al. Integrated analysis of multimodal single-cell data. Cell 184, 3573–3587 e3529, doi: 10.1016/j.cell.2021.04.048 (2021). [DOI] [PMC free article] [PubMed] [Google Scholar]
- 54.Sonabend R, Kiraly FJ, Bender A, Bischl B & Lang M mlr3proba: An R Package for Machine Learning in Survival Analysis. Bioinformatics, doi: 10.1093/bioinformatics/btab039 (2021). [DOI] [PMC free article] [PubMed] [Google Scholar]
- 55.Sun WY et al. Phospholipase iPLA2beta averts ferroptosis by eliminating a redox lipid death signal. Nature chemical biology 17, 465–476, doi: 10.1038/s41589-020-00734-x (2021). [DOI] [PMC free article] [PubMed] [Google Scholar]
Associated Data
This section collects any data citations, data availability statements, or supplementary materials included in this article.
Supplementary Materials
Data Availability Statement
All data are available and all figures are supplied with raw data. RNAseq data were deposited to GEO, accession number GSE205371, scRNAseq data to GEO accession number GSE213861. Metabalomic data were submitted to Metabolomics Workbench: http://dev.metabolomicsworkbench.org:22222/data/DRCCMetadata.php?Mode=Study&StudyID=ST002160&Access=MvrS7201; http://dx.doi.org/10.21228/M87Q56. All data are publicly available.