Abstract
The lineage and developmental trajectory of a cell are key determinants of cellular identity. In the vascular system, endothelial cells (ECs) of blood and lymphatic vessels (LVs) differentiate and specialize to cater the unique physiological demands of each organ1,2. While LVs were shown to derive from multiple cellular origins, lymphatic ECs (LECs) are not known to generate other cell-types3,4. Here, we use recurrent imaging and lineage-tracing of ECs in zebrafish anal fins (AF), from early development through adulthood, to uncover an unexpected mechanism of specialized blood vessel formation through transdifferentiation of LECs. Moreover, we demonstrate that deriving AF vessels from lymphatic vs. blood ECs results in functional differences in the adult organism, uncovering a link between cell ontogeny and functionality. We further use scRNA-seq to characterize the different cellular populations and transition states involved in the transdifferentiation process. Finally, we show that akin to normal development, the vasculature is re-derived from lymphatics during AF regeneration, demonstrating that LECs in adult fish retain both potency and plasticity for generating blood ECs. Overall, our work highlights a new innate mechanism of blood vessel formation through LEC transdifferentiation, and provides in vivo evidence for a link between cell ontogeny and functionality in ECs.
Through lifetime, blood and lymphatic vessels acquire distinct organotypic specializations to properly serve the organ needs1,2. Here, we focus on the zebrafish anal fin (AF) (Fig. 1a), an adult-specific structure established during metamorphosis5,6 (Fig. 1a,a’), which is vascularized by secondary vessels (SVs)- a specialized blood vessel type carrying intermittent erythrocyte flow7–9. While extensive work has been devoted to understand the physiology of this peculiar blood vessel type10,11, their origins, molecular features and specialization mechanisms, remain unexplored12.
Fig. 1: Stepwise formation of the AF vasculature.
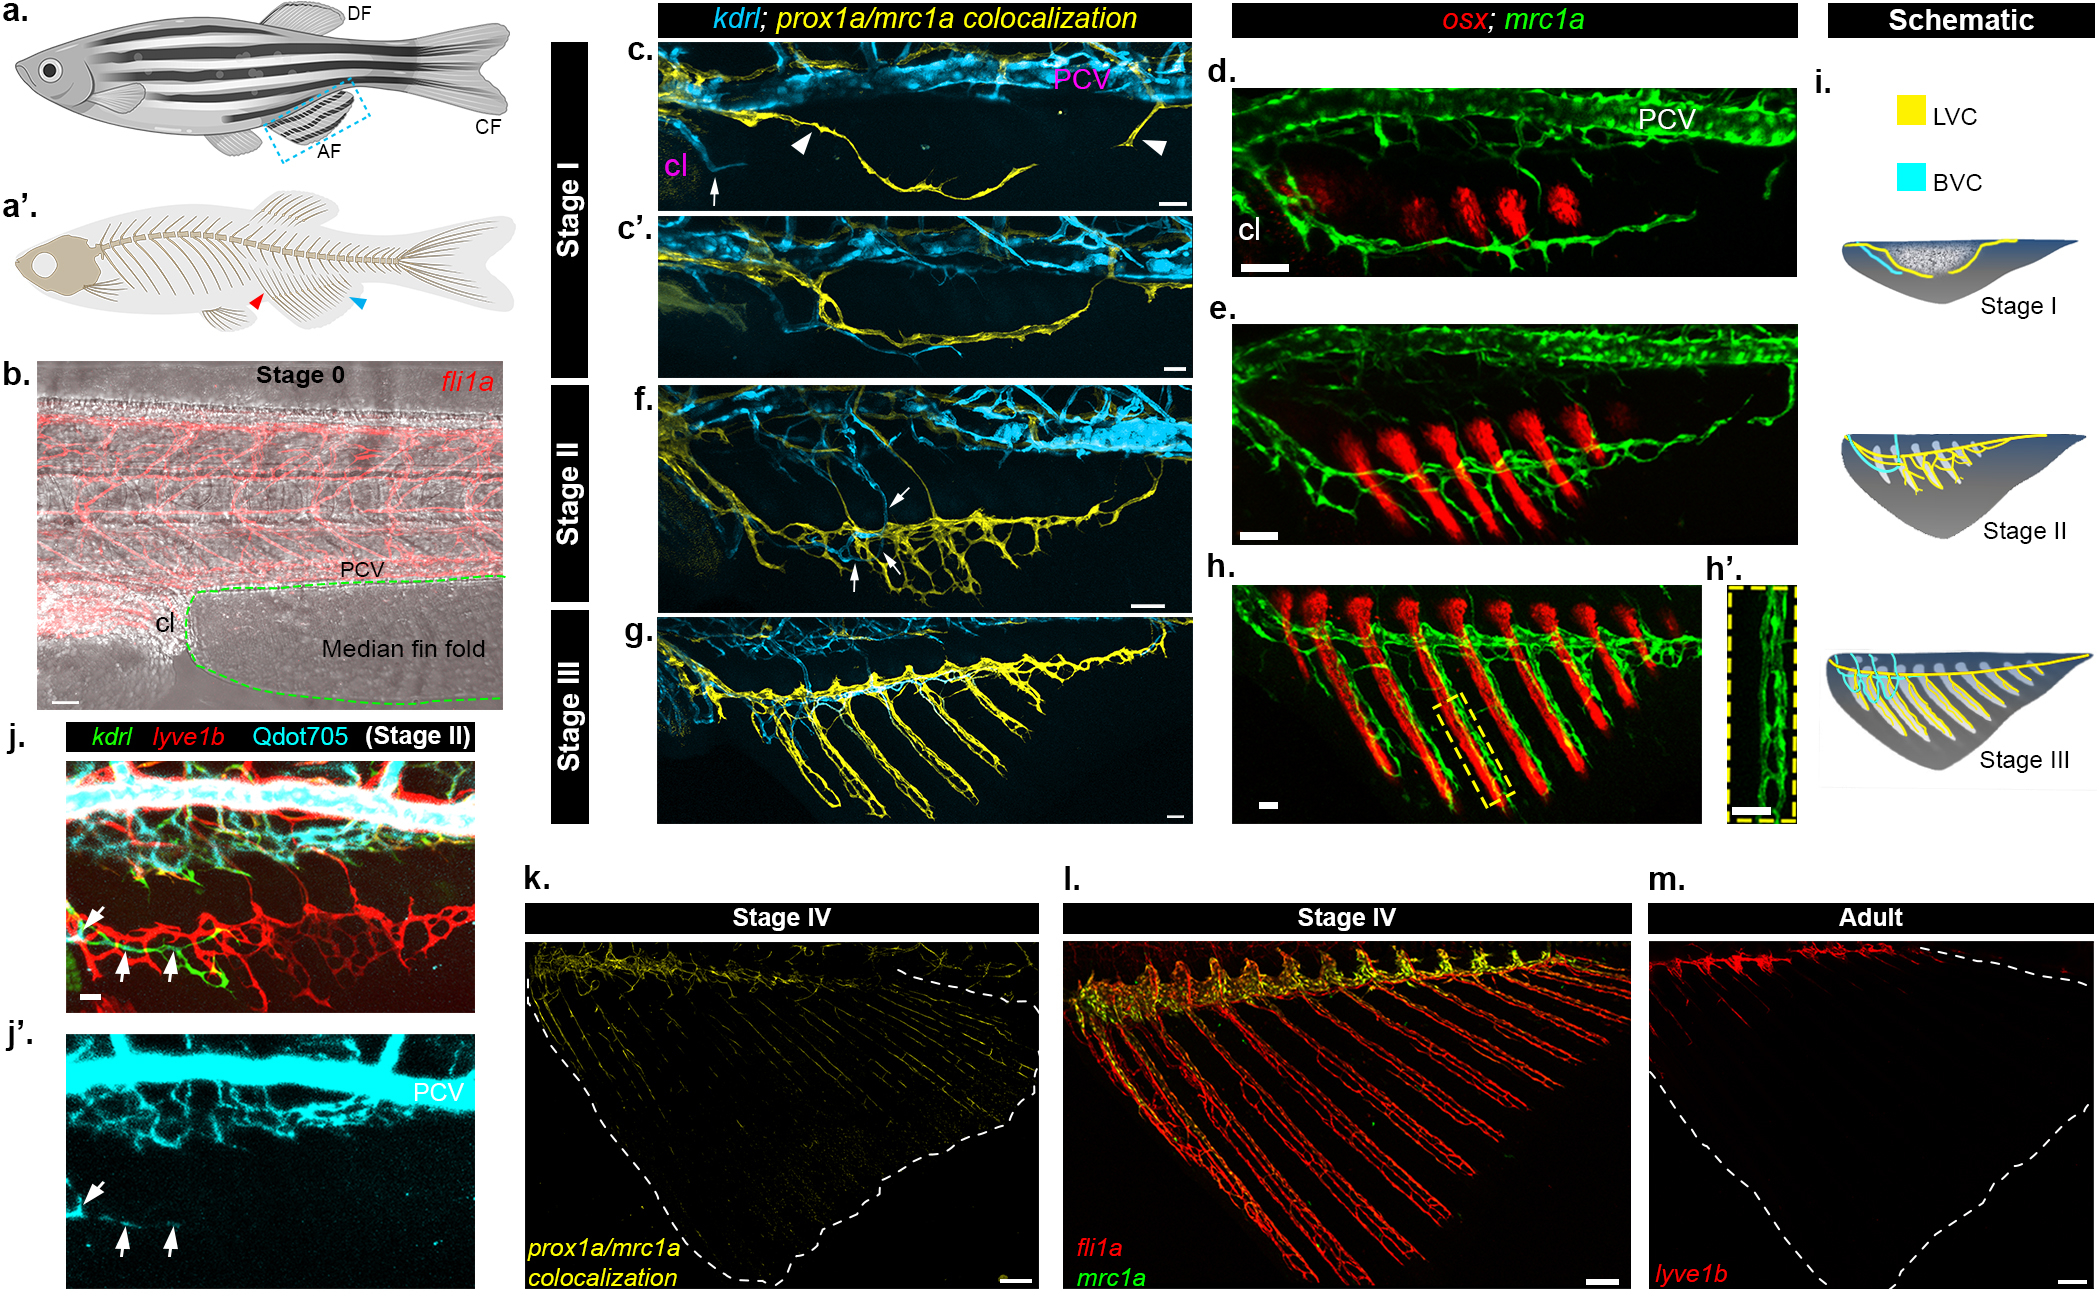
a-a’, Illustrations of adult zebrafish depicting the location of the anal (AF, blue box) dorsal (DF) and caudal (CF) fins (a), and general skeletal structure (a’). Red arrowhead points to internal (endochondral) radial bones, blue arrowhead marks external dermal bones (rays) of AF. b, fli1a:dsRed+ ECs are not detected in the median fin fold (demarcated by green dashed line) prior to the initiation of AF development (Stage 0). c-h’, Formation of vascular and bony structures during AF formation – stage I (c-d), stage II (e,f), stage III (g-h’). LVC is labeled by prox1a/mrc1a colocalization (c,c’,f,g, yellow) or mrc1a:GFP (d,e,h,h’, green); blood vessels are highlighted by kdrl:BFP (c,c’,f,g, blue) and osteoblasts by osx:mCherry (d,e,h, red). Arrowheads in (c) point to anterior and posterior lymphatic sprouts; arrows in (c,f) point to AF BVC. h’, high magnification of single ray (yellow dashed box in (h)) depicting associated LVC. i, Schematic illustrating the development of LVC (yellow), BVC (blue) and bony (white) components of the AF. j-j’, Intravascularly injected Qdot705 are detected in kdrl:GFP+ BVC (arrows) of stage II AF, but not in lyve1b:dsRed labelled LVC (red). k-m, Lymphatic markers are lost in stage IV AFs (AF boundaries demarcated by white dots), as depicted by prox1a/mrc1a co-localization channel (k, yellow) and mrc1a:GFP (l, green) expression. Intact fli1a:dsRed+ vasculature is present in stage IV AFs (l, red). m, Lymphatic vessels (lyve1b) are absent from adult AFs. Scale bars, 30 mm (c,c’,h,h’,j), 50mm (b,d,e,f,g), 100μm (l), 150μm (k). LVC, Lymphatic vascular component, BVC, Blood vascular component, PCV, Posterior cardinal vein, cl, Cloaca.
To study the formation of the AF vasculature, we used Tg(mrc1a:egfp);(prox1aBAC:KalTA4–4xUAS-E1b:uncTagRFP) reporters, whose co-localization labels bona fide lymphatic vessels (Extended Data Fig. 1a–e’), in combination with Tg(kdrl:BFP), thereby enabling simultaneous examination of the lymphatic (mrc1a+;prox1a+) and blood (kdrl+;prox1a−) vessel components (Extended Data Fig. 1f–f”). In parallel, we tracked bone formation in Tg(osx:mCherry) fish. Using recurrent imaging of individual animals between 15–30 dpf, we defined four stages of AF vascular formation (Extended Data Fig. 1g–j; Table 1). At Stage 0, before AF appearance, the median fin fold area is devoid of ECs (Fig. 1b). As AF development begins (Extended Data Fig. 1g), lymphatic sprouts arising from the thoracic duct (TD) and the cardinal collateral lymphatic vessel (CCL)13 enter the anterior and posterior poles of the AF (Stage I, Fig. 1c; Extended Data Fig. 1k) and merge to form a lymphatic arc (Fig. 1c’; Extended Data Fig. 1k’). Concomitantly, kdrl:BFP+ sprouts from the posterior cardinal vein (PCV) and cloacal (cl) blood vessels, penetrate the AF as well (Fig. 1c,c’; Extended Data Fig. 1k,k’). As the fin rays elongate (Fig. 1d,e; Extended Data Fig. 1h,i), the Lymphatic Vascular Component (LVC) of the AF ramifies (Stage II, Fig. 1f, Extended Data Fig. 1l) and grows along the developing bones (Stage III, Fig 1g–h’; Extended Data Fig. 1m). Conversely, the Blood Vascular Component (BVC) remains restricted to the dorso-anterior area (Fig. 1f,g; Extended Data Fig. 1l,m). Similar mechanisms underlie the formation of the Dorsal Fin (DF) that develops at comparable stages (Extended Data Fig. 1n–n”). The notable prevalence of the LVC over the BVC in the developing fins (Fig. 1i) is striking, given that in most cases, lymphangiogenesis lags behind blood vessel growth2,13–15.
Multiple lines of evidence support the lymphatic identity of these vessels. First, they are directly connected to trunk lymphatics (Extended Data Fig. 2a–a”; Supplementary Video 1) and besides prox1a and mrc1a, they express also Tg(lyve1b:dsRed) (Extended Data Fig. 2b–d). In addition, prox1 mRNA expression was specifically detected in the mrc1a:GFP+ LVC, but not in kdrl:GFP+ BVC, whereas pan-endothelial fli1a mRNA puncta were observed in all vessels (Extended Data Fig. 2e–j). Finally, the lymphatic vs. blood vessel identity was functionally confirmed through time-lapse imaging of Tg(gata1a:dsRed) that showed erythrocyte flow only in BVC vessels (Supplementary Video 2), and by Qdot705 angiography16 that resulted in sole kdrl+ BVC labeling (Fig. 1j,j’). Hence, our anatomical, molecular and functional analyses demonstrate that the development of the AF is specifically associated with lymphatic, rather than blood vessel growth.
We wondered why, in spite of the presence of conventional blood vessels near the AF (e.g., PCV, BVC), the tissue utilizes a lymphatic source for vascularization. One potential outcome of such unusual mechanism would be the creation of a local hypoxic environment, largely regarded as key for chondrogenesis and osteogenesis17, while enabling delivery of factors required for bone formation and growth. Indeed, when calcein was injected subcutaneously16,18,19 in the anterior trunk, it rapidly reached the lumen of the AF lymphatics, developing bones and associated mesenchyme (Extended Data Fig. 2k–k”), suggesting that the initial LVC delivers solutes to the AF while maintaining a hypoxic microenvironment (Extended Data Fig. 2,l,l’).
Strikingly, as AF growth proceeds, the expression of lymphatic markers is lost along the fin rays (Stage IV, Fig. 1k; Extended Data Fig. 2m,n). This reduction was not due to vessel pruning or retraction, as all fin vessels were detected in Tg(fli1a:dsRed) adult animals albeit with no lymphatic marker expression (Fig. 1l,m; Extended Data Fig. 2o). Moreover, intravascular injection of Qdot705 indicated that the adult AF vessels are fully lumenized and connected to blood circulation (Extended Data Fig. 2p,p’), suggesting they have acquired a blood vessel fate.
To investigate whether the AF plexus forms via transdifferentiation of the initial lymphatic network, we established a conditional EC-specific multicolor lineage tracing system (Extended Data Fig. 3a,b) (referred as ‘flibow’) and used multispectral confocal imaging to obtain the ‘spectral signature’ of individual ECs (Extended Data Fig. 3c–j’). We induced recombination at 2.5 dpf, selected larvae with differentially labeled trunk lymphatics at 6–10 dpf (prior to AF formation), and imaged them separately, every 2–4 days, to trace the formation of the AF vasculature (Table 2). As seen in sequential images of the same animal (Fig. 2a–e), we detected distinctly labelled TD and sprouts of matching clonal identity (green), penetrating the AF (Fig. 2a,b), generating the Stage II plexus (Fig. 2c) and growing along the bones (Fig. 2d,e). When extended through adult stages, our analyses indicated that the entire AF vasculature is derived from a few LECs colonizing the early AF (Fig. 2f,g). Overall, uniquely labeled clones in mature fin ray vessels, were traced back to Stage I/II lymphatic-derived sprouts of identical colors, in 95% AFs (Table 2 and Extended Data Fig. 4a). Moreover, no contribution of labeled BVC clones was detected in 98% of analysed AF ray vessels and no new colors were observed in ~94% of the cases (Table 2 and Extended Data Fig. 4a–c’).
Fig. 2: Lymphatic vessels give rise to the adult AF vasculature via transdifferentiation.
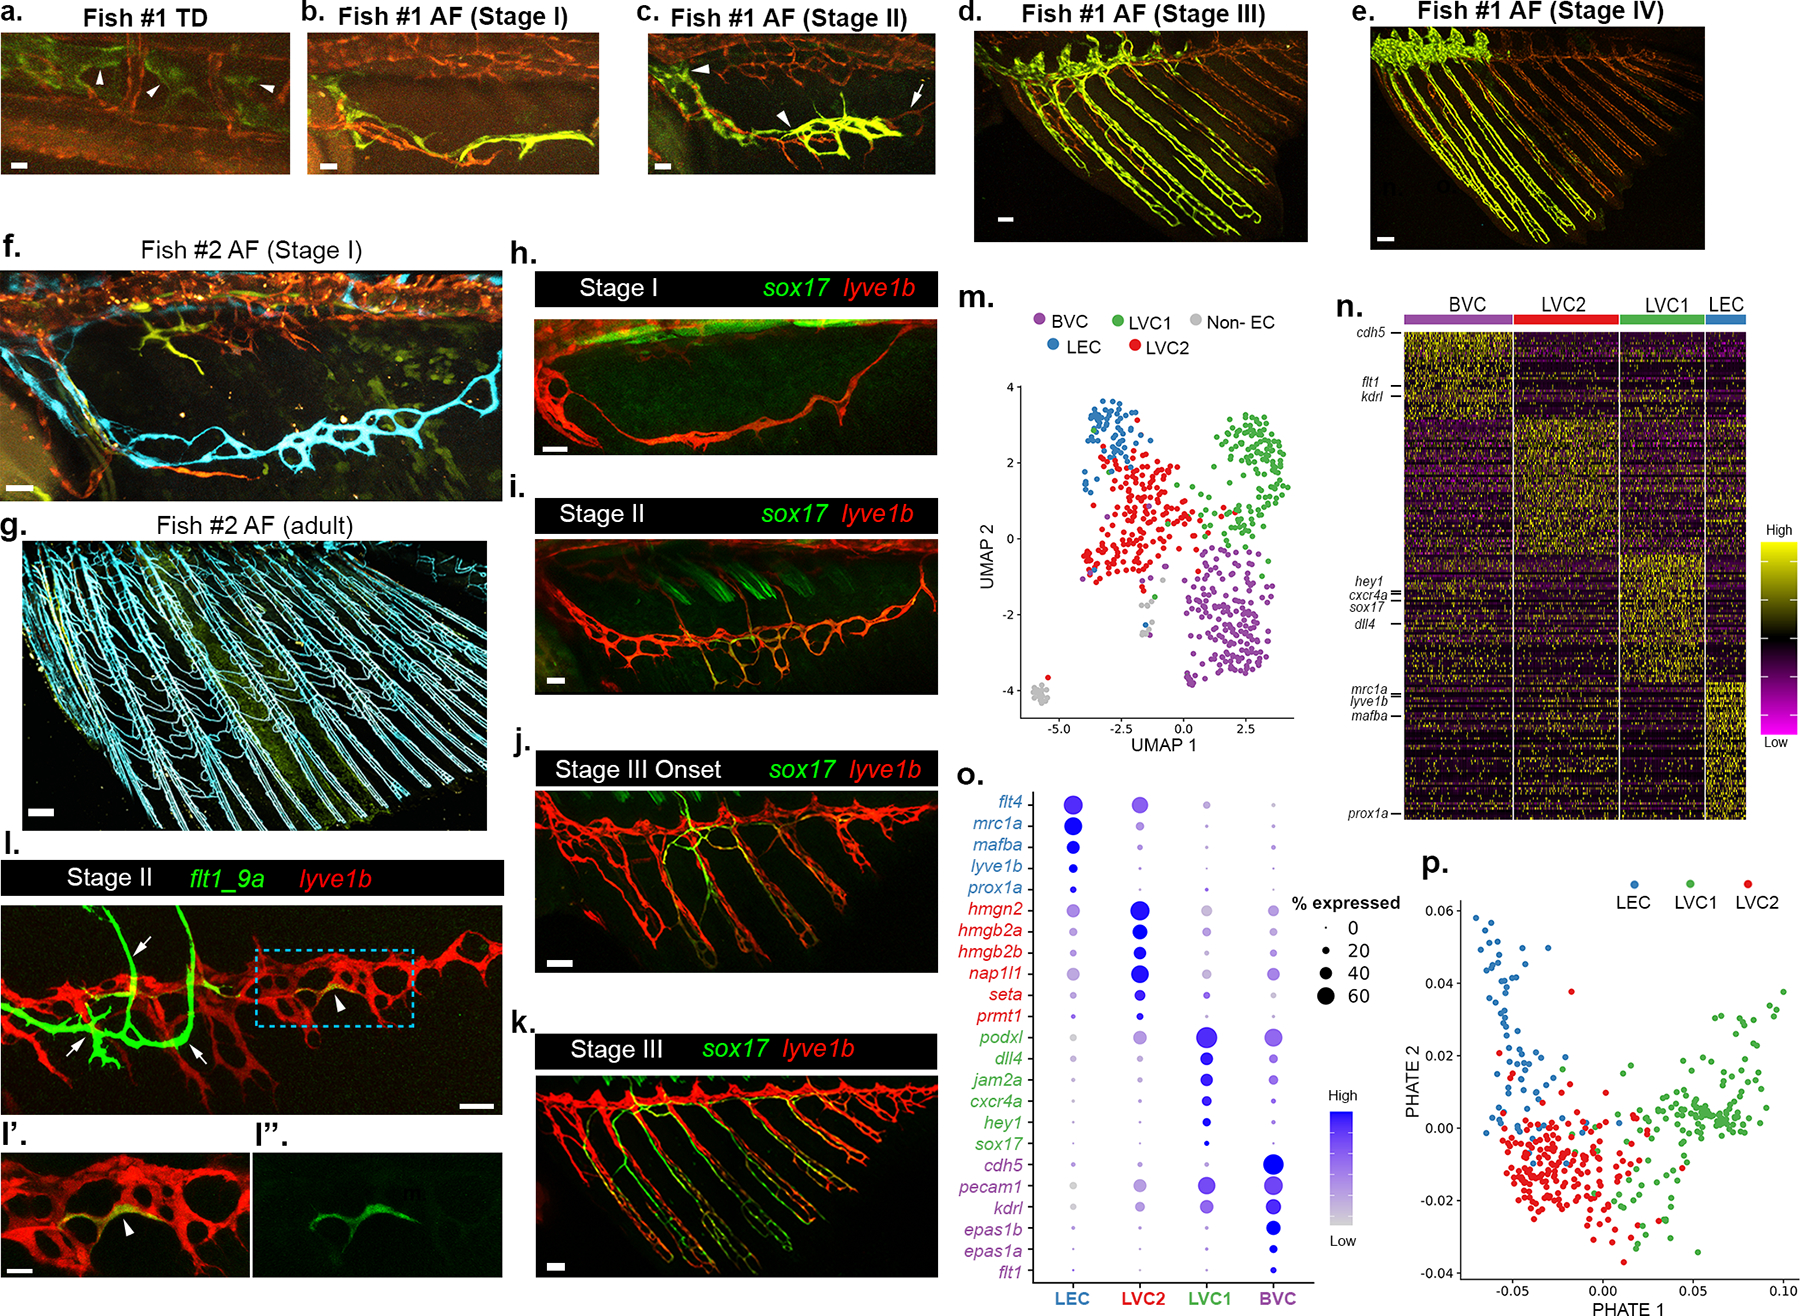
a-e, Confocal imaging of the same hsp70l:CreERT2; flibow fish (Fish #1) every 24–72 hrs, showing generation of AF vessels from trunk lymphatics. TD-derived green ECs (a, arrowheads) penetrate the AF (b, stage I), and grow ventrally to generate the anterior half of the AF plexus as seen in stages II (c), III (d) and IV (e). The posterior unlabeled AF sprout (c, non-recombinant tdTomato (red), arrow), results in unlabeled posterior half of mature AF (d,e; red). f-g, Confocal images of hsp70l:CreERT2;flibow (Fish #2) showing the entire AF vasculature at 3 mpf (g, blue) derives from Stage I clonally related LECs (f, lymphatic arc, blue). h-k, Progressive enrichment of sox17EGFP expression across stages I to III. l-l”, flt1_9a:EGFP strongly labels the BVC (l, arrows) and is upregulated in individual lyve1:dsRed+ LECs (arrowheads) of the early LVC. l’,l” show high magnification of blue ROI in l. m, UMAP of 632 ECs isolated from stage II/III AFs, depicting 5 cell clusters: BVC (purple, 191 cells), LEC (blue, 71 cells), LVC1 (green, 149 cells), LVC2 (red, 185 cells). The ‘non-EC’ cluster (grey, 36 cells) was discarded from further analyses. n, Heatmap indicating the relative expression (yellow=high; purple=low) of DEGs per cluster, genes of interest are annotated. o, Dot plot depicting scaled expression of genes of interest in each cluster. The size of the dots corresponds to % of expressing cells within the cluster. p, Three clusters composing the LVC – LEC, LVC1, LVC2– are visualized using PHATE, and color coded in accordance to the clusters shown in m. Scale bars, 15 μm (a,l’), 20 μm (b), 30 μm (c,f,l), 50 μm (d,j,k), 100 μm (e), 300 μm (g).
To further test lineage relationships, we devised two alternative strategies. First, we generated Tg(kdrl:CreERT2;flibow) fish, where the flibow construct is activated only in blood ECs20. In addition, we established a flibow-independent system, by combining Tg(kdrl:CreERT2) with Tg(bactin2:loxP-BFP-loxP-DsRed)21 fish. In both cases, upon induction of kdrl:CreERT2 mediated recombination, 100% of the labeled clones found in the AF, were restricted to the BVC (Extended Data Fig. 4d–f’), and never found in the AF ray vessels. Overall, our results using multiple lineage tracing strategies demonstrate that the whole mature AF plexus originates from bona fide LECs, with no contribution from neighboring blood vessels.
Notably, while lymphatics originate from multiple sources3,4, the LEC fate was shown to be “reprogrammable” only due to mutations or other insults22–25. In contrast, there is no evidence of an innate program that utilizes differentiated LECs to generate blood vessels. To ascertain the molecular nature of this vessel fate-switch, we analyzed publicly available RNA-seq data from PROX1 downregulated-Human Dermal Lymphatic Endothelial Cells (HDLECs)26. In this setting, loss of lymphatic fate correlated with significant upregulation of well-known blood vessel markers such as KDR, FLT1, DLL4 and SOX17 (Extended Data Fig. 5a,b). Taking cues from this dataset, we assessed the expression of sox17, a transcription factor enriched in mammalian arteries27, and found sox17EGFP-labeled ECs in the developing ray vessels, from stage II onwards (Fig. 2h–k and Extended Data Fig. 5c–g). Similarly, around Stage II, a few LECs within the plexus turn on expression of Tg(flt1_9a:GFP) (Fig. 2l–l”), a flt1 enhancer that labels angioblasts and arteries, but not differentiated LECs28–30 (Extended Data Fig. 5h,h’). As the rays grow, additional lyve1b+/prox1a+ LECs upregulate flt1_9a:GFP (Extended Data Fig. 5i–j’) and kdrl:GFP (Extended Data Fig 5l–m”), indicating their progressive transition toward a less differentiated state. Of note, the pattern of expression driven by the flt1_9a enhancer was different from that of the flt1 transcript, which was found to be enriched only in the BVC (Extended Data Fig. 5k).
To globally resolve the heterogeneity of ECs generated during the transition, we carried out single-cell RNA sequencing (scRNA-seq)31 on ECs isolated from Tg(fli1a:dsRed) AFs at stages II-III, when the transdifferentiation process takes place. Five clusters (Fig. 2m) were annotated based on their differentially expressed genes (DEGs) (Fig. 2n and Table 3). The BVC cluster (purple) featured significant expression of known blood EC markers, such as cdh5, flt1 and kdrl (Fig. 2n,o and Extended Data Fig. 6a). ECs of the LVC were annotated to 3 different groups: (i) differentiated LECs (LEC, blue), enriched with lymphatic markers such as prox1a, lyve1b and mrc1a (Fig. 2n,o and Extended Data Fig. 6b); (ii) LVC1 (green), characterized by expression of sox17 and additional BV markers like hey1 and dll4 (Fig. 2n,o and Extended Data Fig. 6c), represents the LVC-derived blood vessels; and (iii) LVC2 (red), with no clear lymphatic or blood EC signature (Fig. 2n,o). Since the transdifferentiation process involves only the LVC derivatives (LEC, LVC1 and LVC2), we re-analysed these clusters. PHATE32 map (Fig. 2p), as well as Slingshot33 and PAGA34 analyses (Extended Data Fig. 6d,e), suggest LVC2 to be an intermediate population, with lymphatic marker expression gradually decreasing from LEC to LVC2 (Extended Data Fig. 6f), and blood EC gene expression increasing from LVC2 to LVC1 (Extended Data Fig. 6g). Interestingly, LVC2 features genes associated with chromatin binding and remodeling, nucleosome organization and DNA packaging (Fig. 2n,o) such as seta35, hmgb, hmgn36,37 and prmt138, shown to be enriched in undifferentiated/progenitor cells and downregulated across cell differentiation. Thus, the LVC2 signature bodes well with the idea that it represents a population of transitioning/differentiating cells.
Our imaging and scRNA-seq analyses highlight the unique expression of Sox17 in transdifferentiating ECs. To interrogate the role of Sox17 in suppressing the LEC fate, we injected UAS:Sox17 DNA into Tg(hsp70l:Gal4;lyve1b:dsRed) embryos. Heat-activation at 21 dpf rendered 25.24±8% of injected fish displaying patches of missing lyve1b expression in the AF (Extended Data Fig. 7a–b’). Moreover, mosaic overexpression of Sox17 in ECs, resulted in absence or incomplete formation of the TD in 17.94% of the injected embryos (Extended Data Fig. 7c–g). Together these results demonstrate that ECs in the developing AF progressively lose LEC identity while gaining expression of BEC markers, and point to Sox17 as potential key player in this transition.
Previous work described LEC reprogramming by blood flow shear stress24. To check whether the transdifferentiation precedes the exposure of the AF vessels to blood flow, or is rather the presence of blood flow what leads to transdifferentiation, we injected fluorescent tracers intravascularly, at various timepoints, and followed their distribution in the fin vessels vis a vis marker analysis. We found that while the fluorescent tracers remain restricted in the BVC in Stage II AFs (Fig. 3a,a’), they enter the lumen of the LVC-derivatives in Stage III AFs (Fig. 3b,b’ and Extended Data Fig. 8a–b’), indicating that patent connections with the systemic circulation were established. Notably, both sox17EGFP (Fig. 3c,c’) and flt1_9a (Extended Data Fig. 8c,c’) expression was detected in transdifferentiating ECs before exposure of the vessels to blood flow. Imaging of sox17EGFP;lyve1b:dsRed and sox17EGFP;fli1a:dsRed revealed that the connection with blood circulation is established through a “bottom-up” mechanism whereby the newly generated sox17EGFP+ vessels extend dorsally and anastomose with sprouts arising from the dorsal aorta (DA) (Fig. 3d and Extended Data Fig. 8d–g”). Accordingly, flibow lineage tracing showed that the connecting vessels arise in the AF and are LVC-derived (Extended Data Fig. 8h). Altogether, our results support the idea that LEC transdifferentiation is not elicited by blood flow.
Fig. 3: The functional specialization of AF vessels is linked to their cellular origins.
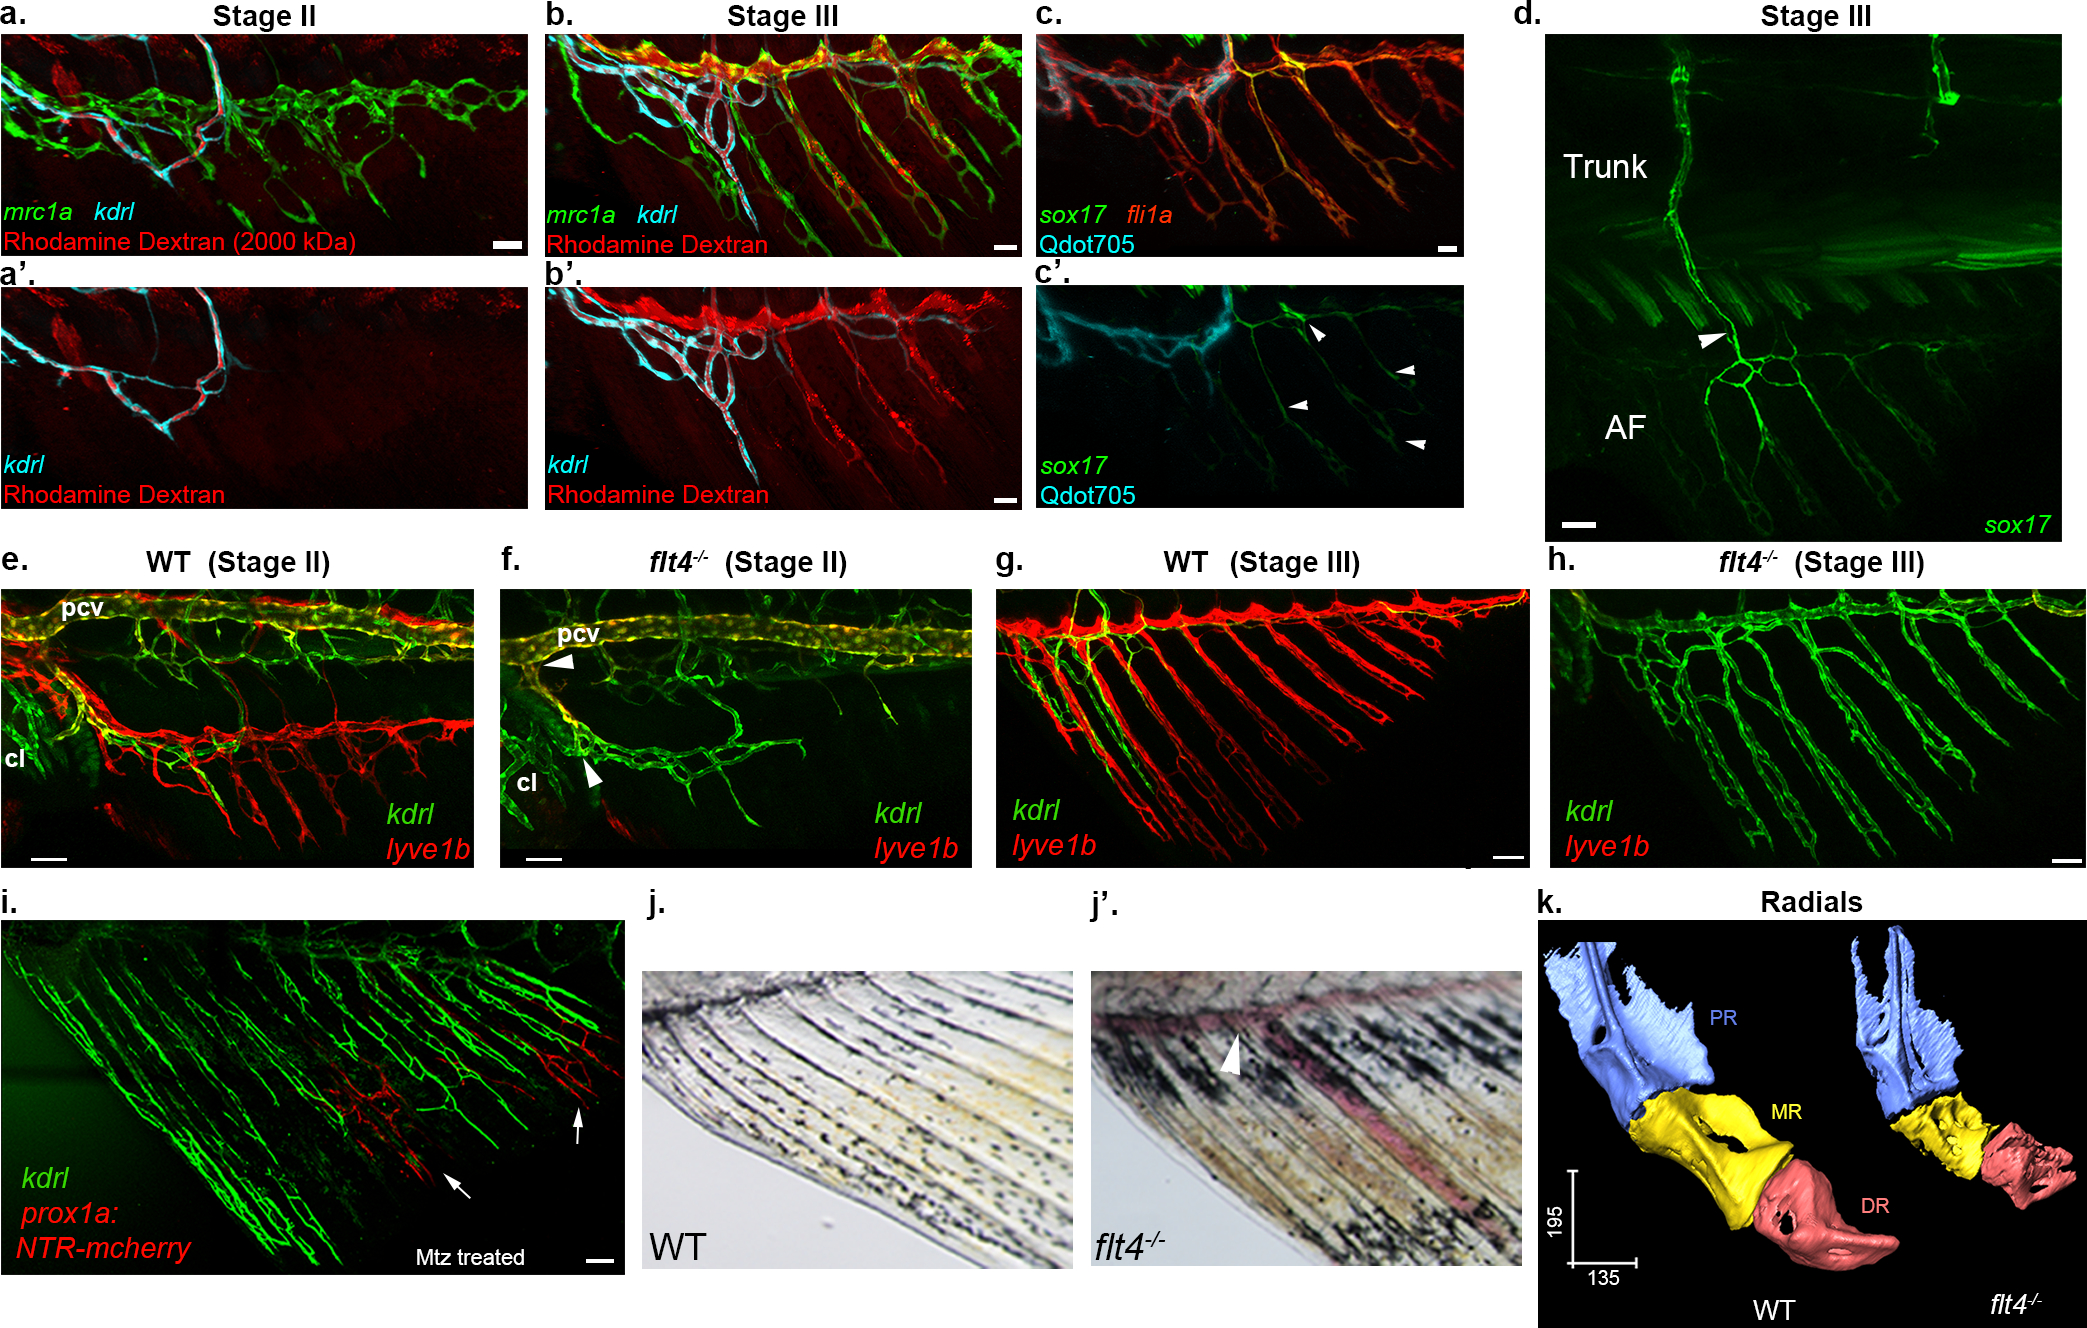
a-b’, AF LVC forms patent connections with systemic circulation at stage III. Distribution of intravascularly injected Rhodamine dextran (MW=2000 kDa) in stage II (a-a’) and III (b-b’) AFs, shown along with LVC (mrc1a:EGFP+) and BVC (kdrl:BFP+). Blood-borne tracer (red) is seen in the lumen of mrc1a+ vessels in stage III but not in stage II AFs. c-c’, Lymphatic transdifferentiation occurs before the LVC connects to blood flow. sox17GFP expression is detected in the LVC (arrowheads) before the intravascularly injected Qdot705 (cyan) enter the LVC compartment (c’). All vessels in c are labeled with fli1a:dsRed. (d) Confocal image (also shown in Fig. 2j), depicting the connection between the AF and the trunk blood vasculature mediated through sox17GFP+ vessels. e-i, Lack of lymphatics induces blood vessel-derived vascularization of the AF. Stage II AF of flt4−/− lacks lyve1b:dsRed+ LVC (f), that is present in WT siblings (e, red). kdrl:GFP+ BVC is detected in both (e,f, green). Arrowheads in f point to the connections with cloacal vessels and PCV. Stage III WT AF is primarily vascularized by LVC-derivatives (g, lyve1b:dsRed), whereas only BVC-derived vessels are detected in AFs of flt4−/− (h, kdrl:GFP). i, Status of BVC-derived vessels (kdrl:GFP), 22 days post NTR-Mtz mediated ablation of LVC in Tg(prox1a:Gal4;UAS:NTR-mCherry) animals. Arrows point to small patches of prox1a+ LVC cells that escaped ablation. j-j’, flt4−/− mature AF display erythrocyte pooling (j’, arrowheads, n=10) as opposed to WT siblings. k, Comparison of radial morphology between WT and flt4−/− animals, revealing major defects in the MR. q, Radials have been magnified and color coded to reveal the three segments – PR, MR and DR, of the WT (left) and flt4−/− (right). Scale bars, 30 μm (a,b,c), 50 μm (d,e,f,g,h,j), 100 μm (i), 300 μm (k). NTR, Nitroreductase, Mtz, Metronidazole, μCT, Micro-computed tomography, PR, Proximal radial, MR, Medial Radial, DR, Distal Radial.
Given that the fin ray vessels are LVC derived, we turned to flt4−/− animals, which lack most lymphatic vessels39,40 (Extended Data Fig. 9a,a’) to investigate how LEC absence would impact fin formation. Surprisingly, we found that blood, and not lymphatic vessel sprouts, generate the entire vascular network in the developing AF (Fig. 3e–h) and DF (Extended Data Fig. 9b–e) of flt4−/−animals, whereas the LVC is missing in both fins. Similarly, when lymphatics were ablated using the NTR/MTZ system41, kdrl+ BVC sprouts contributed substantially to ray vessel formation (Fig. 3i and Extended Data Fig. 9f–h). To genetically confirm the alternative origin of the ray vessels in flt4−/−, we used the flibow system. Extended Data Fig. 9i depicts a representative flibow;flt4−/− fish with a single sprout connected to the PCV and cl blood vessels, colonizing the AF. ECs of matching clonal identity are later detected in the ray vessels of the mature AF (Extended Data Fig. 9j). Thus, unlike WT animals, flt4−/− mutants possess an AF plexus that is fully derived from pre-existing blood vessels.
During embryonic development, several cell types are known to originate from more than one source. However, to what extent the ontogeny of a cell is linked to its function in the adult organism, remains an open question. Notably, WT and flt4−/− animals provide a unique opportunity to assess the functionality of vessels arising from different sources, in the same organ. Before all else, we noticed that flt4−/− AFs present unusual blood pooling and erythrocyte accumulation that were not detected in WT siblings (Fig. 3j,j’). By recording erythrocyte flow, we found that mature WT AFs display an unusual pattern of ‘intermittent’ flow, as previously reported8,10,11, whereas flt4−/− AF vessels presented continuous blood flow and high erythrocyte density both in juvenile and adult stages (Extended Data Fig. 10a–e; Supplementary Video 3,4). Likewise, we detected higher gata1a:dsRed+ erythrocyte content in the ray vessels of flt4−/− mutants (Extended Data Fig. 10f–i).
To ascertain whether the mutant’s vessel and flow properties affect AF bone formation, we used micro-computed tomography (μCT)42. Analysis of flt4−/− revealed prominent malformations, particularly in the medial radials, which were significantly shorter and less structured than those of WT counterparts (Fig 3k; Extended Data Fig. 10j–l). Thus, the different origin of the AF vasculature in flt4−/− animals leads to malformations in the skeletal structures. Altogether our results indicate that the functional properties of the mature AF vasculature are directly linked to the source of its ECs (blood vs. lymphatic), highlighting the importance of cell “biography” for proper tissue development and functionality.
We next asked whether the transdifferentiation process is recapitulated during regeneration. Certainly, resection of the AF in adult fish (Fig. 4a) triggered sprouting from the unamputated lymphatics (Fig. 4a’,b). These new LEC sprouts extended ventrally, wrapping the regenerating bones, first as a disorganized plexus and later on establishing the well-ordered vessel pattern akin to the developmental process (Extended Data Fig. 11a–b). The transdifferentiation was also fully recapitulated, as reflected by gradual appearance of sox17EGFP and flt1_9a:GFP (Fig. 4c; Extended Data Fig. 11c), and loss of lymphatic markers (Fig. 4d,e). To substantiate these findings, we lineage traced ECs before AF resection and following regeneration in the same animal. We found that ECs in the regenerated AFs were clonally related to the LECs that established the original AF plexus, and no new clones were detected in 32/34 regenerated fin rays (Extended Data Fig. 10d–f). In addition, following kdrl:CreERT;flibow induction all labeled clones within the regenerated AF, were located in the BVC (Extended Data Fig. 11g), confirming that pre-existing blood vessels do not give rise to the AF plexus during regeneration. Finally, we tracked the lineage history of the AF vasculature in the same animal, from development through adulthood, and following regeneration (Fig. 4f). As expected, we found that ECs clonally related to the LECs that generated the initial LVC-derived plexus, populate the regenerating fins (Fig. 4g–k), illuminating for the first time the lifetime and regenerative lineage history of ECs composing a vascular plexus. Of note, the use of zebrafish helped circumvent some of the intrinsic limitations associated with lineage tracing in mammals43, and enabled tracing the lineage history of ECs and their progenies throughout the lifetime of a single organism. Taken together our results indicate that AF regeneration re-activates the LEC-to-BEC transdifferentiation program observed during metamorphosis, reinforcing the importance of this mechanism for generating a proper bone-associated vasculature. Moreover, these findings indicate that LECs harbor the plasticity to give rise to blood vessels through life.
Fig. 4: Vascularization of regenerating AFs recapitulates developmental programs.
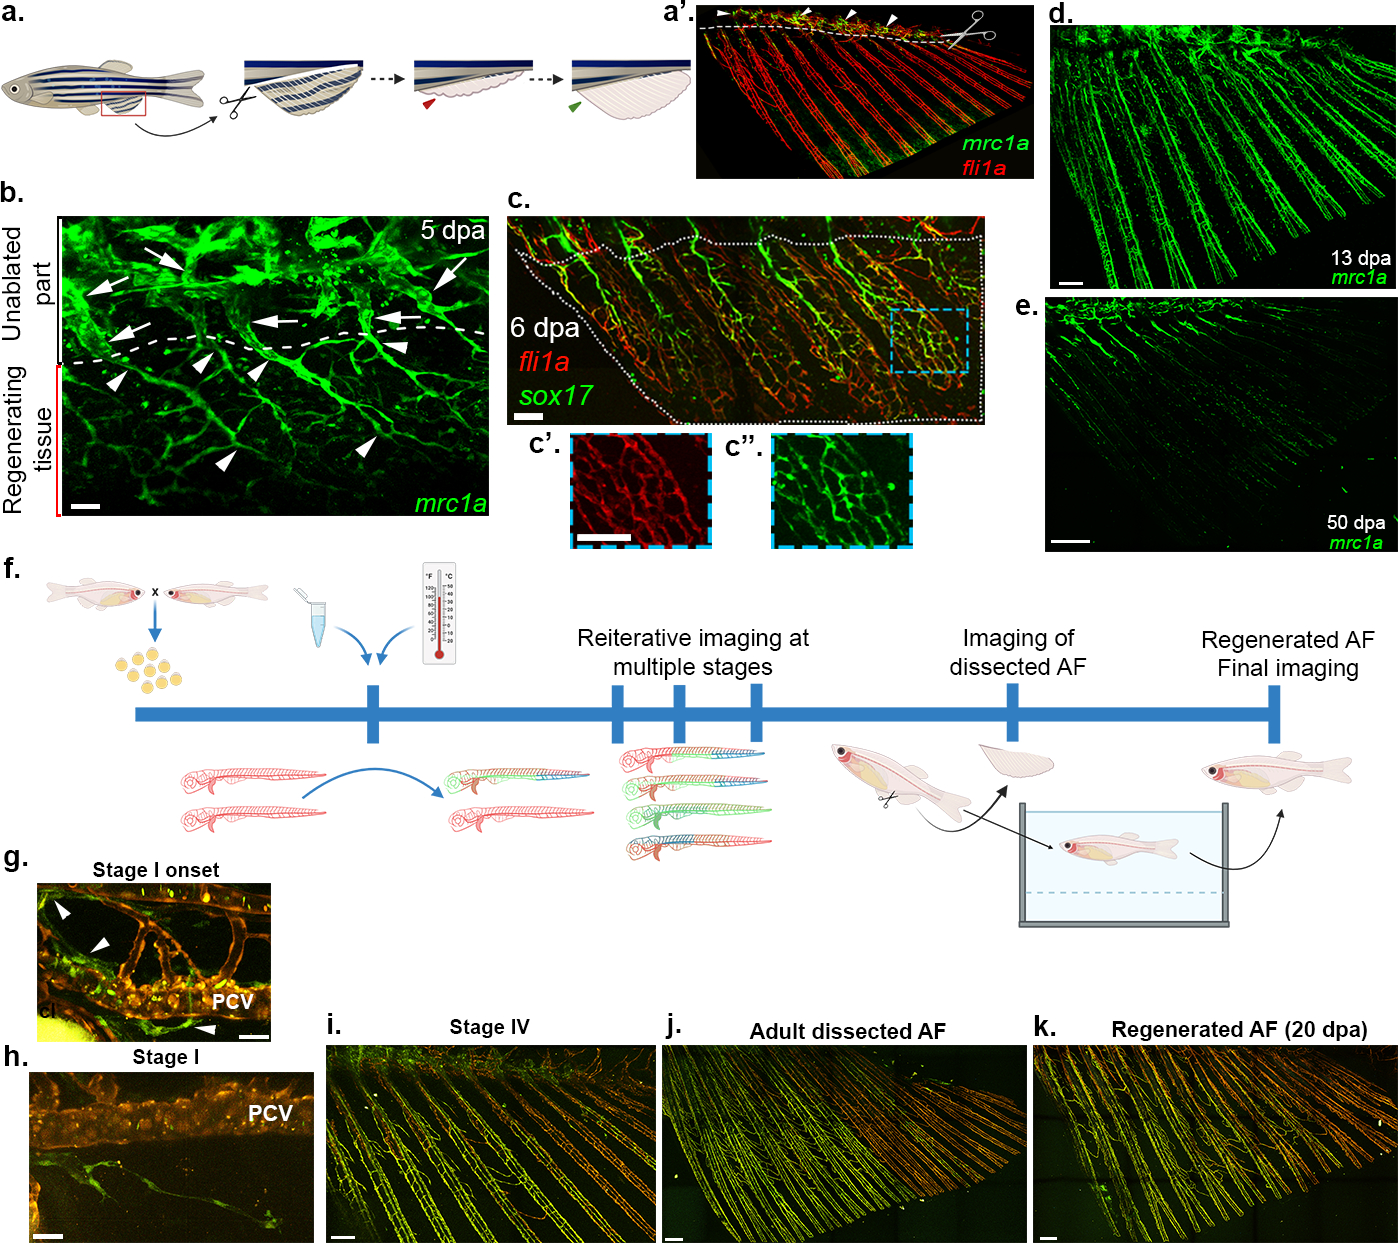
a, Schematic representation of AF regeneration protocol. a’, Adult AF depicting the plane of amputation at the level of the trunk-fin junction (white dotted line), and the unamputated residual lymphatics (arrowheads). b, Expression of mrc1a:EGFP in vessels re-vascularizing the regenerating AF (arrowheads ventral to the white dashed line) at 5 dpa. Arrows point to residual lymphatics in unamputated area. c-c”, sox17EGFP expression is upregulated in 6 dpa regenerated AF vasculature (highlighted by fli1a:dsRed). Insets (c’,c”) show high magnification of blue box ROI. d-e, mrc1a:EGFP is gradually lost from regenerating AF vessels (d, 13 dpa; e, 50 dpa). f, Schematic representation of protocol for lifetime lineage tracing of AF vasculature in (hsp70l:CreERT2; flibow) animals. g-k, Lymphatic clones (green, arrowheads) detected in the TD (g) sprout into the developing AF (h). i, Status of same clones at stage IV. j, Dissected adult AF displays ECs of same clonal identity as g and h. k, Vasculature of 20 dpa regenerated AF of same fish shown in g-j, depicting the distribution of ECs of same clonal identity (green). Scale bars, 30 μm (g,h), 50 μm (b), 100 μm (c,c”), 150 μm (i), 300 μm (d,j,k), 500 μm (e). dpa, days post amputation.
Overall, our work highlights a new mechanism of specialized blood vessel formation through LEC transdifferentiation, and provides in vivo evidence for a link between cell ontogeny and functionality of ECs. In addition, our findings help solve a long-standing controversy regarding the existence of lymphatics and SVs in teleosts44. By showing that the AF/DF vessels are in fact lymphatic-derived, we demonstrate not only that both vessel types exist in teleosts, but also that the latter do not form in the absence of lymphatics. We further provide compelling evidence demonstrating that the SVs represent a specialized blood vessel type with unique functional and molecular properties that, as other organotypic vascular beds, evolved to serve the specific needs of teleost appendages. Finally, our findings provide new insights into our current understanding of lymphatic plasticity and diversification, contributing to a growing body of literature revealing exciting new roles for lymphatic vessels 45–51.
Materials and Methods
Zebrafish husbandry and transgenic lines
Zebrafish were raised by standard methods and handled according to the guidelines of the Weizmann Institute Animal Care and Use Committee28. The Tg(lyve1b:dsRed)nz101 29, Tg(fli1ep:dsredex)um13 30, Tg(flt1_9a:EGFP)wz2 29, Tg(mrc1a:EGFP)y251 13, TgBAC(prox1a:KALTA4,4xUAS-E1B:TagRFP)nim5 29, flt4um203/um203 39, Tg(kdrl:EGFP)s843 52, Tg(kdrl:TagBFP)mu293 53, Tg(osx:mCherry)zf131 54, Tg(hsp70l:Gal4vp16)vu22 55 , Tg(kdrl:Cre-ERT2)fb13 20, Tg(UAS:NTR-mCherry)56, TgBAC(flt1:YFP)hu4624 57, Tg(bactin2:loxP-BFP-loxP-DsRed 21 and Tg(fli1a:Gal4FF)ubs3 29 were previously described.
Experiments were conducted on fish from the same clutch. Fish were initially selected based on their size (~5.2 mm for Stage I initiation) and were subsequently staged based on criteria described in Table 1, and Extended Data Fig. 1g–j. For regeneration experiments, animals were selected by age (3–6 mpf). For imaging, we used either casper (roy−/−; nacre−/−)58 background, or the embryos were treated for 6 days with 0.003% N-phenylthiourea (PTU) (Sigma, St Louis, MO) to inhibit pigment formation.
Generation of transgenic lines
The Tg(fli1a:Brainbow1.0L)mu254 (flibow) fish was generated by cloning the CMV-Brainbow-1.0 L construct (Addgene #18721) downstream to the fli1a promoter59, into a plasmid containing tol2 sites. The Tg(hsp70l:CreERT2) line was established by fusing the coding sequence of CreERT2 downstream of the heat-inducible promoter – hsp70l60. The Tg(prox1a:Gal4) line was generated using BAC DKEY-5J3 (BioScience, Cat no. HUKGB735J035Q) through transposon mediated BAC transgenesis61. All plasmids were generated using the Gateway system as described59.
The sox17EGFP knock-in line (allele pd305) was generated by TALEN-mediated targeted knock-in through non-homologous end joining. Briefly, an obligate heterodimeric TALEN pair (left arm: 5’-GATCAATAAGGATACGC-3’, right arm: 5’-CGGGACTGCTCATCTC-3’) was assembled as described62 to induce a double strand break at the start codon region of the sox17 gene. The donor vector has the same structure as described63 except that the TALEN sequences were replaced with the sox17 right arm and another left arm (5’-GTATACTACTGCGGCTAT-3’) upstream of the EGFP-polyA cassette. Vector-free knock-in line was generated by co-injection of the TALEN mRNAs, donor vector and flp mRNA at one-cell stage.
Flibow induction
To achieve efficient labelling of trunk lymphatics induction of Cre recombinase in flibow embryos was carried out at 2.5 dpf (60 hpf). First the embryos were pre-heated at 36°C for 15 mins for triggering hsp70l mediated Cre expression. Then they were subjected to combined heat (36°C) and 5µM 4-hydroxytamoxifen (diluted in E3 medium) treatment for 45mins. Upon completion of the treatment, embryos were washed three times in fresh E3 medium and returned to fresh water. Fluorescence from the ‘switched’ cells was readily detectable ~24 hours post-treatment (Extended Data Fig. 3h–j’), and remained stable in ECs and their progenies for the entire experimental period (Extended Data Fig. 3j,j’). While the heat and 4-OHT treated progenies displayed ECs with diverse spectral signatures, siblings exposed to either treatment alone, contained only tdTomato-expressing ECs both in larval and adult stages (Extended Data Fig. 3d–g). Selected animals were imaged at the appropriate AF development stages days and returned back to fresh water until the endpoint of the experiment. For triggering kdrl:CreERT2 mediated Cre expression, embryos were treated only with 5µM 4-hydroxytamoxifen between 3.5–5.5 dpf.
Sox17 overexpression
The UAS-sox17 constructs were generated by amplifying the coding sequences of sox17 (NM_131287.2) with the following primers:
sox17 F: 5’ - atgagcagtcccgatgcg −3’
sox17 R: 5’ -tcaagaattattatagccgcagt −3’
The resulting sox17 fragment was then cloned downstream of UAS using Gateway cloning. The UAS:sox17 construct was injected in Tg(fli1a:Gal4;lyve1b:dsRed) or Tg(hsp70l:Gal4; lyve1:dsRed) embryos at 1-cell stage. Heat shock was carried out at 37°C for 1h on 21dpf Tg(hsp70l:Gal4; lyve1:dsRed) animals (for juvenile induction).
NTR-MTZ mediated cell ablation
Nitroreductase-Metronidazole (NTR-Mtz) mediated cell ablation protocol was modified from41. Since prox1a:Gal4; UAS NTR-mCherry is expressed in many tissues, Mtz treatment beyond 4hrs at concentrations above 5mM were lethal. We developed a low dose multi-treatment protocol, that allowed partial ablation of lymphatics on day 1, followed by blocking of lymphatic regrowth through 4 more low-dose treatments every two days. This allowed us to observe the AF for 15–25 days post the first treatment. However, the animals did not survive till adulthood. Briefly, Mtz was diluted in E3 medium to a final 4mM concentration and 16–18 dpf prox1a:Gal4; UAS NTR-mCherry larvae, were soaked in it for 2.5hrs. Following washing and recovery, animals were treated again with 4mM Mtz for 1hr every two days.
Anal fin regeneration
Adult fish (between 3–6 mpf) were anesthetized by immersion into 0.04% tricaine (Sigma, St Louis, MO) and the AF were carefully detached using surgical blade and forceps. The animals were immediately allowed to recover in fresh water.
Angiography and lymphatic uptake assays
Angiography was performed on anesthetized larvae and juvenile animals, by injecting Qtracker705 (Invitrogen, Q21061MP), Tetramethylrhodamine Dextran (2,000,000 MW) (Thermofisher, D7139) and Fluorescein isothiocyanate (FITC) Dextran (500,000 MW) (Sigma, 46947) into the heart using microinjection glass capillaries, as described18. In adults, heart was accessed in anesthetized animals through a small incision, followed by microinjection of Qtracker70528. In both cases, imaging was initiated within 5 mins of the injection and the animals were euthanized immediately afterwards. For lymphatic uptake, Calcein (Sigma) was injected subcutaneously16 in the trunk (above the gut). Imaging was initiated 15 mins after the injection.
Hypoxyprobe Staining
For assessment of hypoxia, Hypoxyprobe kit (Hypoxyprobe, Inc.) was used. The staining protocol was performed through modification of previous work in zebrafish64. Briefly, zebrafish of ~17–20 dpf were injected intramuscularly with 30 nl of 10 mg/ml pimonidazole solution (Hypoxyprobe, Inc.). Injections were performed in the trunk area, dorsal to the AF for 3 consecutive days. In the sham injected animals, PBS was injected in the same amount and frequency as the test animals. Following this, the animals were euthanized and the AF was fixed in 4% PFA. Whole-mount immunohistochemistry was performed through standard protocol. The samples were stained with 4.3.11.3 mouse Mab at a dilution of 1:50.
Single molecule fluorescent in situ hybridization (smFISH)
The construction of the probe library, hybridization procedure and imaging conditions were previously described65. In brief, probe libraries were designed using the Stellaris FISH Probe Designer (Biosearch Technologies, Inc., Petaluma, CA). Both prox1a and fli1a library consisted of 48 probes, each of 20 bps length, complementary to the coding sequence of the gene (Table 4), and was coupled to Cy5 (GE Healthcare, PA25001) and Alexa Fluor 594 respectively. As a modification of the standard tissue smFISH protocol, whole mount zebrafish AFs were fixed in cold 4% PFA for 30 minutes and washed twice with PBS containing 0.3% Triton X-100 (Sigma) for 5 min, followed by cold 70% ethanol for 2.5 h. The samples were then washed in 2XSSC and incubated for 10 min with Proteinase K solution at 37°C. The next steps were performed as described65. Formamide concentration of the wash and hybridization buffers was increased to 25%. Additionally, the pre-incubation with the wash buffer was extended to 90 minutes. Slides were mounted using ProLong Gold (Molecular Probes, P36934) and imaged on a Nikon-Ti2-E inverted fluorescence microscope with 100x or 60x oil-immersion objectives connected to iXon Ultra 888 CCD camera (Andor, Oxford Instruments), using Nikon NIS Advance Elements software.
Microscopy and imaging
Confocal imaging was performed using Zeiss LSM780 or LSM880 upright confocal microscopes (Carl Zeiss, Jena, Germany) equipped with water immersed 20x NA 1.0 or 10x NA 0.5 objective lens. Euthanized animals were mounted using 1.5% w/v low melting agarose. For reiterative imaging of same animals, a custom-built chamber was utilized. z-stacks were acquired at 2–3 μm increments. Larger images were acquired using tile-scanning, and the images were stitched using Imaris Stitcher 9.3 or Zeiss’ Zen software.
flibow confocal imaging and lambda stack acquisition were performed by single, simultaneous scans (for each z-plane) with 458nm and 514nm single photon excitation lasers. Using Zeiss multichannel detector, the resulting emission spectra were collected into 11 channels, each detecting a range of 18nm from 454nm to 650nm, which encompassed emissions from all three fluorescent proteins of flibow.
Analysis of flibow images was performed by intensity measurement of each of the 11 channels for the selected ROIs (manually drawn to select single ECs). Normalized values of these intensities were plotted for different ECs for comparison. In certain cases, when ECs displayed similar intensity profiles and same origins, we averaged intensity values of these different ECs.
Image processing
Confocal images were processed off-line using Fiji66 version of ImageJ (NIH) or Imaris 9.3 (Bitplane). The images shown in this study are single-views, 2D-reconstructions, of collected z-series stacks. The colocalization channel was created using the Imaris ‘Colocalization Module’. Co-localization thresholds were set manually.
flibow images were processed using Imaris 9.3. Each of the 11 channels were given RGB values that corresponded to the wavelength collected. Since many channels collect the emission from only one fluorescent protein, or detect noise (autofluorescence from rays and pigments), we chose 6 channels, leaving out those that were redundant or displayed a poor signal/noise ratio.
smFISH images were processed in Fiji. Background subtraction was performed using the rolling ball algorithm in Fiji. Abundance of RNA puncta within the vessels was calculated manually after selecting ROIs from the GFP (mrc1a/kdrl) channel. 3–5 ROIs per samples were selected to calculate number of puncta per unit area of the selected ROIs.
The 3D volume rendering was performed using Imaris 9.3 (Bitplane).
Micro-computed tomography (μCT) and processing
μCT was performed as described42 with some modifications. Briefly, AFs from freshly euthanized wild-type and flt4−/− adult fish (4–5 mpf) were dissected, keeping the internal radials intact, and mounted on a 1ml pipette tip filled with 0.8% low melting agarose, with both ends sealed. The sample was placed in a sample holder and observed using Xradia 520 Versa (Zeiss), with an X-ray source of 40 kV and current 75 μA. 2501 projections were scanned through 360° with 10s exposure time. The voxel size of the specimen was 2.03×2.03×2.03 μm.
The scans were analyzed and segmented using Avizo 2019.4 software.
AF erythrocyte flow analysis
Three ROIs were selected spanning different AF rays of each anesthetized juvenile or adult fish and 6 min time lapse images from a single z-plane were acquired. The imaging was performed using the transmitted light detector in the LSM880 confocal microscope, after manually determining the desirable contrast for each fin. The image size, zoom factor, pixel dwell time were kept constant for all experiments, allowing acquisition of images at a fixed frame interval of 0.152s.
The erythrocyte flux through the vessels was measured in Fiji. We plotted bright light intensity profile over time to reflect the state of erythrocyte flow. For this, a line ROI was drawn across the lumen the vessel. Erythrocytes crossing this ROI caused fluctuations in the bright light intensity measured through this ROI. We determined the threshold of minimum intensity change that corresponds to passing of a single erythrocyte, and the number of events above this threshold were counted as erythrocyte-mediated intensity spikes and quantified in our ‘spike count’ plots.
Bulk RNA-Seq analysis
To analyse RNA-seq raw counts data from 26, we selected genes that were expressed in more than 2 samples, had at least 10 reads across all samples, and their mean expression was > 4 for downstream analysis. R package DESeq2 (v1.26)67 was used to normalize raw counts, perform regularized log2 transformation (rlog) and identify differentially expressed genes (DEGs) across samples (p-value<0.05). In addition, lfcShrink function using apeglm estimation was used for shrink log2 fold change (LFC) calculation, which allows to assess the expression changes in lowly expressed genes68.
Single cell RNA-Seq experiments
Cell collection
Cells were isolated from 80 AFs of Tg(fli1a:dsRed), and processed for single cell suspension. Briefly, tissues were manually chopped with a sterile razor followed by enzymatic dissociation using 2.5 ug/ml Liberase TM (Roche) diluted 1:5, incubated at 28°C for 25 minutes, manually pipetting every 5 minutes. Next, 2 volumes of Trypsin B (BI) and a dilution of 1:100 DNaseI (Roche) were added, followed by 7 minutes incubation at 28°C with manual pipetting. To stop the reaction, 3 volumes of 5% FCS were added. Cells were passed through a 70μm cell strainer and dsRed+ cells were sorted by fluorescently activated cell sorter (BD FACS Aria III) into 384 barcoded well plates. Live-dead staining was performed using Sytox blue (Invitrogen).
Library preparation, sequencing and pre-processing of single cell RNA-Seq data
Plate-based single cell RNA sequencing libraries were processed using MARS-seq protocol, as previously described31,69. Sequence ready library was sequenced using Illumina NextSeq 500 to reach ∼50,000 reads per cell. We sequenced 1036 cells from stage II/III AF. GRCz10 used for genome alignment. Data pre-processing was carried out following previously MARS-seq published protocols70–72. Cells with more than 1200 nFeatures (genes) were removed as suspected doublets; Cells with less than 200 nFeatures (genes) were removed for low coverage and cells with more than 25% mitochondrial gene content were removed for low quality. Overall, 632 cells passed quality filters for downstream analysis. Cells that passed quality filters contained a mean of 764 UMI counts and 492 genes per cell.
Single-cell RNA-seq analysis
We used Potential of Heat-diffusion for Affinity-based Trajectory Embedding (PHATE)32 for all data normalization. Library.size.normalize() function was used, and square root transformation was applied. Using Seurat R package73, we selected 2000 most variable genes with the FindVariableFeatures() function. Data was scaled using ScaleData() function, with argument vars.to.regress = ‘nCount_RNA’. For downstream analyses we selected the first 25 principal components (PCs) and clustered the cells using the FindClusters() function, with a resolution parameter of 0.7. Iterations of the resolution parameter from 0 to 1.2 to indicated cluster stability. Uniform Manifold Approximation and Projection (UMAP) analysis was applied for dimensionality reduction. Differentially expressed genes (DEGs) were detected using FindAllMarkers() function with default statistical parameters. Dotplot was created using DotPlot() function in Seurat R package. Dot color intensity represents the average expression level of a gene in a cluster. Dot size corresponds to the percentage of cells expressing the gene in the cluster. PHATE maps were obtained using the normalized data of the 3 clusters determining the transdifferentiation process (LECs, LVC1 and LVC2). Single genes were plotted on UMAP and PHATE maps and presented as imputed values of the raw data using Markov Affinity-based Graph Imputation of Cells (MAGIC)74 with t = 2 parameter. For PAGA, data was imported from Seurat object to Scanpy75 using SeuratDisk R package. Nearest neighbors were computed using sc.pp.neighbors() function, with 25 PCs. PAGA graph was computed using sc.tn.paga() function with default parameters.
Trajectory inference was computed using Slingshot33 R package on UMAP embeddings and cluster labels as determined by Seurat. start.clus parameter was set to LECs.
Statistical Analyses
Statistical significance between two samples was calculated using the unpaired two-tailed Student’s t-test assuming unequal variance from at least three independent experiments, unless stated otherwise. In all cases normality was assumed and variance was comparable between groups. Sample size was selected empirically following previous experience in the assessment of experimental variability. The investigators were not blinded to allocation during experiments and outcome assessment. Numerical data are the mean ± s.e.m., unless stated otherwise. Statistical calculations and the graphs for the numerical data were performed using Prism 5 software (GraphPad Software, Incorporated, La Jolla, CA, USA). Statistical analyses for single cell and bulk RNA-Seq experiments are provided in the corresponding sections.
The datasets generated during and/or analysed during the current study are available in the GEO repository, GSE197161.
All illustrations and cliparts shown in Figures and Extended Data (except Fig. 1i) were obtained from Biorender
Extended Data
Extended Data Fig. 1: Morphological and molecular characterization of anal and dorsal fins formation.
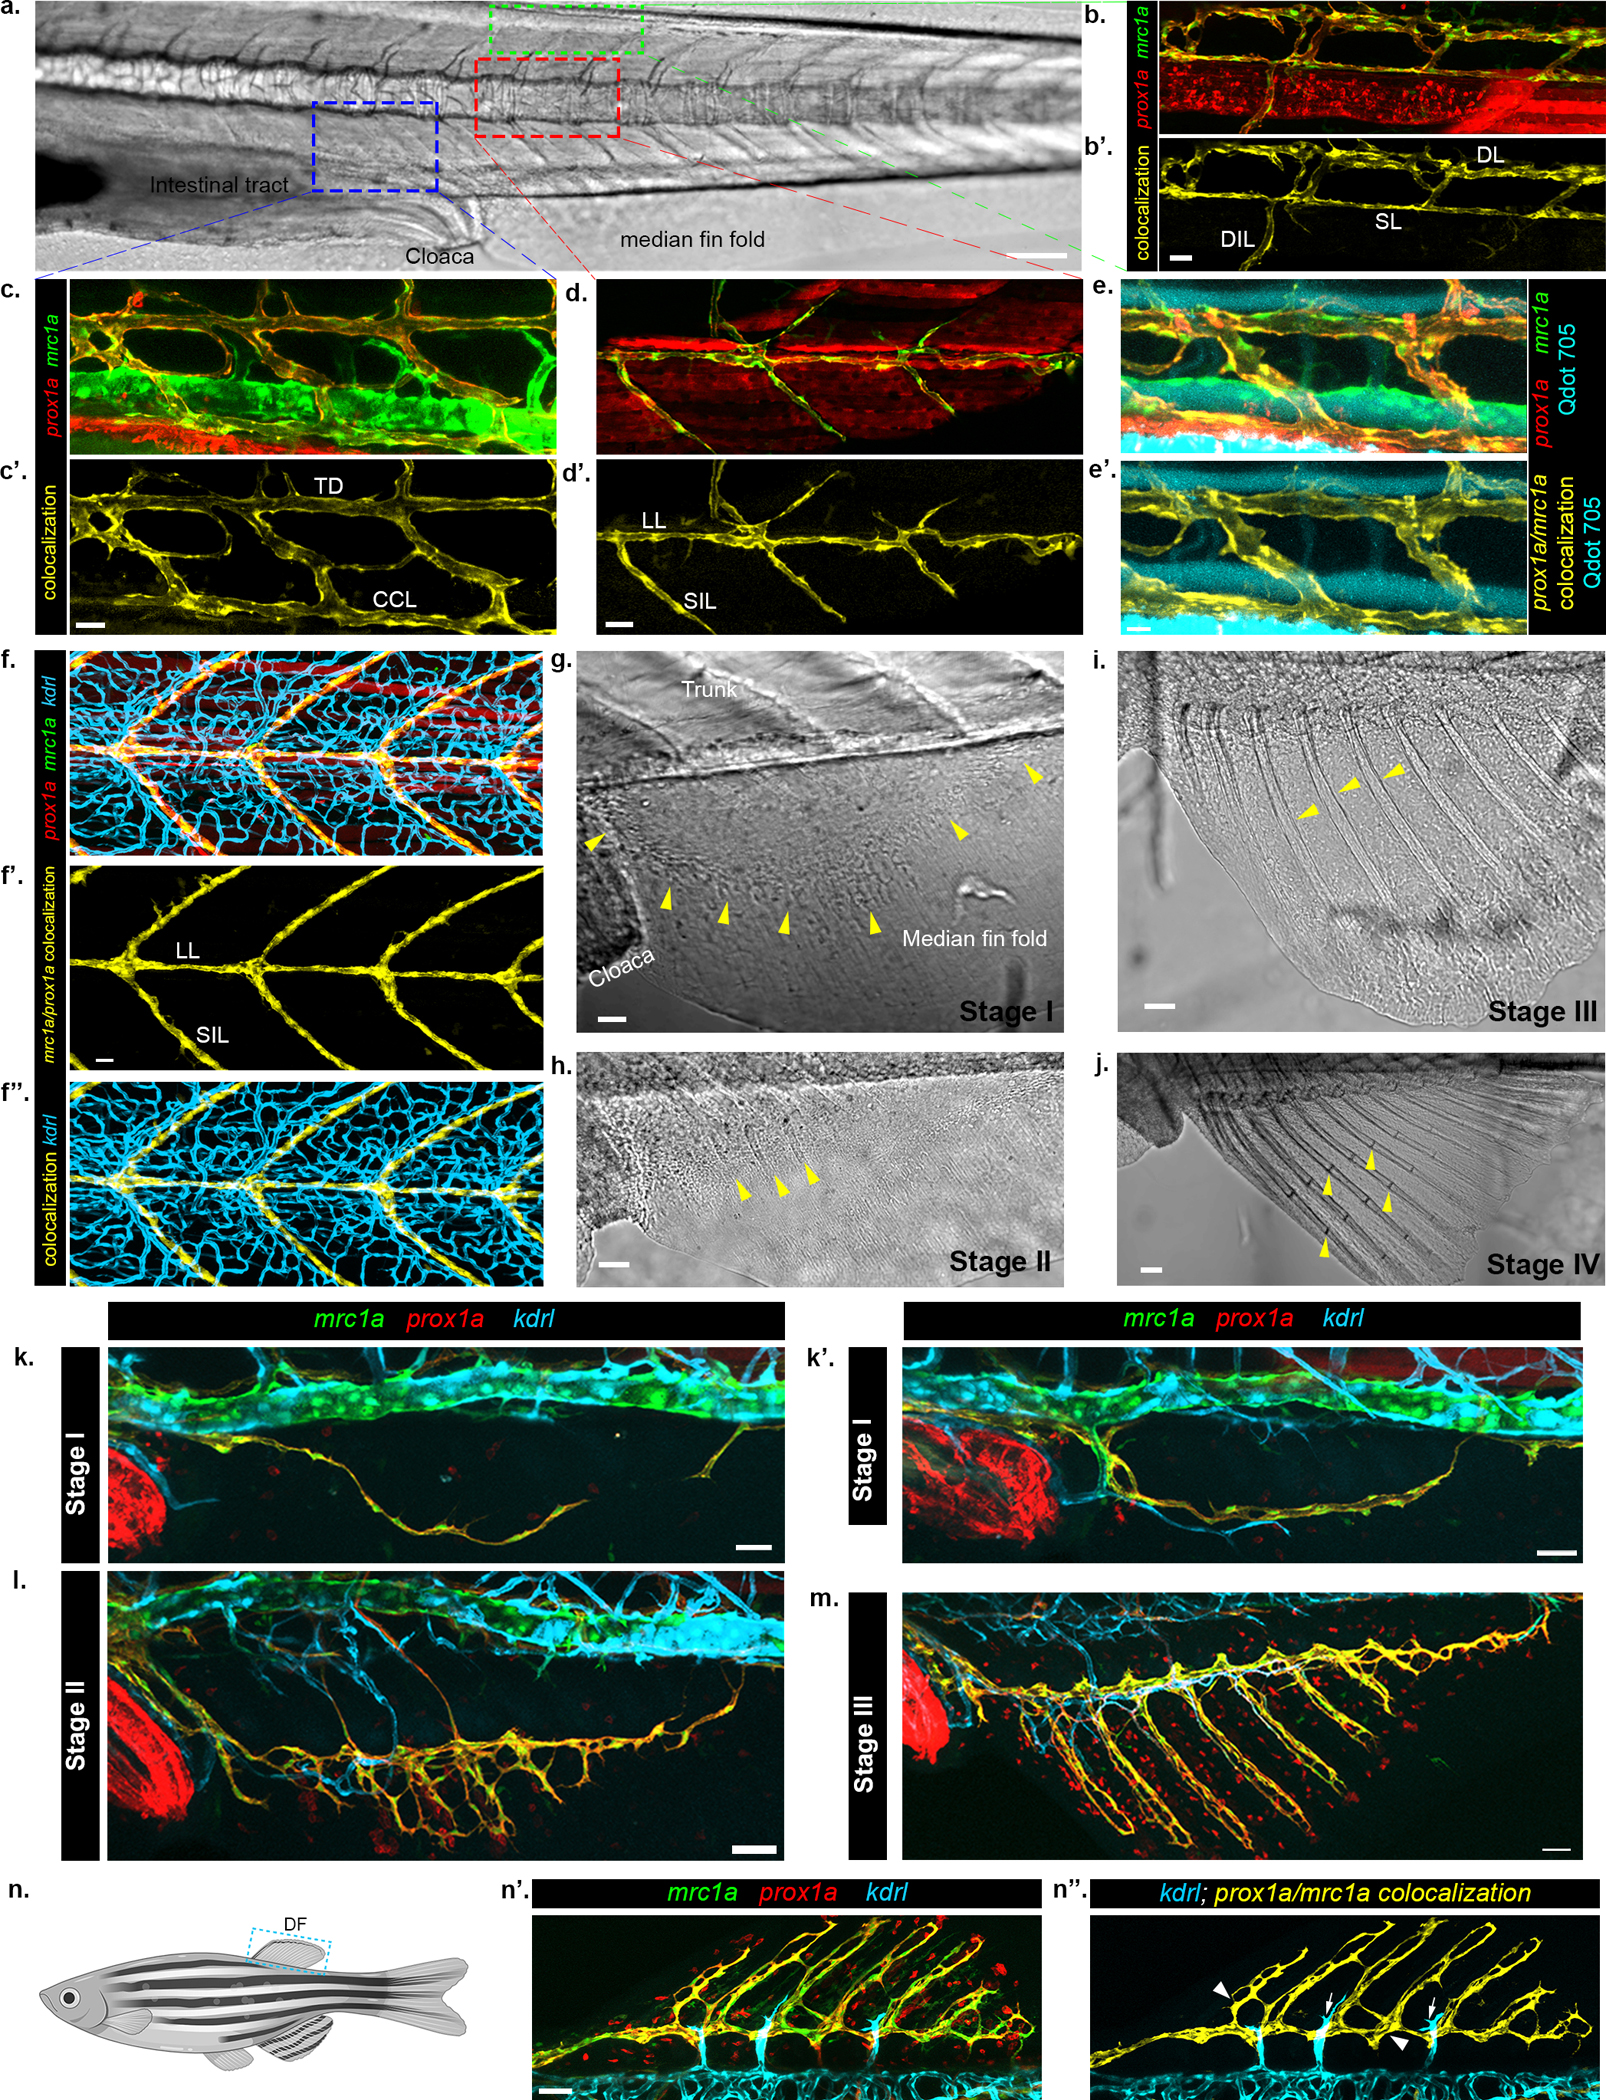
a-d’, mrc1a:EGFP and prox1a:RFP colocalization specifically highlights lymphatic vessels in zebrafish larvae. a, Bright-light image of 14 dpf zebrafish trunk, with boxes demarking dorsal (green), medial (red) and ventral (blue) areas depicted in b-d. b,c,d, show prox1a (red) and mrc1a (green) transgene expression, b’,c’,d’ depict colocalization channel (yellow). e-e’, intravascularly injected Qdot705 (cyan) are detected within blood vessels but not in mrc1a/prox1a co-labelled lymphatics (yellow). f-f”, Trunk blood and lymphatics vessels are differentially visualized in kdrl:BFP;mrc1a:EGFP;prox1a:RFP juvenile fish. mrc1a/prox1a colocalization (f’) labels lymphatics, while kdrl highlights blood vessels (f”, blue). g-j, Bright-light images of AF development with yellow arrowheads indicating important stage-specific features, such as mesenchyme condensation (g, arrowheads), appearance of rays (h, arrowheads), ray growth (i, arrowheads) and formation of joints (j, arrowheads). AF is first detected when the larva reaches ~5.2 mm in length (~15–17dpf). k-m, Triple Tg(prox1a:RFP;mrc1a:EGFP;kdrl:BFP) juvenile zebrafish, whose prox1a:RFP;mrc1a:EGFP colocalization channel is shown in Fig. 1c–g. n-n”, LVC mediated vascularization of DF. n, Schematic showing the position of the DF. n’,n”, Confocal images of Tg(prox1a:RFP;mrc1a:EGFP;kdrl:BFP) animals show contribution of LVC and BVC during DF formation. n’ shows all channels, n” shows prox1a:RFP;mrc1a:EGFP colocalization channel along with kdrl:BFP. Scale bars, 20μm (e’), 30μm (b’,c’,d’,f’,g,k,k’), 50μm (h,i,l,m,n’), 100μm (j), 150μm (a). DL, Dorsal lymphatic, SL, Spinal lymphatic, DIL, Deep intersegmental lymphatic, TD, Thoracic duct, CCL, Collateral cardinal lymphatic, LL, Lateral lymphatic, SIL, Superficial intersegmental lymphatic.
Extended Data Fig. 2: Molecular characterization of the AF vascular component.
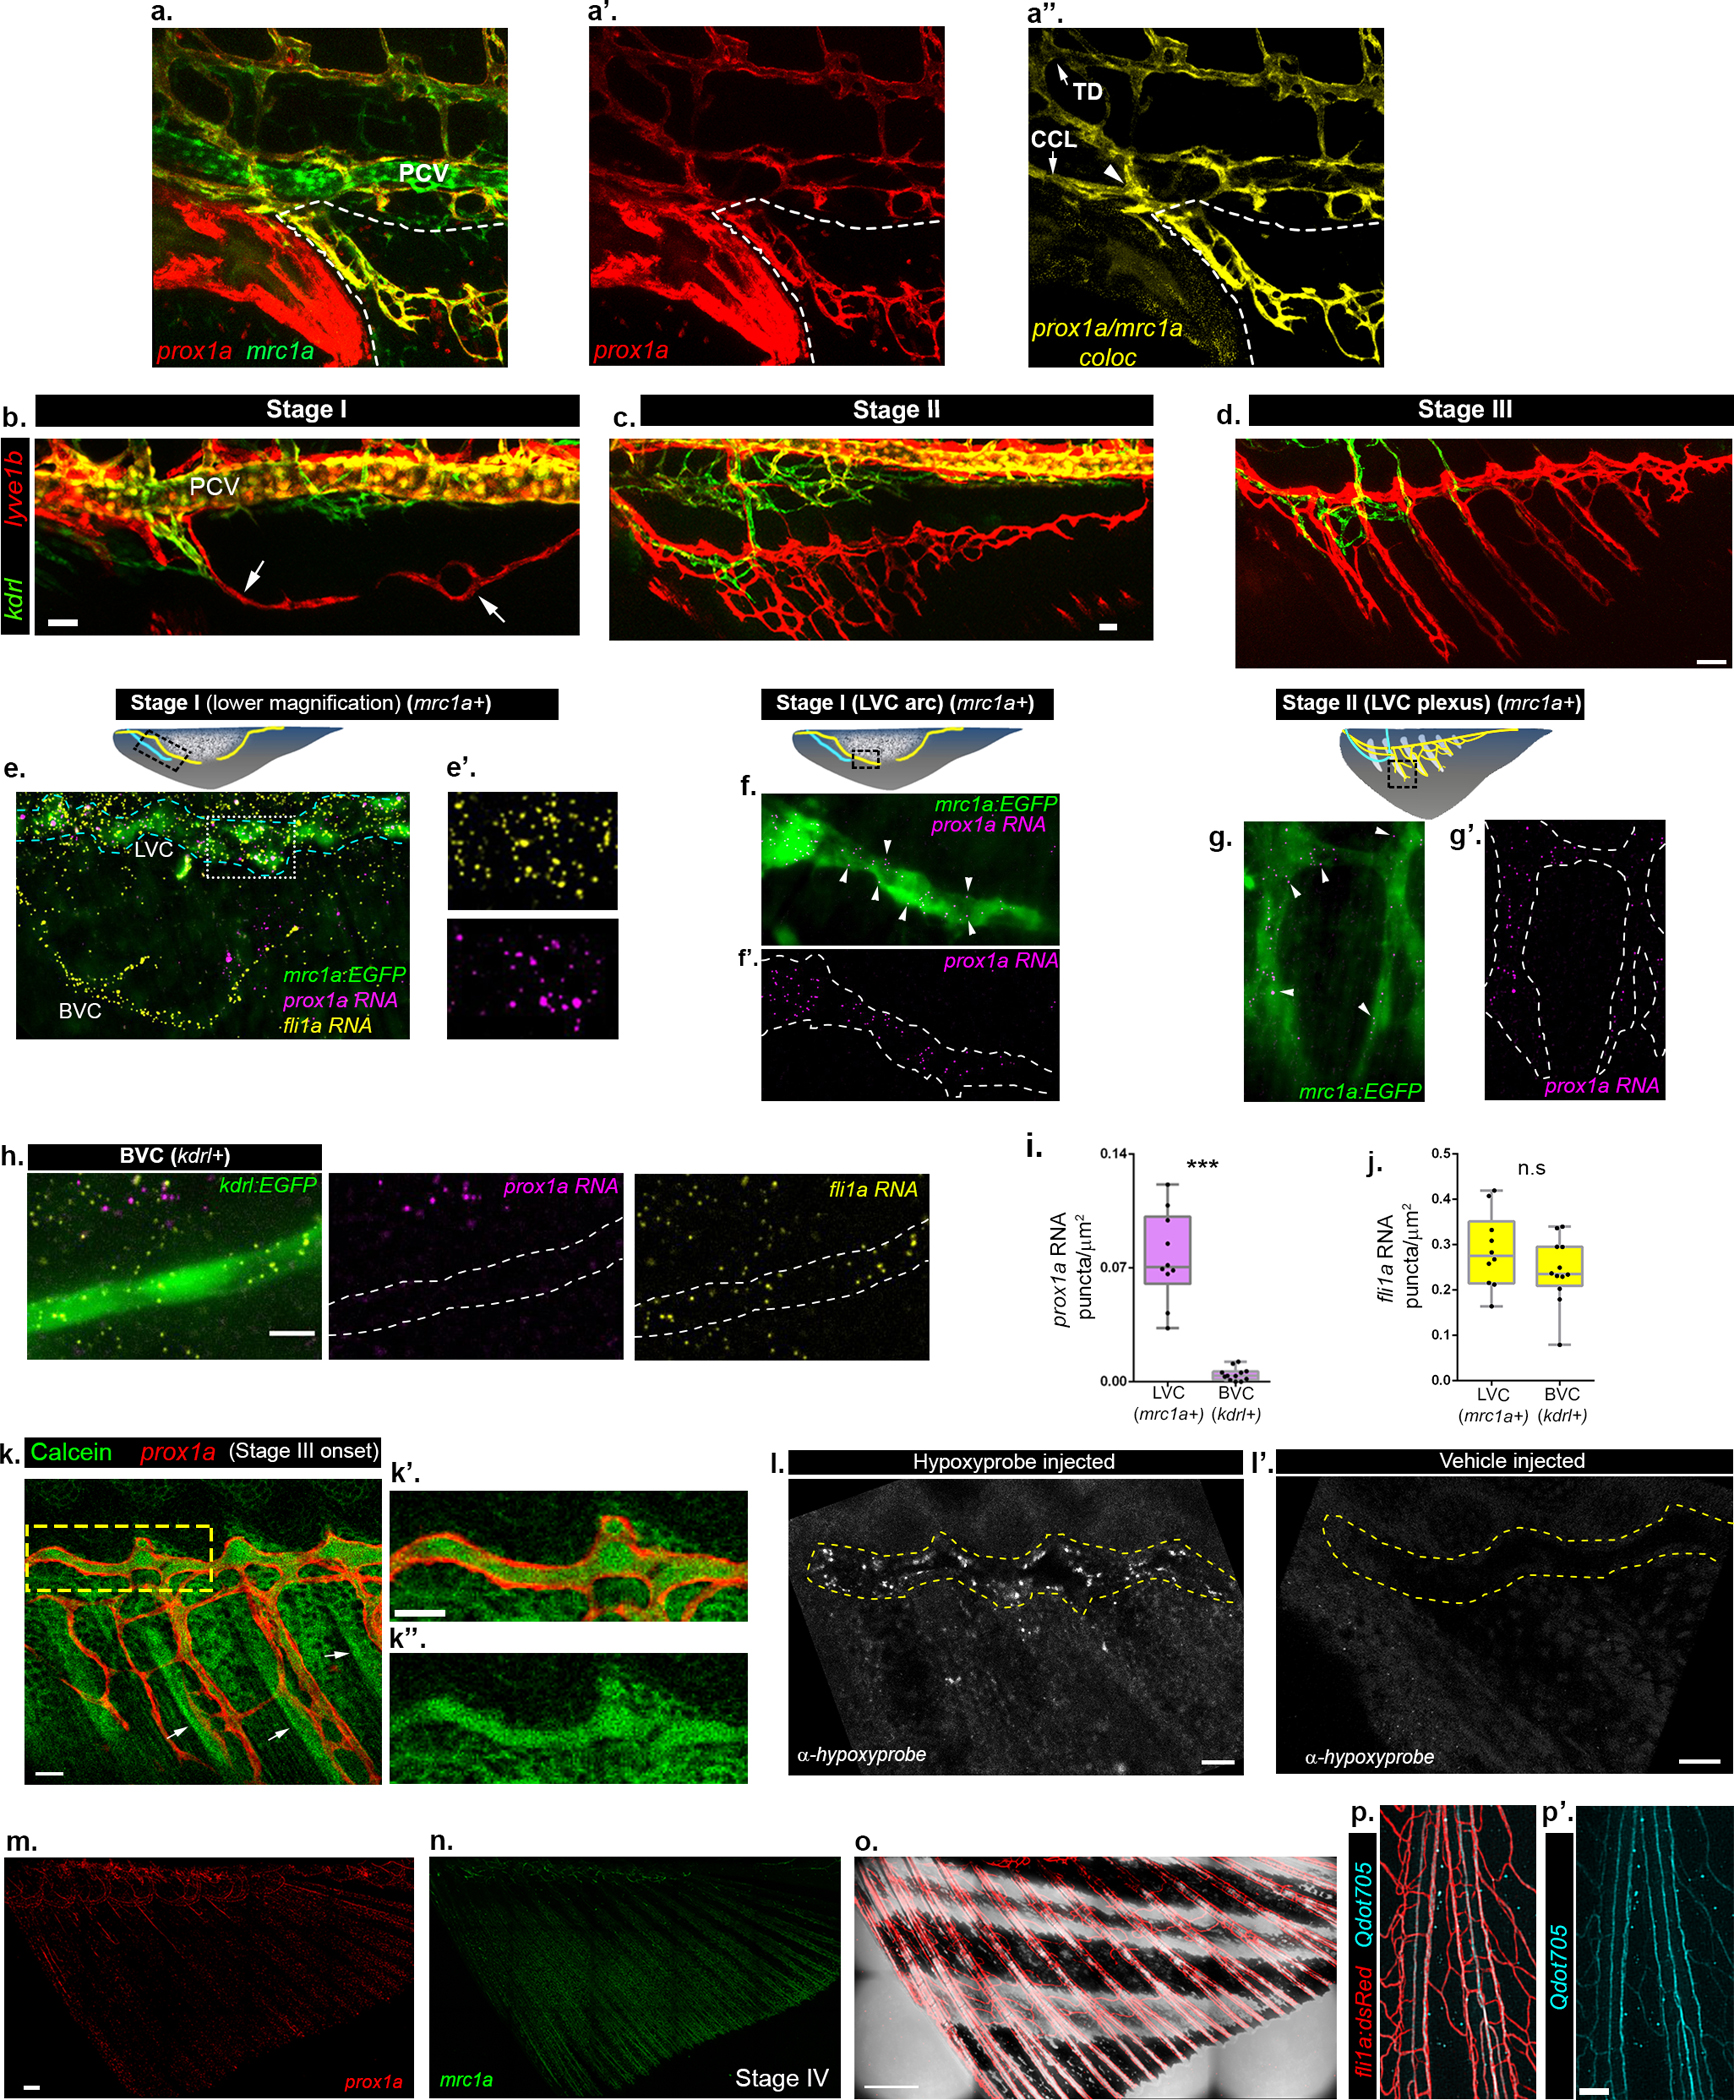
a-a”, Confocal image of Tg(mrc1a:GFP;prox1a:RFP) larva showing connection (a”, arrowhead) of AF lymphatic sprout to the TD and CCL (a”, arrows). White dashed lines demarcate the developing AF; a” depicts colocalization channel. b-d, Expression of lyve1b:dsRed through stages I-III of AF development shown along with kdrl:GFP+ BVC. Arrows in b point to the LVC sprouts at stage I. e-j, smFISH analysis of blood and lymphatic marker expression at stages I (e,f,h) and II (g) of AF development. e-h, prox1a mRNA puncta (magenta) are detected only in mrc1a:GFP+ LVC, while fli1a puncta (yellow) marks both the kdrl:GFP+ BVC and mrc1a:GFP+ LVC (e,e’,h). Blue dashed lines enclose the LVC and white box demarcates the insets shown in e’. Illustrations indicate the imaged ROI (black dashed box). I,j, Abundance of prox1a mRNA (i) and fli1a mRNA (j) (nAFs-LVC=10; nAFs-BVC =12) in LVC vs BVC. Boxes show 25th to 75th percentiles, line depicts median and whiskers show the full range of the data points. k-k”, Distribution of calcein in early stage III AF (k), following intramuscular injection in the trunk. k’,k”, High-magnification of yellow box in k, showing calcein (green) within the lumen of a prox1a+ LVC. Arrows point to the bony rays labeled by calcein. l-l’, Hypoxyprobe staining in stage II AF (l) and its vehicle (PBS) injected control (l’). Yellow dashed lines indicate the area of the main lymphatic vessel in the AF. m,n, Stage IV AF in prox1a (m) and mrc1a (n) transgenic fish, whose colocalization channel is depicted in Fig. 1k. o, Intact fli1a:dsRed+ vasculature is present in stage IV AFs. p,p’, Intravascularly injected Qdot705 are detected in all vessels (fli1a:dsRed+) of the adult AF. Scale bars, 20 μm (k,k’,l,l’), 30 μm (a,b,c), 50μm (d), 100μm (p,p’), 200μm (m), 500 μm (o). TD, Thoracic duct, CCL, Collateral cardinal lymphatic, PCV, Posterior cardinal vein.
Extended Data Fig. 3: A platform for long-term EC lineage tracing.
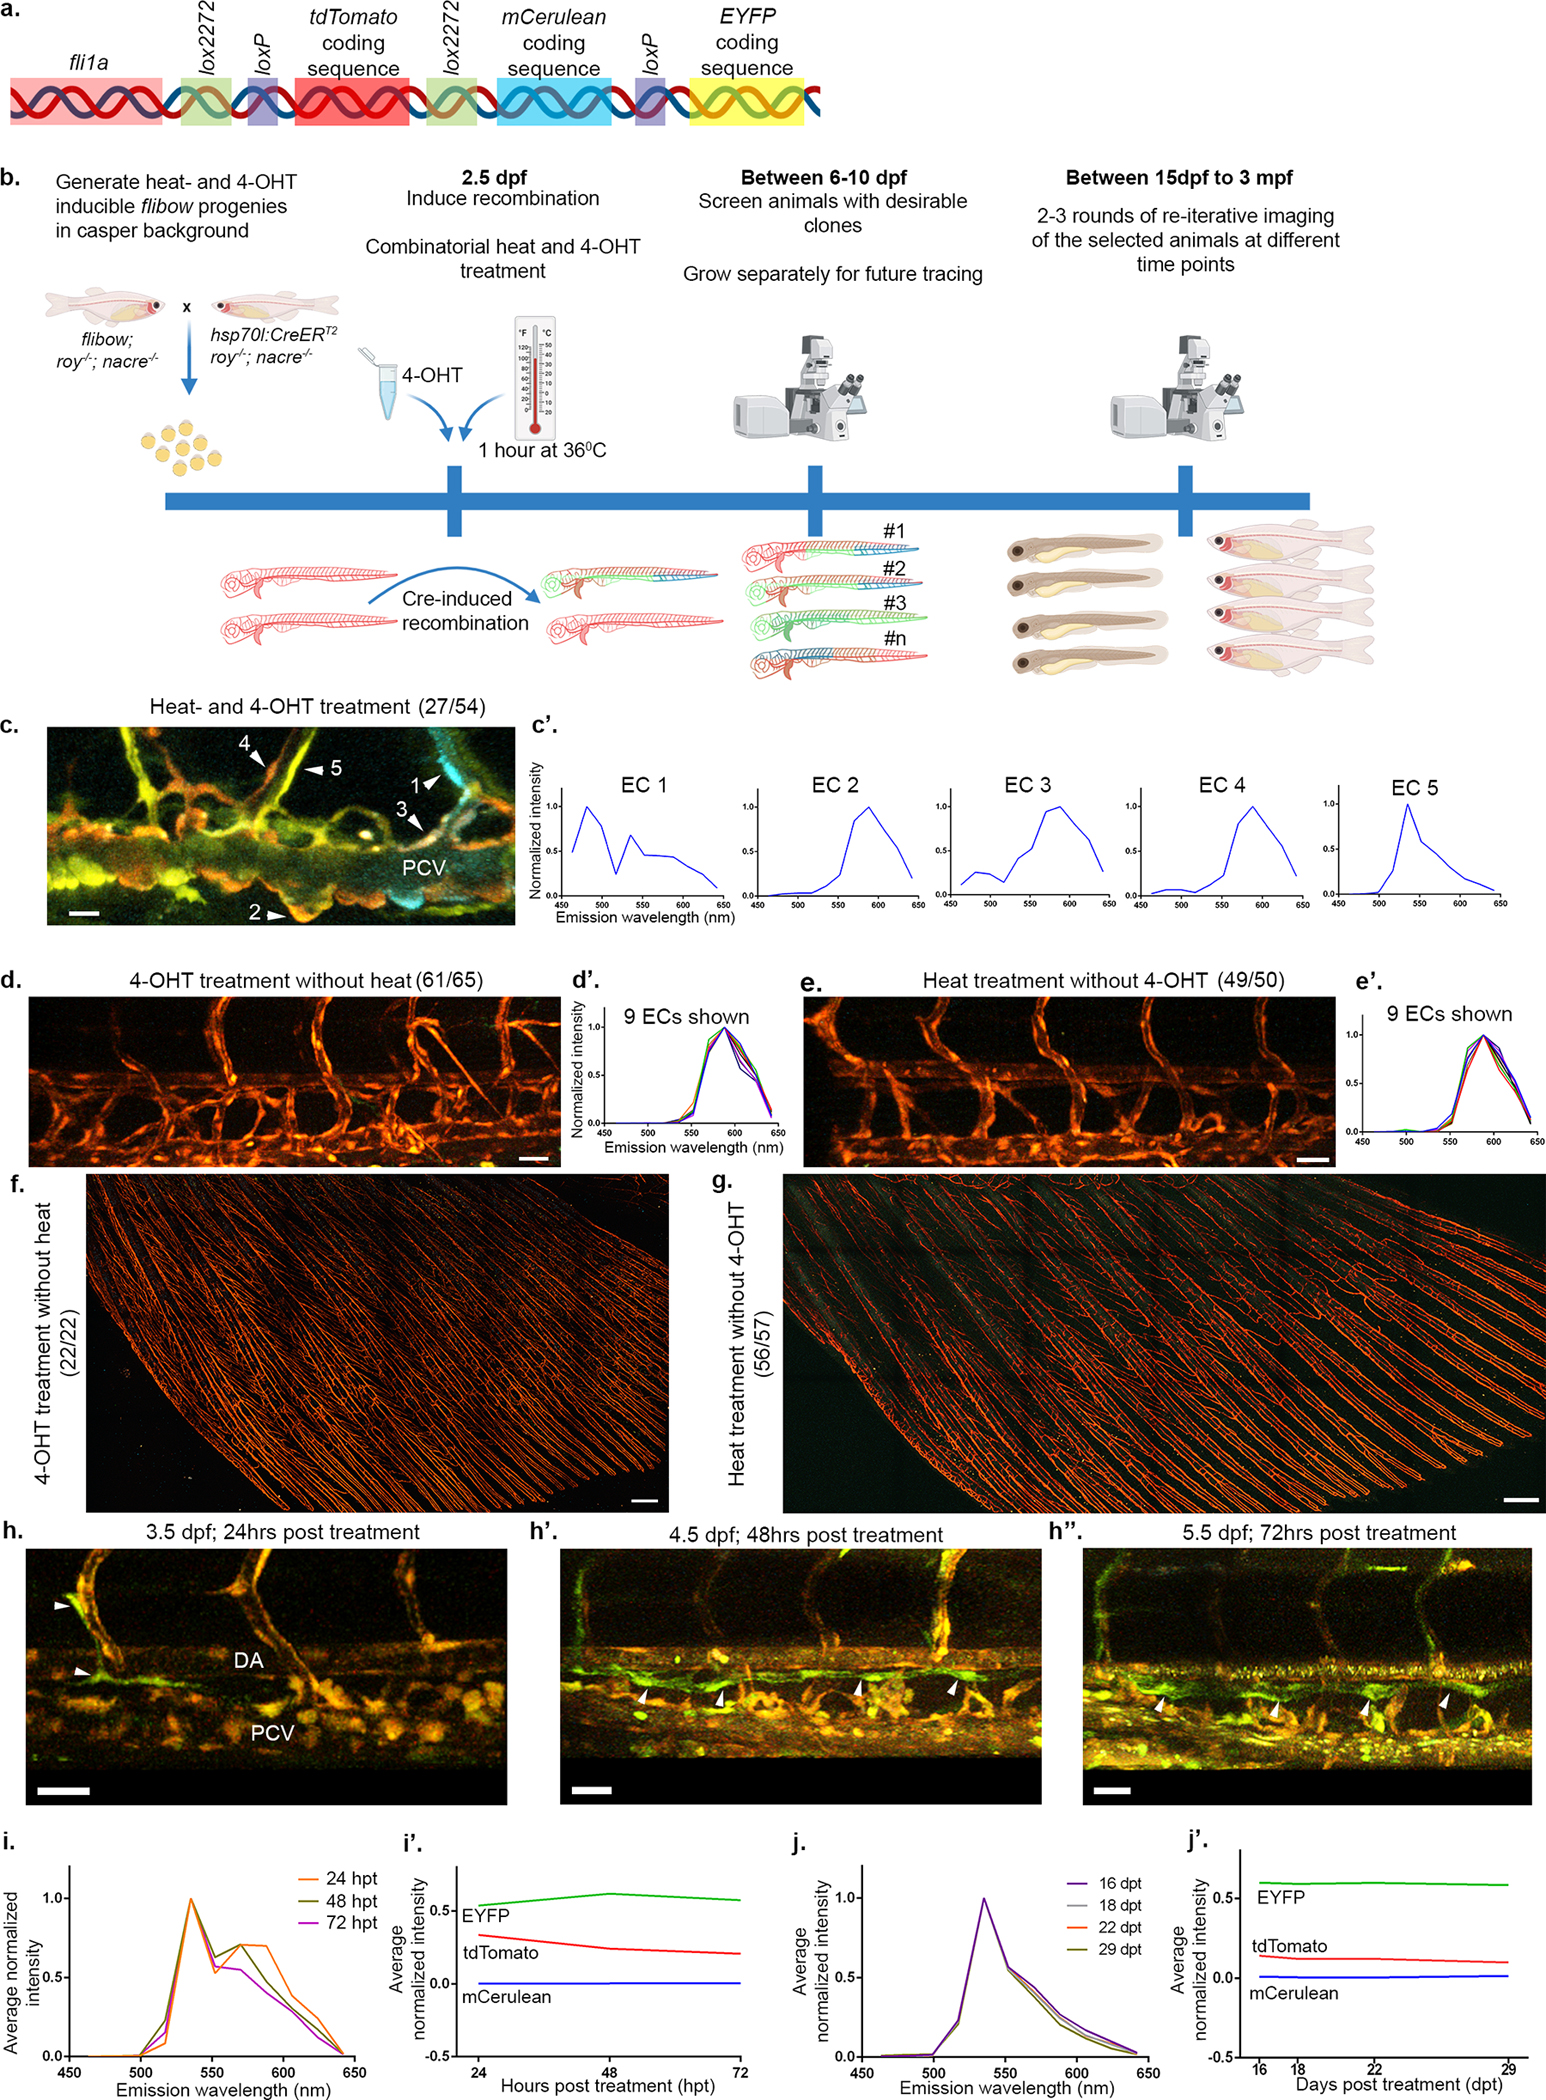
a, Schematic representation of the flibow construct used to drive expression of brainbow in ECs. Cre recombinase allows expression of different fluorescent proteins (mCerulean or EYFP) in non-recombinant (expressing tdTomato) animals. b, Schematic representation of the hsp70l:CreERT2;flibow lineage tracing protocol used in this study. c-g, Representative examples of induced recombination. Combined heat- and 4-OHT treatment allowed clear identification of 27 larvae (out of 54 screened) displaying differentially labelled ECs. c’, Normalized intensity plotted across a range of emitted wavelength (x-axis) from 5 PCV-ECs (c, numbered arrowheads), depicting how ECs display a unique spectral signature, based on the levels of expression of the 3 fluorophores. 4-OHT (d, 61/65) or heat treatment (e, 49/50) alone did not induce recombinant outcomes. d’ and e’ show ‘spectral signatures’ from 9 ECs from each group, demonstrating non-recombinant outcome depicted by the presence of tdTomato emission signal only. f, No recombination is detected in adult AFs treated with 4-OHT (22/22) or heat (g, 56/57) alone, and raised through adulthood. h-h”, Confocal images of flibow larvae showing distinct labeling of lymphatic components in the trunk starting from 24 hrs after Cre induction. h, ECs in the early TD of 3.5 dpf embryo labelled in green (arrowheads), are detected 24 hrs after heat and 4-OHT treatments. h’-h”, Reiterative imaging of the same embryo at 4.5 dpf (h’) and 5.5 dpf (h”) shows the growing TD composed of green ECs (arrowheads). i-j’, Assessment of the stability of the fluorophore ratios after Cre induction. i,i’, Average normalized intensity from a ‘switched’ clonal population (n=4) measured at 24, 48 and 72 hours post treatment (hpt), showing slight deviation with time (i’). Intensities corresponding to each fluorophore are depicted separately for the 3 time-points and show a decay in tdTomato signal, that contributes to the deviation in the spectral signature shown in i. j,j’, Similar measurements carried out on ‘switched’ clonal ECs from another sample at 16, 18, 22, 29 days post treatment (dpt), shows a negligible deviation between the channels (j), along with stable intensity proportions between the fluorophores (j’). Scale bars, 15 μm (c), 30 μm (d,e,h,h’,h”), 300 μm (f,g). PCV, Posterior Cardinal vein; DA, Dorsal Aorta; EC, endothelial cell; 4-OHT, 4-hydroxytamoxifen.
Extended Data Fig. 4: Lineage tracing of BVC and LVC in growing AF.
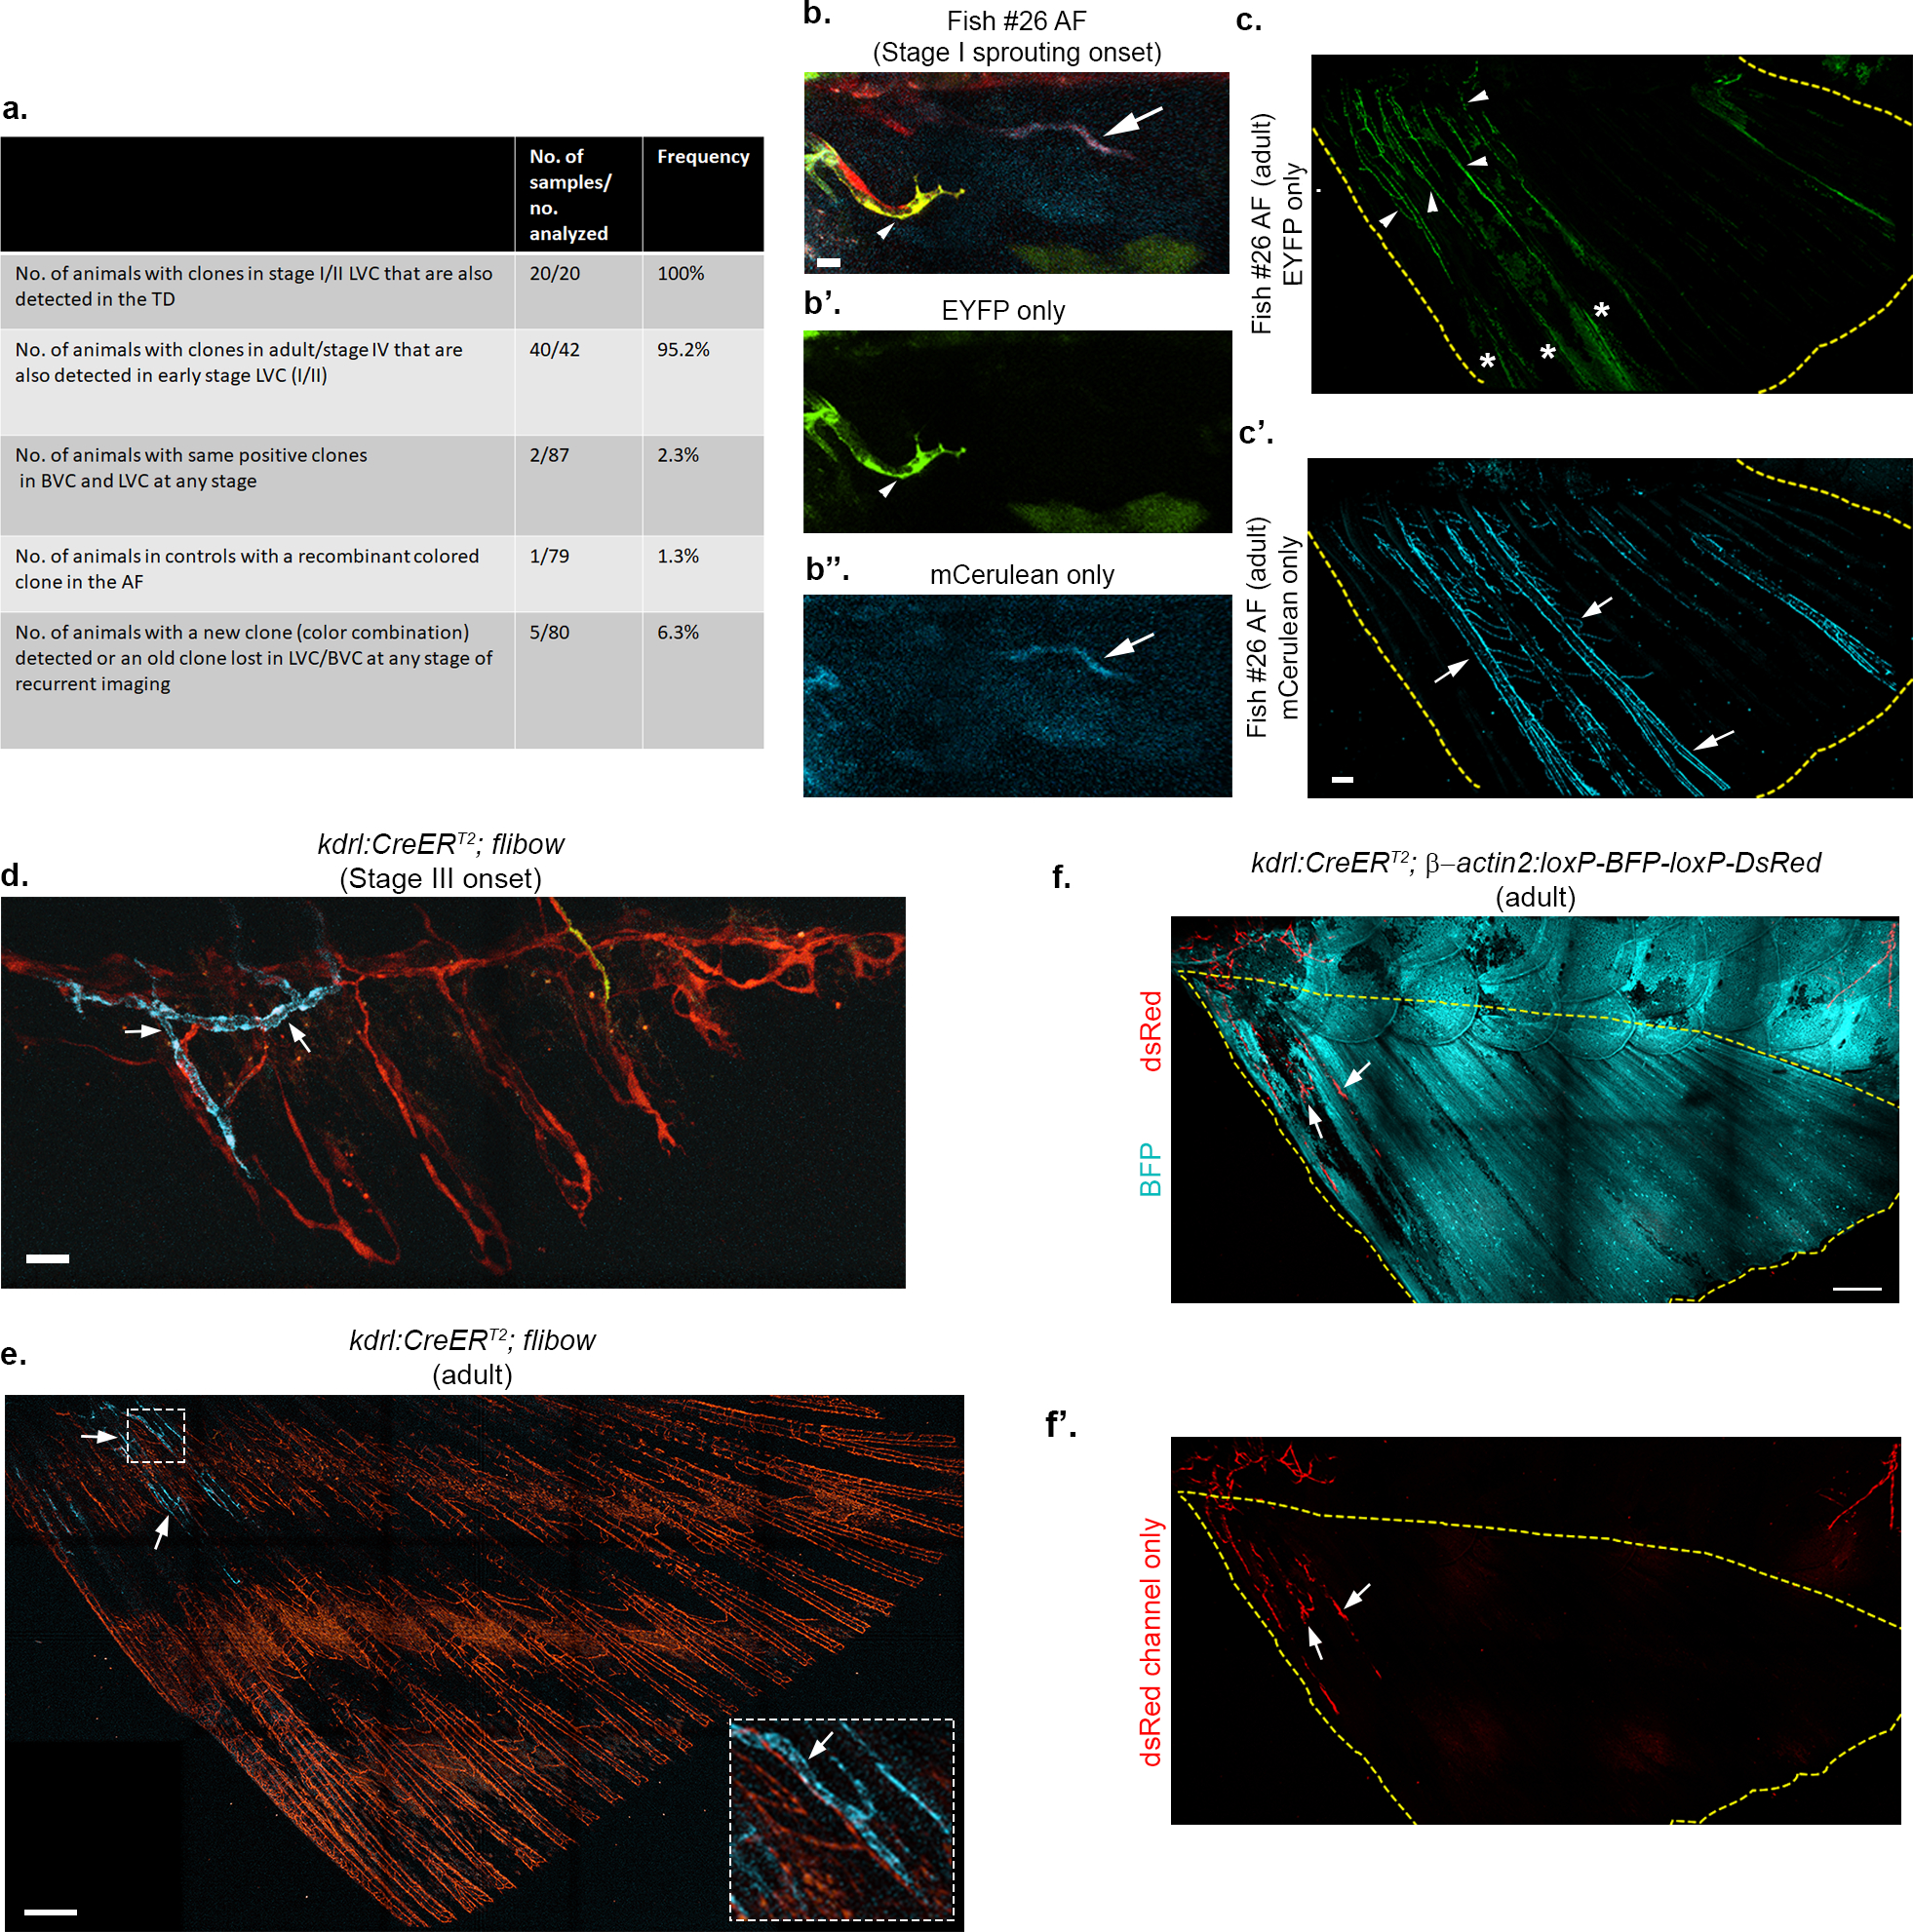
a, Summary of hsp70l:CreERT2; flibow experiments. b-c’, Confocal images of flibow fish AF (Fish #26) showing a green labeled-blood vessel sprout generating the BVC in stage I AF (b,b’, arrowhead, green). Clonally related ECs are detected in the dorso-anterior AF of the same animal at adult stages (c, arrowheads). Initial lymphatic sprout (b,b”, arrows, blue) in contrast, expands throughout the entire fin (c’). AF is demarcated by yellow dashed lines, asterisks in c indicate signal from unrelated non-EC autofluorescence. d-e, Flibow lineage tracing of BVC. Confocal images of the kdrl:CreERT2; flibow stage III (d) and adult AF (e) showing distinct labeling of BVC component near the trunk-fin junction (arrows). LVC-derived ray vessels display non-recombinant tdTomato signal. White dashed box indicates region shown in the inset. The lack of fluorescent signal in the middle of AF is due to obstruction by the pigmented stripes in non-casper fish. f-f’, Confocal images of the kdrl:CreERT2;β-actin2:loxP-BFP-loxP-DsRed adult AF showing contribution of BVC (arrows) to AF vasculature. When kdrl:CreERT2 mediated recombination was induced between 3.5–5.5 dpf (nswitch line=40, nflibow=66), 100% of the labeled clones found in the AF (nswitch line=10, nflibow=18), were restricted to the BVC. Yellow dashed lines indicate the boundaries of the AF. Scale bars, 10 μm (b), 30 μm (d), 200 μm (c’), 300 μm (e,f).
Extended Data Fig. 5: Loss of lymphatic fate is associated with elevated expression of blood EC markers.
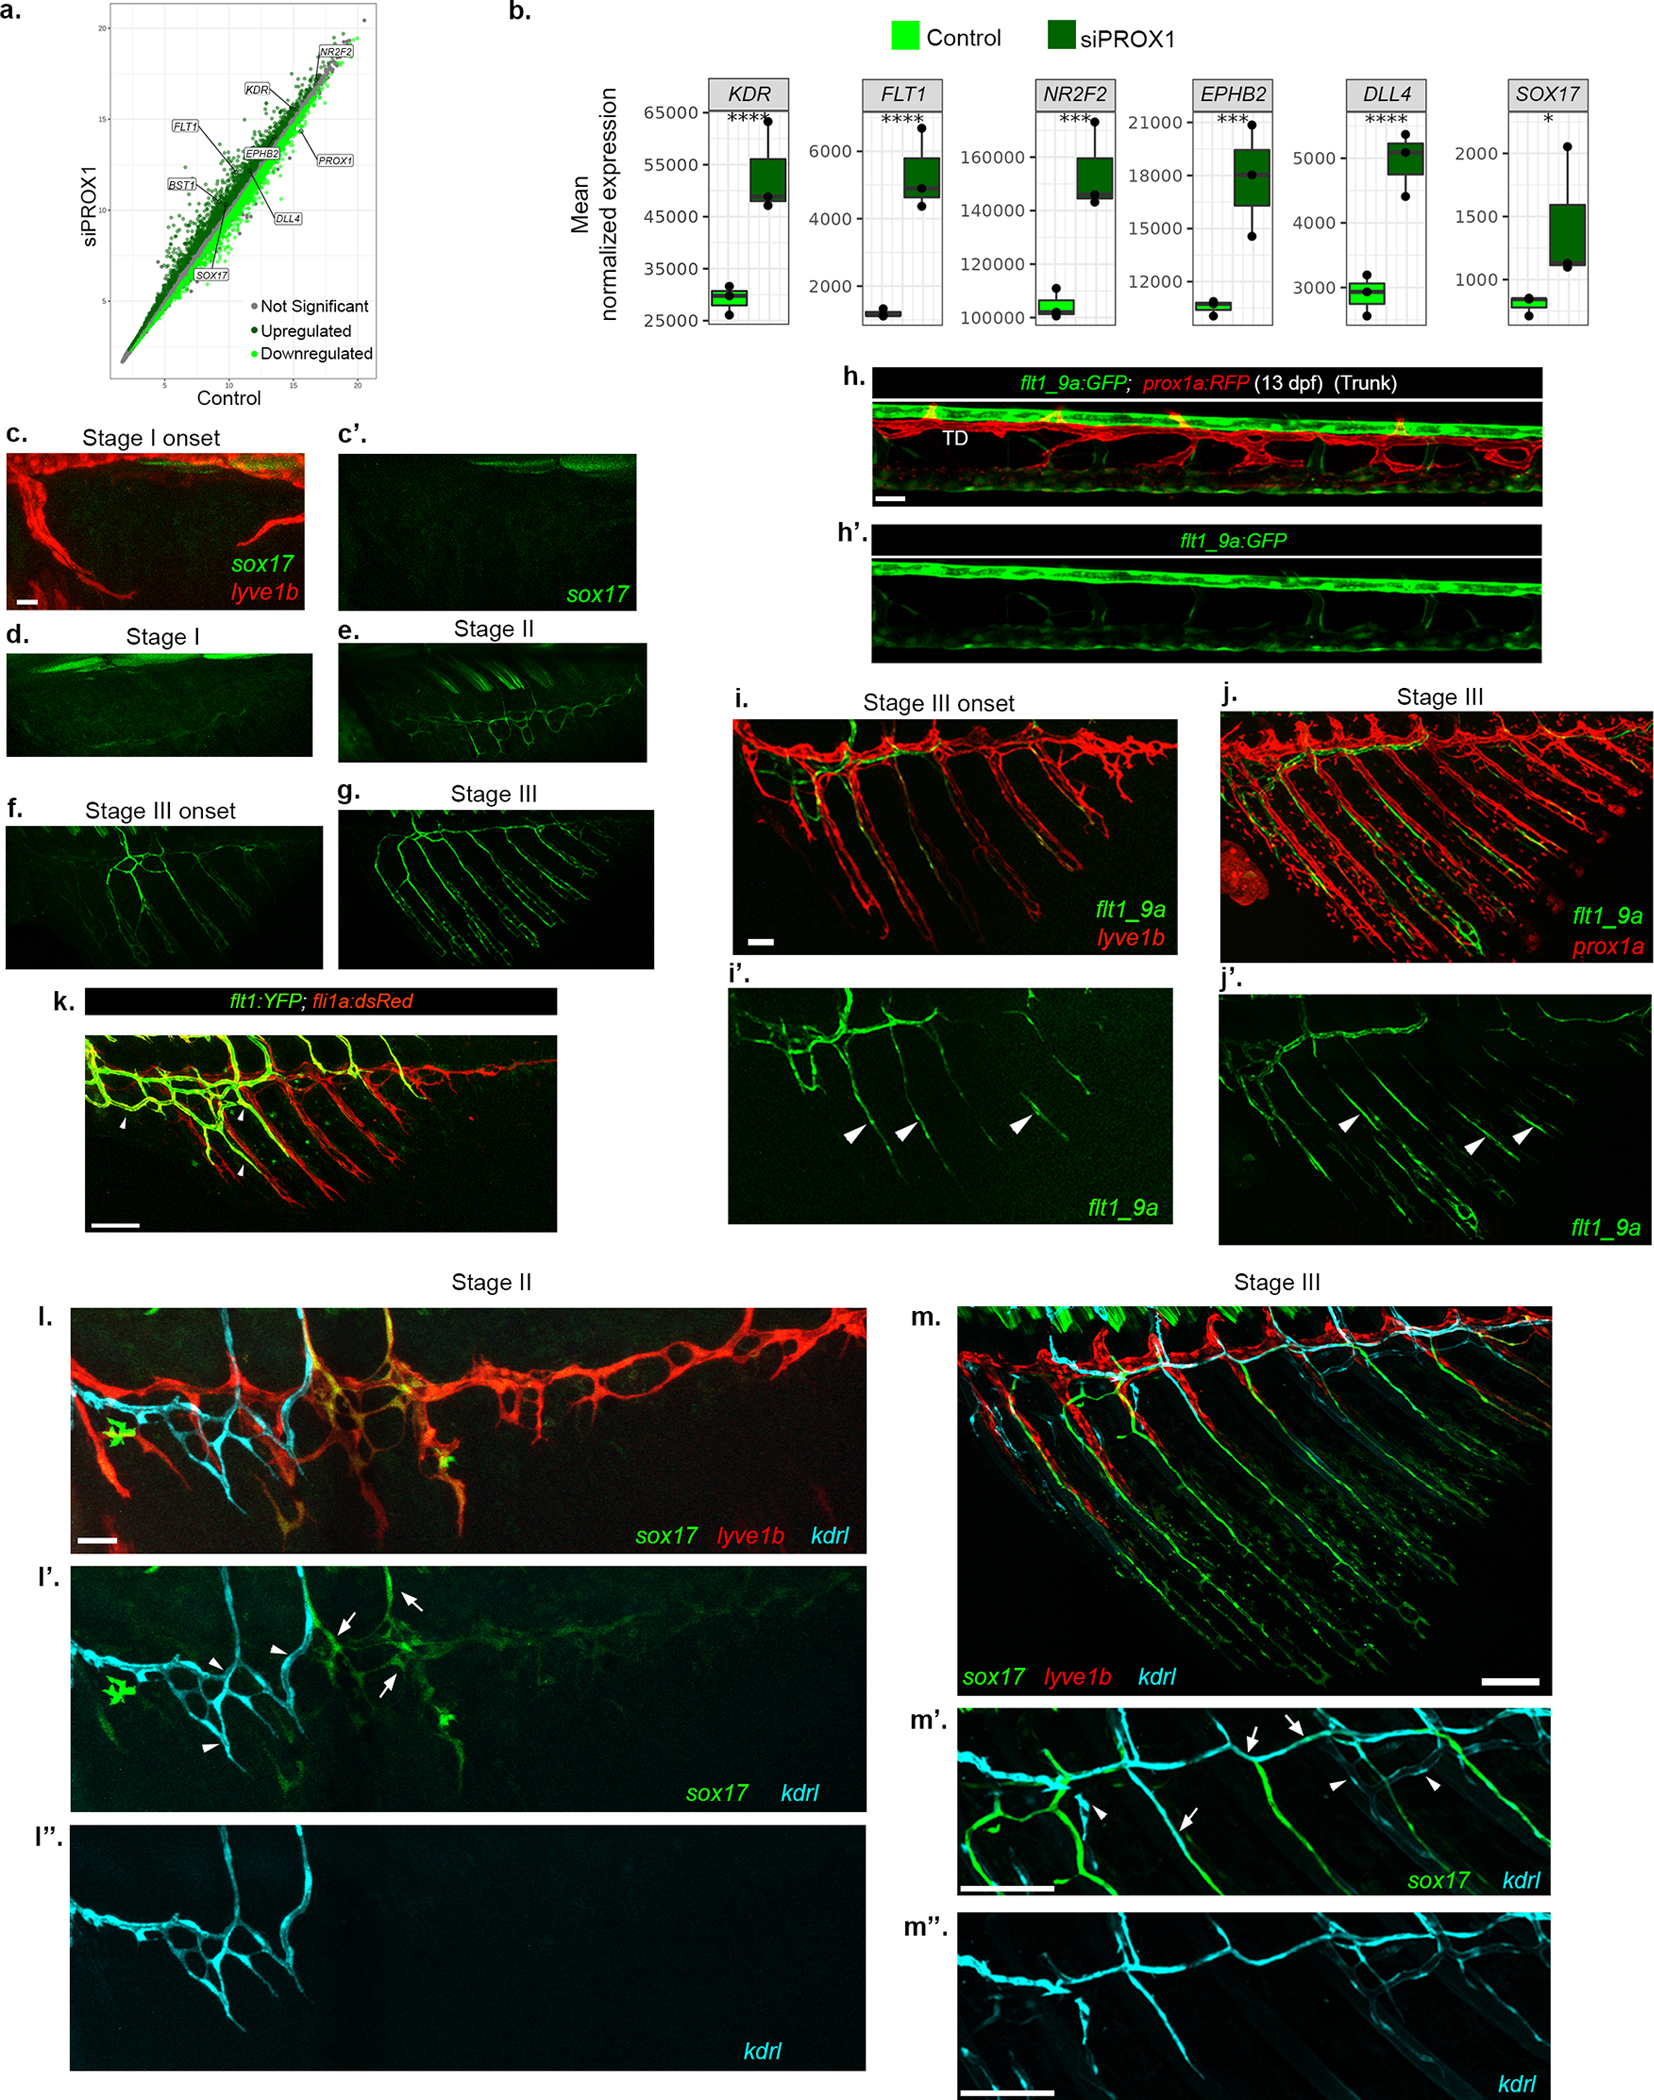
a-b, Scatterplot showing rlog expression of genes (a), in PROX1 suppressed HDLECs, that are upregulated (dark green), downregulated (light green) or did not change significantly (grey). Genes of interest are annotated in the plot. Plots (b) showing mean normalized expression of selected genes upregulated following PROX1 suppression in HDLECs (siPROX1). The box in the plots show 25th to 75th percentiles, the line shows the median and the whiskers show the full range of the data points. (****, p-adj value<0.0001; ***, p-adj value<0.001; *, p-value<0.05, Wald test). c-g, Confocal images of Tg(sox17GFP) showing expression of sox17 across stages I-III AFs. c-c’, Initially, no sox17GFP expression is detected in lyve1b+ sprouts. d-g, Single GFP channel images of Fig 2h–k showing gradual enrichment of sox17 expression. h-h’, flt1_9a:EGFP does not label prox1a:RFP+ differentiated lymphatic vessels (TD) in 13 dpf larval trunk. i-j’, Gradual increase of flt1_9a:EGFP expression at stage III shown along with lyve1b:dsRed+ (i) and prox1a:RFP+ (j). Arrowheads in single GFP channel point to flt1_9a+ newly expressing ECs within the LVC plexus. k, Confocal image of Tg(flt1:YFP) showing specific expression in the BVC in early stage III AF (arrowheads). l-m”, Gradual expression of kdrl in sox17GFP + vessels of AF. l-l’, LVC (lyve1b:dsRed) and BVC (kdrl:BFP) shown together along with transdifferentiated LVC-ECs (sox17GFP) in stage II AF. The transdifferentiating LVC-ECs (l’, arrows) do not show expression of kdrl, which at this stage is restricted to BVC (l’, arrowheads; l”). m-m’, At the onset of stage IV (m), the growing sox17GFP + vessels, start expressing kdrl (m’, arrows). BVC-ECs are sox17GFP - but kdrl+ (m’, arrowheads; m”). Scale bars, 30μm (h,c,l), 50μm (i,j), 100μm (k). TD, Thoracic duct.
Extended Data Fig. 6: Expression of lymphatic and blood vessel-specific genes across the different scRNA-seq cell clusters.
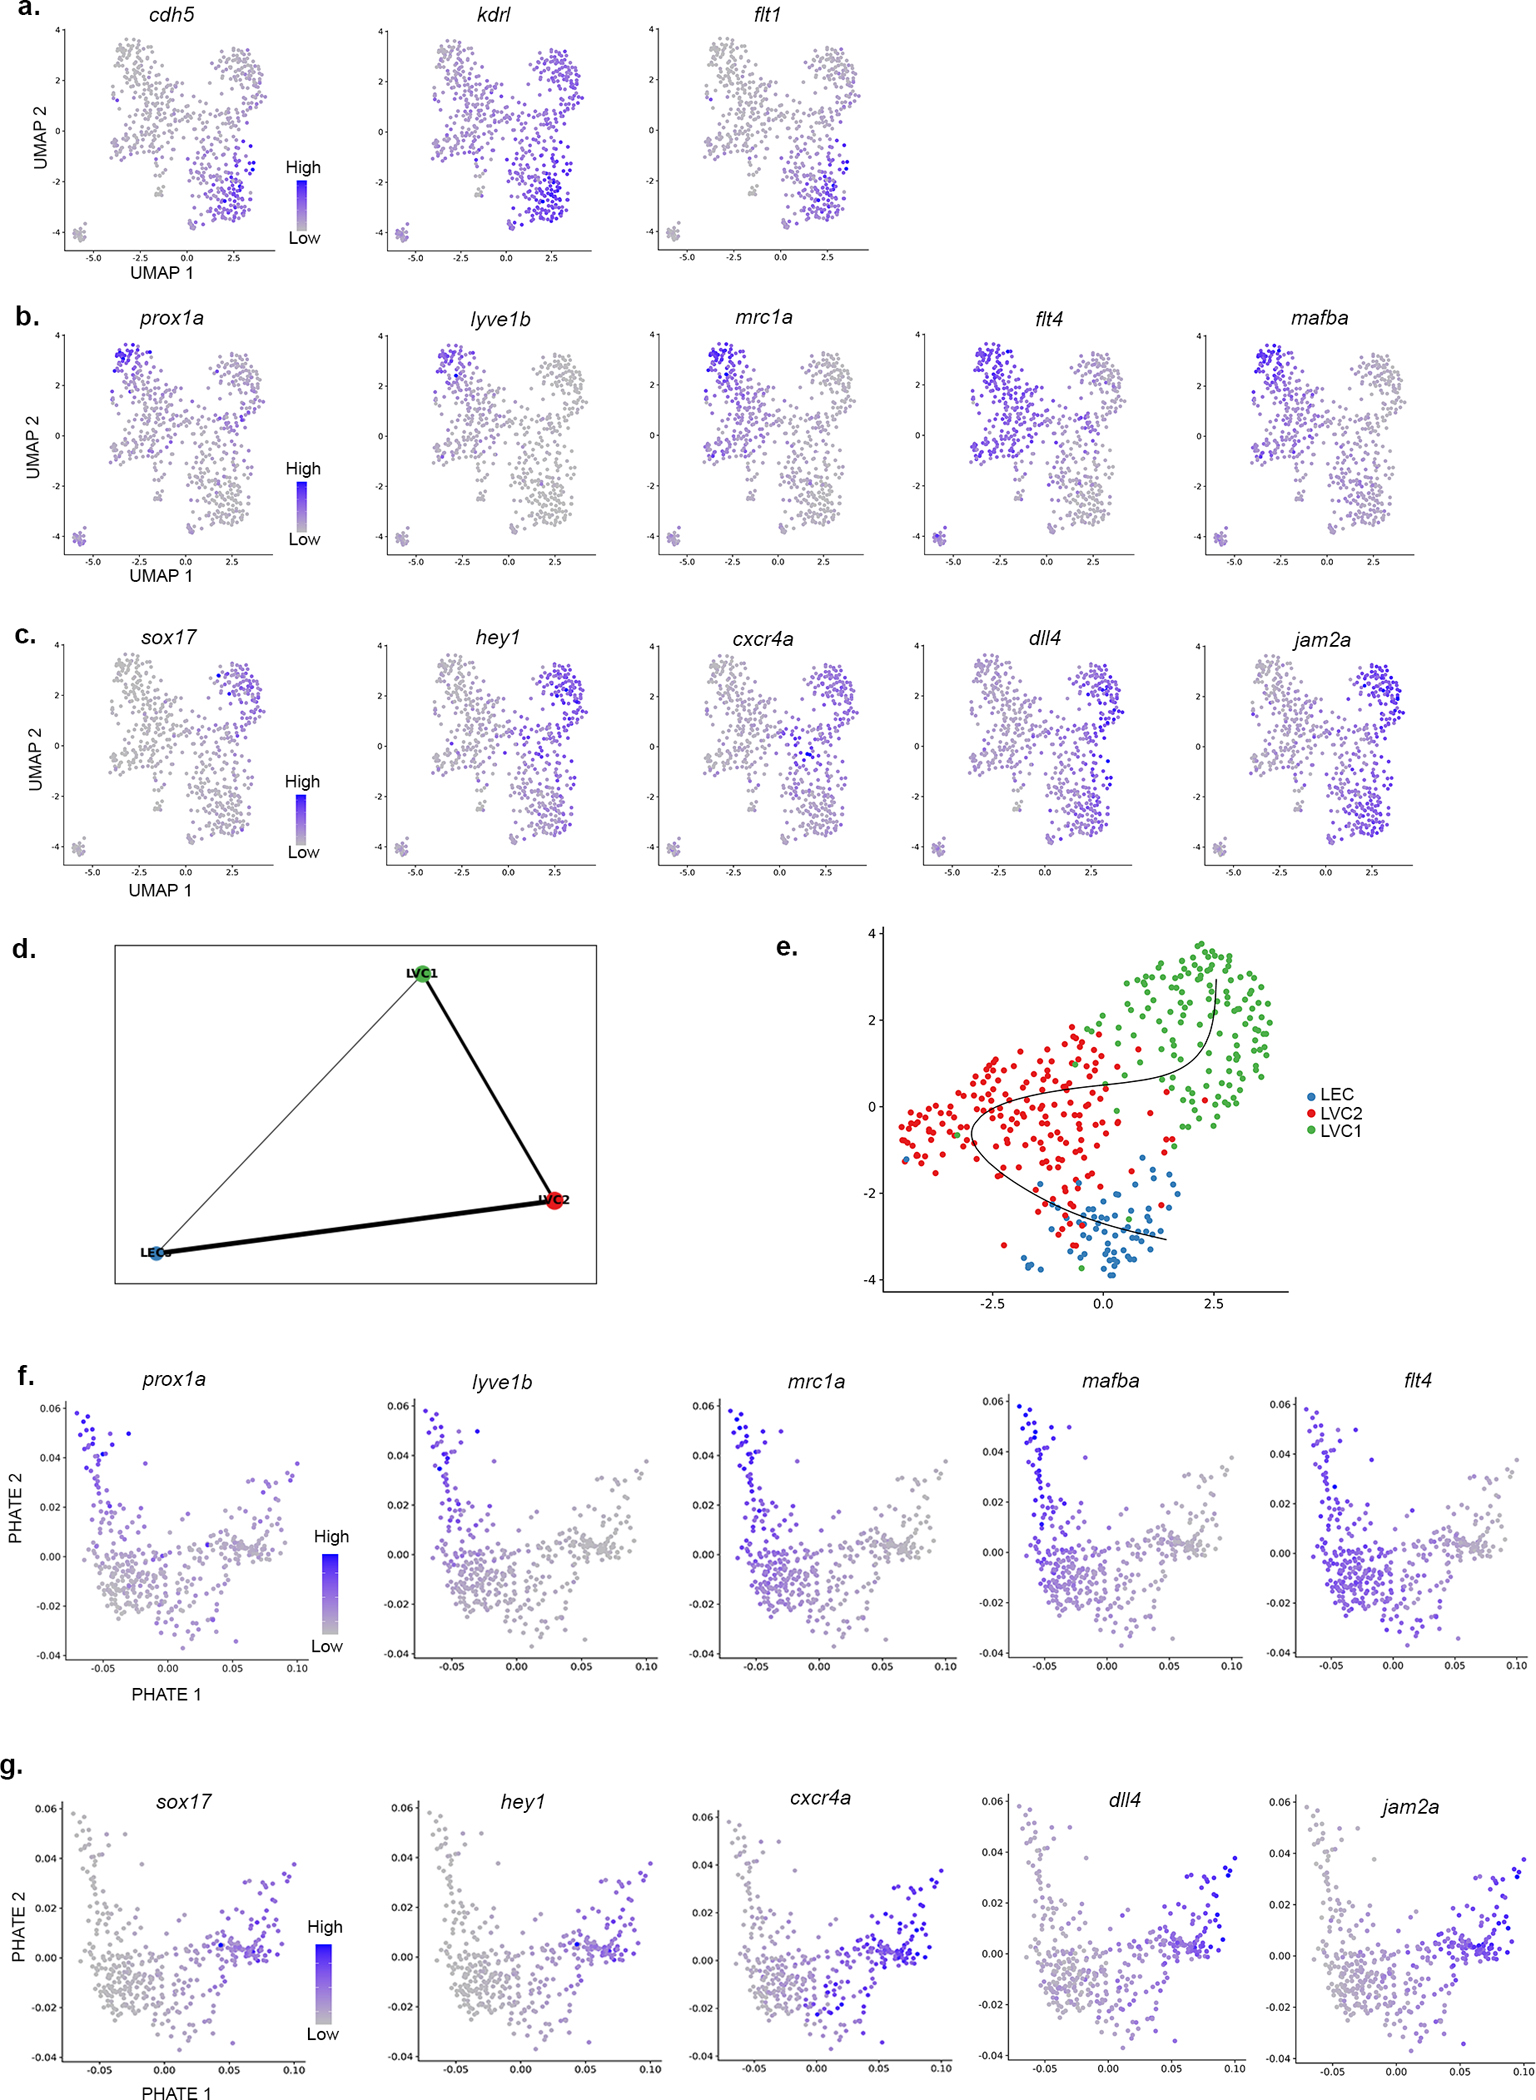
a-c, UMAP (shown in Fig. 2m) plots with embedded imputed expression of selected marker genes. a, Blood vessel markers specifically enriched in the BVC. b, Lymphatic markers specific for LEC cluster. c, Blood vessel markers enriched in LVC1 cluster (transdifferentiated LECs). d, Partition graph abstraction (PAGA) analysis of LVC clusters. e, UMAP showing the trajectory across the clusters (black line) following Slingshot analysis. f-g, PHATE (shown in Fig 2p) plots with embedded imputed expression of selected genes.
Extended Data Fig. 7: Sox17 misexpression results in suppression of lymphatic fate.
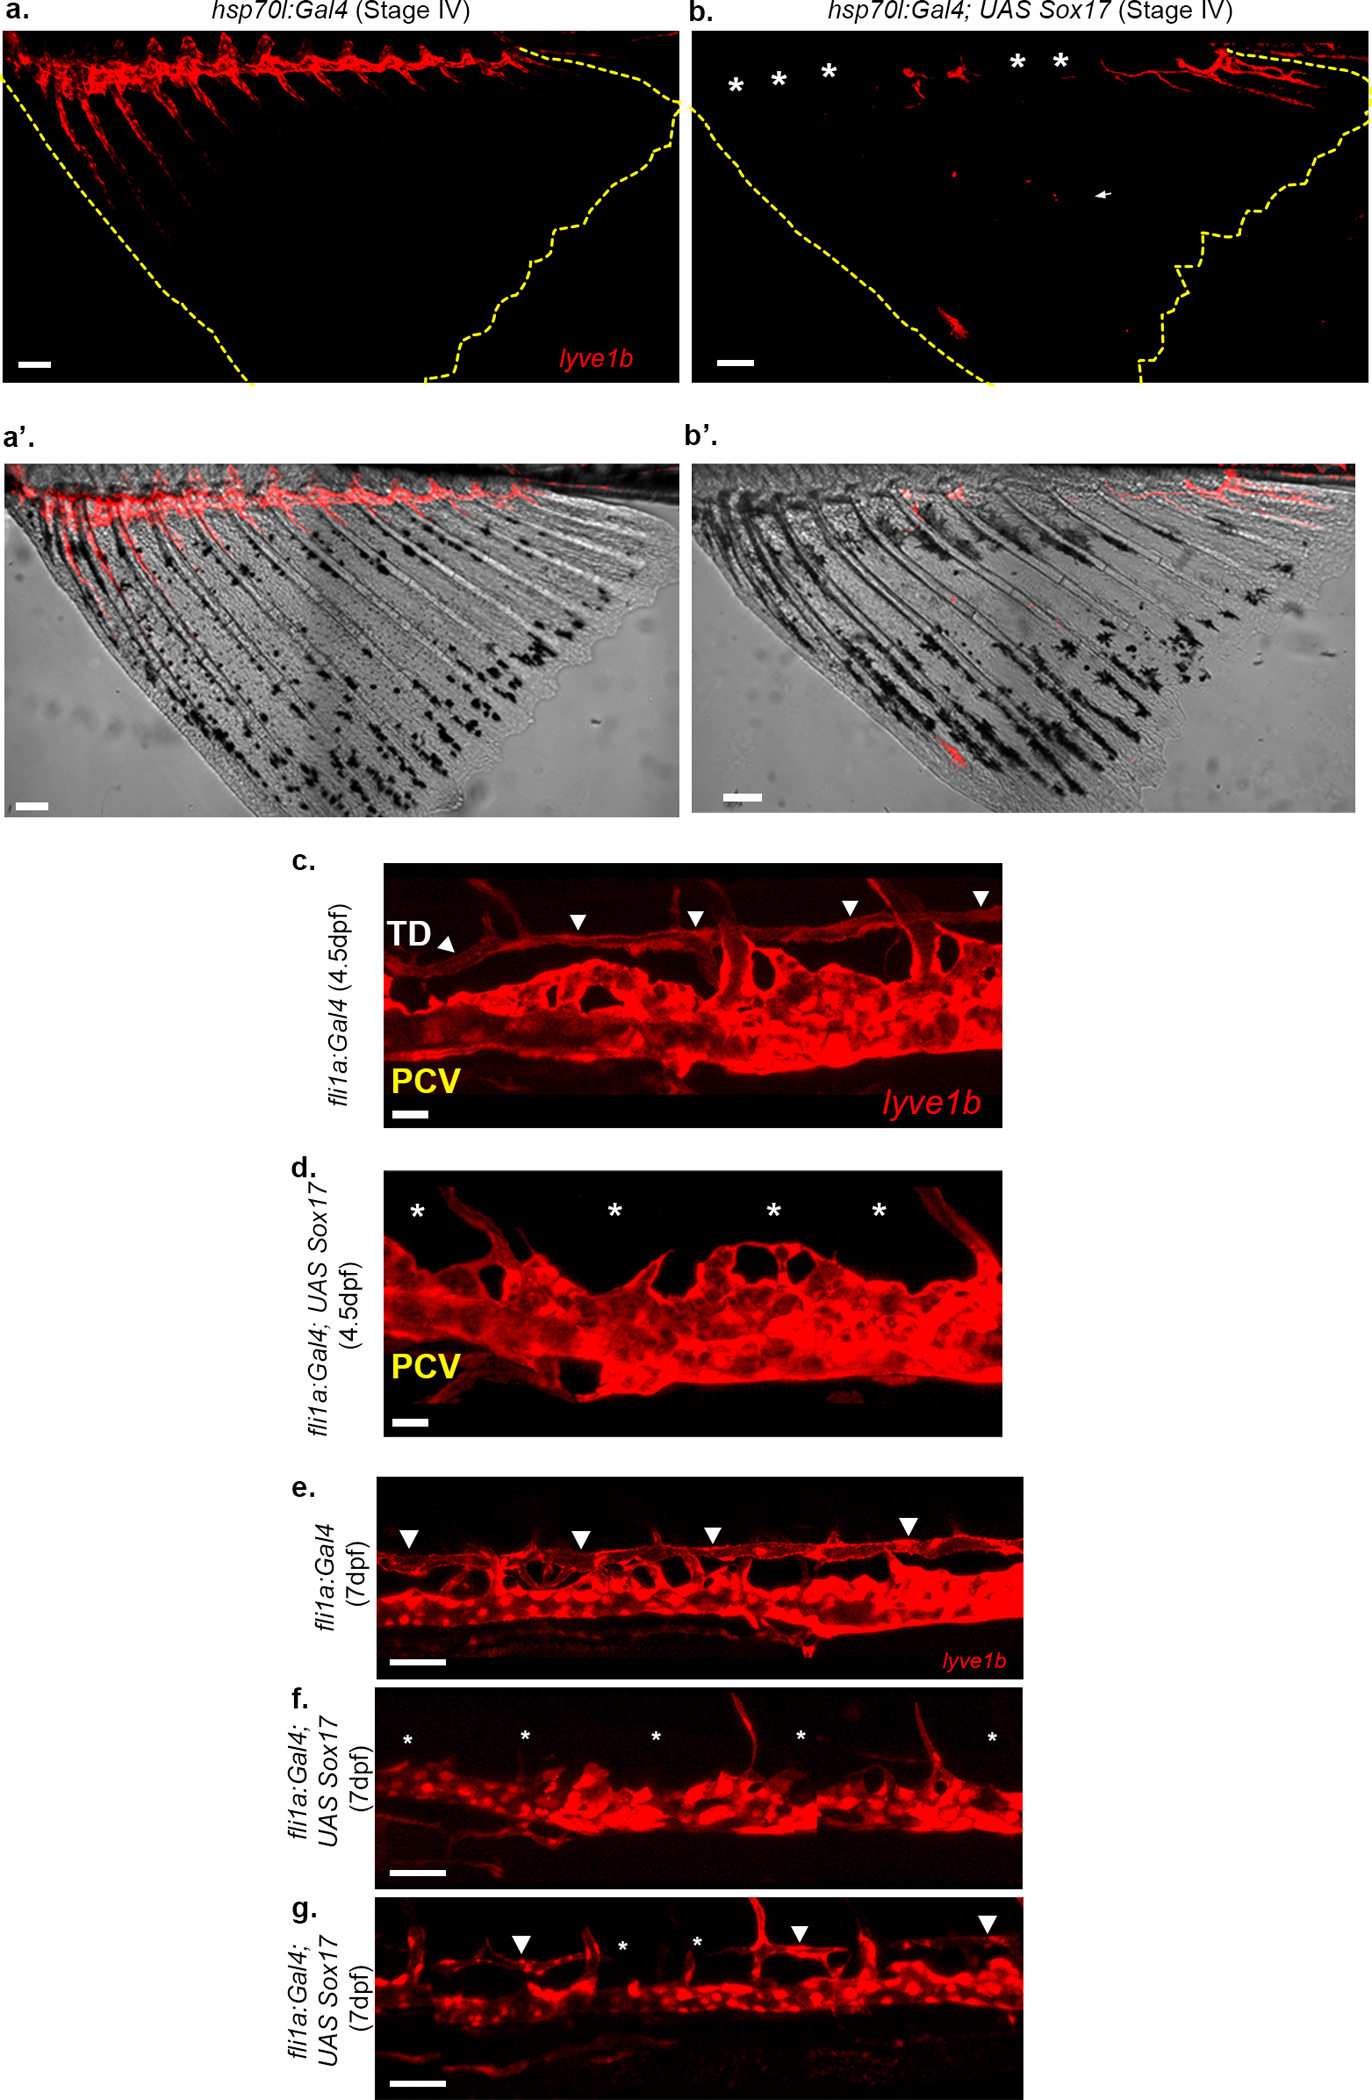
a-b’, sox17 misexpression results in loss of lymphatic marker expression in the AF. Stage IV AF (demarcated by yellow dashed lines) showing expression of lyve1b:dsRed, at the dorsal trunk-fin junction of the AF (a), which is lost following mosaic expression of UAS sox17 in hsp70l:Gal4 animals (b, asterisks) (N=2, n=65). a’,b’ show the corresponding bright-light images. c,d, Confocal images of a 4.5 dpf Tg(fli1a:Gal4; lyve1b:dsRed) embryo showing the TD (c, arrowheads) that is lost (d, asterisks) following mosaic overexpression of UAS sox17. e-g, Confocal images of a 7 dpf larva with mosaic overexpression of UAS:sox17 in Tg(fli1a:Gal4) embryos showing complete (f, asterisks) or partial (g, arrowheads point to TD, asterisks denote absent TD segments) disruption in TD formation (N=2, ninjected embryos=234, nununinjected embryos=87). Scale bars, 20μm (c,d), 50μm (e,f,g), 100μm (a,b). TD, Thoracic duct; DA, Dorsal Aorta; PCV, Posterior cardinal vein.
Extended Data Fig. 8: Different blood flow pattern and connectivity with the systemic circulation in WT and flt4−/− animals.
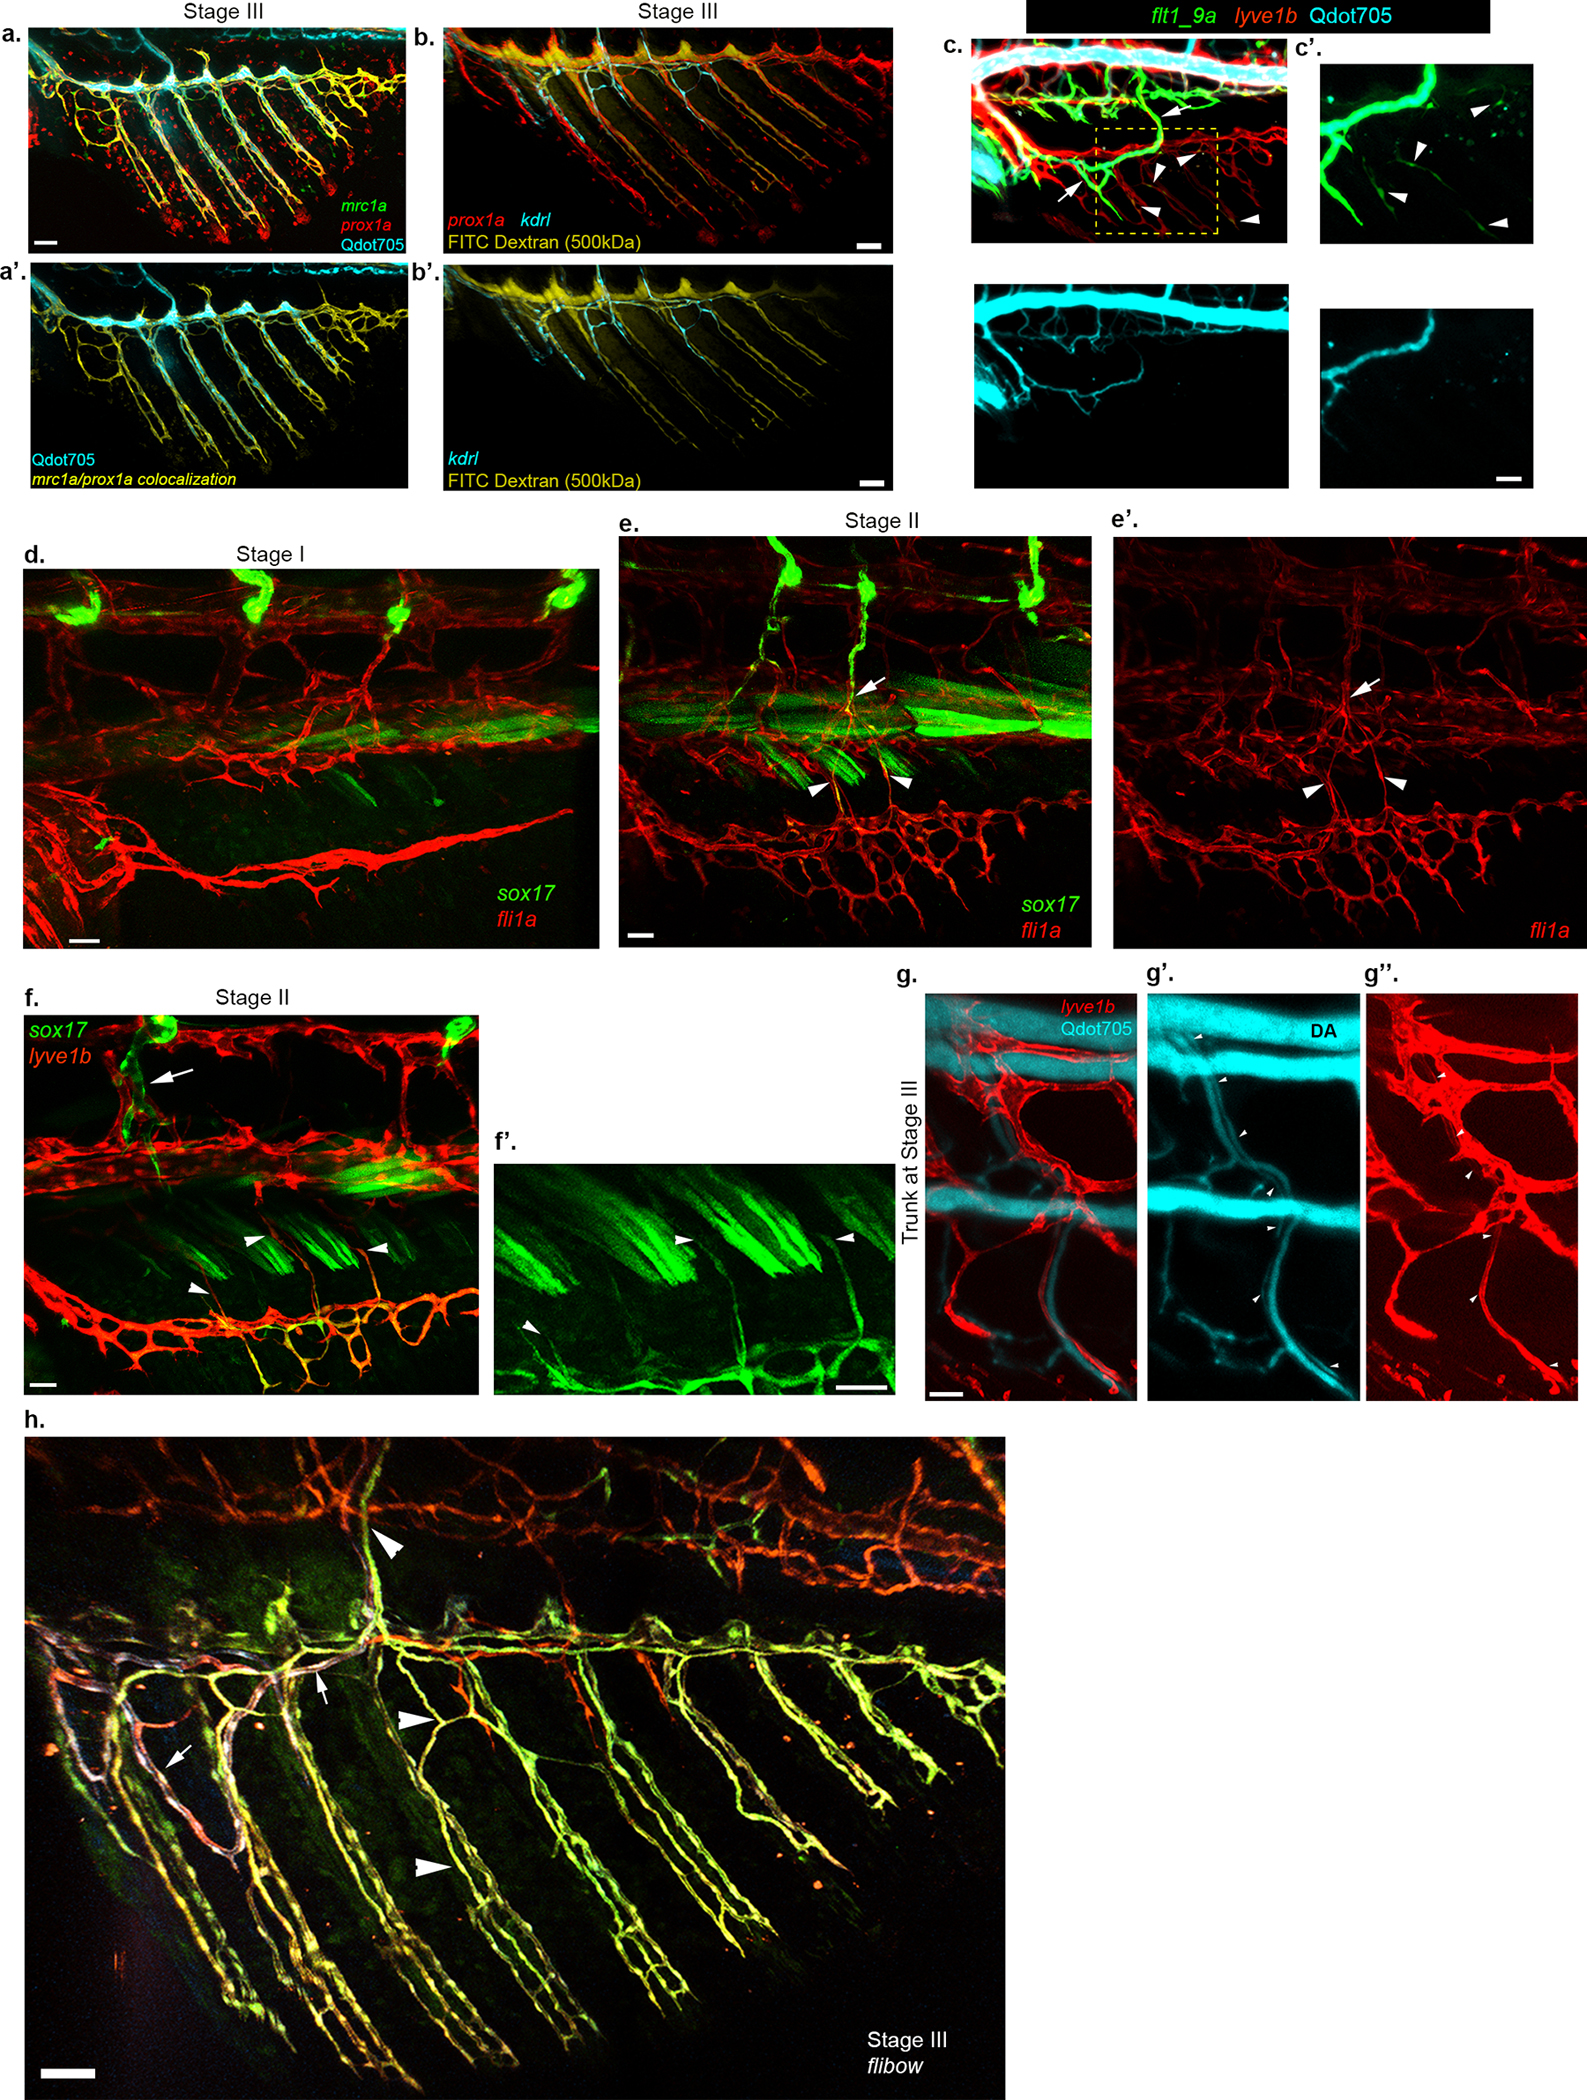
a-b’, Different tracers are readily detectable in the LVC of Stage III AFs. Distribution of Qdot705 (a,a’, cyan) and FITC Dextran (MW= 500kDa) (b-b’, yellow) in stage III AF. LVC is labeled by mrc1a/prox1a colocalization (a,a’, yellow) or prox1a (b, red); BVC is labeled by kdrl (blue) in b,b’. c-c’, Appearance of flt1_9a:GFP in the LVC (arrowheads) is detected in animals with intravascularly injected Qdot705 (cyan) before the tracer has entered the LVC compartment. Arrows point to BVC expression of flt1_9a:GFP. d-e’. Early stages of AF development, before the connection between AF and DA is established, shown through fli1a:dsRed and sox17GFP expression analysis. d, sox17+ ECs are not detected in stage I AF but are present in the trunk, near the DA. e-e’, Stage II AF depicting sox17+ sprouts (arrowheads) extending dorsally from the AF. DA-derived sox17+ sprouts extend ventrally but remain within the trunk (arrow). f-h, Connection of LVC-derived plexus with the trunk vasculature is established through LVC sprouts that extend dorsally to reach the trunk. f-f’, Stage II AF (f) show transdifferentiating LECs (lyve1b+;sox17+, arrowheads) sprouting dorsally towards the trunk. Arrow points to a trunk sox17+ vessel that has not entered the AF. f’ shows high magnification of single channel from f, to clearly depict the extending sprouts (arrowheads). g-g”, Microangiography with Qdot705 depicts patent connections established between the DA and stage III AF (not in the image) through a LVC-derived vessel (g’,g”, lyve1b+, white arrowheads). h., Lineage tracing through Tg(hsp70l:CreERT2;flibow) animal depicting distinct labeling of BVC (crimson/violet mosaic, arrows) and LVC (green, arrowheads) and all their subsequent progenies. The LVC vessels sprout dorsally to connect with the trunk circulation. Scale bars, 20 μm (c’), 30 μm (d,e,f,g), 50 μm (a,b).
Extended Data Fig. 9: In absence of lymphatics the AF vasculature derives from trunk BECs.
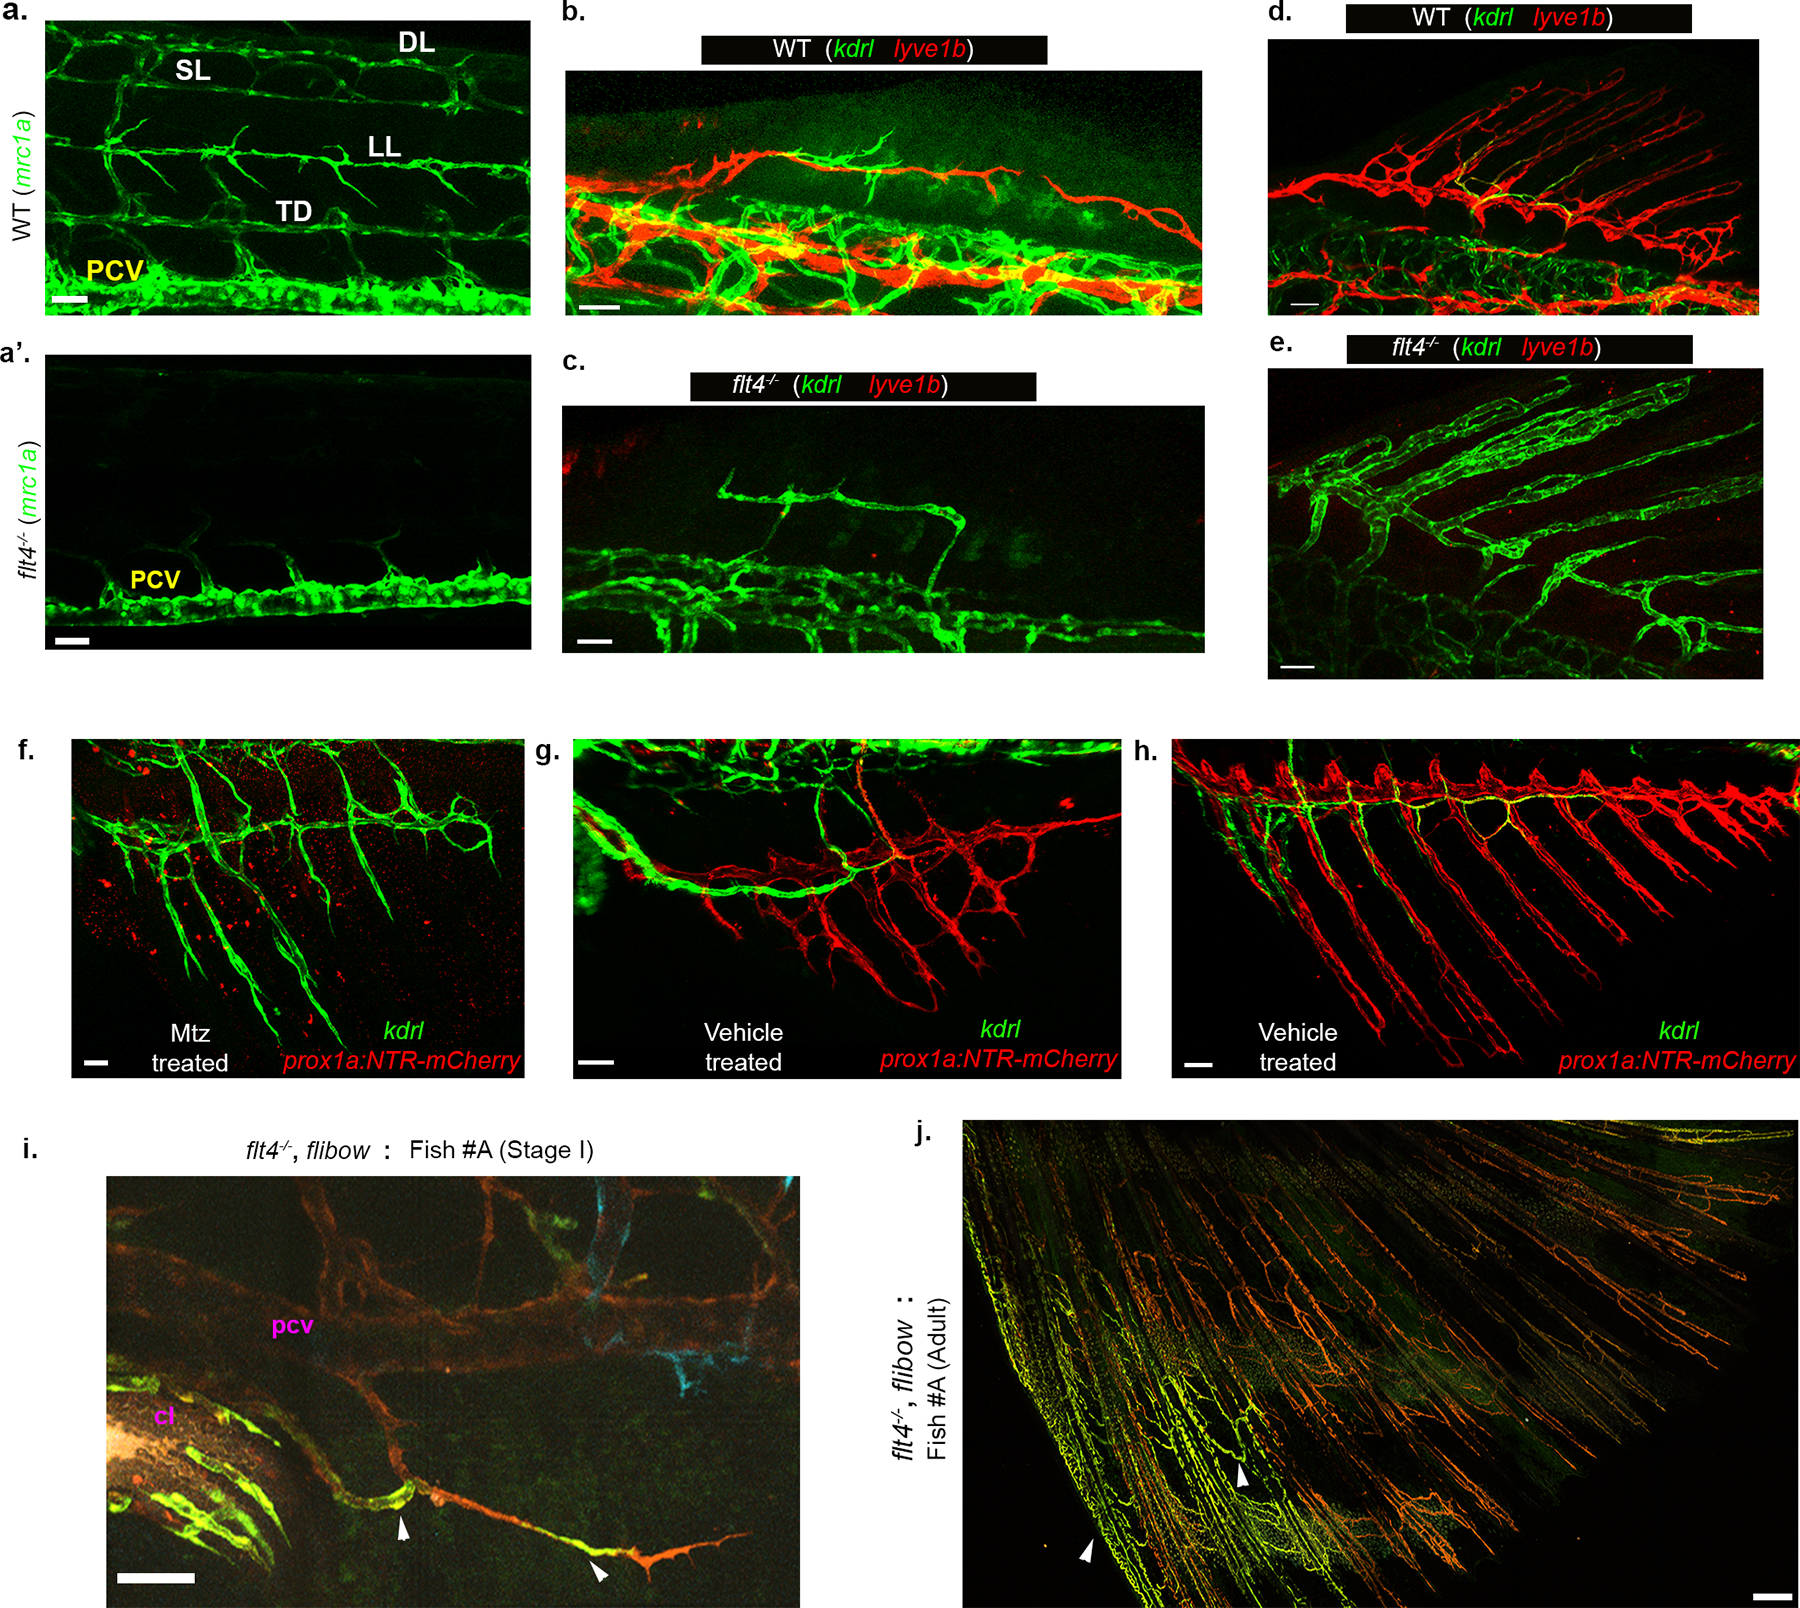
a-a’, Trunk lymphatics (mrc1a+, a) are absent in flt4−/−mutants (a’). The only mrc1a+ structure visible in the trunk of flt4−/− is the PCV. b-e, The DF in flt4−/−mutants is vascularized by BECs. b-c, Early sprouting event in developing DFs in stage matched WT and flt4−/− animals, showing lyve1b+ LVC sprouts in WT (b) that are missing in flt4−/− (c). d-e, Juvenile DF is fully vascularized by LVC in WT and BECs in flt4−/−. f-h, NTR-Mtz ablation of LVC in Tg(prox1a:Gal4;UAS NTR-mCherry; kdrl:GFP) animals, results in kdrl+ BVC-derived vascularization of the AF (f), while DMSO (vehicle) treated animals develop a normal LVC-derived AF plexus (g,h). f shows the status of kdrl+ vessels in the AF, 3 days post first Mtz treatment. The vehicle treated AFs are shown at 5 days (g) and 15 days (h) after the first DMSO treatment. i-j, Lineage analysis of AF ECs in flt4−/−. i, Stage I AF of flt4−/−;hsp70l:CreERT2; flibow fish (Fish #A) showing distinctly labeled clones (green, arrowheads) in BVC (connected to PCV and cloacal vessels). j, Adult AF vasculature of the same fish shown in m, bears clones of matching identity (arrowheads). Scale bars, 30 μm (c,f), 40 μm (g), 50 μm (a,a’,b,d,e,h,i), 300 μm (j).
Extended Data Fig. 10: Functional characterization of AF vessels in WT and flt4−/−.
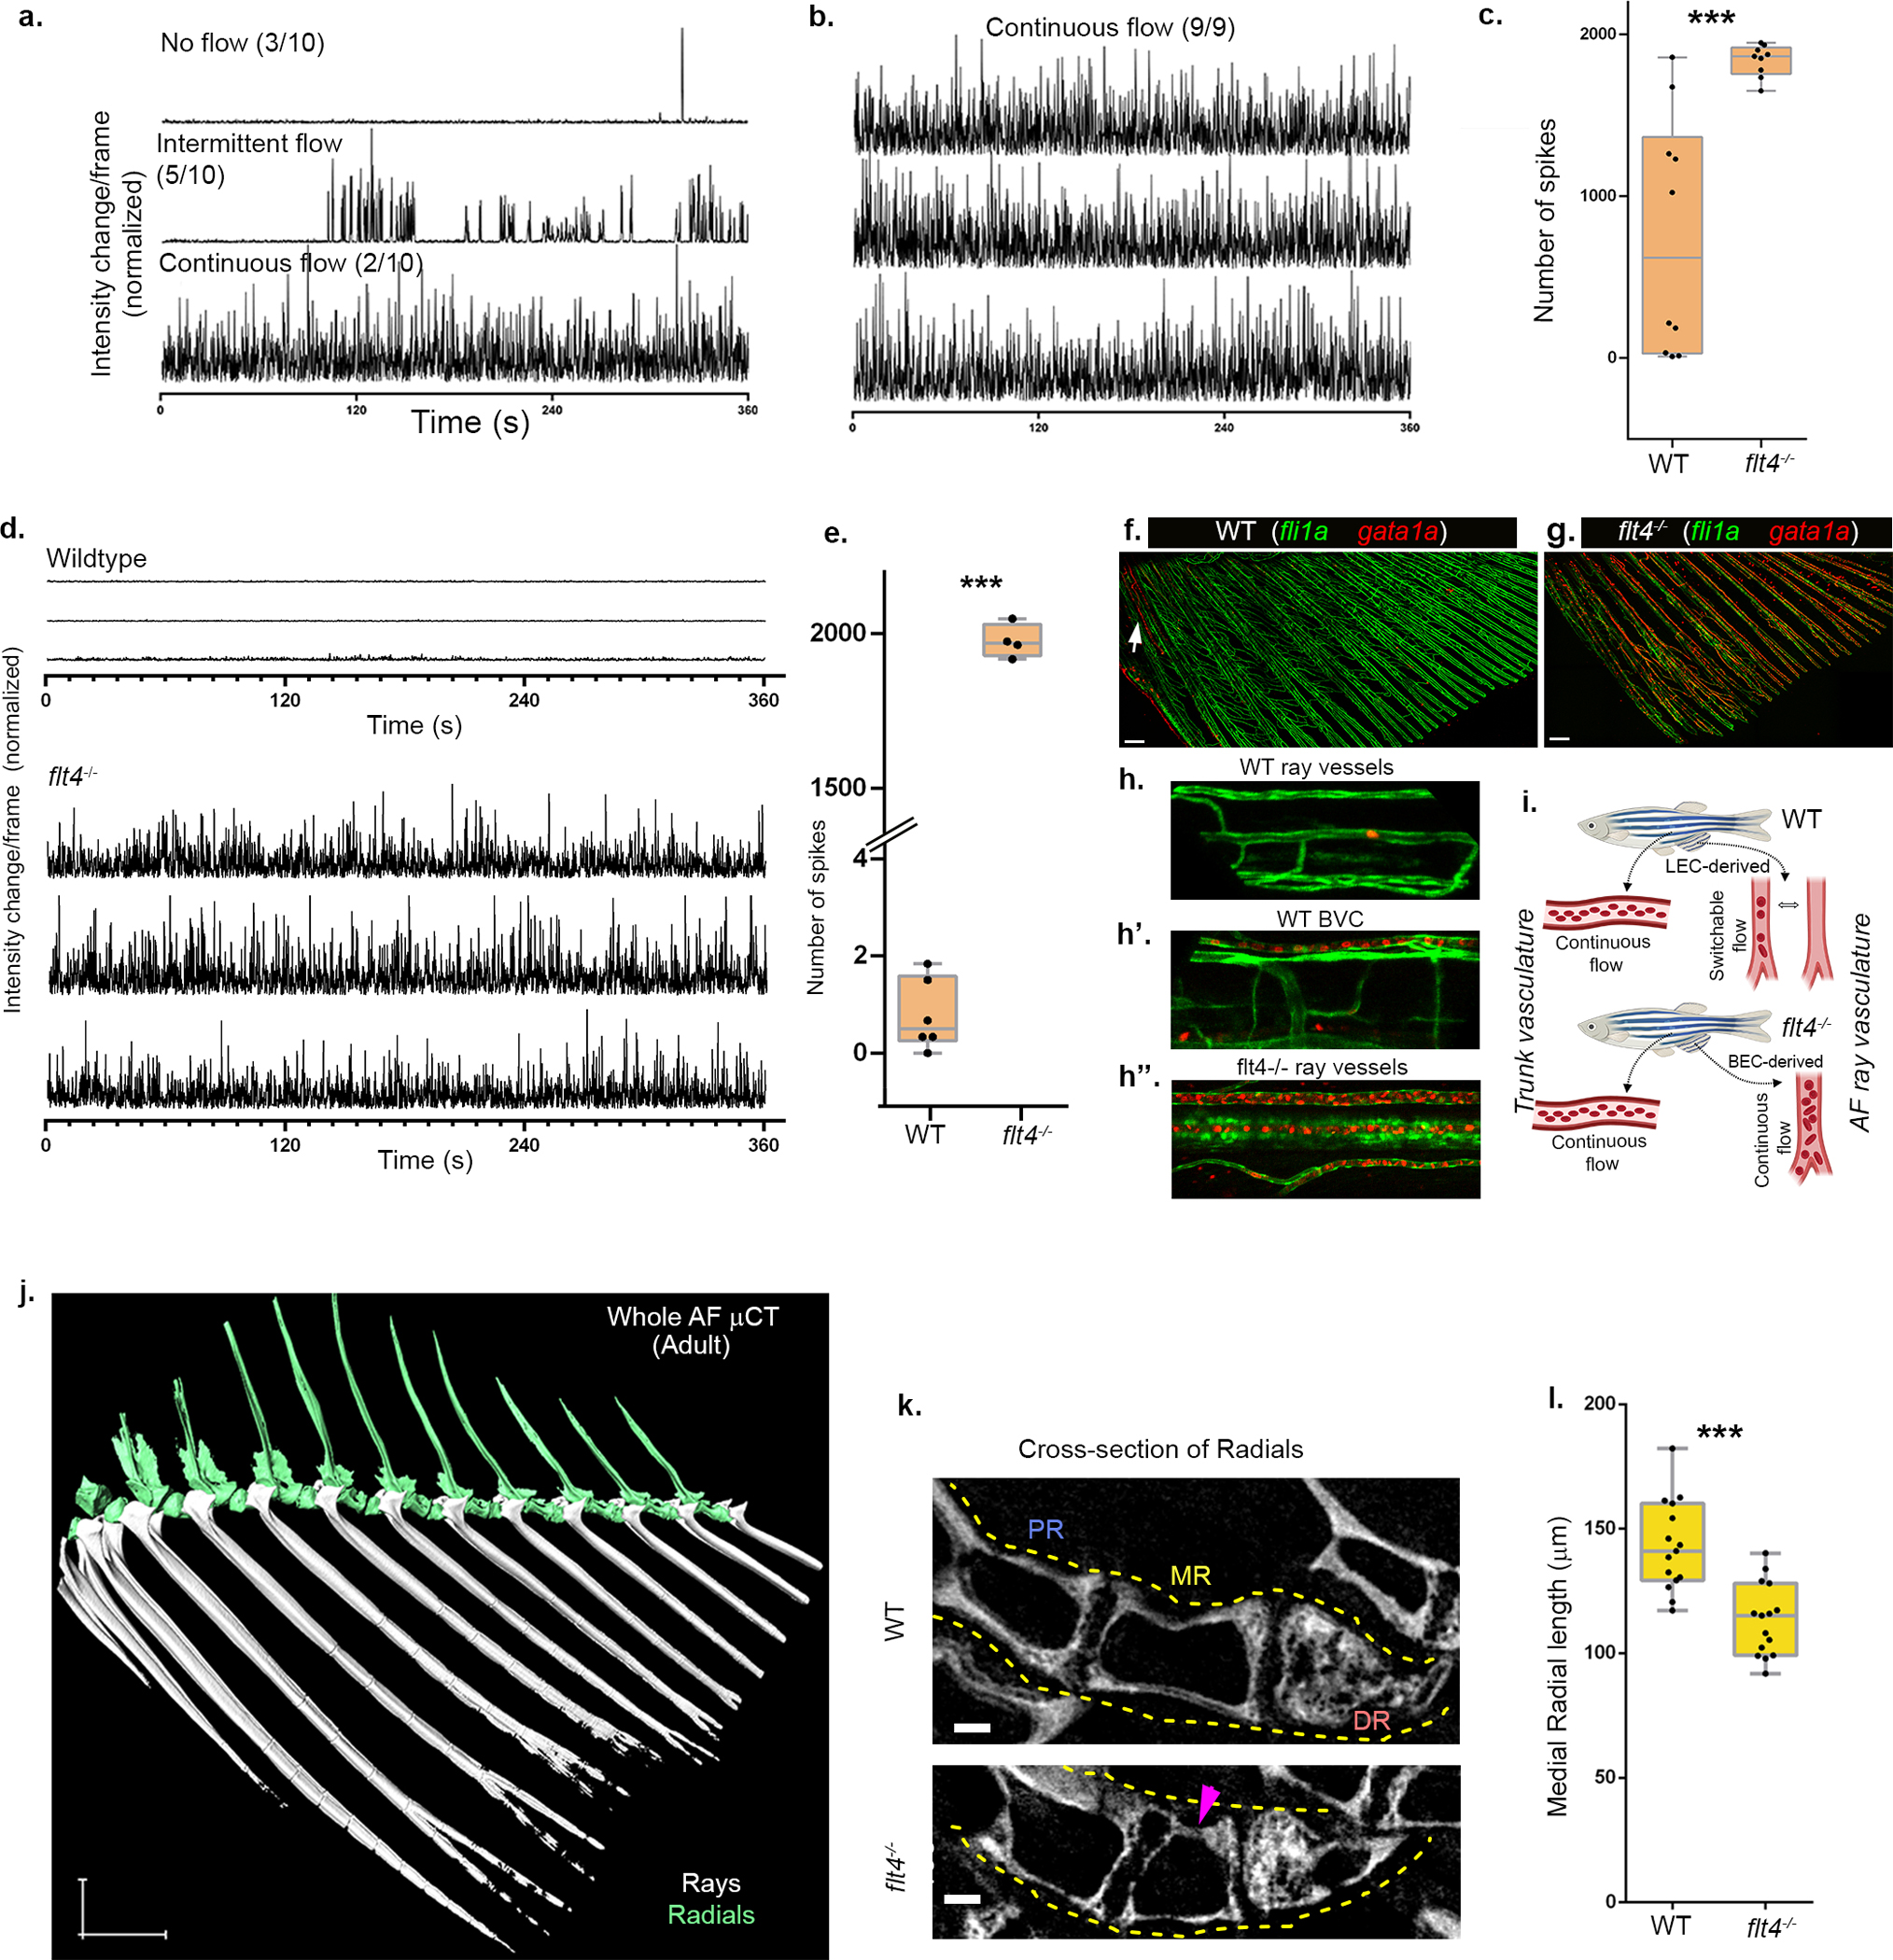
a,b, Differential erythrocyte flow in WT vs. flt4−/− animals. Bright-light intensity profile from the lumen of fin ray vessels in WT (a) or flt4−/− (b) fish (nWT=3, nflt4−/−=3) showing different modes of erythrocyte flow in WT (no flow, intermittent flow, continuous flow) (a), vs. continuous erythrocyte flow in flt4−/− mutants (b). c, Quantification of erythrocyte-mediated intensity change (spikes) events (nwt=10; nflt4−/− =9). d-e, Differences in erythrocyte flow in WT vs. flt4−/− juvenile fish (stage IV). Bright-light intensity profile (d) from the lumen of fin ray vessels in WT vs flt4−/− are shown, along with the quantification of erythrocyte-mediated intensity change (spikes) events (e) (nwt=6; nflt4−/− =4). The box in the plots (c,e) show 25th to 75th percentiles, the line in the middle shows the median and the whiskers show the full range of the data points. f-h”, Confocal imaging of erythrocytes in the AF is shown with gata1a:dsRed, in the background of pan-endothelial fli1a:GFP. k-l, Confocal images of entire AFs, showing gata1a+ cells majorly accumulated in the anterior BVC in WT animals (f, arrow), as opposed to widespread distribution of gata1a+ cells in all AF vessels (g) in flt4−/−. h-h”, High magnification images of single rays from f and g depicting the presence or absence of gata1a+ cells inside the lumen of WT LVC derived AF ray vessels (h), WT BVC vessels (h’) and flt4−/− AF ray vessels (h”). i, Schematic illustration of the different functional properties of AF vessels originating via LEC transdifferentiation vs. BEC angiogenesis. j, 3D rendered image of a μCT scan of adult AF, showing the external rays (white) and the internal radials (green). k, Cross-section of the radials depicting the size and morphological defects (arrowhead) detected in flt4−/− as compared to WT siblings. Yellow dashed lines enclose one set of radials. l, Quantification of the MR length is plotted (nwt=15; nflt4−/− =15). Scale bars, 300 μm (f,g). ***p<0.0005.
Extended Data Fig. 11: Lineage tracing of regenerating AF vasculature.
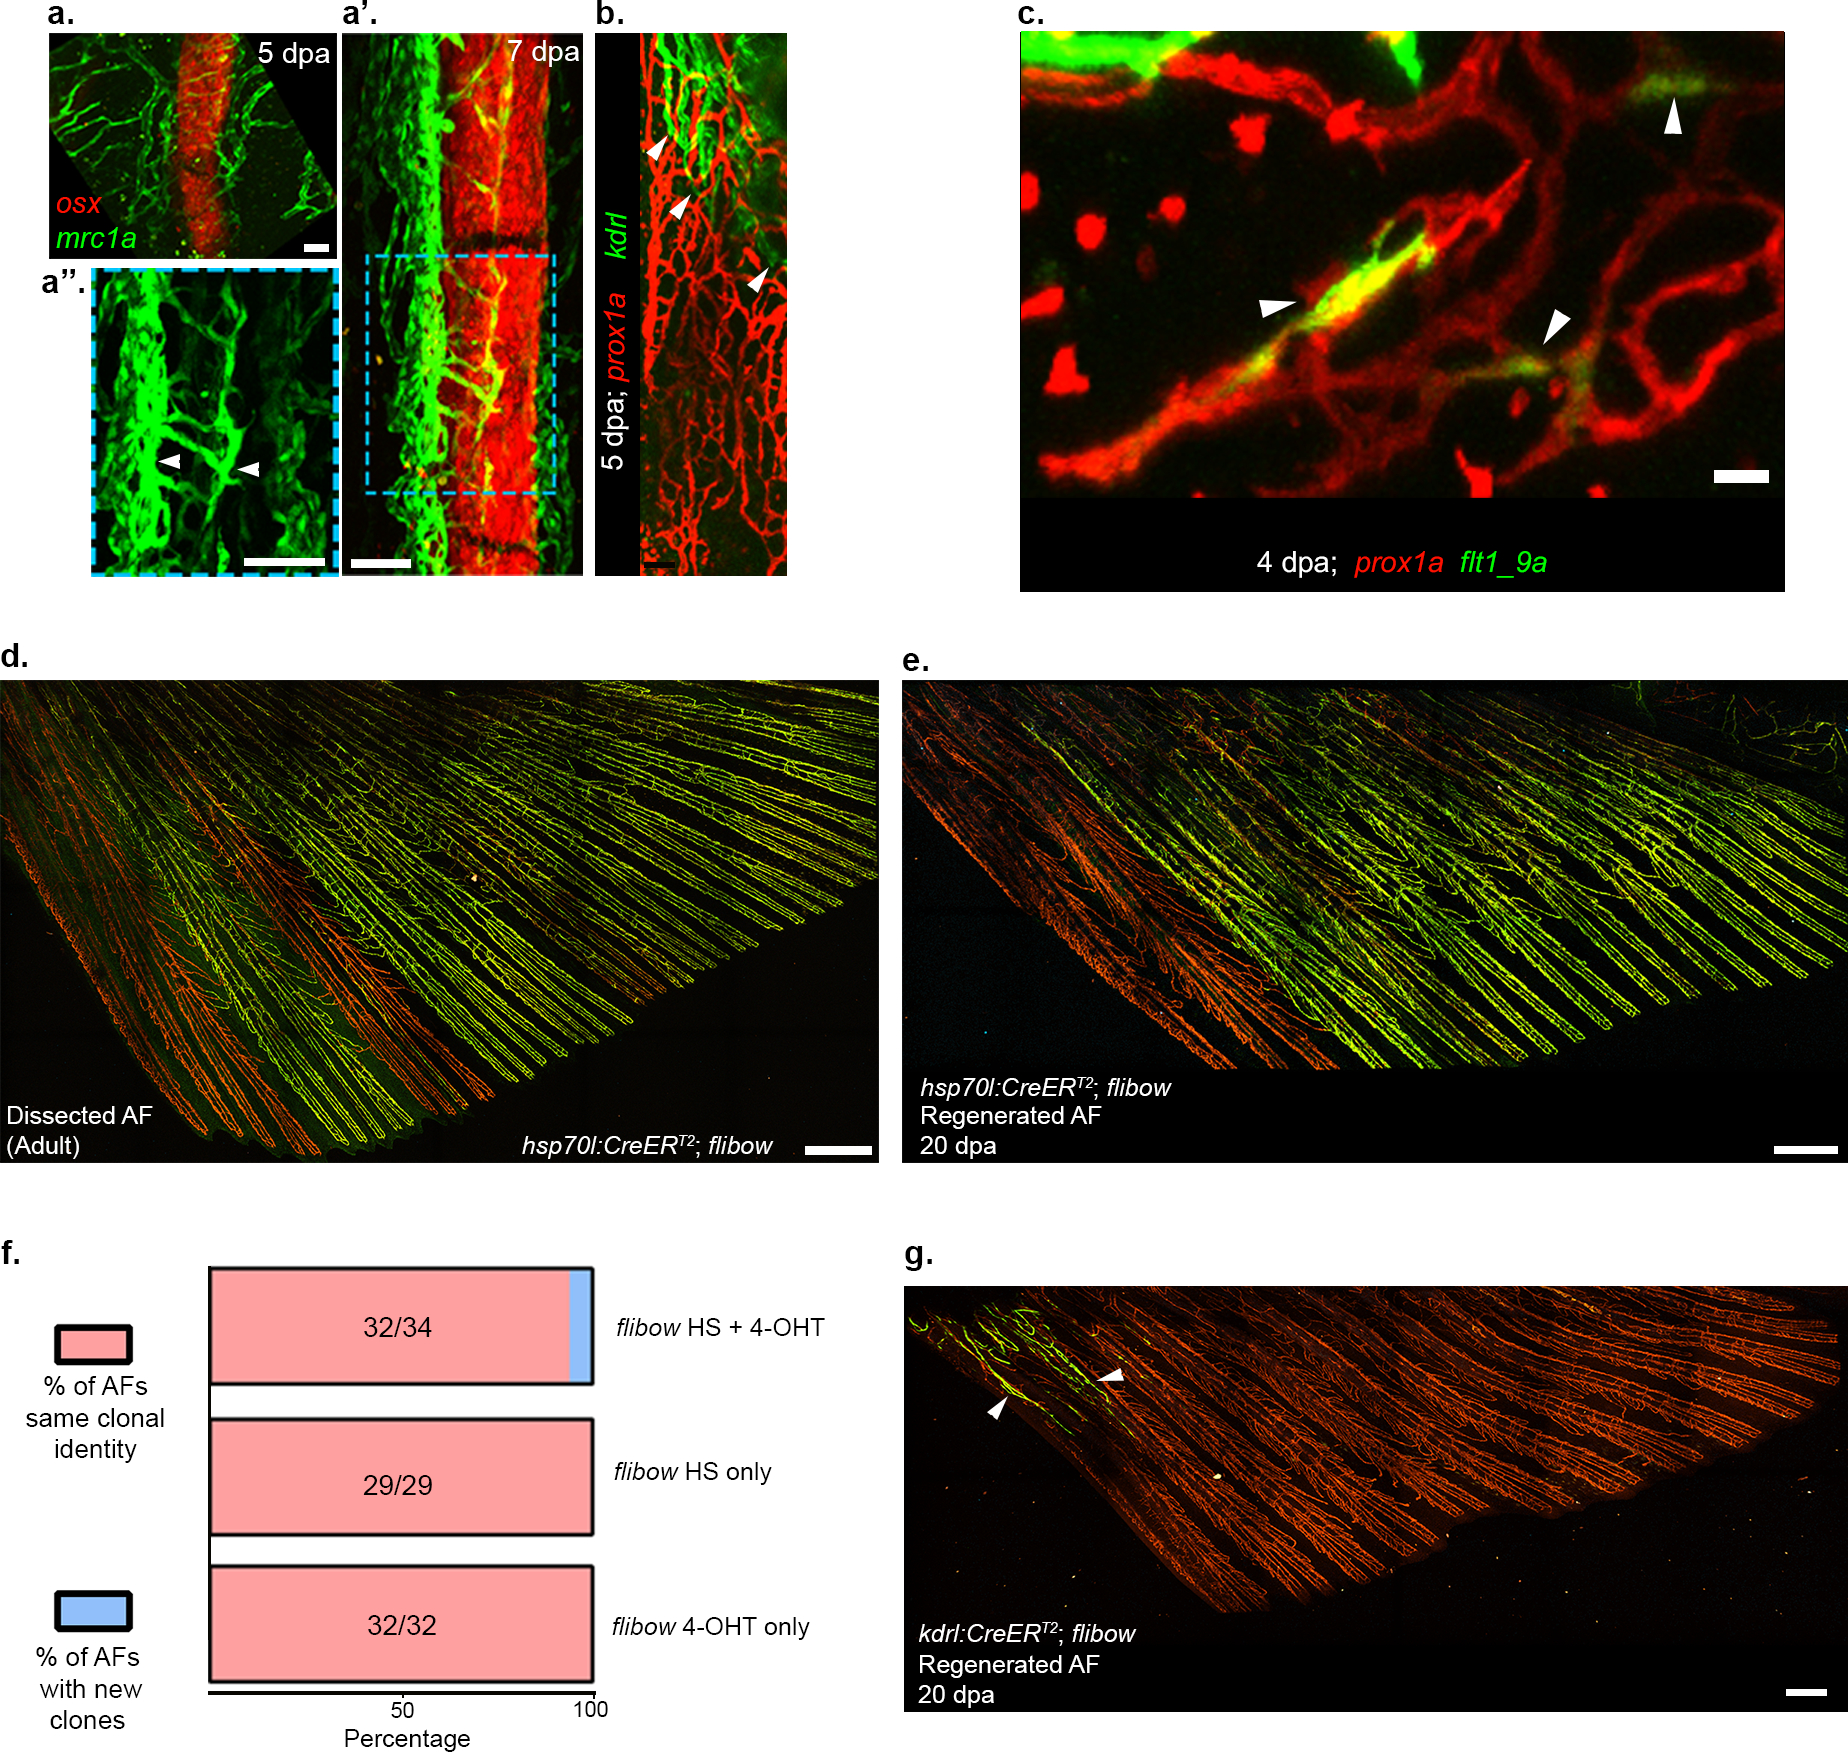
a-b, mrc1a:EGFP labeled LVC growth along osx:mCherry labeled bones, as detected in 5 dpa (a) and 7 dpa (a’,a”) AFs. Inset (a”) shows mrc1a channel only to visualize the LECs (arrowheads) growing along a single regenerating ray. b, Status and extent of BVC (kdrl:EGFP+, arrowheads) coverage in a 5dpa regenerating AF shown in contrast to LVC (prox1a:RFP+). c, flt1_9a:GFP expression is detected in prox1a:RFP+ LECs of the regenerating AF plexus at 4 dpa (arrowheads). d-e, Clonal identity of AF vessels before and after regeneration traced in the same animal. d, Dissected AF from an adult hsp70l:CreERT2;flibow fish, showing distinctly labelled clones (green) throughout the fin except for the anterior-most rays. e, Regenerated AF in same fish shown in d, at 20 dpa. ECs of same clonal identity (green), populate the regenerating vasculature recapitulating the distribution seen in d. f, Proportion of new clones (blue) in AF regenerated vascular plexus under different experimental setups. No YFP/mCerulean expression was detected in the uninduced controls during the regeneration process (nheat-shock only=29; n4-OHT only= 32). g, Regenerated AF in adult kdrl:CreERT2; flibow fish at 20dpa, shows distinctly labeled BVC (arrowheads) at the anterior trunk-fin junction of the AF. Scale bars, 20 μm (c), 100 μm (a,a”), 300 μm (g), 500 μm (d,e). dpa, days post amputation.
Supplementary Material
Acknowledgements
The authors thank Hila Raviv, Lital Shen, Dean Robinson and Aryeh Solomon (Weizmann Institute, Israel) for technical assistance, Kamalesh Kumari (Weizmann Institute, Israel) for assistance with image analysis and illustrations, Gabriella Almog, Roy Hofi, Alla Glozman and Anna Tatarin (Weizmann Institute, Israel) for superb animal care, Moshe Biton (Weizmann Institute, Israel) for critical insights into single cell RNASeq analyses and Sergey Kapishnikov for assistance with μCT experiments. The authors are grateful to all the members of the Yaniv lab for discussion, technical assistance and continuous support. This work was supported in part by European Research Council (818858) to KY, Minerva Foundation (712610) to KY, and the H&M Kimmel Inst. for Stem Cell Research (Weizmann Institute) and the Estate of Emile Mimran (SABRA program) to KY. KY is the incumbent of the Enid Barden and Aaron J. Jade Professorial Chair and is supported by research grants from Madame Olga Klein – Astrachan and the Estate of Mady Dukler. RND was supported by EMBO long-term fellowship (ALTF 1532–2015), Edith and Edward F. Anixter Postdoctoral Fellowship and a senior postdoctoral fellowship by the Weizmann Institute of Science. WH was supported by the Deutsche Forschungsgemeinschaft (HE4585/4–1) and by the North Rhine-Westphalia “return fellowship”. RA is supported by the European Research Council (756653) and the Israel Science Foundation (1890/17). KDP acknowledges support from National Institutes of Health (R35 HL150713, R01 HD105033).
Footnotes
The authors declare no competing interests.
References
- 1.Augustin HG & Koh GY Organotypic vasculature: From descriptive heterogeneity to functional pathophysiology. Science 357, (2017). [DOI] [PubMed] [Google Scholar]
- 2.Petrova TV & Koh GY Organ-specific lymphatic vasculature: From development to pathophysiology. J. Exp. Med. 215, 35–49 (2018). [DOI] [PMC free article] [PubMed] [Google Scholar]
- 3.Semo J, Nicenboim J & Yaniv K Development of the lymphatic system: new questions and paradigms. Development 143, 924–35 (2016). [DOI] [PubMed] [Google Scholar]
- 4.Gutierrez-Miranda L & Yaniv K Cellular Origins of the Lymphatic Endothelium: Implications for Cancer Lymphangiogenesis. Front. Physiol. 11, 577584 (2020). [DOI] [PMC free article] [PubMed] [Google Scholar]
- 5.Parichy DM, Elizondo MR, Mills MG, Gordon TN & Engeszer RE Normal table of postembryonic zebrafish development: staging by externally visible anatomy of the living fish. Dev Dyn 238, 2975–3015 (2009). [DOI] [PMC free article] [PubMed] [Google Scholar]
- 6.Marí-Beffa M & Murciano C Dermoskeleton morphogenesis in zebrafish fins. Dev. Dyn. 239, 2779–2794 (2010). [DOI] [PMC free article] [PubMed] [Google Scholar]
- 7.Vogel WOP & Claviez M Vascular Specialization in Fish, but No Evidence for Lymphatics. Z. Für Naturforschung C 36, 490–492 (1981). [Google Scholar]
- 8.Steffensen JF, Lomholt JP & Vogel WOP. In vivo Observations on a Specialized Microvasculature, the Primary and Secondary Vessels in Fishes. Acta Zool. 67, 193–200 (1986). [Google Scholar]
- 9.Olson KR Secondary circulation in fish: Anatomical organization and physiological significance. J. Exp. Zool. 275, 172–185 (1996). [Google Scholar]
- 10.Jensen LDE et al. Nitric oxide permits hypoxia-induced lymphatic perfusion by controlling arterial-lymphatic conduits in zebrafish and glass catfish. Proc. Natl. Acad. Sci. 106, 18408–18413 (2009). [DOI] [PMC free article] [PubMed] [Google Scholar]
- 11.Rummer JL, Wang S, Steffensen JF & Randall DJ Function and control of the fish secondary vascular system, a contrast to mammalian lymphatic systems. J. Exp. Biol. 217, 751–757 (2014). [DOI] [PubMed] [Google Scholar]
- 12.Karpanen T & Schulte-Merker S Chapter 9 - Zebrafish Provides a Novel Model for Lymphatic Vascular Research. in Methods in Cell Biology (eds. Detrich HW, Westerfield M & Zon LI) vol. 105 223–238 (Academic Press, 2011). [DOI] [PubMed] [Google Scholar]
- 13.Jung HM et al. Development of the larval lymphatic system in zebrafish. Development 144, 2070–2081 (2017). [DOI] [PMC free article] [PubMed] [Google Scholar]
- 14.Gancz D, Perlmoter G & Yaniv K Formation and Growth of Cardiac Lymphatics during Embryonic Development, Heart Regeneration, and Disease. Cold Spring Harb. Perspect. Biol. (2019) doi: 10.1101/cshperspect.a037176. [DOI] [PMC free article] [PubMed] [Google Scholar]
- 15.Potente M & Makinen T Vascular heterogeneity and specialization in development and disease. Nat Rev Mol Cell Biol 18, 477–494 (2017). [DOI] [PubMed] [Google Scholar]
- 16.Yaniv K et al. Live imaging of lymphatic development in the zebrafish. Nat Med 12, 711–6 (2006). [DOI] [PubMed] [Google Scholar]
- 17.Dunwoodie SL The role of hypoxia in development of the Mammalian embryo. Dev. Cell 17, 755–773 (2009). [DOI] [PubMed] [Google Scholar]
- 18.Akiva A et al. On the pathway of mineral deposition in larval zebrafish caudal fin bone. Bone 75, 192–200 (2015). [DOI] [PubMed] [Google Scholar]
- 19.Bennet M et al. Simultaneous Raman microspectroscopy and fluorescence imaging of bone mineralization in living zebrafish larvae. Biophys J 106, L17–9 (2014). [DOI] [PMC free article] [PubMed] [Google Scholar]
- 20.Zhao L et al. Notch signaling regulates cardiomyocyte proliferation during zebrafish heart regeneration. Proc Natl Acad Sci U A 111, 1403–8 (2014). [DOI] [PMC free article] [PubMed] [Google Scholar]
- 21.Kobayashi I et al. Jam1a – Jam2a interactions regulate haematopoietic stem cell fate through Notch signalling. Nature 512, 319–323 (2014). [DOI] [PMC free article] [PubMed] [Google Scholar]
- 22.Johnson NC et al. Lymphatic endothelial cell identity is reversible and its maintenance requires Prox1 activity. Genes Dev. (2008) doi: 10.1101/gad.1727208. [DOI] [PMC free article] [PubMed] [Google Scholar]
- 23.Ma W & Oliver G Lymphatic Endothelial Cell Plasticity in Development and Disease. Physiology 32, 444–452 (2017). [DOI] [PMC free article] [PubMed] [Google Scholar]
- 24.Chen C-Y et al. Blood flow reprograms lymphatic vessels to blood vessels. J. Clin. Invest. 122, 2006–2017 (2012). [DOI] [PMC free article] [PubMed] [Google Scholar]
- 25.Chen J et al. Acute brain vascular regeneration occurs via lymphatic transdifferentiation. Dev. Cell S1534–5807(21)00723–1 (2021) doi: 10.1016/j.devcel.2021.09.005. [DOI] [PubMed] [Google Scholar]
- 26.Kim J et al. Impaired angiopoietin/Tie2 signaling compromises Schlemm’s canal integrity and induces glaucoma. J. Clin. Invest. 127, 3877–3896. [DOI] [PMC free article] [PubMed] [Google Scholar]
- 27.Corada M et al. Sox17 is indispensable for acquisition and maintenance of arterial identity. Nat. Commun. (2013) doi: 10.1038/ncomms3609. [DOI] [PMC free article] [PubMed] [Google Scholar]
- 28.Gancz D et al. Distinct origins and molecular mechanisms contribute to lymphatic formation during cardiac growth and regeneration. eLife (2019) doi: 10.7554/eLife.44153. [DOI] [PMC free article] [PubMed] [Google Scholar]
- 29.Nicenboim J et al. Lymphatic vessels arise from specialized angioblasts within a venous niche. Nature 522, 56–61 (2015). [DOI] [PubMed] [Google Scholar]
- 30.Hen G et al. Venous-derived angioblasts generate organ-specific vessels during zebrafish embryonic development. Dev. Camb. Engl. 142, 4266–4278 (2015). [DOI] [PMC free article] [PubMed] [Google Scholar]
- 31.Keren-Shaul H et al. MARS-seq2.0: an experimental and analytical pipeline for indexed sorting combined with single-cell RNA sequencing. Nat Protoc 14, 1841–1862 (2019). [DOI] [PubMed] [Google Scholar]
- 32.Moon KR et al. Visualizing structure and transitions in high-dimensional biological data. Nat. Biotechnol. 37, 1482–1492 (2019). [DOI] [PMC free article] [PubMed] [Google Scholar]
- 33.Street K et al. Slingshot: cell lineage and pseudotime inference for single-cell transcriptomics. BMC Genomics 19, 477 (2018). [DOI] [PMC free article] [PubMed] [Google Scholar]
- 34.Wolf FA et al. PAGA: graph abstraction reconciles clustering with trajectory inference through a topology preserving map of single cells. Genome Biol. 20, 59 (2019). [DOI] [PMC free article] [PubMed] [Google Scholar]
- 35.Harikumar A et al. Embryonic Stem Cell Differentiation Is Regulated by SET through Interactions with p53 and β-Catenin. Stem Cell Rep. 15, 1260–1274 (2020). [DOI] [PMC free article] [PubMed] [Google Scholar]
- 36.Zhou X et al. HMGB2 regulates satellite-cell-mediated skeletal muscle regeneration through IGF2BP2. J. Cell Sci. 129, 4305–4316 (2016). [DOI] [PubMed] [Google Scholar]
- 37.Garza-Manero S et al. Maintenance of active chromatin states by HMGN2 is required for stem cell identity in a pluripotent stem cell model. Epigenetics Chromatin 12, 73 (2019). [DOI] [PMC free article] [PubMed] [Google Scholar]
- 38.Bao X et al. CSNK1a1 Regulates PRMT1 to Maintain the Progenitor State in Self-Renewing Somatic Tissue. Dev. Cell 43, 227–239.e5 (2017). [DOI] [PMC free article] [PubMed] [Google Scholar]
- 39.Jerafi-Vider A et al. VEGFC/FLT4-induced cell-cycle arrest mediates sprouting and differentiation of venous and lymphatic endothelial cells. Cell Rep. 35, 109255 (2021). [DOI] [PMC free article] [PubMed] [Google Scholar]
- 40.Shin M et al. Vegfc acts through ERK to induce sprouting and differentiation of trunk lymphatic progenitors. Development 143, 3785–3795 (2016). [DOI] [PMC free article] [PubMed] [Google Scholar]
- 41.Singh SP, Holdway JE & Poss KD Regeneration of Amputated Zebrafish Fin Rays from De Novo Osteoblasts. Dev. Cell 22, 879–886 (2012). [DOI] [PMC free article] [PubMed] [Google Scholar]
- 42.Silvent J et al. Zebrafish skeleton development: High resolution micro-CT and FIB-SEM block surface serial imaging for phenotype identification. PloS One 12, e0177731 (2017). [DOI] [PMC free article] [PubMed] [Google Scholar]
- 43.Das RN & Yaniv K Discovering New Progenitor Cell Populations through Lineage Tracing and In Vivo Imaging. Cold Spring Harb. Perspect. Biol. a035618 (2020) doi: 10.1101/cshperspect.a035618. [DOI] [PMC free article] [PubMed] [Google Scholar]
- 44.Vogel WOP Zebrafish and lymphangiogenesis: a reply. Anat. Sci. Int. 85, 118–119 (2010). [DOI] [PubMed] [Google Scholar]
- 45.Gur-Cohen S et al. Stem cell–driven lymphatic remodeling coordinates tissue regeneration. Science 366, 1218 LP–1225 (2019). [DOI] [PMC free article] [PubMed] [Google Scholar]
- 46.Louveau A et al. CNS lymphatic drainage and neuroinflammation are regulated by meningeal lymphatic vasculature. Nat. Neurosci. 21, 1380–1391 (2018). [DOI] [PMC free article] [PubMed] [Google Scholar]
- 47.Da Mesquita S et al. Functional aspects of meningeal lymphatics in ageing and Alzheimer’s disease. Nature (2018) doi: 10.1038/s41586-018-0368-8. [DOI] [PMC free article] [PubMed] [Google Scholar]
- 48.Pavlov V et al. Hydraulic control of tuna fins: A role for the lymphatic system in vertebrate locomotion. Science (2017) doi: 10.1126/science.aak9607. [DOI] [PMC free article] [PubMed] [Google Scholar]
- 49.Oliver G, Kipnis J, Randolph GJ & Harvey NL The Lymphatic Vasculature in the 21st Century: Novel Functional Roles in Homeostasis and Disease. Cell 182, 270–296 (2020). [DOI] [PMC free article] [PubMed] [Google Scholar]
- 50.Pawlak JB et al. Lymphatic mimicry in maternal endothelial cells promotes placental spiral artery remodeling. J. Clin. Invest. 129, 4912–4921. [DOI] [PMC free article] [PubMed] [Google Scholar]
- 51.Song E et al. VEGF-C-driven lymphatic drainage enables immunosurveillance of brain tumours. Nature 577, 629–630 (2020). [DOI] [PMC free article] [PubMed] [Google Scholar]
- 52.Jin S-W, Beis D, Mitchell T, Chen J-N & Stainier DYR Cellular and molecular analyses of vascular tube and lumen formation in zebrafish. Development 132, 5199 LP–5209 (2005). [DOI] [PubMed] [Google Scholar]
- 53.Matsuoka RL et al. Radial glia regulate vascular patterning around the developing spinal cord. eLife 5,. [DOI] [PMC free article] [PubMed] [Google Scholar]
- 54.Spoorendonk KM et al. Retinoic acid and Cyp26b1 are critical regulators of osteogenesis in the axial skeleton. Development 135, 3765–3774 (2008). [DOI] [PubMed] [Google Scholar]
- 55.Shin J, Poling J, Park H-C & Appel B Notch signaling regulates neural precursor allocation and binary neuronal fate decisions in zebrafish. Development 134, 1911–1920 (2007). [DOI] [PubMed] [Google Scholar]
- 56.Davison JM et al. Transactivation from Gal4-VP16 transgenic insertions for tissue-specific cell labeling and ablation in zebrafish. Dev. Biol. 304, 811–824 (2007). [DOI] [PMC free article] [PubMed] [Google Scholar]
- 57.Avraham-Davidi I et al. ApoB-containing lipoproteins regulate angiogenesis by modulating expression of VEGF receptor 1. Nat Med 18, 967–73 (2012). [DOI] [PMC free article] [PubMed] [Google Scholar]
- 58.White RM et al. Transparent Adult Zebrafish as a Tool for In Vivo Transplantation Analysis. Cell Stem Cell 2, 183–189 (2008). [DOI] [PMC free article] [PubMed] [Google Scholar]
- 59.Villefranc JA, Amigo J & Lawson ND Gateway compatible vectors for analysis of gene function in the zebrafish. Dev Dyn 236, 3077–87 (2007). [DOI] [PMC free article] [PubMed] [Google Scholar]
- 60.Hesselson D, Anderson RM, Beinat M & Stainier DY Distinct populations of quiescent and proliferative pancreatic beta-cells identified by HOTcre mediated labeling. Proc Natl Acad Sci U A 106, 14896–901 (2009). [DOI] [PMC free article] [PubMed] [Google Scholar]
- 61.Suster ML, Abe G, Schouw A & Kawakami K Transposon-mediated BAC transgenesis in zebrafish. Nat. Protoc. 6, 1998–2021 (2011). [DOI] [PubMed] [Google Scholar]
- 62.Dahlem TJ et al. Simple Methods for Generating and Detecting Locus-Specific Mutations Induced with TALENs in the Zebrafish Genome. PLOS Genet. 8, e1002861 (2012). [DOI] [PMC free article] [PubMed] [Google Scholar]
- 63.Han Y et al. Vitamin D Stimulates Cardiomyocyte Proliferation and Controls Organ Size and Regeneration in Zebrafish. Dev. Cell 48, 853–863.e5 (2019). [DOI] [PMC free article] [PubMed] [Google Scholar]
- 64.Oehlers SH et al. Interception of host angiogenic signalling limits mycobacterial growth. Nature 517, 612–615 (2015). [DOI] [PMC free article] [PubMed] [Google Scholar]
- 65.Lyubimova A et al. Single-molecule mRNA detection and counting in mammalian tissue. Nat. Protoc. 8, 1743–1758 (2013). [DOI] [PubMed] [Google Scholar]
- 66.Schindelin J et al. Fiji: an open-source platform for biological-image analysis. Nat. Methods 9, 676–682 (2012). [DOI] [PMC free article] [PubMed] [Google Scholar]
- 67.Love MI, Huber W & Anders S Moderated estimation of fold change and dispersion for RNA-seq data with DESeq2. Genome Biol. 15, 550 (2014). [DOI] [PMC free article] [PubMed] [Google Scholar]
- 68.Zhu A, Ibrahim JG & Love MI Heavy-tailed prior distributions for sequence count data: removing the noise and preserving large differences. Bioinformatics 35, 2084–2092 (2019). [DOI] [PMC free article] [PubMed] [Google Scholar]
- 69.Hoffman D et al. A non-classical monocyte-derived macrophage subset provides a splenic replication niche for intracellular Salmonella. Immunity 54, 2712–2723.e6 (2021). [DOI] [PMC free article] [PubMed] [Google Scholar]
- 70.Manco R et al. Clump sequencing exposes the spatial expression programs of intestinal secretory cells. Nat. Commun. 12, 3074 (2021). [DOI] [PMC free article] [PubMed] [Google Scholar]
- 71.Kult S et al. Bi-fated tendon-to-bone attachment cells are regulated by shared enhancers and KLF transcription factors. eLife 10, e55361 (2021). [DOI] [PMC free article] [PubMed] [Google Scholar]
- 72.McFarland AP et al. Multi-tissue single-cell analysis deconstructs the complex programs of mouse natural killer and type 1 innate lymphoid cells in tissues and circulation. Immunity 54, 1320–1337.e4 (2021). [DOI] [PMC free article] [PubMed] [Google Scholar]
- 73.Satija R, Farrell JA, Gennert D, Schier AF & Regev A Spatial reconstruction of single-cell gene expression data. Nat. Biotechnol. 33, 495–502 (2015). [DOI] [PMC free article] [PubMed] [Google Scholar]
- 74.van Dijk D et al. Recovering Gene Interactions from Single-Cell Data Using Data Diffusion. Cell 174, 716–729.e27 (2018). [DOI] [PMC free article] [PubMed] [Google Scholar]
- 75.Wolf FA, Angerer P & Theis FJ SCANPY: large-scale single-cell gene expression data analysis. Genome Biol. 19, 15 (2018). [DOI] [PMC free article] [PubMed] [Google Scholar]
Associated Data
This section collects any data citations, data availability statements, or supplementary materials included in this article.


