. 2023 Jan 10;12:e85837. doi: 10.7554/eLife.85837

Figure 1. Reconstitution of α-syn secretion regulated by palmitoylated DNAJC5 in HEK293T cells.

(A) Schematic diagrams of α-syn and DNAJC5. Domains are highlighted in different colors. Red arrows indicate known disease-causing mutations on each protein. (B) Membrane and cytosol fractionation scheme. Briefly, homogenized HEK293T cells were centrifuged at low speed to prepare a post-nuclear supernatant (PNS). High-speed centrifugation was then performed to separate the sedimentable membrane (M) from cytosol (C). (C) Partition of palmitoylated DNAJC5 (P-DNAJC5) and non-palmitoylated DNAJC5 (NP-DNAJC5) between the membrane (M) and cytosol (C) fractions. DNAJC5 was immunoprecipitated from cytosol and membrane with anti-FLAG resin and evaluated by Coomassie-blue stained SDS-PAGE. (D) α-syn secretion 16 h after transfection. The secretion of P-DNAJC5 in the medium was detected. (E) α-syn secretion 36 h after transfection. NP-DNAJC5 was also secreted in the medium together with α-syn.

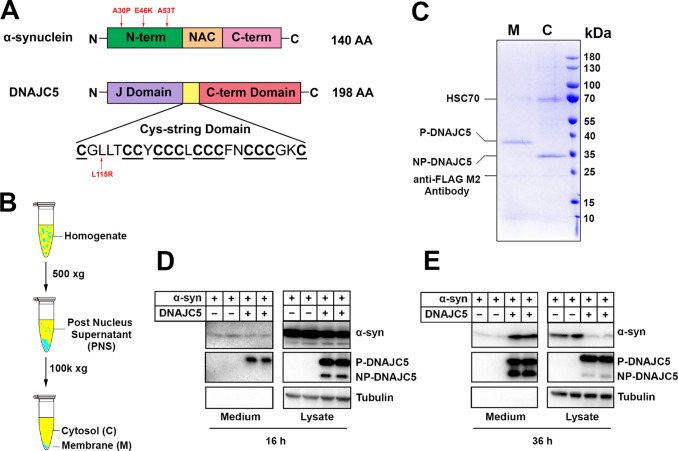
Figure 1—source data 1. Uncropped immunoblot and gel images corresponding to Figure 1.

Figure 1.

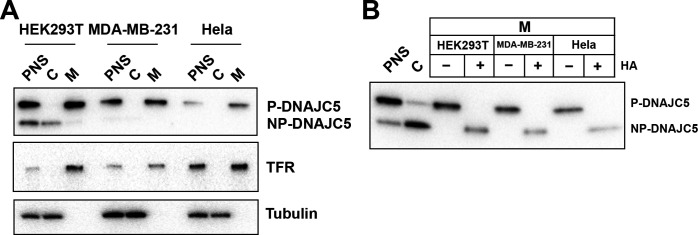
Figure 1—figure supplement 1. Validation of palmitoylation of DNAJC5 in various cell lines.

Figure 1—figure supplement 1.

(A) Membrane and cytosol fractionation of various cell lines (HEK293T, MDA-MB-231, and Hela) transfected with DNAJC5. The fractionation was performed as depicted in Figure 1B. C, cytosol; M, membrane; PNS, post-nuclear supernatant. Transferrin receptor (TFR) was used as a membrane marker. Tubulin was used as a cytosol marker. (B) In vitro depalmitoylation assay. Sedimented membranes (M) from different DNAJC5-transfected cell lines were collected and resuspended in 0.25 M Tris pH 7.2 buffer or 0.25 M Hydroxylamine (HA) pH 7.2 buffer. After overnight incubation at room temperature, the samples were examined by SDS-PAGE followed by anti-DNAJC5 immunoblot. PNS and C were used to compare the mobility of P-DNAJC5 and NP-DNAJC5, respectively.
Figure 1—figure supplement 1—source data 1. Uncropped immunoblot images corresponding to Figure 1—figure supplement 1.

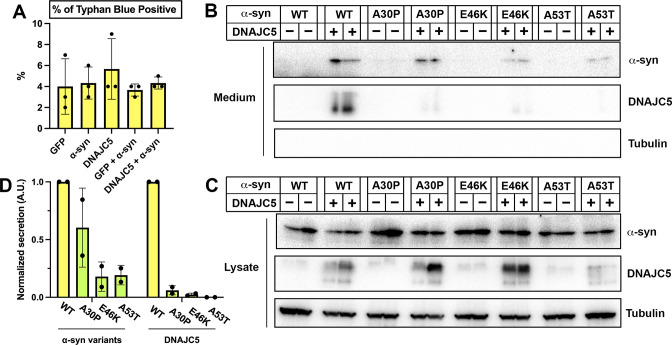
Figure 1—figure supplement 2. Secretion of α-syn variants.

Figure 1—figure supplement 2.

(A) Trypan blue cell vital staining after transfection with various constructs used in Figure 1. Ratios of trypan blue positive cells indicate the toxicity caused by transfection. Error bars represent standard deviations of three samples. (B) Secretion of α-syn variants into conditioned medium. Medium was collected, concentrated, and evaluated by SDS-PAGE and immunoblot. (C) Expression of α-syn variants in HEK293T cells. HEK293T cells were co-transfected with Parkinson’s disease (PD)-causing α-syn mutant (A30P, E46K, and A53T) and DNAJC5. (D) Quantification of normalized secretion (amount in medium divided by amount in lysate) of various α-syn variants and DNAJC5. The quantification was based on immunoblot in (B) and (C).
Figure 1—figure supplement 2—source data 1. Uncropped immunoblot images corresponding to Figure 1—figure supplement 2.

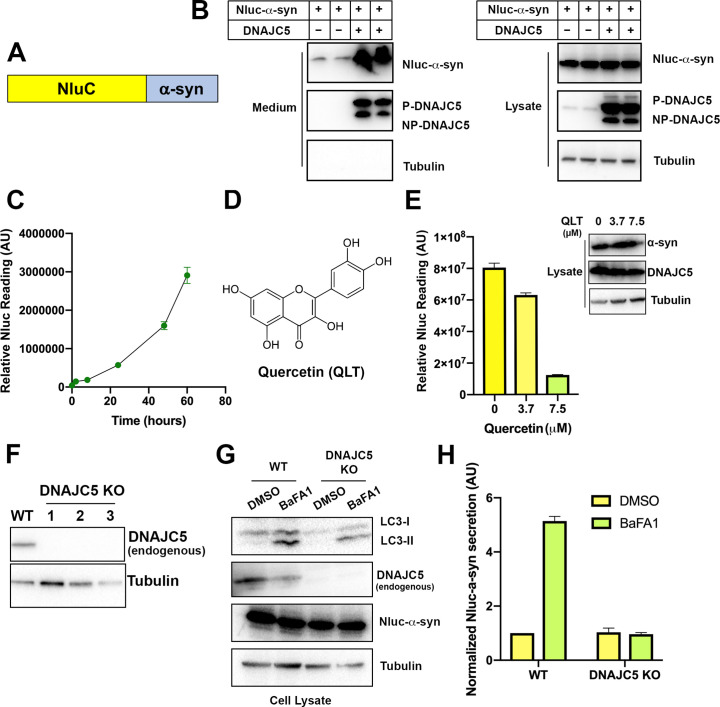
Figure 1—figure supplement 3. Secretion of α-syn is partially dependent on endogenous DNAJC5 in HEK293T cells.

Figure 1—figure supplement 3.

(A) Schematic diagram of nanoluciferase (Nluc)-fused α-syn. (B) Nluc-α-syn secretion was stimulated by DNAJC5 expression. Plasmids encoding Nluc-α-syn and DNAJC5 were co-transfected into HEK293T cells. Expression and secretion of proteins were detected with immunoblot 36 hr after transfection. (C) Time-dependent of accumulation of Nluc-α-syn in the medium without DNAJC5 overexpression. After transfecting HEK293T cells with Nluc-α-syn alone, fractions of medium were collected at indicated time points. (D) Chemical structure of quercetin (QLT), a reported DNAJC5 inhibitor. (E) QLT inhibited endogenous Nluc-α-syn secretion in a concentration-dependent manner. AU, arbitrary unit. Secretion assay similar to (B) was performed with treatment of indicated concentration of QLT. Amounts of secreted proteins were quantified with nanoluciferase assay 36 hr after transfection. Immunoblot of α-syn and DNAJC5 in cell lysate after QLT treatment was shown on the right. Error bars represent standard deviations of three samples. (F) Validation of DNAJC5 knockout (KO) cell line generated by CRISPR. Wildtype (WT) HEK293T cell was used as a control. In all three single clones of DNAJC5 KO cell lines, DNAJC5 was not detectable by immunoblot. (G) Treatment of bafilomycin A1 (BaFA1) induced LC3 lipidation in cells. After 24 hr of 100 nM BaFA1 treatment, media were collected, and cells were lysed for evaluation with SDS-PAGE followed by immunoblot. The accumulation of the lipidated form of LC3 (LC3-II) was used to indicate the inhibition of autophagy and lysosomal degradation in cells. (H) Quantification of α-syn secretion from WT and DNAJC5 KO HEK293T cells after 24 hr treatment of BaFA1. The normalized secretion was calculated as nanoluciferase reading from media divided by the reading from cell lysate. Error bars represent standard deviations of three samples.
Figure 1—figure supplement 3—source data 1. Uncropped immunoblot images corresponding to Figure 1—figure supplement 3.