. 2023 Jan 10;12:e85837. doi: 10.7554/eLife.85837

Figure 2. Characterization of secreted α-syn.

(A) Medium fractionation scheme. (B) Secreted α-syn was soluble. Differential centrifugation was performed with conditioned medium from HEK293T cells transfected with DNAJC5 and α-syn. Alix and CD9, exosome markers. PDI, an endoplasmic reticulum (ER) marker, was used as exosome-negative control. (C) Gel filtration fractionation of medium. Conditioned medium was concentrated and subjected to gel filtration fractionation. Fractions were evaluated by anti-α-syn immunoblot. (D) Chromatograms of tandem α-syn monomer (blue curve), dimer (green curve), and tetramer (red curve) were overlaid. In comparison, the relative intensity of secreted α-syn in each fraction was plotted as blue bars. (E) Schematic diagram of co-immunoprecipitation (co-IP) of secreted α-syn and FLAG-α-syn. Shown here is possible interaction between α-syn (blue circle) and FLAG-α-syn (yellow circle) in a representative tetrameric conformation. (F) Anti-FLAG immunoprecipitation (FLAG-IP) of media from cells transfected with indicated plasmids. Both the medium input and FLAG-IP samples were evaluated with anti-α-syn immunoblot (anti-α-syn WB).

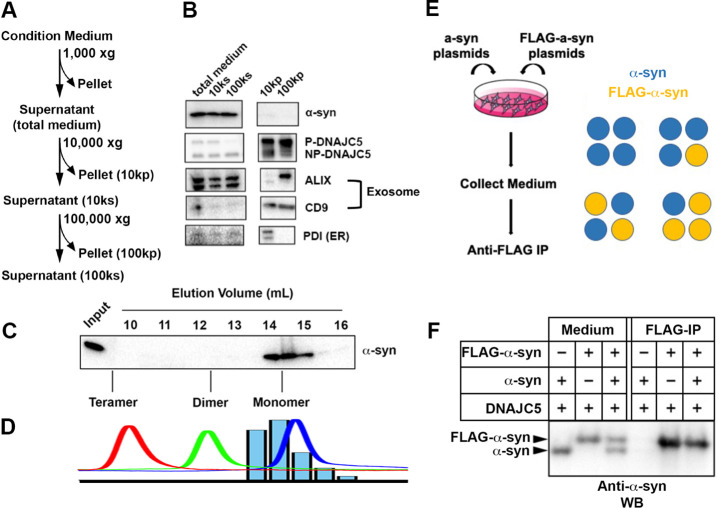
Figure 2—source data 1. Uncropped immunoblot corresponding to Figure 2.

Figure 2.

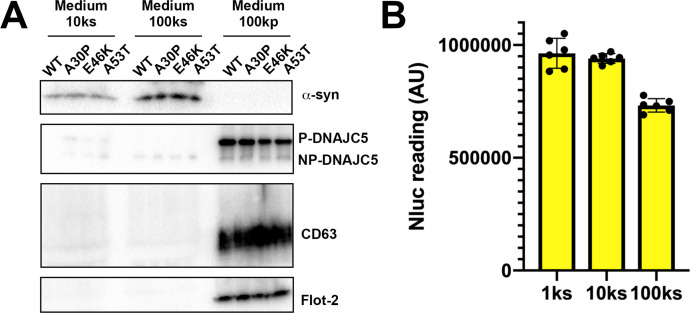
Figure 2—figure supplement 1. Solubility of secreted α-syn variants.

Figure 2—figure supplement 1.

(A) Medium fractionation of secreted α-syn PD mutants (A30P, E46K, and A53T). After differential centrifugation of medium, supernatant (10ks and 100ks) and pellet fractions (100kp) were evaluated by immunoblot. (B) Medium fractionation of basal secreted Nluc-α-syn without DNAJC5 overexpression. Similar fractionation assay was performed in (A) with medium from HEK293T cells transfected with Nluc-α-syn alone. Secreted Nluc-α-syn was quantified with a nanoluciferase assay. AU, arbitrary unit.
Figure 2—figure supplement 1—source data 1. Uncropped immunoblot images corresponding to Figure 2—figure supplement 1.
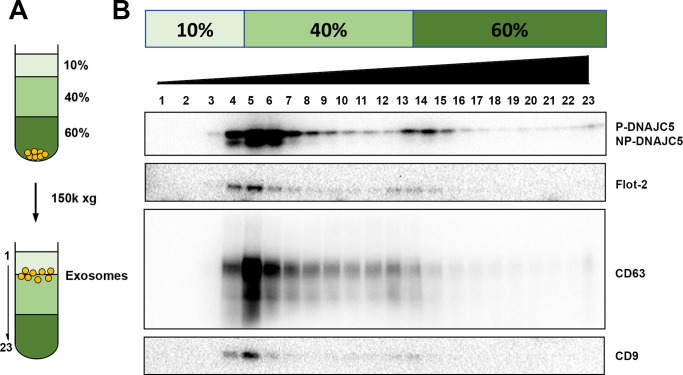
Figure 2—figure supplement 2. DNAJC5 enriched in buoyant EV fraction.

Figure 2—figure supplement 2.

(A) Schematic diagram of EV flotation protocol. Briefly, high-speed pellet fractions of growth medium were resuspended in 60% sucrose buffer and overlaid sequentially with 40% and 10% sucrose buffer. The tubes were centrifuged at 150,000 (150k)×g at 4°C for overnight. Buoyant EVs floated at the 10%/40% sucrose interface, separated from other insoluble materials. (B) Immunoblots across the sucrose step gradient. DNAJC5 as well as other classical exosome markers (Flot-2, CD63, and CD9) were highly enriched in fractions 4–6 at the 10%/40% interface.
Figure 2—figure supplement 2—source data 1. Uncropped immunoblot images corresponding to Figure 2—figure supplement 2.
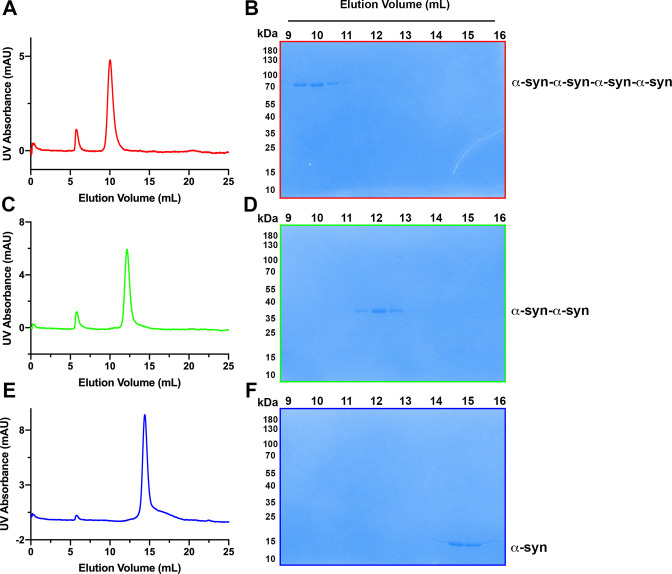
Figure 2—figure supplement 3. Assessment of tandem α-syn oligomers by gel filtration chromatography.

Figure 2—figure supplement 3.

(A) Chromatogram of purified tetrameric α-syn tandem oligomer (α-syn-α-syn-α-syn-α-syn). (B) Coomassie-blue stained SDS-PAGE of fractions from gel filtration of tetramericα-syn tandem oligomer (α-syn-α-syn-α-syn-α-syn). (C) Chromatogram of purified dimeric α-syn tandem oligomer (α-syn-α-syn). (D) Coomassie-blue stained SDS-PAGE of fractions from gel filtration of dimericα-syn tandem oligomer (α-syn-α-syn). (E) Chromatogram of purified WT α-syn (α-syn). (F) Coomassie-blue stained SDS-PAGE of fractions from gel filtration of WTα-syn (α-syn).
Figure 2—figure supplement 3—source data 1. Uncropped gel images corresponding to Figure 2—figure supplement 3.