Abstract
Aim:
The TBS-derived image processing method, based on the observer's diagnosis, has been developed in the current investigation. Image parametrization is proposed for both novel description and convergent shreds of evidence.
Background:
Condensed X-ray images of the esophageal timed barium swallow (TBS) provide substantial implications for elucidating the pathophysiological dimensions of esophageal motility disorders.
Methods:
Through the simultaneous study on TBS and high-resolution manometry (HRM) findings, we performed a retrospective cohort study on 252 patients from March 2018 to October 2019. Interventions, irrelevant information, and insufficient patient data were excluded. Only subjects with adequate data and acceptable test accuracy were considered for participation. We reviewed 117 Dicom (digital imaging and communications in medicine) X-ray images from patients with confirmed diagnoses of achalasia type II, esophagogastric junction outflow obstruction (EGJOO), or non-achalasia.
Results:
The results suggested a cut-off level of 47% in DDi (dilated diameter index) as a sign of the dilated body. In achalasia type II patients (n=66 images), the mean DDi was 55.6%. Our method presented a sensitivity of 95% and a specificity of 93% compared to images of the non-achalasia findings. The mean DDi in EGJOO patients was 50.4%, according to the 27 images. Moreover, results from EGJOO patients provided a sensitivity of 85% and specificity of 87%.
Conclusion:
TBS is an efficacious method and a prominent component in the process of achalasia diagnosis. Standard parametrization might develop radiological exports proposed by DDi. Our method could assist in obtaining a non-invasive medical diagnosis and help advance diagnostic reports to identify achalasia subtypes somewhat earlier. To the best of our knowledge, this interface is an innovative parametrization for TBS image review.
Key Words: High-resolution esophageal manometry, Esophageal barium time swallow, Image processing, Achalasia
Introduction
Difficulty in swallowing, known as dysphagia, is a gastrointestinal-associated defect that has affected human lives remarkably. Approximately one out of seventeen individuals will develop some types of dysphagia during their lifespan (1). Mechanical and motor disorders (neuro-muscular) are considered two principal categories of dysphagia. Patients with esophageal motility disorder (EMD) suffer from an abnormal contraction pattern of the esophageal muscle (2, 3), which might involve the upper esophageal sphincter (UES), esophageal body, or lower esophageal sphincter (LES). Achalasia, diffuse esophageal spasm, and ineffective esophageal motility disorder are the most common forms of EMD (3, 4).
Through manometric assessment, the absence of esophageal peristalsis and premature and high-pressure contractions of esophageal smooth muscle can be observed as signs of esophageal dysphagia (5). Moreover, tertiary waves and loss of sufficient propagation are the primary characteristics of EMD observed in barium swallow study (BSS) (6).
High-resolution esophageal manometry (HREM) is the gold standard method for diagnosing functional dysphagia. This technique translates intraluminal pressure of the esophagus into a digital map of pressures using an HREM catheter. HREM is well defined by the Chicago Classification (CC) to describe EMD types (5). As a minimally invasive method, sometimes patients show low tolerance during HREM assessment.
Notwithstanding the differences, esophageal barium swallow is used to characterize and identify EMD. Using real-time X-ray and fluoroscopic exams helps physicians interpret esophageal swallowing variations. A videofluoroscopic swallowing exam (VFSE) is a non-invasive and comfortable investigation method for all ages and all types of esophagus that requires little preparation (6). However, doubtful classification or the lack of a standard description make it tough to assist medical experts and radiologists. Nonetheless, meaningful indications in a BSS are noticeable for achalasia patients (7). The aim of the current study was to distinguish the interpretation of radiologists based on a novel computer-assisted intervention.
Establishing an accurate diagnosis process for achalasia sub-types would improve esophageal function and ultimate therapeutic response (8). Achalasia incidence is at the top of the list of EMDs and among the most frequently-occurring functional gastrointestinal tract disorders (9). Radiological reports of these patients face doubtful criteria that are not reliable for gastroenterologists (10). We believe that the lack of standardization and objectification in BSS reports causes suspicious diagnoses in radiological contexts. Blonski et al. showed a perfect correlation between BSS and HREM studies (11); however, the research still requires advanced criteria (12). Therefore, a simultaneous study was considered necessary to investigate the correlation between BSS and manometric findings in achalasia patients based on a computational method. The esophageal images obtained from BSS and timed barium swallowing (TBS) and the approved diagnosis of high-resolution esophageal manometry (HRM) are included in the current study. Our aim is to achieve a concurrent study from a bioengineering viewpoint, image investigation, and measurement characterization, with biomedical research in esophageal achalasia type-II.
This study investigated the esophageal body of suspicious achalasia patients to interpret signs and symptoms in barium images. We applied the signs of BSS into a systematic parametrization and standardization of the extracted images. Following our hypothesis, a computer-based code was written toward an automatic analysis of BSS images. This study aims to define an interface-based review from barium image to advanced radiology in BSS and or TBS reports. To the best of our knowledge, this kind of automatic measurement is the first and foremost in this field.
Materials and methods
A total of 252 EMD patients reported under the esophageal HRM diagnosis were studied from 2018 to 2019, using descriptive and analytical studies (13). Achalasia type-II, esophagogastric junction outflow obstruction (EGJOO), and non-achalasia patients were included for computational and medical analyses. Diagnosis has been approved using esophageal HRM based on Chicago Classification (CC). Other patients with intervention, underlying disease, or weak diagnostic information were excluded from the study. Data with simultaneous study (TBS and HRM) was included for computational analysis based on our dataset. One hundred seventeen analyzed images from BSS outcomes under the TBS protocol from 39 patients comprising 22 achalasia type-II, 10 non-achalasia, and 7 EGJOO patients, were used in our computational study (Table 1). These patients provided the only data found to have a simultaneous description from both esophageal HRM and BSS procedure.
Table 1 .
Dataset used in this study (only TBS images have been included)
| Achalasia Type II | Non-achalasia (CC) non-achalasia | EGJOO | ||
|---|---|---|---|---|
| Total Images | 66 | 30 | 21 | 117 |
| Total Patients | 22 | 10 | 7 | 39 |
| Total Reviewed | 252 EMD patients | |||
In this research, we have developed a computer code (ComC) for the automatic measurement of the esophagus body known as the thoracic segment. An X-ray image processing-based method was used to scrutinize the esophageal body, leading the study toward a systematic and standard measurement.
Image processing method
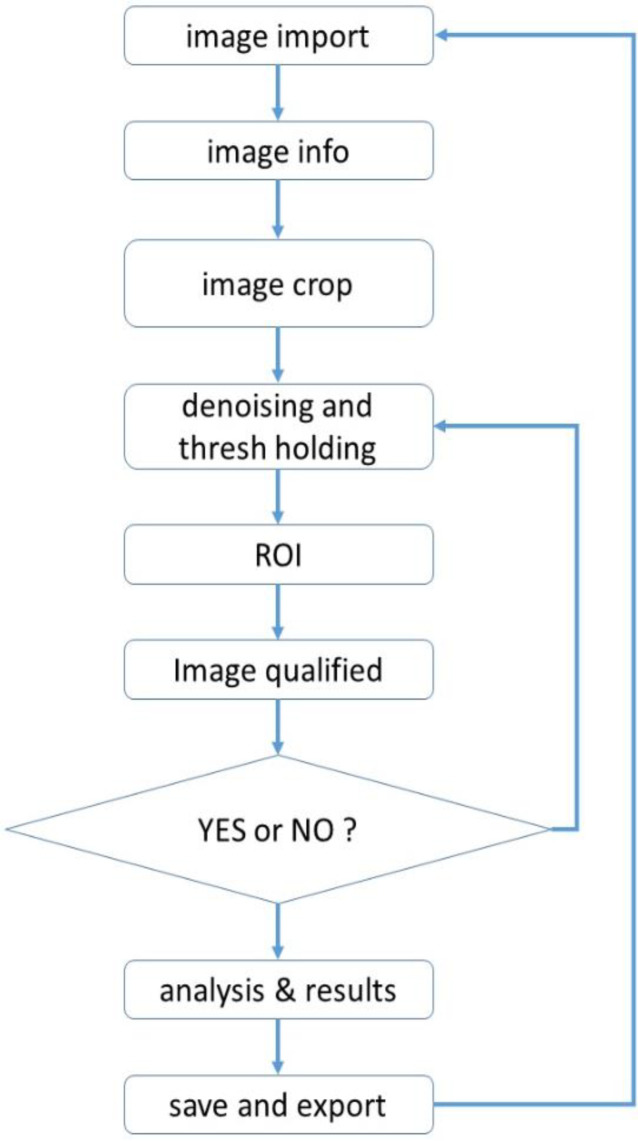
MATLAB 2016 software was used to measure images of an X-ray barium swallow. The process began with image import and related info, image crop, or region of interest (ROI) findings. Following said process, image denoising, thresholding, pixel differentiation, and pixel analysis were done. The flowchart of the process shown in Figure 1 describes the code development through thoracic esophagus measurement. This is a step-by-step process as follows (Figure 2 and 3).
Figure 1.
Flowchart of the computer coding procedure. Step 1: There are two possible types of input images into our ComC, jpg and dicom, and both are acceptable. In this step, the X-ray image is imported manually by the operator. Step 2: Next is the questionnaire stage, in which the view of the image and the related data are selected based on information from the BSS procedure. The operator answers only the questions to input image info in ComC. These include image from the BSS procedure. The operator answers only the questions to input image info in ComC. These include image view and barium type as well. Step 3: This step is crucial; the operator crops the Image in which is defined as the region of interest (ROI). While esophagus shapes differ among patients, the diaphragm and aortic knob are prior signs of lower and upper thoracic segmentation, respectively. Moreover, spinal cord numbering from the diaphragm is used in determining the accuracy of ROI findings (Figure 2)
Figure 2 .
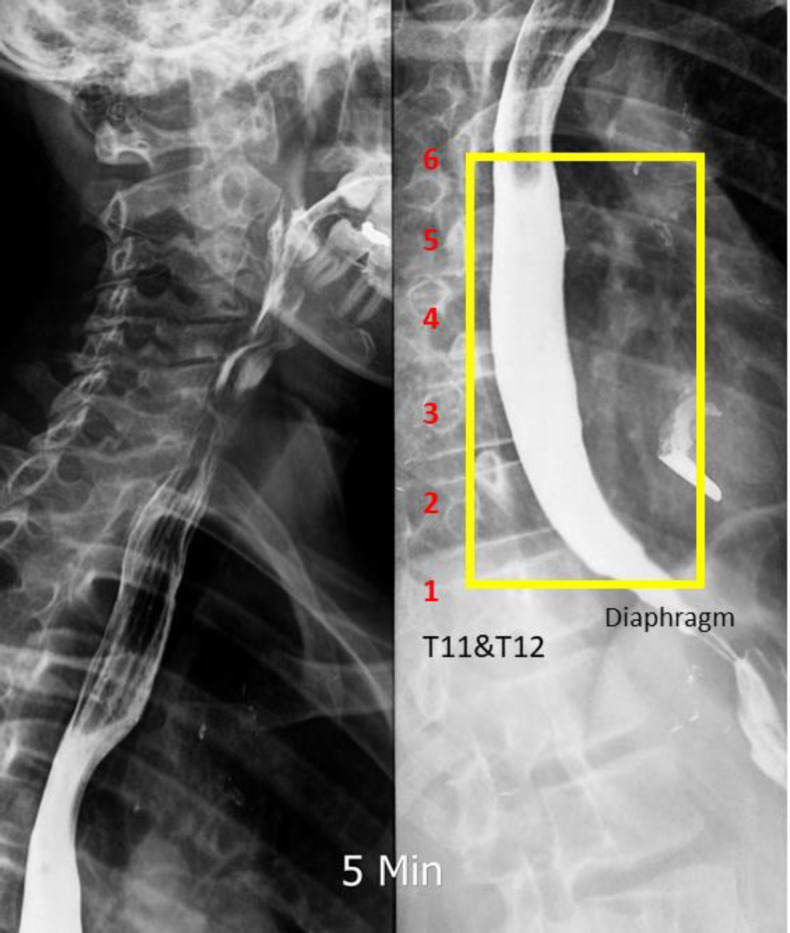
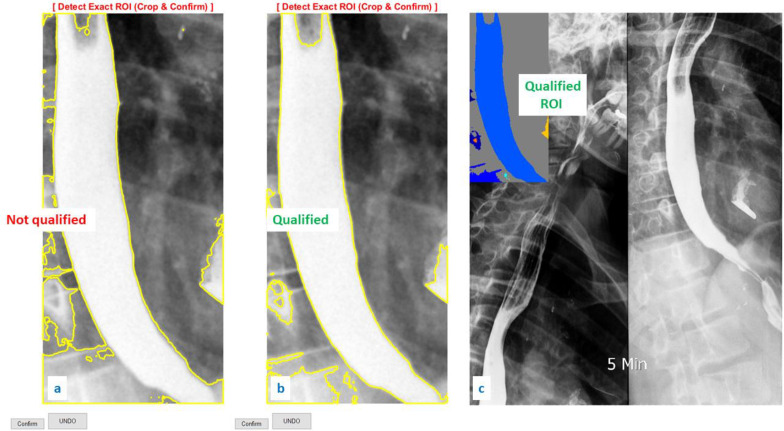
Image cropped to find ROI. Step 4: For image restoration and reconstruction, the linear gaussian noise has been added and the wiener filter applied. These functions aided the image enhancement and denoising process (22). Using a grayscale index, thresholding was applied to extract the border of the esophagus from its background. ComC uses the mean of the grayscale index from the cropped ROI in the first iteration for autonomous border extraction. In the second iteration, if the border is unclear or not confirmed, manual thresholding was done until the esophagus border was extracted (Figure 3 a and b). The digital spectrum of the grayscale index (known as binary image) is noted between 0 to 1 at scale of 10-4 or 0 to 255, representing black to white, respectively. Step 5: the image was qualified based on operator confirmation. The operator checks the quality of the detected border and may confirm it at this stage (Figure 3c). Step 6: Using our novel algorithm, autonomous measurement through the esophageal border was done. A computer-aided coding began to process the measurement of the diameter and positive/negative behavior of the cropped ROI. Parametrization was done utilizing the threshold step and esophagus border extraction. The final results from this step are presented in Figure 4
Figure 3.
a) Unqualified thresholding on the cropped ROI. b) Qualified thresholding on the cropped ROI. c) Pre-analysis on qualified ROI
Computer-aided measurement
In this investigation, esophagus dilation and the related propagation, as the primary signs in x-ray images (5, 14), were calculated. Clarifying information in Table 2, calculations were done through a pixel counting and pixel position (node highlighting). Please note that all analyzed images have a local coordinate (0,0 point, Figure 4) to distinguish the position and esophageal border characteristics.
Table 2.
Description of the signs and digital measurement through image analysis
| Signs | Digital sign | Description |
|---|---|---|
| Red “o” | o | Narrowing or high plus pressure zone |
| Purple “o” | o | Narrowing or high-pressure zone |
| Blue “o” | o | Dilated zone |
| Light Blue “o” | o | Under dilated zone |
| Green “+” | + | Positive peristalsis behavior |
| Black “+” | + | Negative peristalsis behavior |
Figure 4.
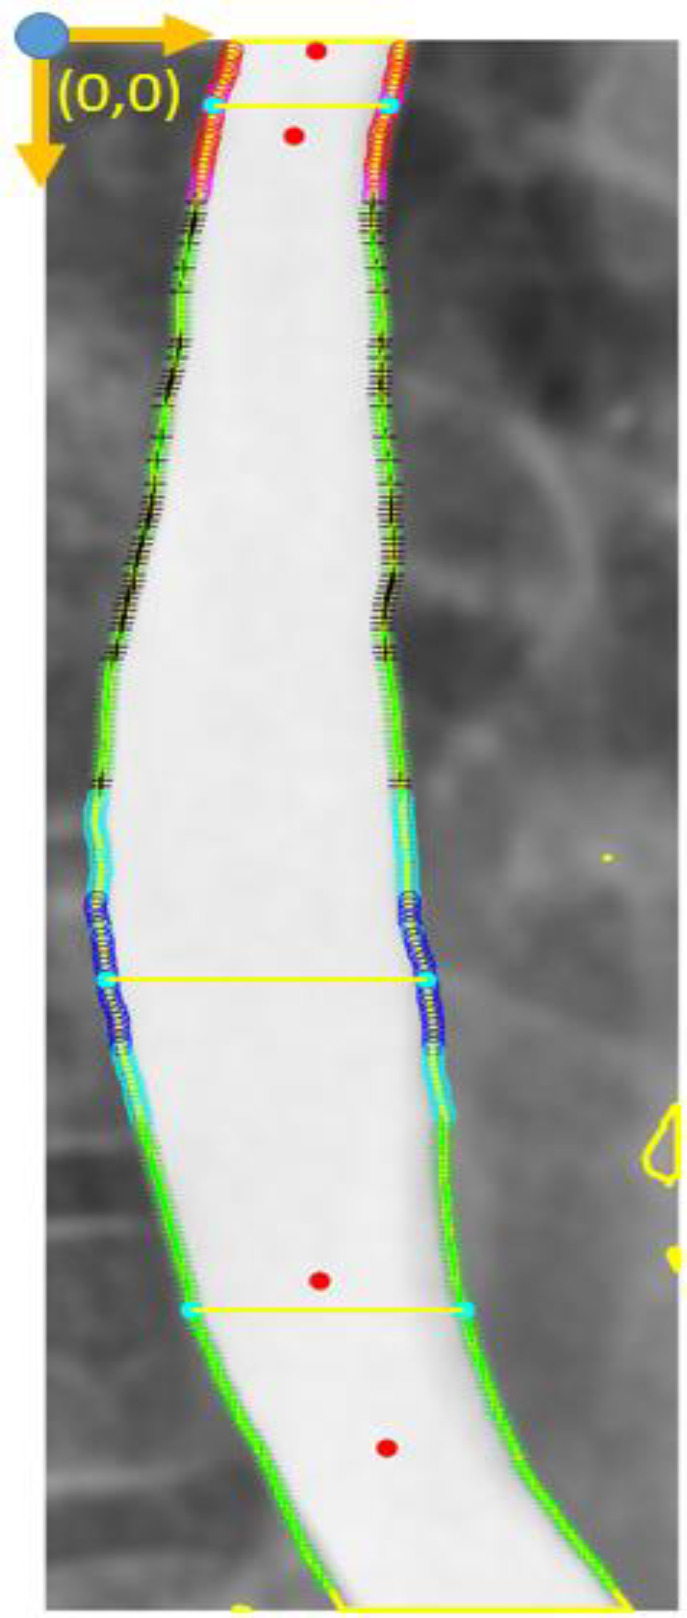
Final outcome from ComC; node highlight and critical border detection. Step 7: Considering outcomes from ComC, node highlighting have been abbreviated on Table 2. for an image review. Moreover, Dilated Diameter index (DDi), Positive Peristalsis Behavior (PPB) and Negative Peristalsis Behavior (NPB) are translated formulation for image achievements (Table 3)
DDi = Eq. 1
In DDi = Eq. 2 the DDi was calculated for each single image in ComC, wherein D (diameter) is the distance between each pair-node diagonally, and is the mean of all D. By DDi, the computer is counting the number of dilated diameters greater than .
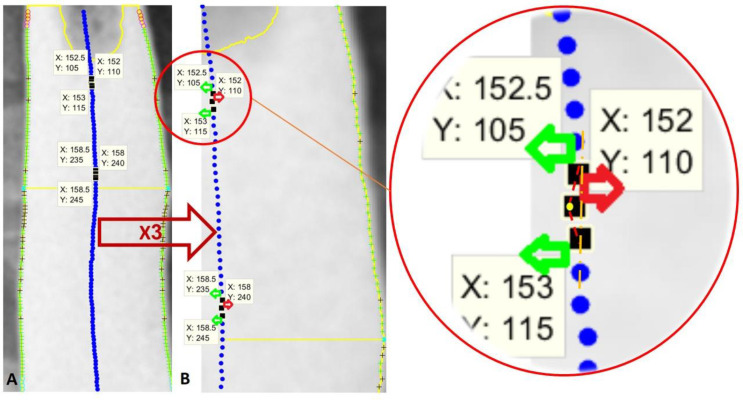
PPB and NPB represent positive and negative peristalsis behavior, respectively (Table 3). The node placement was done through the detected border (Figure 4) and is considered for the angle calculation in comparison to the next node. First, a virtual node placement was created (the middle blue nodes in Figure 5). Considering an imaginary strait vertical line, a 90° angle, all blue nodes propagated in comparison to the prior blue node (a forerunner node) are called PPB nodes. Any inconsistent node might reach a negative angle during the calculation on Figure 5 or NPB.
Table 3.
Description and calculation formula in esophageal parametrization on percentage scale
| Abbreviation | Calculation | Description | ||
|---|---|---|---|---|
| DDi [%] | Dilated Diameter index | |||
| PPB [%] | Positive Peristalsis Behavior | |||
| NPB [%] | Negative Peristalsis Behavior | |||
Figure 5.
PPB and NPB findings. The green “+” are PPB at the esophageal border, and the black “+” are NPB. The blue filled circles are middle points at each node pair (esophageal diameter centers). A) Normal analyzed image. B) X3 zoom export of Image A
Eq. 3
Eq. 4
Eq. 5
In the above equations, Anode is a matrix of all calculated angles in Figure 5, the angles between the blue nodes. Step-by-step iteration on each X and Y position were used to calculate Anode matrix. Outcomes were defined and final results from PPB and NPB were percentages of the positive and negative behavior, respectively, through all esophageal estimated nodes.
It should be noted that esophageal propagation is considered as normal behavior in peristalsis contractions. The right-move direction, considered as the PPB default for the frontal and right anterior oblique view, and the left-move direction for the left posterior oblique view were prerequisites of the ComC calculations.
Scale-free theory (%)
All equations are considered in percentage-scale outcomes in light of avoiding scale dependent results.
This definition is being used in all outcomes extracted from ComC (DDi = Eq. 1 to Eq. 4).
The percentage, as a dimension-free parameter, assisted us in estimating both JPEG and DICOM images.
Error calculation
To develop the ComC based on the independence of the original pixel spacing, a sensitivity analysis was done on an X-ray image. The pixel-distance-counter was increased for node placement on the esophageal border (abbreviated signs in Table 2). From 1 to 20, the original pixel-space of the image was considered for the pixel-distance-counter of ComC automatically. Through sensitivity analysis, the DDi was found independent from pixel spacing with an error of 1%. However, in light of PPB and NPB calculations, there was approximately 10% error in computing the angles between node placement on the esophageal border. Hence, with regard to the analysis, five-pixel spacing as a reference point was applied in the ComC (Table 4).
Table 4.
Sensitivity analysis through pixel spacing
| pix space (NO.) | 1 | 2 | 5 | 10 | 20 |
|---|---|---|---|---|---|
| PPB (%) | 93.57 | 89.15 | 80.83 | 77.88 | 77.7 |
| NPB (%) | 6.43 | 10.85 | 19.17 | 22.12 | 22.3 |
| DDi (%) | 63.51 | 62.7 | 63.56 | 62.96 | 63.23 |
| Time (S) | 27.8 | 17.61 | 10.12 | 6.98 | 4.9 |
Barium swallowing study
Patients refer to our radiology center for evaluation for dysphagia. After taking a thorough history and reviewing the patient’s relevant medical documents, they were informed about the procedure. Then, 135 grams of barium sulfate was mixed with 80 ml tap water, and each patient was asked to drink the suspension, which is ingested orally within a maximum of 20 seconds. The volume of suspension used for this study should have been tolerated by the patient without regurgitation or aspiration, and if the esophagus were dilated (achalasic), it could be filled adequately. If the patient needed sequential studies before and after treatment for achalasia, we used the same volume of barium as ingested for the baseline examination to obtain consistent results. Left posterior oblique films were taken 1, 2, and 5 minutes after barium ingestion. The views were printed on 14x17-inch film. The distance between the fluoroscope carriage and the patient was kept constant during all three spot films. The study was performed using a Shimadzu machine (KV max = 150, MA max = 500, maximum KV of fluoroscopy = 120, second max = 5). The CR (computed radiography) machine was from Konica (15-17).
Manometry study
The Chicago Classification provides standard outcomes for the analysis and categorization of EMD abnormalities, leading to a significant increase in both the knowledge of diagnosis and the management of motility disorders. Patients with esophageal HRM reports were included in this study and clarified with EMD type. Data was confirmed according to the Chicago Classification version III (CC V3.0). Interpretation was based on esophageal HRM as the gold standard for dysphagia diagnosis (5, 18). The high-resolution manometry used in the current research was a perfusion pomp module (Medical Measurement Systems, Enschede, The Netherlands) with 22 thin polyvinyl tubes (channel P1-P22). A skilled nurse linked the catheter into the pump after calibration. The procedure was begun and the catheter inserted into the esophagus lumen under the supervision of an expert gastroenterologist. Reports based on CC V3.0 were written by the gastroenterologist in the motility disorder department (5, 19).
Medical analysis and descriptive study
Following diagnosis, two expert radiologists and one expert gastroenterologist were responsible for patient data and diagnoses. Only patient data with simultaneous study, esophageal HRM and TBS findings was included. Based on physician reviews, the aforementioned cases were separated into the categories of achalasia II (n=66), EGJOO (n=29), and non-achalasia (n=10) patients based on the availability of esophageal HRM.
Sensitivity and specificity were evaluated for all analyzed outcomes as follows:
Results
All analyzed images are depicted in Table 5, these are the entered images from the simultaneous study of esophageal TBS and HRM patients. Following the steps through the ComC, each image was precisely prepared for image processing analysis. Outcomes were saved in Excel by the user’s command. Only X-ray images (n=117) from 1-min, 2-min, and 5-min TBS findings were included in this research. Images are from patients with diagnoses confirmed by esophageal HRM (Table 5).
Table 5.
Dataset included in this study. Results of the computational analysis and statistical info. DDi cut-off level was calculated; sensitivity and specificity were also estimated
| Achalasia Type II | non-achalasia | EGJOO | Sensitivity | Specificity | |||||
|---|---|---|---|---|---|---|---|---|---|
| TBS Terms | mean | ||||||||
| PPB (%) | 67.17051 | 58.85935 | 86.67287 | Achalasia type-II vs. non-achalasia | EGJOO vs. non-achalasia | ||||
| NPB (%) | 32.82949 | 41.14065 | 13.32713 | ||||||
| DDi | 55.61023 | 39.39245 | 50.42269 | Sensitivity: 95.52%Specificity: 93.1% | Sensitivity: 85%Specificity: 87.1% | ||||
| Total Images | 66 | 30 | 21 | 117 | |||||
| Total Patients | 22 | 10 | 7 | 39 | |||||
| DDi cut off level = DDimean (non-achalasia) (39.4%) + stdDDi (non-achalasia) (7.5%) = 47% | |||||||||
| True (images) | 64 > 47% | 27 < 47% | 17 > 47% | ||||||
| False (images) | 2 <= 47% | 3 => 47% | 4 <= 47% | ||||||
| Sensitivity= True positive / (True positive + False negative)Specificity= True negative / (False positive + True negative) | |||||||||
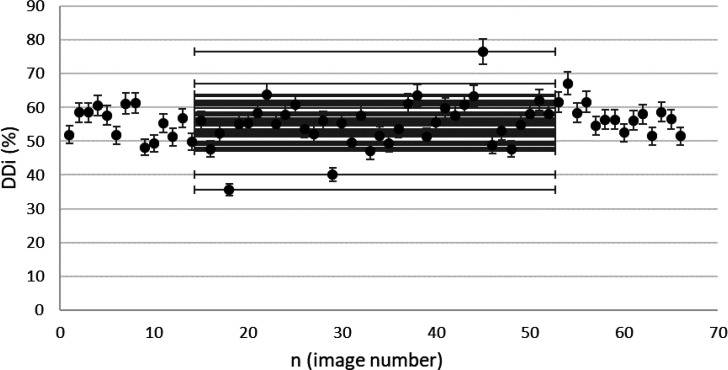
Findings from the included images confirmed by esophageal HRM are presented in Figure 6 to Figure 9. These results were calculated based on ComC autonomously.
Figure 6.
DDi results from confirmed achalasia type II patients, TBS images (n=66). MINDDi=35.6%, MAXDDi=76.6% (standard deviation) STDDDi= 6%.
Figure 9.
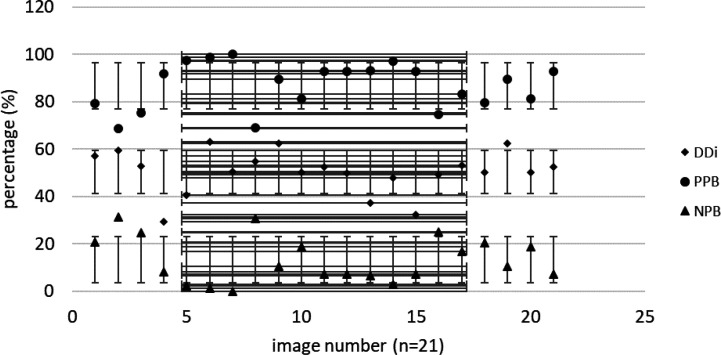
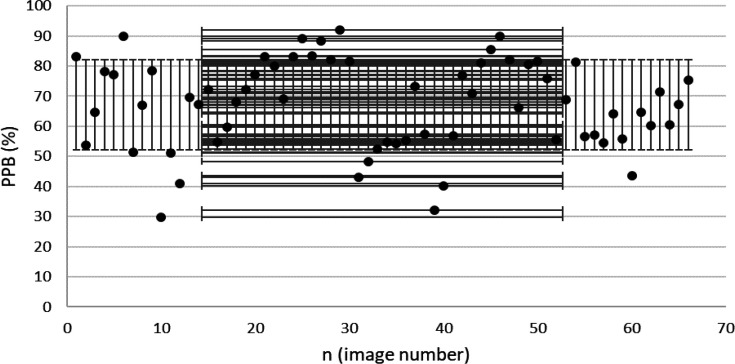
Extracted PPB from confirmed EGJOO patients. (MINPPB=68.6%, MAXPPB=100% and STDPPB=9.4%).
Discussion
High-resolution manometry is now considered the gold standard for the diagnosis of esophageal motility disorders (19). Based on our clinical experiences and patient meets, the procedure has difficulty in patient compliance as a catheter-based diagnosis method. Moreover, several limitations face esophageal HRM. Patients with respiratory problems, dilated esophagus, esophageal shortening, hiatal hernia, and finally, sensor errors from catheter channels. The barium swallow procedure is known as a non-invasive, low-cost method for examining esophageal characterization diagnoses (11, 12). In this study, our results showed parametrization as a virtual assistantship for the BSS procedure. This may lead research studies to the standard criteria and diagnosis as well.
Achalasia patients suffer from narrowing LES, followed by an abnormal body known as the thoracic segment. Diagnosis in its early phase might help to control advanced motility disorders on the esophageal body. Achalasia progress, cancer, and respiratory aspiration result from undiagnosed achalasia (8, 20, 21). Our study focused on achalasia patients because of its prevalence in dysphagia and the priority of the diagnosis in its early phase.
Figure 7.
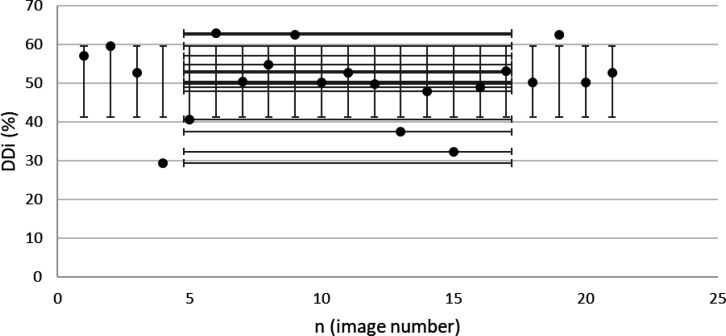
Extracted DDi from confirmed EGJOO patients, TBS images (n=21). MINDDi=29.32%, MAXDDi=63%, STDDDi= 8.9%
Figure 8.
DDi results from confirmed non-achalasia patients. MINDDi=24.1%, MAXDDi=58.2%, STDDDi=7.74%.
From the radiological point of view, there are doubtful signs in the LES segment of BSS findings. Bird-beak and rat-tail narrowing are approved signs for achalasia diagnosis (8). Aside from its long-term help, there are cases of diagnosed achalasia without the aforementioned signs (10). Therefore, our investigation focused on the esophageal body as a crucial part of smooth muscle dysfunction (20), introducing a standard method. Based on the outcomes shown in Table 5, the esophageal body's DDi and positive behavior (defined as PPB) are significant criteria that may result in the early diagnosis of achalasia in the future. ComC extracted a dilated body with DDi definition as the body deficiency and less PPB (Table 5). The calculated DDi is a standard parametrization for esophageal body dilation, considering the sensitivity analysis (Table 4). The term “esophageal dilation” has a variety of definitions among radiologists (17). Our ComC within a precise calculation defines an exact report of esophageal dilation with DDi (Figure 6). Considering the hypothesized cut-off level (DDi = 47%, Table 5), in a patient with type II achalasia, 55.6% DDi is an approved dilatation measurement, while the mean DDi for EGJOO and none-achalasia patients are 50% and 39%, respectively (Table 5) in TBS images. This clarifies less dilation in the cases as mentioned above compared to achalasia type II. To the best of our knowledge, no accurate medical device has yet been used to measure esophageal dilation. We believe that the measured DDi would help immensely toward a precise evaluation of esophageal dilation by TBS as a non-invasive method.
It is also noteworthy to characterize esophageal body behavior known as propagation. Border extraction and node-placement in the ComC arise mainly from distinguishing between positive or negative esophageal characterization behavior. These parameters require BSS and TBS protocols for a standard measurement (11, 17). The mean of PPB was found to be 67% in achalasia type II and 83.5% in EGJOO patients (Table 5). These outcomes demonstrate EGJOO as an achalasia phenotype with weak peristalsis compared with achalasia type II with 100% failed peristalsis (5). The PPB results may help to distinguish between achalasia sub-types and, optimistically, in the early diagnosis of achalasia.
Concerning the error chart of Table 4, DDi is independent of pixel spacing. PPB and NPB have about 10% error in minor pixel spacing in comparison to 5-pixel spacing. This represents more clarification on PPB and NPB assessment with larger pixel spacing, i.e. 10 and 20 pixels. Although some signs are missing from the esophageal border, like minor tertiary waves, the results shown in Table 4 encouraged us to use 5-pixel spacing for image analysis (Figure 5). Our image processing study for both DDi and PPB-NPB criteria is standard parametrization in the esophageal body on its own. Recent studies have experimented with the relation between TBS and esophageal HRM and compared TBS images with the HRM procedure (11). The results revealed a direct relation between TBS reports in achalasia diagnoses with esophageal HRM, but a rigid standard is still a deficiency (11). Schima et al. (12) approached 58% accuracy in a comparison of the VFSE and HRM methods in evaluating esophageal achalasia. The results extracted from ComC (Figure 6 to Figure 9) represent a condensed version of a solid report following the step-by-step protocol (Figure 1). The authors in this research suggest that an X-ray TBS image with higher DDi (>47%) along with less PPB (60-80 %) might be considered for achalasia type II.
We believe that our investigation on TBS images has opened a new window for both future confirmations of a definitive diagnosis and objectification in esophageal motility disorders and EMD types.
Conclusion
In conclusion, computerization of the TBS image is a novel research purposed to obtain a standard measurement and a virtual device for evaluation of the BSS procedure. The DDi, PPB-NPB of this study are original acquisitions on their own. These parameterizations developed our knowledge about achalasia patients, BSS, and TBS protocol as well. Our outcomes encouraged us toward diagnosing achalasia with the BSS procedure based on our method using TBS images. A future study might concentrate on DDi measurement of treatment improvement and follow-up studies for achalasia subtypes. Further research would continue to approve diagnosis in early achalasia and achalasia subtypes. LES measurement and spasm parametrizations are also subjects of future investigation in our long-term purposes.
Conflict of interests
The authors declare that there is no conflict of interests.
Acknowledgment
This study supported by Gastrointestinal, and liver Diseases Research Center (RCGLD), Shahid Beheshti University of Medical Sciences, Tehran, Iran under the ethical code no. IR. SBMU. MSP. REC. 1397.34. The authors would also like to thank Saba (radiological) Center in Tehran for contributing to this research and sharing some of the x-ray TBS images for a simultaneous study.
References
- 1.Malagelada JR, Bazzoli F, Boeckxstaens G, De Looze D, Fried M, Kahrilas P, et al. World gastroenterology organisation global guidelines: dysphagia--global guidelines and cascades update September 2014. J Clin Gastroenterol. 2015;49:370–8. doi: 10.1097/MCG.0000000000000307. [DOI] [PubMed] [Google Scholar]
- 2.Gasiorowska A. Fass R Current approach to dysphagia. Gastroenterol Hepatol. 2009;5:269–279. [Google Scholar]
- 3.Clouse R, Richter J, Heading R, Janssens J, Wilson J. Functional esophageal disorders. Gut. 1999;45:31–36. doi: 10.1136/gut.45.2008.ii31. [DOI] [PMC free article] [PubMed] [Google Scholar]
- 4.Vantrappen G, Janssens J, Hellemans J, Coremans G. Achalasia, diffuse esophageal spasm, and related motility disorders. Gastroenterology. 1979;76:450–457. [PubMed] [Google Scholar]
- 5.Kahrilas P, Bredenoord A, Fox M, Gyawali C, Roman S, Smout A, Pandolfino J, Group IHRMW. The Chicago Classification of esophageal motility disorders 3 0. Neurogastroenterol Motil. 2015;27:160–174. doi: 10.1111/nmo.12477. [DOI] [PMC free article] [PubMed] [Google Scholar]
- 6.Andersson M, Kostic S, Ruth M, Lönroth H, Kjellin A, Hellström M, et al. Characteristics of timed barium esophagogram in newly diagnosed idiopathic achalasia: clinical and manometric correlates. Acta Radiol. 2007;48:2–9. doi: 10.1080/02841850601026393. [DOI] [PubMed] [Google Scholar]
- 7.de Oliveira J, Birgisson S, Doinoff C, Einstein D, Herts B, Davros W, Obuchowski N, Koehler R, Richter J, Baker M. Timed barium swallow: a simple technique for evaluating esophageal emptying in patients with achalasia. AJR Am J Roentgenol. 1997;169:473–479. doi: 10.2214/ajr.169.2.9242756. [DOI] [PubMed] [Google Scholar]
- 8.Pandolfino JE, Gawron AJ. Achalasia: a systematic review. Jama. 2015;313:1841–1852. doi: 10.1001/jama.2015.2996. [DOI] [PubMed] [Google Scholar]
- 9.Galey KM, Wilshire CL, Niebisch S, Jones CE, Raymond DP, Litle VR, Watson TJ, Peters JH. Atypical variants of classic achalasia are common and currently under-recognized: a study of prevalence and clinical features. J Am Coll Surg. 2011;213:155–161. doi: 10.1016/j.jamcollsurg.2011.02.008. [DOI] [PubMed] [Google Scholar]
- 10.El-Takli I, O’Brien P, Paterson W. Clinical diagnosis of achalasia: how reliable is the barium x-ray? Can J Gastroenterol Hepatol. 2006;20:335–337. doi: 10.1155/2006/193823. [DOI] [PMC free article] [PubMed] [Google Scholar]
- 11.Blonski W, Kumar A, Feldman J, Richter JE. Timed barium swallow: diagnostic role and predictive value in untreated achalasia, esophagogastric junction outflow obstruction, and non-achalasia dysphagia. Am J Gastroenterol. 2018;113:196. doi: 10.1038/ajg.2017.370. [DOI] [PubMed] [Google Scholar]
- 12.Schima W, Ryan J, Harisinghani M, Schober E, Pokieser P, Denk D-M, et al. Radiographic detection of achalasia: diagnostic accuracy of videofluoroscopy. Clin Radiol. 1998;53:372. doi: 10.1016/s0009-9260(98)80012-3. [DOI] [PubMed] [Google Scholar]
- 13.Forootan M, Firozjah AMT, Amini S, Zali MR, Darvishi M. Classification of Esophageal Motility Disorders in Patients Referring to Hospital Manometric Unit. J Int Transl Med. 2018;6:181–184. [Google Scholar]
- 14.Pouderoux P, Lin S, Kahrilas PJ. Timing, propagation, coordination, and effect of esophageal shortening during peristalsis. Gastroenterology. 1997;112:1147–1154. doi: 10.1016/s0016-5085(97)70125-2. [DOI] [PubMed] [Google Scholar]
- 15.Palmer JB, Kuhlemeier KV, Tippett DC, Lynch C. A protocol for the videofluorographic swallowing study. Dysphagia. 1993;8:209–214. doi: 10.1007/BF01354540. [DOI] [PubMed] [Google Scholar]
- 16.Martin-Harris B, Logemann JA, McMahon S, Schleicher M, Sandidge J. Clinical utility of the modified barium swallow. Dysphagia. 2000;15:136–141. doi: 10.1007/s004550010015. [DOI] [PubMed] [Google Scholar]
- 17.Neyaz Z, Gupta M, Ghoshal UC. How to perform and interpret timed barium esophagogram. Journal of neurogastroenterology and motility. 2013;19:251–256. doi: 10.5056/jnm.2013.19.2.251. [DOI] [PMC free article] [PubMed] [Google Scholar]
- 18.Pandolfino JE, Kwiatek MA, Nealis T, Bulsiewicz W, Post J, Kahrilas PJ. Achalasia: a new clinically relevant classification by high-resolution manometry. Gastroenterology. 2008;135:1526–1533. doi: 10.1053/j.gastro.2008.07.022. [DOI] [PMC free article] [PubMed] [Google Scholar]
- 19.Fox MR, Bredenoord AJ. Oesophageal high-resolution manometry: moving from research into clinical practice. Gut. 2008;57:405–423. doi: 10.1136/gut.2007.127993. [DOI] [PubMed] [Google Scholar]
- 20.Vaezi MF, Pandolfino JE, Vela MF. ACG clinical guideline: diagnosis and management of achalasia. Am J Gastroenterol. 2013;108:1238–1249. doi: 10.1038/ajg.2013.196. [DOI] [PubMed] [Google Scholar]
- 21.Zaninotto G, Bennett C, Boeckxstaens G, Costantini M, Ferguson M, Pandolfino J, et al. The 2018 ISDE achalasia guidelines. Dis Esophagus. 2018:31. doi: 10.1093/dote/doy071. [DOI] [PubMed] [Google Scholar]
- 22.Kazubek M. Wavelet domain image denoising by thresholding and Wiener filtering. IEEE Signal Process Lett. 2003;10:324–326. [Google Scholar]


