

Abstract
Background:
Local inflammation plays an important role in normal folliculogenesis and ovulation, and conditions of chronic systemic inflammation, such as obesity and PCOS, can disrupt normal follicular dynamics.
Objective:
To determine the association between systemic inflammation, as measured by C-Reactive Protein (CRP) levels, and menstrual cycle length.
Study Design:
Secondary analysis using data from Time to Conceive (TTC), a prospective time-to-pregnancy cohort study. The association between cycle length and CRP was analyzed using multivariable linear mixed and marginal models adjusted for age, race, education, body mass index, time since oral contraceptive use, alcohol, smoking, caffeine consumption, and exercise. TTC enrolled women aged 30 to 44 with no history of infertility who were attempting to conceive for <3 months. Serum C-Reactive Protein (CRP) levels were measured on cycle day 2, 3, or 4. Participants recorded daily menstrual cycle data for ≤ 4 months.
Results:
Main outcome measures included menstrual cycle length and follicular and luteal phase lengths. Multivariable analysis included 1,409 cycles from 414 women. There was no linear association between CRP levels and menstrual cycle length. However, compared to CRP <1 mg/L, a CRP >10 mg/L was associated with over three times the odds (aOR 3.7; 95% CI 1.67,8.11) of long cycles (defined as ≥ 35 days). When evaluating follicular phase length, a CRP of >10 mg/L was associated both with follicular phases that were 1.7 (95% CI 0.23,3.09) days longer and with over 2 times the odds of being long (aOR 2.2; 95% CI 1.05,4.74).
Conclusion:
There is a potential pathophysiologic association between systemic inflammation and menstrual cycle changes. Further studies are needed to determine if systemic inflammation alters the menstrual cycle or if long menstrual cycles are a marker for elevated systemic inflammation.
Keywords: C-Reactive Protein (CRP), follicular phase, luteal phase, ovulation, chronic inflammation
Condensation:
Elevated levels of C-Reactive Protein (CRP) are associated with long menstrual cycles and long follicular phases, demonstrating a potential pathophysiologic association between systemic inflammation and menstrual cycle changes.
Introduction
Menstrual cycle length is a vital sign of reproductive health1 associated with both natural fertility2,3 and response to ovarian stimulation during assisted reproductive technology treatment (ART)4. Cycle length shortening is a sign of ovarian aging, and short cycles are associated with lower ovarian reserve biomarkers (anti-Mullerian hormone [AMH]5 and antral follicle count), decreased fecundability2,3, and poorer response to ovarian stimulation4. Few studies have examined the relationship between fecundability and long menstrual cycles, but cycles greater than 35 days have also been associated with decreased fecundability6. Longer cycles are more likely to be anovulatory7 with many of these women meeting diagnostic criteria for polycystic ovarian syndrome (PCOS)8.
Local inflammation plays an important role in normal folliculogenesis and ovulation, and conditions of chronic systemic inflammation, such as obesity and PCOS, can disrupt normal follicular dynamics, leading to impaired ovulation and poor oocyte quality9. CRP is a nonspecific acute phase reactant produced by hepatocytes in response to the inflammatory cytokines tumor necrosis factor alpha (TNF-alpha) and interleukin (IL) 6. CRP plays a key role in the innate immune system, assisting with complement binding and phagocytosis by macrophages, and helping the body recognize and eliminate pathogens10. CRP is used clinically to diagnose acute inflammatory processes such as infection or trauma10 and is persistently elevated at lower levels in patients with chronic inflammatory conditions, including cardiovascular disease and type 2 diabetes11.
We sought to evaluate the potential effect of chronic inflammation (measured by CRP) on the menstrual cycle in a prospective cohort of women of reproductive age attempting to conceive. No studies to date have examined the association between CRP and menstrual cycle length or follicular and luteal phase lengths.
Materials and Methods
Study design
Time to Conceive (TTC) was a time-to-pregnancy cohort of women aged 30–44 attempting to conceive naturally for three months or less (2008–2015)12. This is a secondary analysis of data from Time to conceive, which was originally designed to determine the association between biomarkers of ovarian reserve and fertility. Exclusion criteria were current breastfeeding, use of injectable hormonal contraception in the last year, a partner with infertility, or an infertility diagnosis (a prior diagnosis of polycystic ovarian syndrome (PCOS), surgically diagnosed endometriosis, prior sterilization, tubal blockage, previous or current use of fertility treatment)12. Additional study methods and findings are available in the prior publication 12. All women provided informed consent for study participation after they were screened for eligibility with a telephone questionnaire. TTC was approved by the institutional review board (IRB) at the University of North Carolina at Chapel Hill. We performed a secondary analysis of these data that was approved by the Duke University IRB.
At enrollment, women completed a baseline questionnaire including information on demographics, hormonal contraceptive use, smoking, and alcohol use. This was followed by an in-person visit for collection of baseline blood samples on menstrual cycle day 2, 3 or 4. Serum and blood spots from this visit were stored at −30°C. A total of 807 women provided a serum sample. Participants then kept daily menstrual diaries for up to 4 months and recorded all medication and supplement use, instances of sexual intercourse, days of vaginal bleeding or spotting, and pregnancy test results. Use of ovulation predictor kits (OPK) was not required, but women who chose to use them were asked to record the results in their diaries. Later in the study, in 2013, OPKs were included as part of the study and distributed to participants. Women could choose to withdraw their participation from the study at any time and were also withdrawn if they began fertility treatment.
C-Reactive Protein (CRP)
CRP is stable in stored samples, and long-term storage has been shown to have minimal effect on serum levels13. CRP was measured in stored serum samples by the Duke University Biomarkers Core using a high sensitivity immunoturbidimetric assay14. Mean intra- and inter-assay coefficients of variation were 5.6% and 8.9%, respectively. The lower limit of detection was 0.0013 ng/mL. Four clinically relevant categories were defined based on CDC and AHA criteria 9: <1.0 mg/L, ≥1.0-<3.0 mg/L, ≥3.0 < 10.0 mg/L, and ≥10.0 mg/L. Seven women did not have serum available for CRP analysis and were excluded (N= 16 cycles, 5 women, Figure 1). Women with self-reported hypertension or diabetes (N= 105 cycles, N= 34 women), were excluded from the final analysis dataset given higher levels of CRP associated with these diagnoses.
Figure 1. Flow diagram of study enrollment and cohort selection.
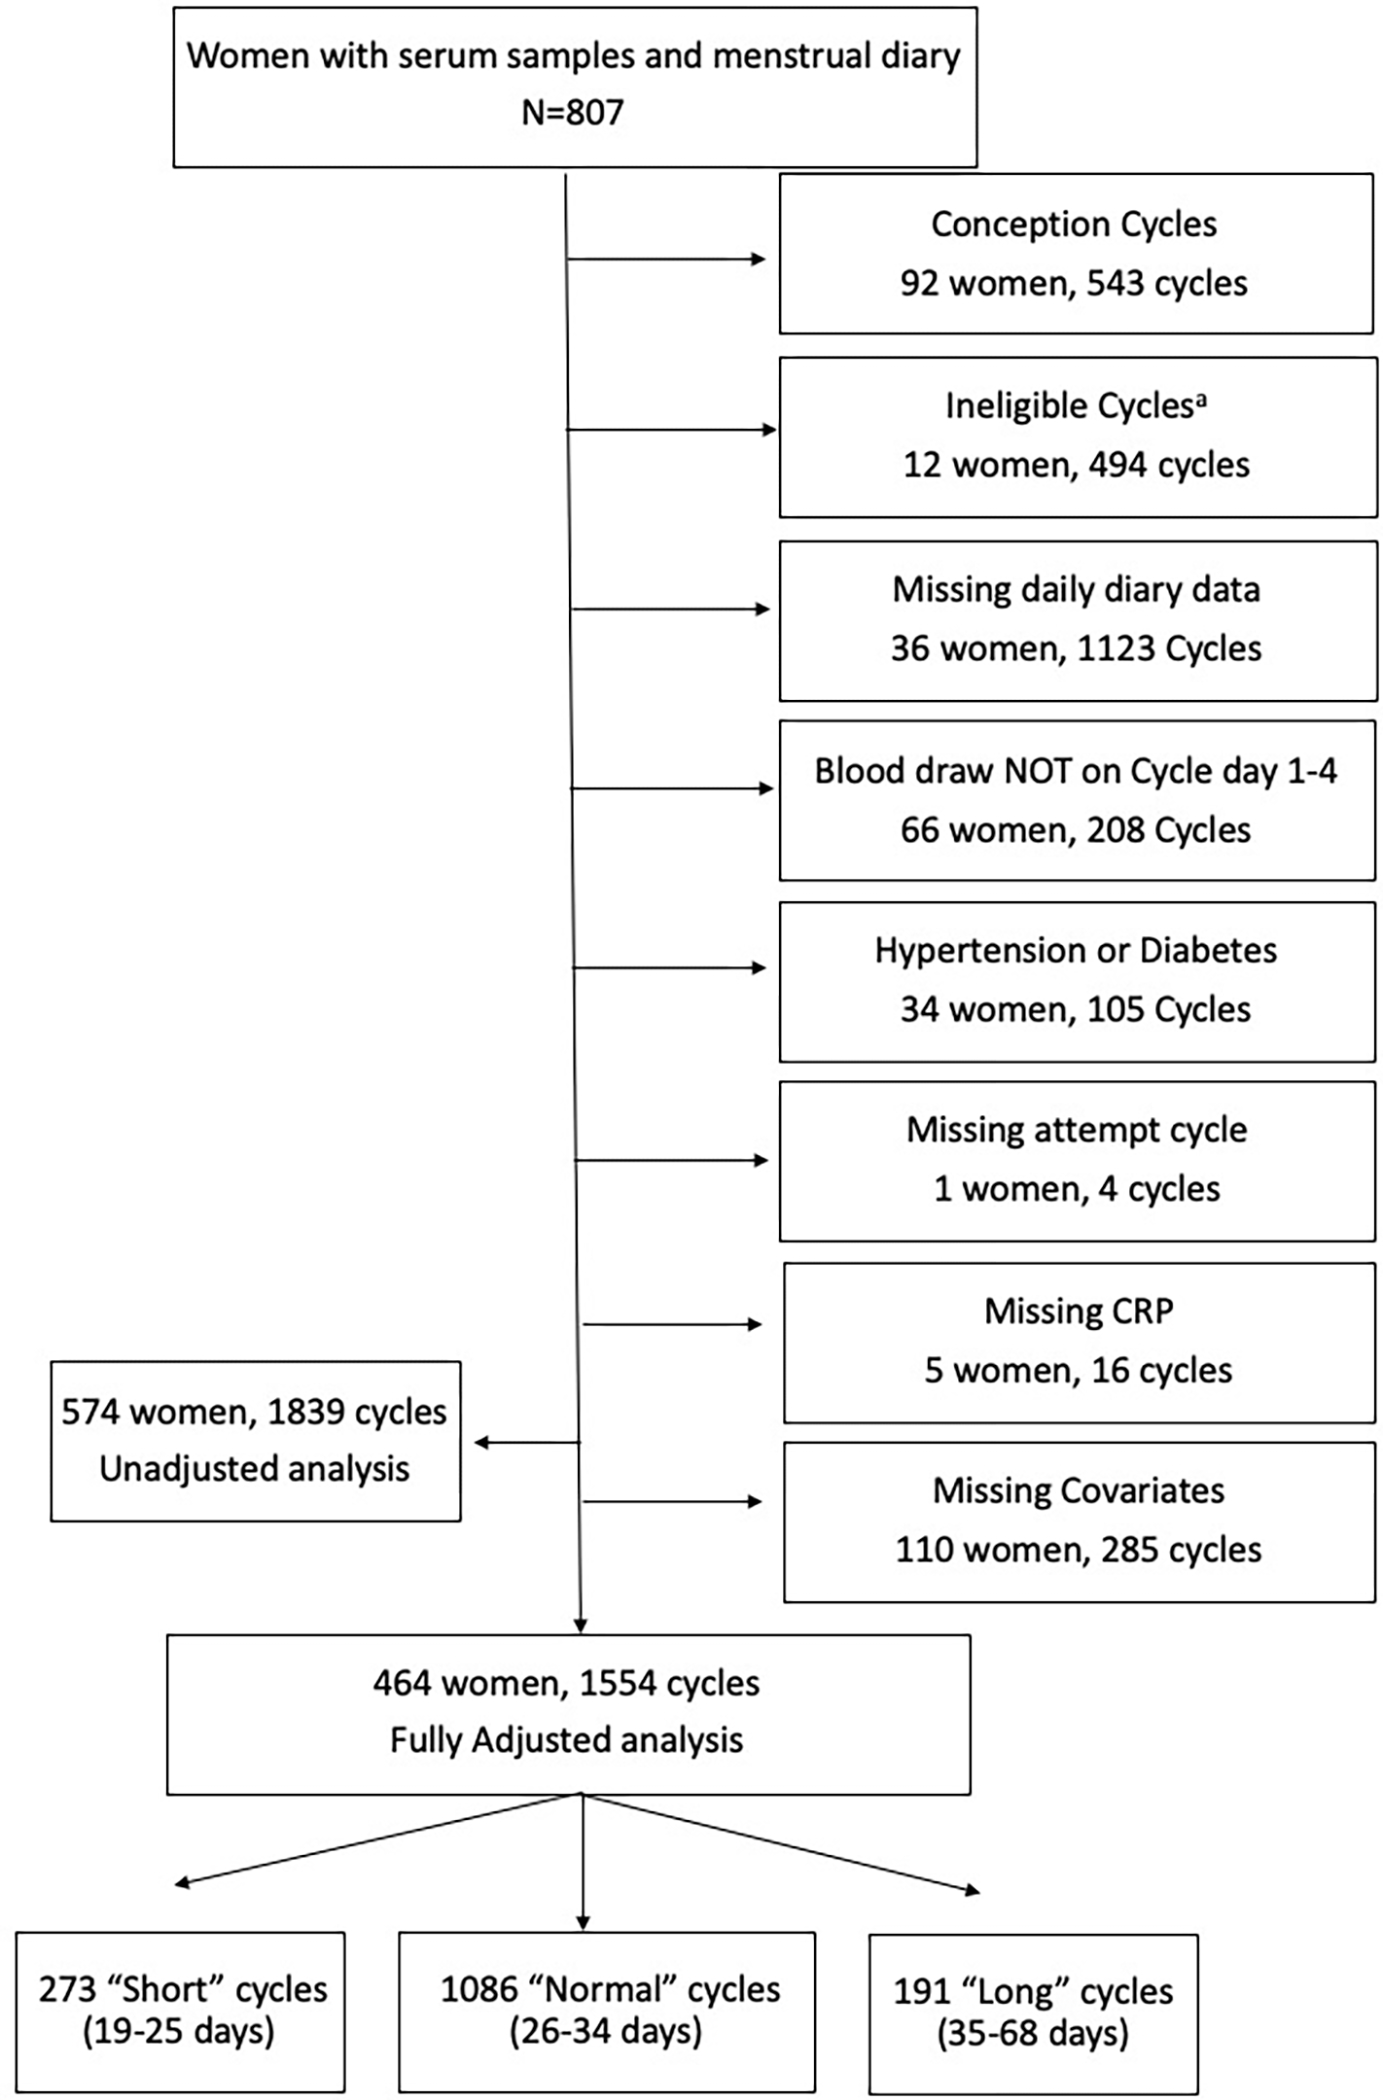
aIneligible cycles among women who stopped trying to conceive or began fertility treatment.
Menstrual cycle length
Menstrual cycle length was defined as the number of days from the first day of menses (the first day of bleeding) up to but not including the first day of the next menses. The onset of menses was identified by 2 consecutive days of vaginal bleeding, not including spotting15. Two dichotomous variables were created: “short cycles” of 25 days or less and “long cycles” of 35 days or more15. After excluding ineligible cycles (N=494) and cycles ending in pregnancy (N= 543), given that they have an undefined cycle length, the unadjusted analysis dataset contained 574 women and 1,839 cycles (Figure 1). Table 1 contains cycle length data stratified by woman (average cycle length per woman) and cycles, respectively. Given variability of CRP throughout the menstrual cycle, the analysis was limited to blood samples that were drawn on cycle days 1, 2, 3, or 4. The fully adjusted analysis dataset contained 1,554 menstrual cycles from 464 women.
Table 1.
Study Participant Characteristics Stratified by CRP Categories (N=1,839 cycles, 574 women)
| No. Women | <1 mg/L N cycles (%) | ≥1.0 – <3.0 mg/L N cycles (%) | ≥3.0 – < 10.0 mg/L N cycles (%) | ≥10 mg/L N cycles (%) | |
|---|---|---|---|---|---|
| N=574 | N=946 | N=511 | N=238 | N=144 | |
| Menstrual Cycle Length (days) | |||||
| 19–25 | 77 (13.4%) | 197 (20.8%) | 78 (15.3%) | 38 (16.0%) | 27 (18.8%) |
| 26–34 | 408 (71.1%) | 654 (69.1%) | 363 (71.0%) | 176 (73.9%) | 87 (60.4%) |
| 35–68 | 87 (15.2%) | 94 (9.9%) | 68 (13.3%) | 24 (10.1%) | 29 (20.1%) |
| Missing | 2 (0.3%) | 1 (0.1%) | 2 (0.4%) | 0 (0.0%) | 1 (0.7%) |
| Age (years) | |||||
| <35 | 393 (68.5%) | 621 (65.6%) | 336 (65.8%) | 116 (48.7%) | 99 (68.8%) |
| 35–37 | 106 (18.5%) | 174 (18.4%) | 109 (21.3%) | 53 (22.3%) | 14 (9.7%) |
| >=37 | 75 (13.1%) | 151 (16.0%) | 66 (12.9%) | 69 (29.0%) | 31 (21.5%) |
| Self-reported Race | |||||
| Non-Hispanic Black | 47 (8.2%) | 78 (8.2%) | 42 (8.2%) | 37 (15.5%) | 24 (16.7%) |
| Native American | 1 (0.2%) | 4 (0.4%) | 0 (0.0%) | 0 (0.0%) | 0 (0.0%) |
| Asian | 41 (7.1%) | 73 (7.7%) | 48 (9.4%) | 15 (6.3%) | 0 (0.0%) |
| Non-Hispanic white | 450 (78.4%) | 735 (77.7%) | 387 (75.7%) | 169 (71.0%) | 118 (81.9%) |
| Hispanic/Latinx | 15 (2.6%) | 23 (2.4%) | 12 (2.3%) | 8 (3.4%) | 2 (1.4%) |
| Multi-racial/Unknown | 20 (3.5%) | 33 (3.5%) | 22 (4.3%) | 9 (3.8%) | 0 (0.0%) |
| Education | |||||
| <HS or Some College | 40 (7.0%) | 34 (3.6%) | 42 (8.2%) | 35 (14.7%) | 22 (15.3%) |
| 4-year Degree | 165 (28.7%) | 273 (28.9%) | 157 (30.7%) | 63 (26.5%) | 55 (38.2%) |
| Graduate Degree | 369 (64.3%) | 639 (67.5%) | 312 (61.1%) | 140 (58.8%) | 67 (46.5%) |
| Body Mass Index (kg/m2) | |||||
| < 18.5 | 21 (3.7%) | 50 (5.3%) | 2 (0.4%) | 9 (3.8%) | 0 (0.0%) |
| 18.5–24.9 | 357 (62.2%) | 731 (77.3%) | 262 (51.3%) | 85 (35.7%) | 42 (29.2%) |
| 25–29.9 | 116 (20.2%) | 127 (13.4%) | 169 (33.1%) | 63 (26.5%) | 26 (18.1%) |
| 30+ | 79 (13.8%) | 37 (3.9%) | 78 (15.3%) | 81 (34.0%) | 76 (52.8%) |
| Missing | 1 (0.2%) | 1 (0.1%) | 0 (0.0%) | 0 (0.0%) | 0 (0.0%) |
| Oral contraceptive use prior to cycle | |||||
| No hormone use for >=2 cycles | 462 (80.5%) | 877 (92.7%) | 454 (88.8%) | 220 (92.4%) | 128 (88.9%) |
| Hormone use in prior 1–2 cycles | 74 (12.9%) | 39 (4.1%) | 42 (8.2%) | 15 (6.3%) | 10 (6.9%) |
| Missing | 38 (6.6%) | 30 (3.2%) | 15 (2.9%) | 3 (1.3%) | 6 (4.2%) |
| Alcohol consumption | |||||
| No alcohol | 197 (34.3%) | 277 (29.3%) | 191 (37.4%) | 107 (45.0%) | 48 (33.3%) |
| <=7 drinks/week | 321 (55.9%) | 580 (61.3%) | 274 (53.6%) | 105 (44.1%) | 73 (50.7%) |
| >7 drinks/week | 54 (9.4%) | 82 (8.7%) | 46 (9.0%) | 26 (10.9%) | 23 (16.0%) |
| Missing | 2 (0.3%) | 7 (0.7%) | 0 (0.0%) | 0 (0.0%) | 0 (0.0%) |
| Smoking History | |||||
| Never smoked | 434 (75.6%) | 743 (78.5%) | 374 (73.2%) | 152 (63.9%) | 116 (80.6%) |
| Current smoker | 9 (1.6%) | 11 (1.2%) | 13 (2.5%) | 0 (0.0%) | 4 (2.8%) |
| Former smoker | 131 (22.8%) | 192 (20.3%) | 124 (24.3%) | 86 (36.1%) | 24 (16.7%) |
| Caffeine consumption | |||||
| Less than 1/2 cup/day | 120 (20.9%) | 192 (20.3%) | 115 (22.5%) | 42 (17.6%) | 30 (20.8%) |
| 1/2 to less than 2 cups/day | 198 (34.5%) | 351 (37.1%) | 162 (31.7%) | 74 (31.1%) | 58 (40.3%) |
| 2-<3 cups/day | 169 (29.4%) | 277 (29.3%) | 145 (28.4%) | 73 (30.7%) | 30 (20.8%) |
| 3+ cups per day | 87 (15.2%) | 126 (13.3%) | 89 (17.4%) | 49 (20.6%) | 26 (18.1%) |
| Reported exercise | |||||
| <1 hours/week | 55 (9.6%) | 75 (7.9%) | 54 (10.6%) | 15 (6.3%) | 15 (10.4%) |
| 1–3 hours/week | 279 (48.6%) | 470 (49.7%) | 281 (55.0%) | 145 (60.9%) | 78 (54.2%) |
| 4–7 hours/week | 130 (22.6%) | 255 (27.0%) | 107 (20.9%) | 42 (17.6%) | 17 (11.8%) |
| Missing | 110 (19.2%) | 146 (15.4%) | 69 (13.5%) | 36 (15.1%) | 34 (23.6%) |
In the “No. Women” column, each woman is categorized by her mean menstrual cycle length during the study
Phase length
Ovulation was defined using diary recordings of ovulation predictor kit (OPK) results, cervical mucus monitoring, or basal body temperature. Before 2013, participants could use their own voluntarily purchased OPKs to record their test results. However, this practice was uncommon, so ovulation predictor kit information was often missing for these cycles (N=1,069 cycles missing ovulation data)16. Starting in 2013, participants were provided with OPKs as part of the study. Ovulation was estimated to occur 24 hours after a positive OPK. If a positive OPK was not available, ovulation was estimated based on the rise in recorded basal body temperature or the last reported day of type 4 cervical mucus16. Follicular and luteal phase analyses included only those cycles with documented ovulation using these methods. Follicular phase was defined as the number of days from the first day of menses to the day before ovulation17. For the follicular phase analysis (N= 895 phase lengths), we included conception cycles given these occurred prior to ovulation. Follicular phase length was analyzed both continuously and with two dichotomous variables: “long” (≥ 18 days) and “short” (≤ 10 days), based on the 90th and 10th percentiles, respectively. Luteal phase17 was defined as the number of days from the day following ovulation to the day prior to the onset of the next menses. The luteal phase analysis (N=889 cycles) excluded conception cycles. Luteal phase was analyzed continuously and with two dichotomous variables: “long” (≥ 18 days) and “short” (≤ 11 days)18.
Covariates
Covariates were chosen based on a review of literature19,20 of factors affecting menstrual cycle characteristics and CRP levels, including a previous analysis of CRP in this population14. Covariates were self-reported age, race, body mass index (BMI), and education, as well as lifestyle and reproductive factors including smoking, alcohol and caffeine consumption, exercise, and recent hormonal contraceptive use. Age was examined as a continuous variable. Six categories were chosen for race: Non-Hispanic Black, Native American, Asian, Non-Hispanic White, Hispanic/Latinx, Multi-racial/Unknown based on self-reported responses on the baseline questionnaire. Women with self-reported race of Native American (n=2) were included in the Multi-racial/Unknown category for analytic purposes. Self-described race is a social construct that could represent other unmeasured or uncontrolled factors that may be associated with CRP and menstrual cycle length and therefore was included in the analysis. A directed acyclic graph (DAG) depicting our informed assumptions regarding confounding variables is available in supplemental figure 1. Four categories were included for BMI: underweight (<18.5 kg/m2), normal (18.5 – 24.9 kg/m2), overweight (25–29.9 kg/m2), and obese (≥30 kg/m2). Education level was divided into three categories: less than high school or some college, 4-year degree, or graduate degree (Masters, Doctorate, and Professional). Use of hormonal contraceptives was categorized as within 1 or 2 months of the cycle start date or greater than two months from the cycle start date. Alcohol use, cigarette smoking, and caffeine consumption were queried on the baseline questionnaire. Alcohol consumption (weekly number of alcoholic beverages multiplied by the number of alcoholic drinks per episode when drinking) was divided into two categories (≤7 or >7 drinks per week) 21. Cigarette smoking was divided into three categories: current, former, or never. Caffeine consumption (number of cups of caffeinated coffee + number of other caffeinated drinks per day) was divided into four categories: <0.5, >0.5-<2, 2 to <3 and ≥ 3. Participants, each month, reported an average amount of vigorous exercise per week in the following categories: <1, 1–3, 4–7 hours (exercise was not collected on baseline questionnaire).
Statistical Analysis
For descriptive analyses, continuous variables were presented as mean (standard deviation) or median (interquartile range) depending on the distribution of the variable. Categorical variables were presented as frequency and percentages. Study participant characteristics were described in Table 1, stratified by categories of CRP and per woman, respectively. Of the women who were enrolled in TTC, 807 had a serum sample available for analysis of CRP. Figure 1 depicts flow diagram of study enrollment and cohort selection. The unadjusted dataset including 574 women and 1,839 cycles. The fully adjusted data set included 464 women and 1,554 cycles (Figure 1).
CRP was modeled in two ways after initial univariate analysis. First, given a significant right skew, CRP was natural log transformed and then modeled as a continuous linear variable. Using the restricted range for cycle length, the models were approximately linear. Second, we estimated a more flexible parameterization of the CRP and cycle length relationship. We selected four categories of CRP for analysis consistent with professional society guidelines (<1.0 mg/L, ≥1.0-<3.0 mg/L, ≥3.0 < 10.0 mg/L, and ≥10.0 mg/L). The referent group for the categorical analysis was low CRP (<1 mg/L).
Continuous menstrual cycle length (in days) was evaluated using a linear mixed model with a random intercept for each woman. To normalize residuals, model cycle lengths were limited to cycles between 22 and 36 days (N= 1,391 cycles). Conception cycles do not have a “length” and were therefore excluded. To normalize residuals, continuous follicular (N = 860 cycles) and luteal (N=690 cycles) phase analyses were limited to phase lengths between 5 and 45 days. Follicular phases from conception cycles were included, while again, luteal phases from conception cycles were excluded because the luteal phase does not have a “length” in a conception cycle. Cycle length was analyzed using two models: one minimally adjusted (age-only) and one fully adjusted multivariable model with the following covariates: age, race, education, BMI, time since oral contraceptive use, alcohol and caffeine consumption, smoking history, and exercise. For phase length outcomes, a sensitivity analysis was performed limited to ovulation predictor kits5.
Separate marginal logistic regression models with generalized estimated equations (GEE) with an exchangeable working correlation matrix were used to examine the association between CRP and long or short menstrual cycles compared to normal cycles (referent category)5. Sensitivity analyses were performed by weighting each cycle by the inverse of the number of contributed cycles22. Joint tests of significance were performed to control for type 1 error. Additional sensitivity analyses were performed. To address missing predictor and covariate data, multiple imputation by fully conditional specification with predictive mean matching was performed across 25 data sets. For clinical application, we ran phase length analyses limiting follicular and luteal phases to 7–30 days (in contrast to 5–45 days). Stata (version 16; StataCorp; College Station, TX) was used for statistical analysis.
Results
Most women in the cohort (70%) had cycles ranging from 26 to 34 days, were less than 35 years of age (68%), reported their race as Non-Hispanic white (77%), were well-educated with an earned graduate degree (62%), and had a normal BMI (61%) (Table 1). Most women also hadn’t used hormonal contraception in the last 3 months (82%) and had never smoked (77%). The median CRP level was 1.01 mg/L (IQR 2.35).
Menstrual Cycle Length
Continuous cycle length.
The estimated change in cycle length for a log-unit increase in CRP was small whether adjusted for age only (0.075 days) or with multivariable adjustment (0.064 days) (Table 2). When CRP was examined categorically, adjusting for age only, women with a CRP level of 3–10 mg/L had cycles that were 1 day longer (95% CI: 0.11, 1.90) which was slightly weakened with multivariable adjustment: 0.94 days (95% CI: −0.02, 1.9). Other levels of CRP were not associated with continuous cycle length.
Table 2.
Association CRP with Difference in Menstrual Cycle Lengtha, Long Menstrual Cycles, and Short Menstrual Cycles
| CRP (mg/L) | No. Cycles | Adjustedb Δ in Cycle Length (days) (95% CI) | Adjustedc Δ in Cycle Length (days) (95% CI) | ||
| CRP, per ln-unit increase | 1409 | 0.075 (−0.097, 0.247) | 0.064 (−0.132, 0.259) | ||
| <1 | 745 | Reference | |||
| ≥1– <3 | 392 | 0.56 (−0.12, 1.25) | 0.45 (−0.28, 1.17) | ||
| ≥ 3– <10 | 186 | 1.00 (0.11, 1.90) | 0.94 (−0.02, 1.90) | ||
| ≥ 10 | 86 | 1.03 (−0.21, 2.28) | 1.18 (−0.17, 2.52) | ||
| Joint Significance | 0.06 | 0.14 | |||
| Long Cycles (>35 days) | |||||
| aOR (95% CI) b | aOR (95% CI) c | aOR (95% CI) d | |||
| CRP, per ln-unit increase | 1.19 (1.03, 1.37) | 1.24 (1.04, 1.47) | 1.24 (1.05, 1.47) | ||
| <1 | 599 | Reference | |||
| ≥1– <3 | 328 | 1.28 (0.83, 1.99) | 1.41 (0.84, 2.37) | 1.20 (0.68, 2.14) | |
| ≥3– <10 | 156 | 1.04 (0.59, 1.88) | 1.23 (0.67, 2.26) | 1.24 (0.59, 2.63) | |
| ≥ 10 | 67 | 2.74 (1.49, 5.02) | 3.68 (1.67, 8.11) | 6.20 (2.53, 15.20) | |
| Joint Significance | 0.01 | 0.01 | 0.001 | ||
| Short Cycles (<25 days) | |||||
| aOR (95% CI) b | aOR (95% CI) c | aOR (95% CI) d | |||
| CRP, per ln-unit increase | 0.96 (0.86, 1.08) | 0.97 (0.84, 1.13) | 0.95 (0.78, 1.16) | ||
| <1 | 713 | Reference | |||
| ≥1– <3 | 374 | 0.70 (0.49, 1.01) | 0.80 (0.51, 1.24) | 0.76 (0.45, 1.28) | |
| ≥ 3– <10 | 176 | 0.64 (0.39, 1.05) | 0.74 (0.41, 1.35) | 0.59 (0.27, 1.31) | |
| ≥ 10 | 82 | 1.08 (0.61, 1.92) | 1.27 (0.61,2.65) | 1.70 (0.73, 3.94) | |
| Joint Significance | 0.10 | 0.46 | 0.13 | ||
To achieve normality of the model residuals, the continuous analysis was limited to cycles between 22 and 36 days long.
Adjusted for age
Adjusted for age, race, education, BMI, time since oral contraceptive use, alcohol, smoking, caffeine consumption, and exercise
Sensitivity analysis of the association of categorical CRP with long and short cycles weighted by the inverse of cycles contributed by each woman (fully adjusted)
Long and short cycles.
In all models the odds of long cycles were increased at the highest level of CRP exposure. In the fully adjusted model, a log-unit increase in CRP was associated with a 24% increase in the odds of long cycles (CI: 1.04, 1.47) (Table 2). In the fully adjusted model, a CRP level of greater than 10 mg/L was associated with over three times the odds of having long cycles (95% CI: 1.67, 8.11) (Table 2). Associations was stronger and less precise in the sensitivity analysis weighted by the inverse number of cycles contributed by each woman (Table 2). CRP was not associated with the odds of short cycles.
Follicular Phase Length
Continuous follicular phase length.
Higher levels of CRP were associated with longer follicular phases (Table 3). After multivariable adjustment, a log-unit increase in CRP was associated with a one-third of a day increase in follicular phase length (0.33, 95% CI: 0.06, 0.60). In the multivariable model, CRP levels of 1- <3 mg/L, 3-<10 and >10 mg/L were associated with follicular phases that were 1.2, 1.3, and 1.7 days longer, respectively (95% CI: 0.34, 95% CI: 0.15, 2.37; 95% CI 0.23, 3.09). The sensitivity analysis based on the OPK alone had a smaller sample size and showed a slightly smaller effect size for the >10 mg/L CRP group, other results were similar (Table 3).
Table 3.
Association of Categorical CRP with Follicular Phase Lengtha, Long Follicular Phase, and Short Follicular Phase
| CRP (mg/L) | No. Cycles | Adjusted b Δ Follicular Phase Length, days (95% CI) | Adjusted c Δ in Follicular Phase Length, days (95% CI) | Adjusted d Δ in Follicular Phase Length, days (95% CI) | |
| CRP, per ln-unit increase | 860 | 0.35 (0.11, 0.59) | 0.33 (0.06, 0.60) | 0.40 (0.07, 0.72) | |
| <1 | 446 | Reference | |||
| ≥1– <3 | 245 | 1.40 (0.61, 2.19) | 1.17 (0.34, 2.00) | 1.36 (0.37, 2.36) | |
| ≥ 3– <10 | 104 | 1.09 (0.04, 2.15) | 1.26 (0.15, 2.37) | 1.76 (0.36, 3.17) | |
| ≥ 10 | 65 | 1.68 (0.36, 3.00) | 1.66 (0.23, 3.09) | 1.64 (−0.05, 3.33) | |
| Joint Significance | 0.001 | 0.001 | 0.01 | ||
| Long Follicular Phase | |||||
| aOR (95% CI) b | aOR (95% CI) c | aOR (95% CI) d | aOR (95% CI) e | ||
| CRP, per ln-unit increase | 785 | 1.18 (1.04, 1.34) | 1.16 (1.00, 1.36) | 1.20 (0.97, 1.48) | 1.29 (1.08, 1.55) |
| <1 | 393 | Reference | |||
| ≥1– <3 | 235 | 1.58 (1.05, 2.40) | 1.40 (0.86, 2.29) | 2.05 (1.08, 3.88) | 1.68 (0.92, 3.07) |
| ≥ 3– <10 | 97 | 1.36 (0.74, 2.49) | 1.61 (0.81, 3.21) | 2.64 (0.99, 7.04) | 1.89 (0.87, 4.11) |
| ≥ 10 | 60 | 2.53 (1.36, 4.70) | 2.23 (1.05, 4.74) | 2.00 (0.72, 5.55) | 2.94 (1.22, 7.11) |
| Joint Significance | 0.01 | 0.17 | 0.09 | 0.07 | |
| Short Follicular Phase | |||||
| aOR (95% CI) b | aOR (95% CI) c | aOR (95% CI) d | aOR (95% CI) e | ||
| CRP, per ln-unit increase | 662 | 0.91 (0.77, 1.07) | 0.85 (0.65, 1.11) | 0.92 (0.68, 1.23) | 0.93 (0.73, 1.18) |
| <1 | 362 | Reference | |||
| ≥1– <3 | 178 | 0.45(0.23, 0.91) | 0.24 (0.11, 0.54) | 0.29 (0.08, 1.04) | 0.38 (0.18, 0.82) |
| ≥ 3– <10 | 78 | 0.58 (0.26, 1.29) | 0.35 (0.10, 1.22) | 0.38 (0.10, 1.53) | 0.43 (0.13, 1.49) |
| ≥ 10 | 44 | 0.65 (0.27, 1.55) | 0.46 (0.14, 1.46) | 0.45 (0.04, 4.67) | 0.61 (0.20, 1.83) |
| Joint Significance | 0.09 | 0.007 | 0.20 | 0.08 | |
To achieve normality of the model residuals, the continuous analysis was limited to phases between 5 and 45 days long. Results are displayed as change in phase in days for a given CRP category, compared to the reference group.
Adjusted for age
Adjusted for age, race, education, BMI, time since oral contraceptive use, alcohol, smoking, caffeine consumption, and exercise
Sensitivity analysis of follicular phase length with ovulation determined by OPK (Cycle N=347)
Sensitivity analysis the association of categorical CRP with long and short cycles weighted by the inverse of follicular phases contributed by each woman
Long follicular phase.
In the multivariable model, a log-unit increase in CRP was associated with an 16% increase in the odds of a long follicular phase (95% CI: 1.00, 1.36) (Table 3). When examined categorically, the odds of a long follicular phase were higher for all levels of CRP. In the multivariable model, CRP levels of at least 10 mg/L were associated with twice the odds of long follicular phase (OR (95% CI): 2.23 (1.05, 4.74)) (Table 3). The odds ratios for lower levels of CRP were greater than 1, but with wide confidence intervals. In a sensitivity analysis limited to the OPK data, the point estimates were stronger for the lower levels of CRP and similar for the highest level of CRP (Table 3). In the sensitivity analysis that included weighting by the inverse of the number of follicular phases contributed, the results were similar to the unweighted multivariable results (Table 3).
Short follicular phase.
In the multivariable model, increasing CRP tended to be associated with a decreased odds of a short follicular phase (aOR (95% CI): 0.85 (0.65, 1.11)) (Table 3). When modeled categorically, the odds of a short follicular phase were reduced across all categories of CRP but were most precise in women with CRP 1 between 3 mg/L (aOR (95% CI): 0.24 (0.11, 0.54)). Point estimates were similar and our interpretation was unchanged for the sensitivity analyses limited to OPK data and when weighted by the inverse number of cycles contributed by each woman (Table 3).
Luteal Phase Length
Continuous Luteal Phase.
In the multivariable model, higher levels of CRP (categorical or continuous) were not associated with changes in continuous luteal phase length. In a sensitivity analysis limited to ovulation prediction by OPK, the results were unchanged (Table 4).
Table 4.
Association of Categorical CRP with Luteal Phase Lengtha, Long Luteal Phase, and Short Luteal Phase
| CRP (mg/L) | No. Cycles | Adjusted b Δ Luteal Phase Length, days (95% CI) | Adjusted c Δ in Luteal Phase Length, days (95% CI) | Adjusted d Δ in Luteal Phase Length, days (95% CI) | |
| CRP, per ln-unit increase | 690 | 0.15 (−0.11, 0.40) | 0.24 (−0.09, 0.57) | 0.37(−0.13, 0.88) | |
| <1 | 353 | Reference | |||
| ≥1– <3 | 201 | 0.21 (−0.65, 1.07) | 0.16 (−0.87, 1.20) | 1.22 (−0.32, 2.76) | |
| ≥ 3– <10 | 80 | 0.13 (−1.06, 1.33) | −0.19 (−1.68, 1.29) | 0.44 (−1.87, 2.75) | |
| ≥ 10 | 56 | 0.17 (−1.19, 1.53) | 0.76 (−0.97, 2.49) | 1.14 (−1.50, 3.78) | |
| Joint Significance | 0.97 | 0.80 | 0.46 | ||
| Long Luteal Phase | |||||
| aOR (95% CI) b | aOR (95% CI) c | aOR (95% CI) d | aOR (95% CI) e | ||
| CRP, per ln-unit increase | 551 | 1.17 (0.96, 1.43) | 1.26 (0.99, 1.61) | 1.26 (0.91, 1.74) | 1.32 (1.02, 1.69) |
| <1 | 282 | Reference | |||
| ≥1– <3 | 168 | 1.17 (0.61, 2.27) | 1.12 (0.49, 2.53) | 2.03 (0.77, 5.37) | 1.25 (0.52, 3.02) |
| ≥ 3– <10 | 58 | 1.35 (0.54, 3.37) | 1.21(0.32, 4.53) | 3.20 (0.52, 19.6) | 1.87 (0.53, 6.56) |
| ≥ 10 | 43 | 1.62 (0.55, 4.78) | 2.03 (0.59, 7.06) | 0.84 (0.07,10.03) | 2.72 (0.77, 9.58) |
| Joint Significance | 0.79 | 0.74 | 0.38 | 0.38 | |
| Short Luteal Phase | |||||
| aOR (95% CI) b | aOR (95% CI) c | aOR (95% CI) d | aOR (95% CI) e | ||
| CRP, per ln-unit increase | 635 | 1.08 (0.94, 1.25) | 1.06 (0.88, 1.27) | 1.11 (0.83, 1.50) | 0.99 (0.79, 1.23) |
| <1 | 326 | Reference | |||
| ≥1– <3 | 185 | 1.03 (0.62, 1.70) | 0.79 (0.42, 1.50) | 0.86 (0.37, 2.28) | 0.74 (0.37, 1.47) |
| ≥ 3– <10 | 74 | 1.28 (0.65, 2.52) | 1.48 (0.67, 3.29) | 2.22 (0.60, 8.23) | 1.10 (0.48, 2.55) |
| ≥ 10 | 50 | 1.63 (0.83, 3.19) | 1.47 (0.61, 3.56) | 0.95 (0.22, 4.15) | 1.15 (0.42, 3.16) |
| Joint Significance | 0.51 | 0.38 | 0.59 | 0.71 | |
To achieve normality of the model residuals, the continuous analysis was limited to phases between 5 and 45 days long. Results are displayed as change in phase in days for a given CRP category, compared to the reference group.
Adjusted for age
Adjusted for age, race, education, BMI, time since oral contraceptive use, alcohol, smoking, caffeine consumption, and exercise
Sensitivity analysis of luteal phase length with ovulation determined by OPK (Cycle N=326)
Sensitivity analysis the association of categorical CRP with long luteal phase weighted by the inverse of cycles contributed by each woman
Long Luteal Phase.
In the multivariable model, the odds of long luteal phase were not associated with continuous or categorical CRP. In a sensitivity analysis limited to ovulation prediction with OPK data and when weighting by the inverse of the number of luteal phases contributed, the point estimates and interpretations were unchanged (Table 4).
Short Luteal Phase.
In the multivariable model, the odds of short luteal phase were not associated with continuous or categorical CRP. In a sensitivity analysis limited to ovulation prediction with OPK data and when weighting by the inverse of the number of luteal phases contributed, the point estimates and interpretations were unchanged (Table 4).
Sensitivity Analyses.
We fit the multivariate models following multiple imputation, which allowed us to include missing covariates. The results presented in tables 2–4 were similar to results estimated with multiply imputed data. Overall interpretations were unchanged from the previously reported results (supplemental tables 3–5). Additionally, we examined whether results changed when limiting the phase length analyses to 7–30 days. Similarly, we found no meaningful difference in the associations (supplemental tables 1–2).
Comment
Principal Findings
In our cohort of women aged 30–44 attempting to conceive, high levels of CRP (>10 mg/L) were associated with longer menstrual cycles and longer follicular phases. For the most part, results were consistent when limited to cycles where OPKs were used. Mild elevations in CRP (1–3 mg/L) were inconsistently associated with longer follicular phases and higher odds of a long follicular phase, but there were no associations for more moderate levels of CRP (3–10 mg/L), such that there was no dose response association across CRP levels. CRP was not associated with luteal phase length.
Results in the Context of What is Known
Local inflammation plays an integral role in normal ovarian physiology during folliculogenesis, ovulation and subsequent tissue remodeling. It therefore remains unclear if our findings reflect a pathological association between inflammation and ovarian physiology, or one of normative follicular dynamics. In one study of antral follicular waves by Clancy et al., three antral follicular waves were associated with higher CRP levels than two waves, suggesting greater tissue remodeling and systemic inflammation in women with three waves. Women with three waves also had a longer follicular phase and higher amplitude fluctuations in the follicular phase23. Our results were in concordance with these findings, demonstrating that women with high levels of CRP >10 mg/L, a marker of high levels of inflammation, had longer follicular phases.
The LH surge induces the release of numerous inflammatory mediators including prostaglandins, which promote angiogenesis, hyperemia and activation of collagenases that degrade a follicle’s connective tissue leading to ovulation9. Because CRP is released in the inflammatory response and ovulation is an inflammatory process, several studies have sought to determine if CRP changes across the menstrual cycle. In a study of 36 white women aged 20–32 with a normal BMI and regular menstrual cycles, CRP did not vary at different points in the cycle. Estrogen and progesterone were not correlated with CRP level, and CRP did not increase around the time of ovulation as might be expected24. A study that compared levels of CRP in 18 women with ovulatory versus anovulatory cycles over three time points in the cycle (days 2–3, 12–13, and 23–24) also found no differences in CRP levels within groups across the menstrual cycle, but the women with ovulatory cycles had higher CRP levels in the periovulatory phase (days 12–13) than the women with anovulatory cycles suggesting an increase in CRP with ovulation25.
A larger prospective study of 259 women aged 18–44 with a normal BMI found that CRP levels did vary significantly across the cycle (P<0.001). CRP levels were highest during menses and lowest on the day of ovulation (in contrast with the above studies), followed by an increase during the luteal phase. Estradiol was inversely associated with CRP, with a 10-fold increase in estradiol correlating to a 24.3% decrease in CRP (95% CI:19.3 – 29.0), consistent with estradiol’s anti-inflammatory effects. A 10-fold increase in luteal progesterone was associated with a 19.4% increase in CRP (95% CI: 8.4 – 31.5), which the authors noted was in conflict with progesterone’s overall anti-inflammatory effects26. Wander et al. had similar results, with a 10-fold increase in estradiol associated with a 29% decrease in CRP, and a 10-fold increase in progesterone associated with a 23% increase in CRP. Menses had a nonsignificant association with increased CRP. This study was small (n=8) but subjects were sampled frequently with 12 testing days across the menstrual cycle for 11 cycles.
Inflammation is also associated with conditions such as obesity, insulin resistance, and hyperandrogenemia, and has been proposed to be an underlying mechanism of PCOS9. One meta-analysis found that patients with PCOS had a 96% increase in CRP levels over controls27. Our findings of an association between high (>10 mg/L) CRP levels and longer follicular phase and cycle length may suggest that the patients with the highest levels of CRP are more likely to have an aberrant inflammatory response, potential ovulatory dysfunction, and longer menstrual cycles.
Clinical Implications
Our findings bring into question whether inflammation or underlying PCOS is responsible for variation in menstrual cycle length. Our results suggest that chronic inflammation may interfere with either the hypothalamic-pituitary-ovarian axis leading to deceleration or delay in the rate of follicular development. If this is the case, methods to reduce inflammation could restore normal follicular phase length. Alternatively, chronic inflammation may interfere with the process leading to ovulation, perhaps through modulation of the LH surge. This assumes that the relationship is causal. Alternatively, it may be that there are women with undiagnosed PCOS in this cohort, who are more likely to have long follicular and menstrual cycle lengths and elevated levels of CRP. As a woman ages, CRP levels increase and menstrual cycle length decreases 9,27. As we have shown that high levels of CRP are associated with longer menstrual cycle length independent of age, the observed changes in menstrual cycle length as a woman ages, cannot be attributed to increased inflammation.
Research Implications
Further studies are required to characterize the mechanism and could either exclude patients with PCOS to control for the known inflammation caused by the condition and its associated inflammation or focus solely on patients with PCOS to better characterize the relationship between CRP and menstrual irregularities in this population.
Strengths and Limitations
Our study has several strengths. The cohort was prospective, with a large sample size, and included menstrual cycle length with ovulation data, facilitating calculation of follicular and luteal phase lengths, respectively. Women were recruited from the community in the Triangle area of North Carolina28.
This study has several limitations. The TTC questionnaire did not ask participants whether they had a history of autoimmune disease or recent infection, which could affect measured CRP levels. Additionally, CRP levels were only collected in the early follicular phase which limits our ability to evaluate the role of CRP in different phases of the menstrual cycle. Ovulation information was only available for a subset of patients who used ovulation predictor kits. We acknowledge that CRP is a single, non-specific marker for systemic inflammation, which could result in misclassification. In addition, it is possible that some women in the cohort had undiagnosed PCOS, which could affect the relationship between CRP and menstrual cycle length. Lastly, the study participants were mainly white and well-educated, which could limit generalizability of results to other populations.
Conclusions
In our cohort of women aged 30–44 attempting to conceive naturally, high levels of CRP (>10 mg/L) were associated with increased follicular phase length and the odds of long follicular phase.
Supplementary Material
Supplemental Table 1. Association of Categorical CRP with Follicular Phase Lengtha, Long Follicular Phase, and Short Follicular Phase (Phase length 7–30 days)
Supplemental Table 2. Association of Categorical CRP with Luteal Phase Lengtha, Long Luteal Phase, and Short Luteal Phase (Phase length 7–30 days)
Supplemental Figure 1. Directed acyclic graph (DAG)
Supplemental Table 3. Association CRP with Difference in Menstrual Cycle Lengtha (as a continuous and categorical variable), Long Menstrual Cycles, and Short Menstrual Cycles (multiple imputation)
Supplemental Table 4. Association of Categorical CRP with Follicular Phase Lengtha, Long Follicular Phase, and Short Follicular Phase (multiple imputation)
Supplemental Table 5. Association of Categorical CRP with Luteal Phase Lengtha, Long Luteal Phase, and Short Luteal Phase (multiple imputation)
Figure 2.
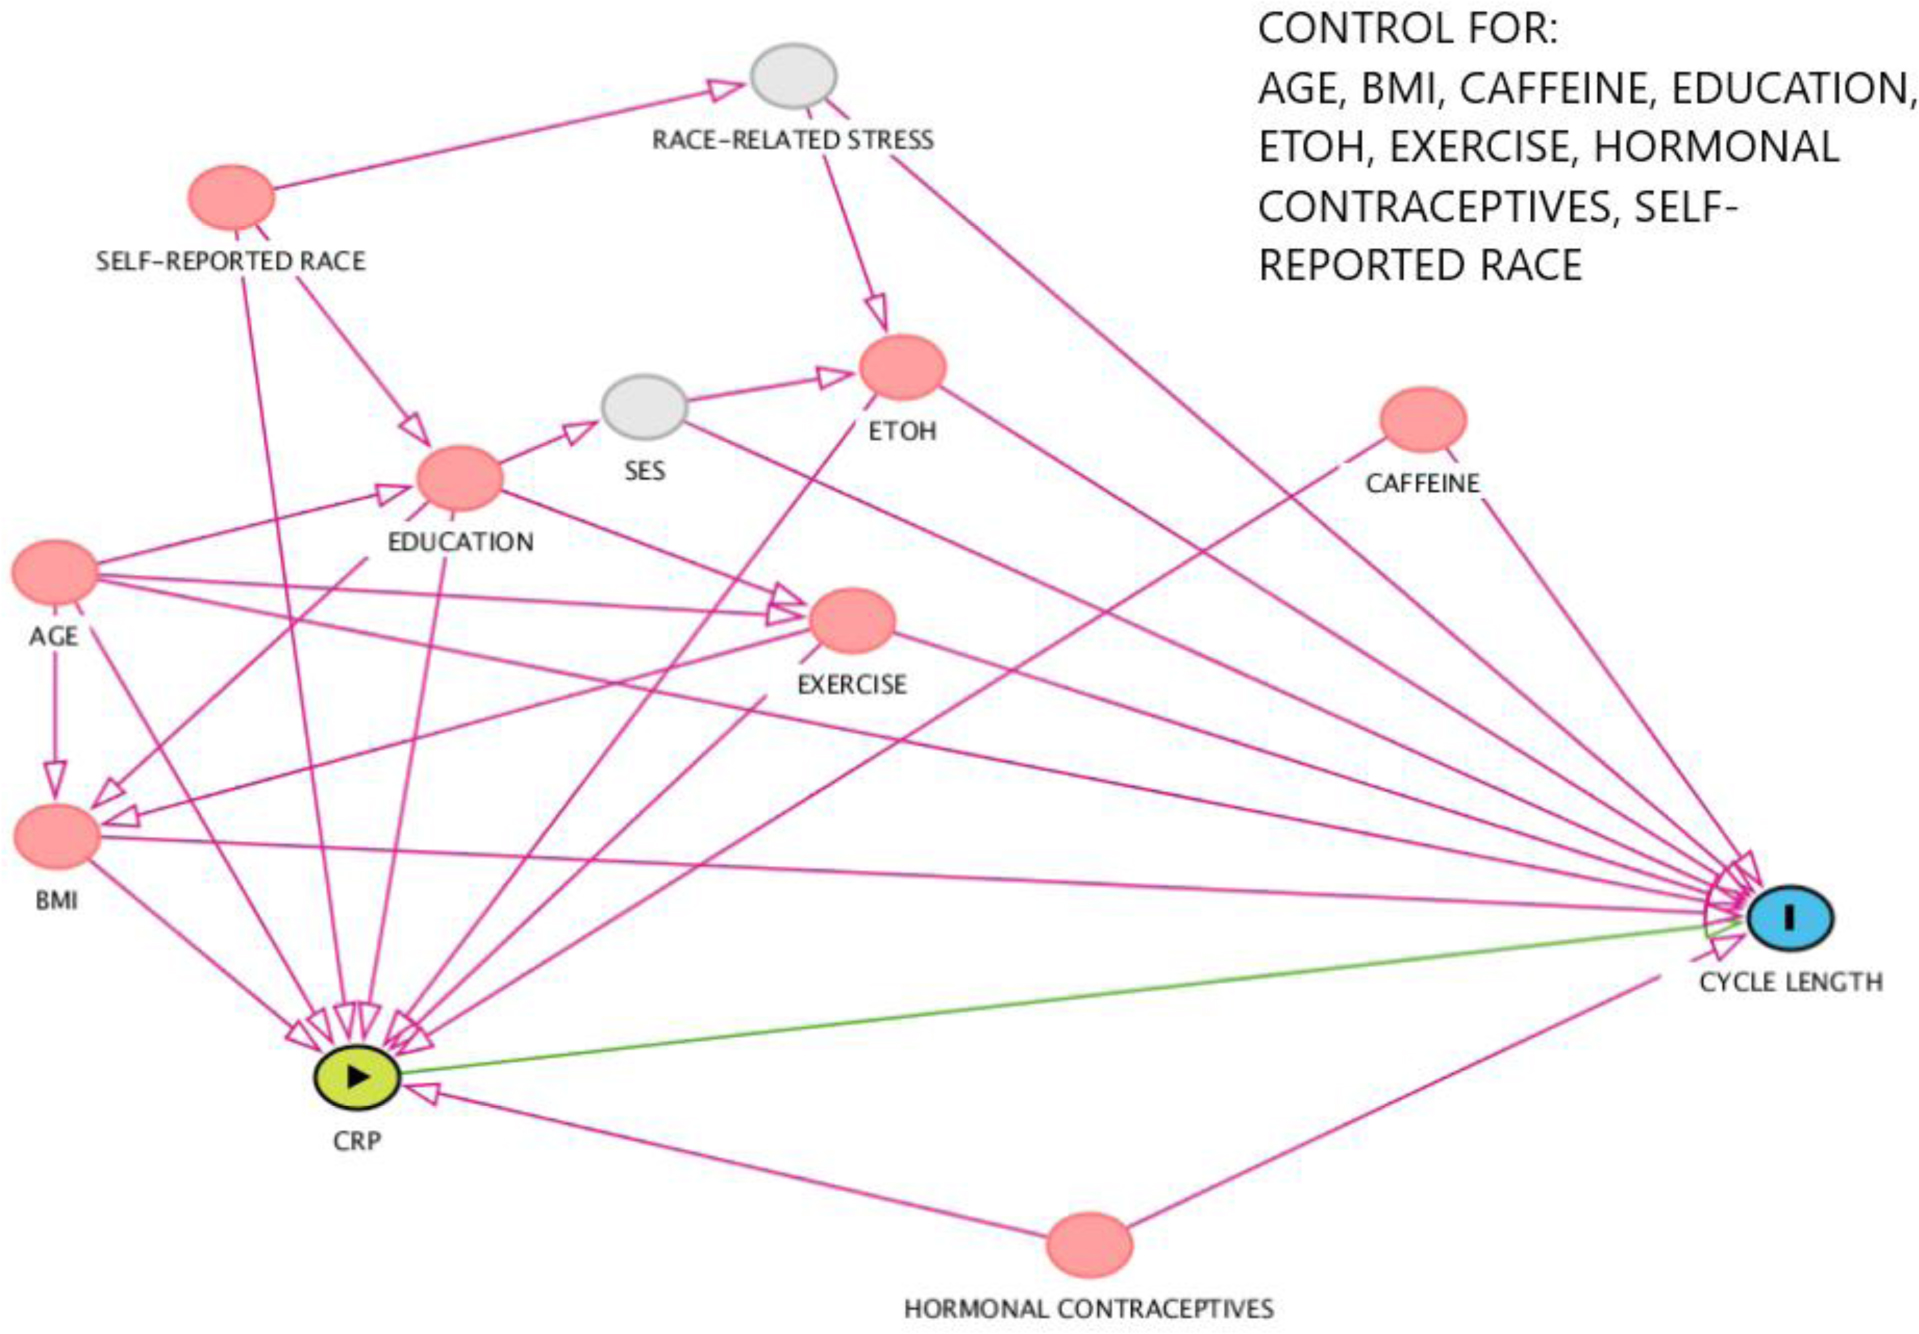
Directed acyclic graph (DAG) demonstrating covariate selection.
AJOG at a Glance:
We examined the association between low-grade systemic inflammation, as measured by high sensitivity C-Reactive Protein (CRP) levels, and menstrual cycle characteristics.
CRP >10 mg/L was associated with over three times the odds of long cycles, and over two times the odds of having a long follicular phase.
Systemic inflammation, as measured by elevated CRP levels may lead to long menstrual cycles and long follicular phases.
Acknowledgments
This research was supported in part by the Intramural Research Program of the NIH, National Institute of Environmental Health Sciences under project number Z01ES103333. Support for this investigation was provided in part by the Office of Research on Women’s Health (ORWH), NIH.
Grants/Fellowships:
NIH/NICHD (R21 HD060229-01 and R01 HD067683-01) and Intramural Research Program of the National Institute of Environmental Health Sciences (Z01ES103333). Support for this investigation was provided in part by the Office of Research on Women’s Health (ORWH), NIH.
Footnotes
Disclosure Summary: BH has nothing to declare. AMJ has nothing to declare. AL has nothing to declare. AZS had financial support from NICHD/NIH for the submitted work; no financial relationships with any organizations that might have an interest in the submitted work in the previous three years; no other relationships or activities that could appear to have influenced the submitted work. AZS has previously consulted for Prima-Temp and Seikagaku Corporation outside the submitted work.
Data Availability
Some or all datasets generated during and/or analyzed during the current study are not publicly available but are available from the senior author on reasonable request.
References
- 1.ACOG Committee Opinion No. 651: Menstruation in Girls and Adolescents: Using the Menstrual Cycle as a Vital Sign. Obstet Gynecol. 2015;126(6):e143–e146. [DOI] [PubMed] [Google Scholar]
- 2.Wesselink AK, Wise LA, Hatch EE, Rothman KJ, Mikkelsen EM, Stanford JB, et al. Menstrual cycle characteristics and fecundability in a North American preconception cohort. Ann Epidemiol. 2016;26(7):482–487 e481. [DOI] [PMC free article] [PubMed] [Google Scholar]
- 3.Wise LA, Mikkelsen EM, Rothman KJ, Riis AH, Sorensen HT, Huybrechts KF, et al. A prospective cohort study of menstrual characteristics and time to pregnancy. Am J Epidemiol. 2011;174(6):701–709. [DOI] [PMC free article] [PubMed] [Google Scholar]
- 4.Gizzo S, Andrisani A, Noventa M, Quaranta M, Esposito F, Armanini D, et al. Menstrual cycle length: a surrogate measure of reproductive health capable of improving the accuracy of biochemical/sonographical ovarian reserve test in estimating the reproductive chances of women referred to ART. Reprod Biol Endocrinol. 2015;13:28. [DOI] [PMC free article] [PubMed] [Google Scholar]
- 5.Harris BS, Steiner AZ, Jukic AM. Ovarian Reserve Biomarkers and Menstrual Cycle Length in a Prospective Cohort Study. J Clin Endocrinol Metab. 2021. [DOI] [PMC free article] [PubMed] [Google Scholar]
- 6.Jensen TK, Scheike T, Keiding N, Schaumburg I, Grandjean P. Fecundability in relation to body mass and menstrual cycle patterns. Epidemiology. 1999;10(4):422–428. [DOI] [PubMed] [Google Scholar]
- 7.Burgers JA, Fong SL, Louwers YV, Valkenburg O, de Jong FH, Fauser BC, et al. Oligoovulatory and anovulatory cycles in women with polycystic ovary syndrome (PCOS): what’s the difference? J Clin Endocrinol Metab. 2010;95(12):E485–489. [DOI] [PubMed] [Google Scholar]
- 8.Norman RJ, Dewailly D, Legro RS, Hickey TE. Polycystic ovary syndrome. The Lancet. 2007;370(9588):685–697. [DOI] [PubMed] [Google Scholar]
- 9.Boots CE, Jungheim ES. Inflammation and Human Ovarian Follicular Dynamics. Semin Reprod Med. 2015;33(4):270–275. [DOI] [PMC free article] [PubMed] [Google Scholar]
- 10.Bray C, Bell LN, Liang H, Haykal R, Kaiksow F, Mazza JJ, et al. Erythrocyte Sedimentation Rate and C-reactive Protein Measurements and Their Relevance in Clinical Medicine. WMJ. 2016;115(6):317–321. [PubMed] [Google Scholar]
- 11.Luan YY, Yao YM. The Clinical Significance and Potential Role of C-Reactive Protein in Chronic Inflammatory and Neurodegenerative Diseases. Front Immunol. 2018;9:1302. [DOI] [PMC free article] [PubMed] [Google Scholar]
- 12.Steiner AZ, Pritchard D, Stanczyk FZ, Kesner JS, Meadows JW, Herring AH, et al. Association Between Biomarkers of Ovarian Reserve and Infertility Among Older Women of Reproductive Age. JAMA. 2017;318(14):1367–1376. [DOI] [PMC free article] [PubMed] [Google Scholar]
- 13.Doumatey AP, Zhou J, Adeyemo A, Rotimi C. High sensitivity C-reactive protein (Hs-CRP) remains highly stable in long-term archived human serum. Clin Biochem. 2014;47(4–5):315–318. [DOI] [PMC free article] [PubMed] [Google Scholar]
- 14.Jukic AMWC, Mumford SL, Steiner AZ. Inflammation and conception in a prospective time-to-pregnancy cohort. Epidemiology, in press. [DOI] [PMC free article] [PubMed] [Google Scholar]
- 15.Jukic AMZ, Wilcox AJ, McConnaughey DR, Weinberg CR, Steiner AZ. 25-Hydroxyvitamin D and Long Menstrual Cycles in a Prospective Cohort Study. Epidemiology. 2018;29(3):388–396. [DOI] [PMC free article] [PubMed] [Google Scholar]
- 16.Jukic AMZ, Padiyara P, Bracken MB, McConnaughey DR, Steiner AZ. Analgesic use at ovulation and implantation and human fertility. Am J Obstet Gynecol. 2020;222(5):476 e471–476 e411. [DOI] [PMC free article] [PubMed] [Google Scholar]
- 17.Lenton EA, Landgren BM, Sexton L, Harper R. Normal variation in the length of the follicular phase of the menstrual cycle: effect of chronological age. Br J Obstet Gynaecol. 1984;91(7):681–684. [DOI] [PubMed] [Google Scholar]
- 18.Lenton EA, Landgren BM, Sexton L. Normal variation in the length of the luteal phase of the menstrual cycle: identification of the short luteal phase. Br J Obstet Gynaecol. 1984;91(7):685–689. [DOI] [PubMed] [Google Scholar]
- 19.Windham GC, Elkin E, Fenster L, Waller K, Anderson M, Mitchell PR, et al. Ovarian hormones in premenopausal women: variation by demographic, reproductive and menstrual cycle characteristics. Epidemiology. 2002;13(6):675–684. [DOI] [PubMed] [Google Scholar]
- 20.Homan GF, Davies M, Norman R. The impact of lifestyle factors on reproductive performance in the general population and those undergoing infertility treatment: a review. Hum Reprod Update. 2007;13(3):209–223. [DOI] [PubMed] [Google Scholar]
- 21.Force USPST, Curry SJ, Krist AH, Owens DK, Barry MJ, Caughey AB, et al. Screening and Behavioral Counseling Interventions to Reduce Unhealthy Alcohol Use in Adolescents and Adults: US Preventive Services Task Force Recommendation Statement. JAMA. 2018;320(18):1899–1909. [DOI] [PubMed] [Google Scholar]
- 22.Williamson JM, Datta S, Satten GA. Marginal analyses of clustered data when cluster size is informative. Biometrics. 2003;59(1):36–42. [DOI] [PubMed] [Google Scholar]
- 23.Clancy KB, Baerwald AR, Pierson RA. Systemic inflammation is associated with ovarian follicular dynamics during the human menstrual cycle. PLoS One. 2013;8(5):e64807. [DOI] [PMC free article] [PubMed] [Google Scholar]
- 24.Wunder DM, Yared M, Bersinger NA, Widmer D, Kretschmer R, Birkhauser MH. Serum leptin and C-reactive protein levels in the physiological spontaneous menstrual cycle in reproductive age women. Eur J Endocrinol. 2006;155(1):137–142. [DOI] [PubMed] [Google Scholar]
- 25.Capobianco G, de Muro P, Cherchi GM, Formato M, Lepedda AJ, Cigliano A, et al. Plasma levels of C-reactive protein, leptin and glycosaminoglycans during spontaneous menstrual cycle: differences between ovulatory and anovulatory cycles. Arch Gynecol Obstet. 2010;282(2):207–213. [DOI] [PubMed] [Google Scholar]
- 26.Gaskins AJ, Wilchesky M, Mumford SL, Whitcomb BW, Browne RW, Wactawski-Wende J, et al. Endogenous reproductive hormones and C-reactive protein across the menstrual cycle: the BioCycle Study. Am J Epidemiol. 2012;175(5):423–431. [DOI] [PMC free article] [PubMed] [Google Scholar]
- 27.Escobar-Morreale HF, Luque-Ramirez M, Gonzalez F. Circulating inflammatory markers in polycystic ovary syndrome: a systematic review and metaanalysis. Fertil Steril. 2011;95(3):1048–1058 e1041-1042. [DOI] [PMC free article] [PubMed] [Google Scholar]
- 28.Steiner AZ, Long DL, Herring AH, Kesner JS, Meadows JW, Baird DD. Urinary follicle-stimulating hormone as a measure of natural fertility in a community cohort. Reprod Sci. 2013;20(5):549–556. [DOI] [PMC free article] [PubMed] [Google Scholar]
Associated Data
This section collects any data citations, data availability statements, or supplementary materials included in this article.
Supplementary Materials
Supplemental Table 1. Association of Categorical CRP with Follicular Phase Lengtha, Long Follicular Phase, and Short Follicular Phase (Phase length 7–30 days)
Supplemental Table 2. Association of Categorical CRP with Luteal Phase Lengtha, Long Luteal Phase, and Short Luteal Phase (Phase length 7–30 days)
Supplemental Figure 1. Directed acyclic graph (DAG)
Supplemental Table 3. Association CRP with Difference in Menstrual Cycle Lengtha (as a continuous and categorical variable), Long Menstrual Cycles, and Short Menstrual Cycles (multiple imputation)
Supplemental Table 4. Association of Categorical CRP with Follicular Phase Lengtha, Long Follicular Phase, and Short Follicular Phase (multiple imputation)
Supplemental Table 5. Association of Categorical CRP with Luteal Phase Lengtha, Long Luteal Phase, and Short Luteal Phase (multiple imputation)
Data Availability Statement
Some or all datasets generated during and/or analyzed during the current study are not publicly available but are available from the senior author on reasonable request.