

Abstract
Recent studies have supported the presence and varying nature of craniofacial sexual dimorphism (SD) from the very first stages of ontogeny. But the exact patterns of between‐sex differences during the first years of life remain obscure despite the importance of these data for craniofacial surgery treatment and forensic studies. Our study employs a large dataset of clinical computed tomography scans of individuals of East Slavonic descent from birth to 5 years of age (247 males and 184 females) to address the pattern of age‐related between‐sex differences in 22 linear measurements of the mid‐face. At birth, SD of most dimensions is low, but it increases significantly during the first year of life. The level of SD of most variables fluctuates in both directions during the second year and peaks during the third and fourth years of life. During the sixth year, SD of about half of the variables markedly decreases. In adults, SD of all variables increases, but to a very different extent: from 2% to 13%. Most sexually dimorphic features of the facial skeleton begin to develop early in postnatal ontogeny and then may or may not become accentuated during puberty. Importantly, the patterns of age changes in the level of SD differ strongly between various dimensions, and so cannot be expressed by a single value for the whole face. Additionally, the level of SD for a particular variable is not ontogenetically stable during the first years of life.
Keywords: computed tomography, facial skeleton, human ontogeny, midfacial growth patterns, sex differences, sexual dimorphism
Short abstract
Our study employs a large dataset of clinical computed tomography scans of individuals 0–5‐years‐old to address the pattern of age‐related between‐sex differences in the mid‐face. We find that most sexually dimorphic features begin to develop early in postnatal ontogeny and then may or may not become accentuated during puberty. The patterns of age changes in the level of sexual dimorphism (SD) differ between various dimensions; neither the level of SD for a particular variable is ontogenetically stable during the first years of life
1. INTRODUCTION
The problem of the ontogenetic origin of sexual dimorphism (SD) in mid‐facial form has been studied intensively during the last decades (Broadbent et al., 1975; Bulygina et al., 2006; Dean et al., 2000; Farkas, Posnick, & Hreczko, 1992; Farkas et al., 1992a, 1992b; Humphrey, 1998; Likus et al., 2014; Matthews, 2018; Riolo et al., 1974; Smith et al., 2021; Tutkuviene et al., 2016). Though the bulk of this research was concerned with sex‐specific growth patterns in older children and adolescents in connection to the pubertal growth spurt, it has gradually become clear that SD begins to play an important role in craniofacial variation well before puberty (Delye et al., 2015; Humphrey, 1998; Schutkowski, 1993; Ursi et al., 1993; Viðarsdottir, 1999; Wheat, 2015). Numerous studies on living subjects (anthropometry and three‐dimensional [3D] surface scanning) have shown that males and females differ from the very beginning of postnatal ontogeny in terms of both mean values and rates of growth, and those differences vary between traits and ages (Farkas, Posnick, & Hreczko, 1992; Farkas et al., 1992a, 1992b; Kesterke et al., 2016; Matthews, 2018; Matthews et al., 2016; Meulstee et al., 2020; Tutkuviene et al., 2016; White, 2005). A number of cephalometric and craniometric studies arrived at very similar conclusions concerning the early onset of SD, at least for some traits (Bulygina et al., 2006; Gonzalez, 2012; Humphrey, 1998; Viðarsdottir, 1999). Turning to computed tomography (CT)‐based studies, Delye et al. (2015) have found a significant effect of sex in all the studied linear and three‐dimensional measurements of the skull as well as in bone density for all age groups from birth to 20 years. Similar conclusions were recently arrived at by Niemann et al. (2021). A survey of a large sample of older children (5–18 years) was carried out by Teodoru‐Raghina et al. (2017). They reported significant between‐sex differences in cranial vault measurements for 8–11 and 16–18‐year‐olds but less prominent dimorphism for facial measurements and noted the non‐linearity of the development of SD (e.g. lower sexing accuracy for the 12–15 years' age interval probably as a result of differences in the development of boys and girls during puberty). Another study based on the analysis of magnetic resonance imaging datasets (Jeffery et al., 2022) revealed size‐dependent sexual differences in craniofacial variation well before puberty.
The studies cited above suffer from a strong under‐representation of the youngest age cohorts, namely from birth to 5 years of age, an important gap in our knowledge of the ontogeny of sexually dimorphic cranial features. From a theoretical point of view, the first months and years of life are the time of the most rapid growth changes that produce the main inter‐ and intra‐population differences in craniofacial form (Bulygina et al., 2006; Evteev et al., 2018; Viðarsdottir, 1999). On the other hand, a substantial body of work has been dedicated to establishing normative values for craniofacial traits in infants who are essential for treatment planning and evaluation of results in medical practice (Bjork, 1964; Brief et al., 2000; Broadbent et al., 1975; Delye et al., 2015; Enlow, 1975; Escaravage & Dutton, 2013; Lang, 1989; Likus et al., 2014; Pool et al., 2016; Waitzman et al., 1992b). Last but not least, knowledge of the early ontogeny of craniofacial SD is important for biological and forensic anthropology with respect to the problem of sexing non‐adult individuals (see Schaefer et al., 2009). Although craniofacial traits are thought to be less useful than postcranial and dental (Marino et al., 2019; Stull et al., 2017; Viciano et al., 2021), this assumption remains to be tested (Schutkowski, 1993).
It should not be overlooked that SD in the face of living infants has recently been thoroughly studied using 3D surface scanning of soft tissue (Kesterke et al., 2016; Matthews, 2018; Matthews et al., 2016; White, 2005). These studies provide an important theoretical framework for the present study, but their results cannot be directly employed for assessing the variation of cranial structures due to the considerable role of soft‐tissue variation in shaping the infant's face.
To date, SD in the infant craniofacial skeleton has been addressed in a few studies employing archaeological or forensic cranial samples, cephalograms, and CT images of living subjects. The typical limitation of archaeological samples is the lack of information on the actual age and sex of individuals which makes this type of study possible for only a few documented collections (Humphrey, 1998; Schutkowski, 1993; Viðarsdottir, 1999; Viðarsdóttir et al., 2002) where remains of infants and younger children are typically strongly underrepresented. Longitudinal growth studies based on X‐ray cephalograms provide the most abundant datasets for studying the topic (Bulygina et al., 2006; Dean et al., 2000; Evälahti, 2020; Gonzalez, 2012; Ursi et al., 1993). This source of data has a number of flaws: the superimposition and unequal enlargement ratios of structures from the left and right sides of the skull, and possible distortion of the midfacial structures. In infants, these are additionally complicated by the very poor visibility of craniofacial structures due to their low density (see Bulygina et al., 2006 for a comprehensive discussion).
High‐resolution CT scanning currently appears to be the most efficient tool for studying growth patterns of bone structures. This method is non‐invasive, cost‐effective, and free of the inherent flaws of cephalograms and dry cranial samples. Its only major drawback is potential harmfulness of the radiation exposure which makes scanning healthy subadult individuals virtually impossible for ethical reasons. However, a very large number of CT images of individuals with pathologies that do not affect the normal morphology of the skull (i.e. trauma or ENT symptoms) are available for cross‐sectional retrospective studies (see New et al., 2022; Niemann et al., 2021). Although such data hve been frequently employed for studying normal human cranial growth (see Evteev et al., 2018 and citation therein), its full potential for exploring the ontogeny of SD in craniofacial traits has not yet been exploited. Many authors choose to pool sexes in order to maximize sample sizes while controlling for the effects of SD (Barbeito‐Andrés et al., 2016), because preliminary analyses did not reveal significant differences between the two sexes (Waitzman et al., 1992b), or the structure being studied was not expected to be sexually dimorphic (Likus et al., 2014). A number of studies were only concerned with specific craniofacial structures. For instance, Escaravage and Dutton (2013) explored growth patterns of the orbit in a pediatric sample and did not observe significant differences between the sexes, although they note that the study was not designed to investigate sexual differences. The study by Pool et al. (2016) was also limited to only two orbital dimensions. Likus et al. (2014) and Contencin et al. (1999) have not detected any sex differences between skeletal structures in the nasal cavity in samples of infants of 0 to 6 months of age, and children in the 0–3 years age range (respectively). Contrary to these, a study of temporal bone variation (Paetz et al., 2017) revealed a consistent difference between male and female measurements at all ages. Przystańska et al. (2020) reported a varying degree of SD of maxillary sinus dimensions at different ages.
Summing up, while a considerable number of recent studies support the presence and varying nature of craniofacial SD from the very first stages of ontogeny, the exact patterns of between‐sex differences during the first years of life remain obscure. This is despite the importance of these data for treatment planning and assessment in medical practice and for creating accurate models for sexing subadults. The potential of clinical CT data for resolving this issue has not yet been fully exploited.
Our study employs a large dataset of clinical CT scans of individuals from birth to 5 years of age (247 males and 184 females) in order to address the pattern of age‐related between‐sex differences in cranial dimensions of the mid‐face and to contribute to understanding of the developmental aspects of SD in human midfacial ontogeny.
2. MATERIAL AND METHODS
The CT sample employed in this study consists of 500 subjects including 101 male and 69 female infants (up to 1‐year‐old), 146 male and 115 female children of the second to sixth years of life (247 male and 184 female non‐adult individuals in total), and 36 male and 33 female adult individuals as reference samples. The sample was divided into 10 age cohorts on a yearly basis starting from the second year of life. For instance, the cohort of 1‐year old children included individuals whose age varied from 1 year and 1 day to 1 year and 11 months. As the first year of life is the time of the most rapid growth changes, we employed a more detailed age gradation for this period (Table 1). All the scans were obtained from the National Scientific and Practical Center of Children's Health (SCCH), Moscow, and anonymized prior to further procedures (with only age and sex entries left unchanged).
TABLE 1.
Computed tomography scans sample.
| Age cohort | Male | Female | Total |
|---|---|---|---|
| Newborn | 10 | 6 | 16 |
| 1–2 months | 17 | 8 | 25 |
| 3–6 months | 28 | 35 | 63 |
| 7–11 months | 46 | 20 | 66 |
| 1 year | 28 | 23 | 51 |
| 2 years | 31 | 20 | 51 |
| 3 years | 28 | 22 | 50 |
| 4 years | 33 | 26 | 59 |
| 5 years | 26 | 24 | 50 |
| Adults | 36 | 33 | 69 |
| Total | 283 | 217 | 500 |
The data on ethnicity (based on surnames) and diagnoses without reference to personal data were processed separately. The final sample consisted mainly of Caucasoid individuals of East Slavonic ancestry without evidence of pathologies affecting the normal growth and morphology of the skull including craniosynostoses, craniofacial clefts, congenital syndromes, hydrocephaly, or severe trauma. This study was considered and approved by the Independent Ethics committee at the SCCH (see Evteev et al., 2018 for details).
The CT scans were obtained using different scanners (GE Light‐Speed 16; Toshiba Aquilion, Philips Brilliance 6) and standard medical protocols for imaging the brain, head, orbit, and paranasal sinuses. Virtually all scans were made using a 512 × 512 matrix with no gantry tilt and in the axial direction. Following recommendations (Decker, 2010; Palomo & Broadbent, 2008; Spoor et al., 2000), scan series with convolution kernels other than “Bone” were employed when possible. The majority of individuals were scanned with slice thicknesses of less than 1 mm (196 male and 148 female datasets), while some patients, mostly infants in the first 2 years of life were scanned with slice thicknesses of 3 mm and spacing between slices of 1.5 mm (87 male and 69 female datasets). It has been shown by numerous studies that the differences in slice thickness under 5 mm do not seriously affect the precision of CT‐based cranial measurements (Hassan et al., 2009; Kim et al., 2005; Spoor et al., 2000; Van Cauter et al., 2010; Waitzman et al., 1992b). This was also confirmed by our previous study on male infants and children (Evteev et al., 2018).
The DICOM datasets were imported into Amira (Visualization Sciences Group) to build 3D models and place landmarks following the protocol of Evteev et al. (2018). It has been shown that physical and CT‐based virtual measurements of dry skulls are in very good agreement, in particular for CT data with a higher spatial resolution and a smaller slice thickness (Hassan et al., 2009; Hildebolt et al., 1990; Olmez et al., 2011; Richard et al., 2014; Richtsmeier et al., 1995; Waitzman et al., 1992a see Kim et al., 2012 for a comprehensive review of earlier literature).
In our study, 40 bilateral and mid‐sagittal landmarks were placed on the surface‐rendered models (Figure 1; Table S1). Using 3D coordinates of the landmarks, 22 linear measurements commonly used in craniometric studies were calculated in the geomorph package version 4.0.1 in R (Adams et al., 2021). The set of measurements was compiled with the aim of describing the main morphological features of the mid‐facial region. Unilateral measurements were taken on the left side. A detailed description of the measurements is provided in Evteev et al. (2018) while the names of the variables are listed in Table 2.
FIGURE 1.
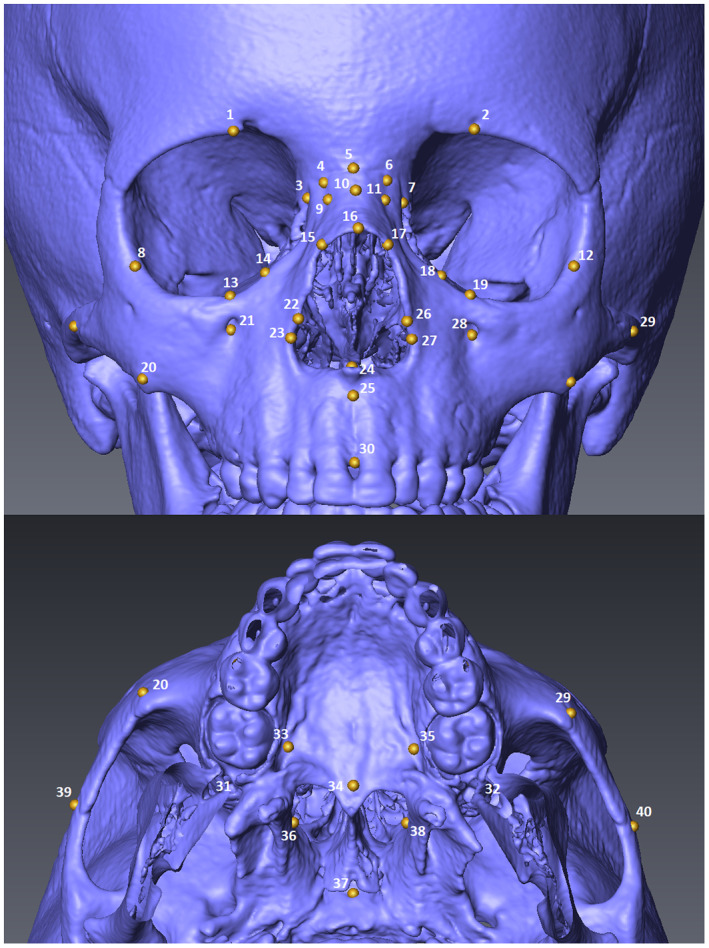
Mid‐facial landmarks.
TABLE 2.
Linear distances and inter‐observer error for three age groups (mm).
| Variable/Sample | Region | 7–11 months | 3 years | 5 years | Total mean error |
|---|---|---|---|---|---|
| Simotic chord (9–11) | Nasal bones | −0.16 | −0.58 | −0.07 | −0.27 |
| Simotic subtence (9–10−11) | Nasal bones | 0.08 | −0.38 | −0.16 | −0.15 |
| Length of the nasal bones (5–16) | Nasal bones | −0.48 | 0.36 | 0.95 | 0.28 |
| Lower breadth of the nasal bones (15–17) | Nasal bones/Nasal aperture | 1.00 | −1.61 | −1.13 | −0.58 |
| Orbital breadth (7–12) | Orbit | −1.26 | 0.38 | −0.18 | −0.35 |
| Orbital height (2–19) | Orbit | −0.24 | −0.15 | −0.80 | −0.40 |
| Interorbital breadth at maxillofrontale (3–7) | Orbit | −0.44 | −0.31 | 0.36 | −0.13 |
| Zygoorbitale chord (13–19) | Orbit | 0.70 | 0.03 | −1.02 | −0.10 |
| Frontal process height (7–18) | Orbit | −1.84 | 0.89 | 0.17 | −0.26 |
| Zygomaxillary chord (20–29) | Maxillary‐zygomatic | −1.25 | −0.53 | −0.03 | −0.60 |
| Cheek height (19–29) | Maxillary‐zygomatic | −1.61 | 0.35 | 1.62 | 0.12 |
| Lateral length of the body of the maxilla (28–32) | Maxillary‐zygomatic | 0.23 | −0.93 | −0.58 | −0.43 |
| Bizygomatic breadth (39–40) | Maxillary‐zygomatic | 0.76 | −1.85 | −2.22 | −1.11 |
| Nasal breadth (23–27) | Nasal aperture | 0.24 | −0.59 | −0.24 | −0.20 |
| Nasal height (5–24) | Nasal aperture | −0.71 | 0.23 | 0.28 | −0.07 |
| Zygoorbitale subtense (13–17–19) | Nasal aperture | −0.43 | 0.39 | −0.34 | −0.12 |
| Zygomaxillary subtense (20–25–29) | Nasal aperture | −1.27 | −0.09 | 0.27 | −0.36 |
| Upper facial height (5–30) | Nasal aperture/Alveolar | 0.79 | 0.62 | 1.71 | 1.04 |
| Anterior height of the alveolar process (24–30) | Alveolar | 0.54 | 0.31 | 1.47 | 0.77 |
| Palate breadth (33–35) | Posterior face | 1.29 | 0.73 | 0.03 | 0.68 |
| Height of the choanae (34–37) | Posterior face | 1.08 | −0.26 | 0.90 | 0.57 |
| Breadth of the choanae (36–38) | Posterior face | 0.34 | −1.54 | −0.66 | −0.62 |
Note: Numbers in the parentheses indicate landmarks used for obtaining each measurement.
The landmarks were placed by AE and TS. Intra‐ and inter‐observer errors were tested by estimating the repeatability of the final measurements (involving all landmarks) of five individuals in each of three age groups: 7–11 months, 3 years, and 5 years. The inter‐observer error values are presented in Table 2 and show that the total mean difference between AE and TS was no more than 1 mm for all measurements except for bizygomatic breadth and upper facial heights. As the latter are among the largest dimensions included in the study, in percentage terms the inter‐observer error was considered acceptable for all measurements (Jamison & Ward, 1993).
Basic descriptive statistics, including the mean, standard deviation, coefficient of variation, minimum and maximum values, and the number of individuals, were calculated for each variable in each age cohort (Table S3). The number of individuals is not the same for all variables either due to the incompleteness of some scans or to poor visibility of some structures in infants scanned with a low resolution.
The sexual dimorphism coefficients (SDC) were calculated for every age cohort as male mean values expressed as a percentage of the respective cohort's female values (Alekseev & Debets, 1964; Humphrey, 1998; Vlastovsky, 1961). Male and female values for every dimension in each cohort were compared using the Wilcoxon–Mann–Whitney test; the statistics and respective p‐values are available in Table S3. The standard deviations of variables' SDCs with respect to their mean in a particular cohort were also calculated to quantify how SD varies during the ontogeny for different dimensions.
To analyze ontogenetic trends for every single variable, sex‐specific growth curves were plotted as well as curves for SDC changes. All plots were created with the use of ggplot2 package version 3.3.3 in R (Wickham, 2016). In order to compare differences in SD across the age cohorts, pairwise differences in male and female values of each trait in each age group (z‐scored within each sex) were compared using the Wilcoxon–Mann–Whitney test with a Bonferroni correction for multiple comparisons (Table S4).
A Q‐mode principal component analysis (PCA) was performed in order to summarize and better visualize the similarities and differences in ontogenetic changes in SD of some of the variables displaying the most typical patterns of age changes. This was carried out using the mid‐facial dimensions as the units of the analysis and their SDC values at different ages—as variables. The latter were standardized (z‐scored) with respect to the mean of SDCs for each variable across the age cohorts in order to account for variation in the total level of SD of the variables.
3. RESULTS
The SDC for the 22 mid‐facial variables across 10 age cohorts are presented in Table 3 while respective p‐values can be found in Table S3. Ontogenetic trends in between‐sex differences accompanied by the sex‐specific growth curves for the dimensions are charted in Figures 2, 3, 4, 5, 6 and Figure S1 and discussed in the text. The bold line in the figures indicates SDC of 100, so when a curve falls above it, it corresponds to higher male values of a given variable, and vice versa. Some age groups were combined when preparing these charts in order to simplify plots of the data resulting in the following six cohorts: 0–2 months, 3–11 months, 1 year, 2–3 years, 4–5 years, adults.
TABLE 3.
Sexual dimorphism coefficients by age.
| Variable/Age | Newborn | 1–2 months | 3–6 months | 7–11 months | 1 year | 2 years | 3 years | 4 years | 5 years | Adult |
|---|---|---|---|---|---|---|---|---|---|---|
| Simotic chord | 101.5 | 101.6 | 108.4 | 102.4 | 104.2 | 99.6 | 95.8 | 95.2 | 96.6 | 109.4 |
| Simotic subtense | 109.8 | 101.5 | 116.2 | 119.8 | 122.8 | 107.4 | 98.3 | 96.4 | 101.6 | 117.5 |
| Length of the nasal bones | 95.1 | 105.6 | 93.5 | 98.8 | 106.2 | 101.7 | 101.9 | 103.2 | 95.4 | 98.8 |
| Lower breadth of the nasal bones | 104.3 | 108.9 | 106.9 | 107.3 | 102.2 | 107.9 | 106.1 | 108.5 | 109.1 | 113.3 |
| Orbital breadth | 99 | 101.8 | 104.3 | 104.4 | 102 | 103.8 | 101.7 | 104.3 | 102.1 | 105 |
| Orbital height | 99.8 | 100.5 | 101.1 | 107.2 | 105.7 | 102.3 | 103.1 | 106.5 | 103.6 | 104.5 |
| Interorbital breadth at maxillofrontale | 96.8 | 101.6 | 101.6 | 100.1 | 101.6 | 106.3 | 101.7 | 100.7 | 104.9 | 108.1 |
| Zygoorbitale chord | 101.3 | 101.8 | 101.3 | 101.3 | 101.7 | 102.4 | 101.8 | 102.9 | 100.2 | 103.5 |
| Frontal process height | 82.9 | 83.6 | 88.9 | 96.7 | 93.7 | 91.8 | 91.3 | 101.8 | 97.2 | 98 |
| Zygomaxillary chord | 99.5 | 100.5 | 102.5 | 102.4 | 102.4 | 102.6 | 102.4 | 101.5 | 100.8 | 105.5 |
| Cheek height | 91.7 | 96.6 | 101.7 | 100.8 | 100.7 | 101.6 | 101.4 | 95.6 | 99.5 | 104 |
| Lateral length of the body of the maxilla | 95.9 | 102.9 | 103 | 101.6 | 102.2 | 105.5 | 104.1 | 103.6 | 105.3 | 104 |
| Bizygomatic breadth | 99.3 | 103.1 | 102.7 | 104.2 | 103.1 | 104.8 | 103.1 | 104.1 | 104.5 | 109.6 |
| Nasal breadth | 94.3 | 103.1 | 100.5 | 100.2 | 99.4 | 99.7 | 99.8 | 101.6 | 98.5 | 109.1 |
| Nasal height | 96.2 | 103.6 | 99.8 | 102.4 | 103.4 | 103.7 | 105.6 | 105.3 | 103.3 | 108.3 |
| Zygoorbitale subtense | 99.1 | 112.8 | 105 | 106 | 105.9 | 103.9 | 109.1 | 107.1 | 97.1 | 109.9 |
| Zygomaxillary subtense | 103.7 | 100.1 | 102.9 | 103.7 | 104.7 | 98.1 | 106.9 | 106.6 | 98.1 | 103.9 |
| Upper facial height | 100.5 | 104.3 | 104 | 102.8 | 100.4 | 100.7 | 103.7 | 101.7 | 100.5 | 107 |
| Anterior height of the alveolar process | 105.5 | 107.7 | 112.5 | 106.9 | 91.3 | 98.5 | 98.3 | 90.8 | 94.9 | 105.5 |
| Palate breadth | 98.7 | 99.6 | 99.2 | 100.7 | 101.2 | 108.3 | 108.6 | 102.1 | 102 | 109.6 |
| Height of the choanae | 108.3 | 112.1 | 103.7 | 98.8 | 97.4 | 104.4 | 104.1 | 101.4 | 100.5 | 105.9 |
| Breadth of the choanae | 106.8 | 103.2 | 100 | 102.9 | 105.8 | 104.2 | 113.2 | 111.4 | 106.9 | 111 |
Note: Values in bold indicate significant differences between sexes (p < 0.05).
FIGURE 2.
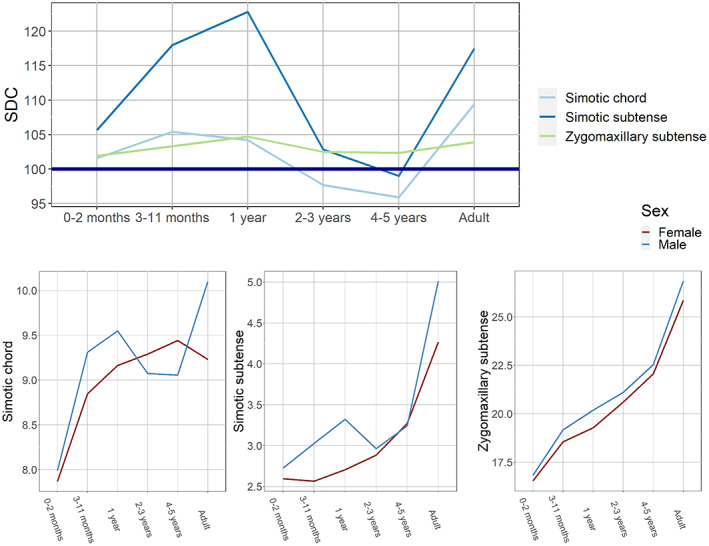
Ontogenetic changes in sexual dimorphism coefficients and sex‐specific growth curves: nasal bone dimensions and zygomaxillary subtense.
FIGURE 3.
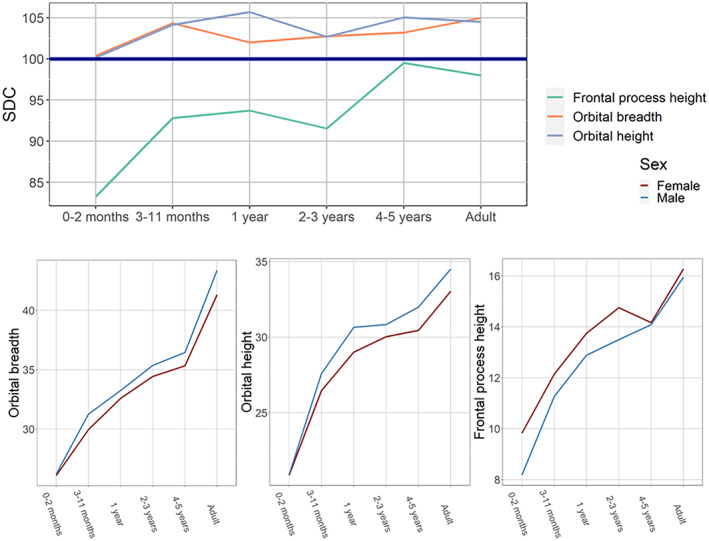
Ontogenetic changes in sexual dimorphism coefficients and sex‐specific growth curves: orbital dimensions.
FIGURE 4.
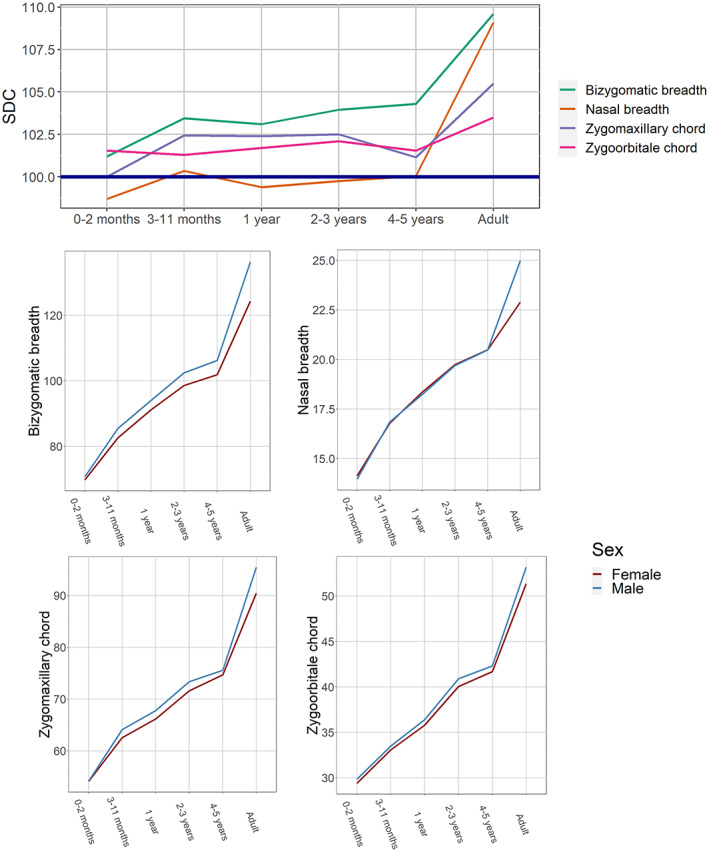
Ontogenetic changes in sexual dimorphism coefficients and sex‐specific growth curves: transverse mid‐facial dimensions.
FIGURE 5.
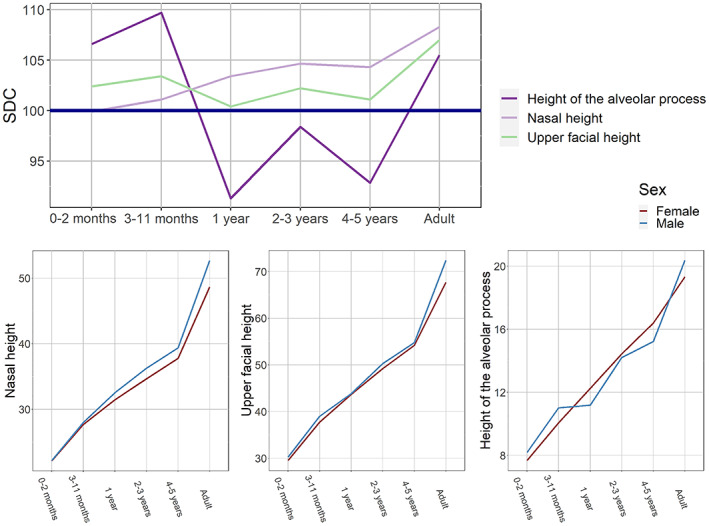
Ontogenetic changes in sexual dimorphism coefficients and sex‐specific growth curves: facial heights.
FIGURE 6.
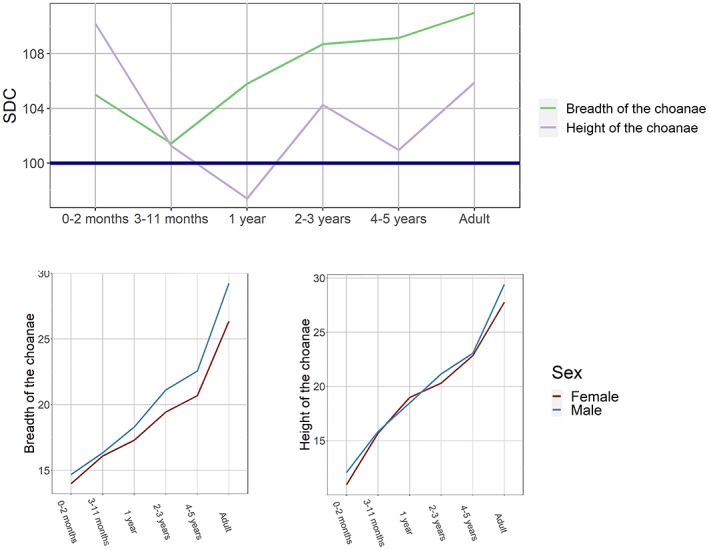
Ontogenetic changes in sexual dimorphism coefficients and sex‐specific growth curves: choanal dimensions.
3.1. Ontogenetic trends of single variables
The trajectories of nasal bone dimensions and the zygomaxillary subtense SDCs are presented in Figure 2. The trends of these variables display fluctuations that are most pronounced for simotic subtense, which shows an increase during the first 2 years of life, a decline at 2–5 years of age, and a new steep increase by adulthood. The respective growth curves also exhibit fluctuations and numerous intersections between male and female trajectories.
The orbital dimensions demonstrate an entirely different pattern (Figure 3). Their between‐sex differences, quite modest in general, are established very early in ontogeny (by the second half of the first year of life) and remain approximately the same until adulthood. The height of the frontal process displays a rather atypical pattern, where SDC is negative throughout early childhood (i.e., larger values of the variable are found in females) and only approaches 100 by 4–5 years of age, maintaining the same level into adulthood. Sex‐specific growth curves for these variables diverge very early.
Most transverse dimensions of the mid‐face (Figure 4) exhibit little to no SD from birth to 5 years of age, followed by a steep increase. The growth curves of the two sexes are almost identical in childhood and only later begin to diverge substantially. Palate breadth and zygoorbitale subtense display similar dynamics, but the former suddenly peaks at 2–3 years of age while the latter demonstrates greater SD at birth (Figure S1).
The trajectories of the two components of upper facial height are completely different (Figure 5). While nasal height (as well as interorbital width—Figure S1) demonstrates a smooth, almost linear increase, the height of the alveolar process fluctuates very strongly. Thus, upper facial height, which is the sum of these two dimensions, occupies an intermediate position in the plot. The sex‐specific growth curves are similar for nasal height and upper facial height, but, importantly, absolute values of height of the alveolar process display fluctuations only in males, differences between sexes being significant throughout the first two years of life.
Finally, SD of the choanal dimensions (Figure 6) is exceptionally large at birth, declines during the second half of the first year of life, and increases to almost reach adult values by the age of 2–3 years (sexual differences significant only for choanal breadth, though). The breadth of the choanae, unlike height, sharply increases in males from 3 years of age onwards.
Based on the number of significant differences in SD across age cohorts, the following variables display the most variable pattern of ontogenetic changes: frontal process height, bizygomatic breadth, anterior height of the alveolar process, nasal height, breadth of the choanae. The following dimensions exhibit the most stable level of between‐sex differences across infancy and childhood: zygoorbitale and zygomaxillary chords, upper facial height, simotic chord, and nasal breadth (Table S4).
3.2. General patterns of SD
The trajectories of the 12 variables are charted together in Figure 7 in order to assess the pattern and relative magnitude of the differences in SD between different dimensions at various ages. The standard deviations of variables' SDCs with respect to their mean in a particular cohort were also calculated to quantify the differences. The period from birth to the second month of life is apparently the time of the highest variation of SDCs (standard deviation = 3.38), but this is only due to three variables (two choanal dimensions and zygoorbitale subtense). If these are excluded, the standard deviation falls to 1.11, and the SDCs of the remaining nine dimensions vary only between 99% and 102%. During the middle and the second half of the first year of life, the SD of most variables increases or remains stable, and the standard deviation is the lowest among all cohorts (1.94). The second to fourth years of life is the period of greatest variation of SD (standard deviations 2.67 and 3.24), which is not due to one or a few variables, rather it is a result of changes in SDCs of most of the dimensions. The 5‐year old children also apparently display a high level of variation (standard deviation = 3.15), but this is actually due to only two variables (simotic chord and choanal breadth). If these are excluded, standard deviation drops to just 1.54. A notable feature of this age is a marked decrease in SD of many dimensions. Finally, adults demonstrate stabilization of SD variation, where none of the variables (similarly to the second half of the first year of life) shows exceptionally high or low SDC. The coefficients reveal a marked increase in only half of the dimensions, while in the rest they remain quite similar to the children's values.
FIGURE 7.
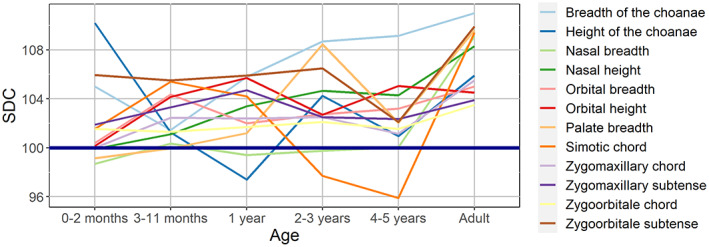
Ontogenetic changes in sexual dimorphism coefficients for 12 variables.
Based on the number of significant differences in SD across the variables, the following age cohorts (except adults) display the most specific patterns of between‐sex differences: 5 years, 1 year, 3–6 months (Table S4).
A Q‐mode PCA was performed in order to summarize and better visualize the similarities and differences in ontogenetic patterns of SD of the variables (Figure 8). The closer the variables are in the plot, the more similar pattern of ontogenetic change of SD they demonstrate (general differences in the level of SD being accounted for via z‐scoring). The circles were drawn by hand to facilitate the interpretation of the plot. The first two principal components (PC) together describe 72.4% of the total variance, and thus the major part of the relationships among variables can be visualized by plotting only these two PCs (Figure 8). Three groups of similar variables can be distinguished in the plot. The first includes the breadths of the palate and choanae, and nasal height. A notable common trend for these variables is a great increase of the level of SD taking place between 3–11 months and 2–3 years. The second group includes most of the transverse dimensions: nasal and orbital breadths, zygoorbitale and zygomaxillary chords all displaying quite low and stable SD during the whole period from birth to 5 years. The third is comprised of zygoorbitale subtense and choanal height. Both variables exhibit a very high level of SD at birth which sharply decreases by the age of 4–5 years. Finally, some variables exhibit distinct ontogenetic trajectories (Figure 7), namely simotic chord, zygomaxillary subtense and orbital height, although the latter is relatively close to orbital breadth.
FIGURE 8.
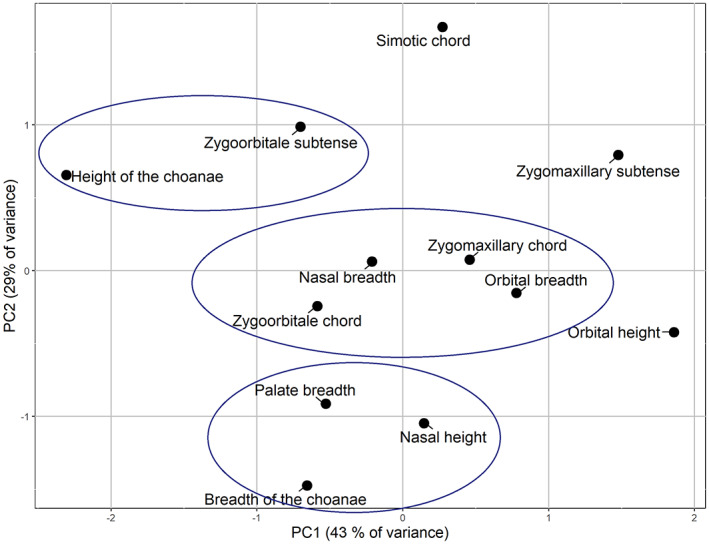
Principal component analysis of sexual dimorphism coefficients of selected variables.
4. DISCUSSION
The results of the present study show that the patterns of age changes in the level of SD differ strongly between various dimensions during ontogeny, and cannot thus be expressed by a single value for the whole face; neither the level of SD for a particular variable can be viewed as ontogenetically stable during the first years of life.
4.1. The main stages in the development of mid‐facial SD.
Birth to the third month of life is the period of both low level and low variability of SDCs of most dimensions. Important exclusions are the choanal dimensions, frontal process height, and nasal protrusion (zygoorbitale and simotic subtenses), displaying high levels of SD. The use of these particular measurements for sex determination in newborns can thus be expected to be effective.
During the 4th to 11th months of life, the great majority of the dimensions demonstrate an increase in SD while its variability remains low.
The second year of life demarcates the beginning of the time of fluctuation of the level of SD of most variables in both directions, which peaks during the third and fourth years of life. The SDCs of the palatal and choanal breadths approach the adult level. The most notable phenomenon observed during the sixth year of life is a marked decrease in SD in about half of the variables (see below).
In adults, SDC of only one dimension (orbital height) remains the same compared with 5‐year‐old children. SD of the other variables increases, but to a very different extent: by about 2%—four dimensions, by 4%–5%—three dimensions, by 7%–9%—also three dimensions, and by 13%—in one variable. This means that the leading role of the pubertal phase of growth in the formation of between‐sex differences can be accepted for some variables (mainly transverse and nasal bone dimensions) but not others (orbital dimensions, zygomaxillary subtense, choanal breadth). Notably, due to the fluctuating nature of the ontogenetic changes in these differences, some variables (e.g. simotic subtense) display adult levels of SD as early as the second half of the first year of life.
4.2. Sex‐specific patterns of growth of the orbit
The height of the frontal process of the maxilla (the medial border of the orbit) displays the most distinct ontogenetic trajectory of SD, being the only variable exhibiting SDCs lower than 100% throughout ontogeny. The process is absolutely taller in females at all ages, but particularly in newborns and children in the first years of life. This is in contrast to the total height of the orbit, which is characterized by a consistently moderate level of SD (about 105%) from the second half of the first year of life onwards. This observation points to potential differences in how the sexes accommodate growth of the eyes (Moss & Young, 1960), predominantly during the prenatal and early postnatal periods.
4.3. Sex‐specific patterns of growth of the tooth sockets
Sexual dimorphism of the height of the maxillary alveolar process displays enormous and sudden fluctuations throughout ontogeny changing from 106% at birth to 92% during the second year of life, and then back to 106% by adulthood. These fluctuations are related to decreases in the absolute values of this variable observed during the second and sixth years of life, but only in males. Such changes can be reasonably explained by the development of the dentition: the second year of life is the time of active eruption of deciduous teeth, while the sixth year demarcates the beginning of the transition to the permanent dentition. But, surprisingly, these important ontogenetic events only affect males, while the growth trajectory of females remains stable.
4.4. Mid‐facial SD and respiratory function
While most of the employed variables display low levels of SD shortly after birth, there are several important exceptions to this trend. These include dimensions related to the size of the choanae and nasal protrusion, i.e. the capacity of the skeletal nasal cavity: choanal width, zygoorbitale and simotic subtense. In 5‐year‐old children, a number of variables exhibit a marked decrease in SD, and again those are dimensions related to the size of the external or internal nasal orifices, or the nasal cavity: nasal height, palatal breadth, simotic chord and subtense, zygoorbitale and zygomaxillary subtenses, and choanal height. It is thus tempting to relate these trends to between‐sex differences in energetic demands and respiratory function (Bastir et al., 2011; Froehle et al., 2013; Hall, 2005; Holton et al., 2014, 2016).
4.5. Concluding remarks
Our results support the view that many sexually dimorphic features of the facial skeleton begin to develop early in postnatal ontogeny: arguably shortly after birth (Bulygina et al., 2006; Matthews et al., 2016; Morimoto et al., 2008; White, 2005) but undoubtedly during the first years of life (Delye et al., 2015; Humphrey, 1998; Niemann et al., 2021; Schutkowski, 1993; Ursi et al., 1993; Viðarsdottir, 1999; Wheat, 2015, among others). A matter of potential debate is if observed dimorphism is related to the between‐sex size differences only or, alternatively, if it involves some changes in the shape of the facial skeleton. In our opinion, the independent fluctuations of growth curves of different variables producing very distinct combinations of SD levels at different ages clearly imply sex‐related differences in shape, and not merely in the size. But future research employing size‐standardized variables would be necessary to fully address this question.
The fluctuating nature of the level of SD was pointed out in numerous studies as well. According to Matthews (2018), the between‐sexes differences observed in the nose in 1 year‐old children are no longer present by the age of two though those differences re‐emerge by the age of 14. The SD of maxillary sinus dimensions depends on the phase of ontogenesis as well (Przystańska et al., 2020). Interestingly, the marked decrease in the level of SD observed in our sample during the sixth year of life—an unexpected result – finds parallels in the outcomes of at least two earlier studies. Tutkuviene et al. (2016) noted that a number of facial dimensions differed between sexes up to the age of 5 years, but the difference disappeared at the age of 6. A similar observation was made by Schüler (2007): the faces of girls between the ages of three and four and a half years appear to be chubbier and shorter than the faces of boys, but this proportion changes at approximately 5 years. These observations emphasize the clear differences in timing of development of the two sexes that exist well before puberty.
Though CT data have been employed for describing mid‐facial growth in numerous, mainly medical, studies, most of them cover only limited periods of ontogeny and a limited number of dimensions related to a particular anatomical region (e.g. Contencin et al., 1999; Likus et al., 2014; Pool et al., 2016). Importantly, in most of those studies the sexes are pooled, or the question of SD is not directly addressed. Thus, the need for new data to address the ontogeny of SD and establish methods for juvenile sex estimation was emphasized in a recent review (Wilson, Humphrey, 2017; see also Niemann et al., 2021). This study is based on a large sample of high‐resolution CT scans comprehensively covering the earliest stages of postnatal growth and employing a set of measurements representing the main aspects of mid‐face morphology. As it was initially collected as 3D landmark configurations, our dataset can be further explored by various methods and from different points of view.
Besides the contribution to basic knowledge on the ontogeny of human SD mentioned above, there are some practical implications of the results obtained in the present study. First, the mean values and ranges of variation of different mid‐facial dimensions are important from the point of view of craniofacial treatment planning and evaluation of results in medical practice (see the Section 1). Such values established for a large sample of healthy children provide reference for evaluation of both the degree to which a pathological condition is manifested morphologically before treatment and how much it has been improved during the treatment. As many dimensions display substantial SD, it is often necessary to use separate standards for males and females. Second, the metrical data can be employed to improve the methods of sexing non‐adult individuals though this requires extensive future research.
Importantly, our results were obtained for a single, though quite diverse, sample of West Eurasian population and might thus be limited in terms of using these standards for populations of different origin (see Viðarsdottir, 1999). The question of intergroup variation of the ontogeny of mid‐facial SD remains a prospective avenue for future research.
AUTHOR CONTRIBUTIONS
Taisiya Syutkina did formal analysis (supporting), investigation (equal), visualization (lead), writing – original draft preparation (equal), and writing – review and editing (supporting). Anatoliy Anikin contributed to data curation (equal), investigation (equal), and resources (equal). Leonid Satanin contributed to data curation (equal), investigation (equal), resources (equal). Andrej Evteev, contributed to conceptualization (lead), formal analysis (lead), investigation (equal), methodology (lead), project administration (lead), supervision (lead), writing – original draft preparation (equal), and writing – review and editing (lead).
FUNDING INFORMATION
The article was prepared within the research grant funded by the Ministry of Science and Higher Education of the Russian Federation (grant ID: 075‐15‐2020‐910) and MSU research program “Anthropology of Eurasian populations (biological aspects).”
CONFLICT OF INTEREST
The authors have no conflicts of interest to declare.
Supporting information
Figure S1
Table S1
Table S2
Table S3
Table S4
ACKNOWLEDGMENTS
The authors are grateful to Dr. O.I. Maslova (Scientific Centre of Children Health) for help with organizing and reviewing this study by the Local Independent Ethics Committee of the SCCH.
Syutkina, T. , Anikin, A. , Satanin, L. & Evteev, A. (2023) Sexual dimorphism in human midfacial growth patterns from newborn to 5 years old based on computed tomography. Journal of Anatomy, 242, 132–145. Available from: 10.1111/joa.13776
DATA AVAILABILITY STATEMENT
The CT data is unavailable for ethical reasons. The raw linear data can be provided upon request.
REFERENCES
- Adams, D.C. , Collyer, M.L. , Kaliontzopoulou, A. & Baken, E.K. (2021) Geomorph: software for geometric morphometric analyses. R package version 4.0. https://CRAN.R‐project.org/package=geomorph
- Alekseev, V.P. & Debets, G.F. (1964) Craniometry: anthropological research methodology. Мoscow: Nauka. [In Russian]. [Google Scholar]
- Barbeito‐Andrés, J. , Anzelmo, M. , Ventrice, F. , Pucciarelli, H.M. & Sardi, M.L. (2016) Morphological integration of the orbital region in a human ontogenetic sample. The Anatomical Record, 299(1), 70–80. 10.1002/ar.23282 [DOI] [PubMed] [Google Scholar]
- Bastir, M. , Godoy, P. & Rosas, A. (2011) Common features of sexual dimorphism in the cranial airways of different human populations. American Journal of Physical Anthropology, 146(3), 414–422. 10.1002/ajpa.21596 [DOI] [PubMed] [Google Scholar]
- Bjork, A. (1964) Sutural growth of the upper face studied by the implant method. Report of the Congress. European Orthodontic Society, 40, 49–65. [PubMed] [Google Scholar]
- Brief, J. , Hassfeld, S. , Däuber, S. , Pernozzoli, A. , Münchenberg, J. , Redlich, T. et al. (2000) 3D norm data: the first step towards semiautomatic virtual craniofacial surgery. Computer Aided Surgery: Official Journal of the International Society for Computer Aided Surgery (ISCAS), 5(5), 353–358. [DOI] [PubMed] [Google Scholar]
- Broadbent, B.H.S. , Broadbent, B.H.J. & Golden, W. (1975) Bolton standards of dentofacial developmental growth. St. Louis: Mosby. [Google Scholar]
- Bulygina, E. , Mitteroecker, P. & Aiello, L. (2006) Ontogeny of facial dimorphism and patterns of individual development within one human population. American Journal of Physical Anthropology, 131(3), 432–443. 10.1002/ajpa.20317 [DOI] [PubMed] [Google Scholar]
- Contencin, P. , Gumpert, L. , Sleiman, J. , Possel, L. , De Gaudemar, I. & Adamsbaum, C. (1999) Nasal fossae dimensions in the neonate and young infant: a computed tomographic scan study. Archives of Otolaryngology–Head & Neck Surgery, 125(7), 777–781. 10.1001/archotol.125.7.777 [DOI] [PubMed] [Google Scholar]
- Dean, D. , Hans, M.G. , Bookstein, F.L. & Subramanyan, K. (2000) Three‐dimensional Bolton–Brush growth study landmark data: ontogeny and sexual dimorphism of the Bolton standards cohort. The Cleft Palate‐Craniofacial Journal, 37(2), 145–156. 10.1597/1545-1569_2000_037_0145_tdbbgs_2.3.co_2 [DOI] [PubMed] [Google Scholar]
- Decker, S. . (2010) The human in 3D: advanced morphometric analysis of high‐resolution anatomically accurate computed models (Ph.D. dissertation, University of South Florida, Tampa).
- Delye, H. , Clijmans, T. , Mommaerts, M.Y. , Sloten, J.V. & Goffin, J. (2015) Creating a normative database of age‐specific 3D geometrical data, bone density, and bone thickness of the developing skull: a pilot study. Journal of Neurosurgery: Pediatrics, 16(6), 687–702. 10.3171/2015.4.PEDS1493 [DOI] [PubMed] [Google Scholar]
- Enlow, D.H. (1975) Handbook of facial growth. Philadelphia: WB Saunders Company. [Google Scholar]
- Escaravage, G.K., Jr. & Dutton, J.J. (2013) Age‐related changes in the pediatric human orbit on CT. Ophthalmic Plastic & Reconstructive Surgery, 29(3), 150–156. 10.1597/1545-1569_1992_029_0308_gpotfa_2.3.co_2 [DOI] [PubMed] [Google Scholar]
- Evälahti, M. (2020) Craniofacial growth and development of finnish children: a longitudinal study (Ph.D. dissertation, Helsinki University).
- Evteev, A. , Anikin, A. & Satanin, L. (2018) Midfacial growth patterns in males from newborn to 5 years old based on computed tomography. American Journal of Human Biology, 30(4), e23132. 10.1002/ajhb.23132 [DOI] [PubMed] [Google Scholar]
- Farkas, L.G. , Posnick, J.C. & Hreczko, T.M. (1992) Growth patterns of the face: a morphometric study. The Cleft Palate‐Craniofacial Journal, 29(4), 308–315. 10.1097/IOP.0b013e3182859716 [DOI] [PubMed] [Google Scholar]
- Farkas, L.G. , Posnick, J.C. , Hreczko, T.M. & Pron, G.E. (1992a) Growth patterns in the orbital region: a morphometric study. The Cleft Palate‐Craniofacial Journal, 29(4), 315–318. 10.1597/1545-1569_1992_029_0315_gpitor_2.3.co_2 [DOI] [PubMed] [Google Scholar]
- Farkas, L.G. , Posnick, J.C. , Hreczko, T.M. & Pron, G.E. (1992b) Growth patterns of the nasolabial region: a morphometric study. The Cleft Palate‐Craniofacial Journal, 29(4), 318–324. 10.1597/1545-1569_1992_029_0318_gpotnr_2.3.co_2 [DOI] [PubMed] [Google Scholar]
- Froehle, A.W. , Yokley, T.R. & Churchill, S.E. (2013) Energetics and the origin of modern humans. In: Smith, F.H. & Ahern, J.C. (Eds.) The origins of modern humans: biology reconsidered. Hoboken: Wiley‐Blackwell, pp. 285–320. [Google Scholar]
- Gonzalez, R.A. (2012) Determination of sex from juvenile crania by means of discriminant function analysis. Journal of Forensic Sciences, 57(1), 24–34. 10.1111/j.1556-4029.2011.01920.x [DOI] [PubMed] [Google Scholar]
- Hall, R.L. (2005) Energetics of nose and mouth breathing, body size, body composition, and nose volume in young adult males and females. American Journal of Human Biology: The Official Journal of the Human Biology Association, 17(3), 321–330. 10.1002/ajhb.20122 [DOI] [PubMed] [Google Scholar]
- Hassan, B. , van der Stelt, P. & Sanderink, G. (2009) Accuracy of three‐dimensional measurements obtained from cone beam computed tomography surface‐rendered images for cephalometric analysis: influence of patient scanning position. The European Journal of Orthodontics, 31(2), 129–134. 10.1093/ejo/cjn088 [DOI] [PubMed] [Google Scholar]
- Hildebolt, C.F. , Vannier, M.W. & Knapp, R.H. (1990) Validation study of skull three‐dimensional computerized tomography measurements. American Journal of Physical Anthropology, 82(3), 283–294. 10.1002/ajpa.1330820307 [DOI] [PubMed] [Google Scholar]
- Holton, N.E. , Alsamawi, A. , Yokley, T.R. & Froehle, A.W. (2016) The ontogeny of nasal shape: an analysis of sexual dimorphism in a longitudinal sample. American Journal of Physical Anthropology, 160(1), 52–61. 10.1002/ajpa.22941 [DOI] [PubMed] [Google Scholar]
- Holton, N.E. , Yokley, T.R. , Froehle, A.W. & Southard, T.E. (2014) Ontogenetic scaling of the human nose in a longitudinal sample: implications for genus Homo facial evolution. American Journal of Physical Anthropology, 153(1), 52–60. 10.1002/ajpa.22402 [DOI] [PubMed] [Google Scholar]
- Humphrey, L.T. (1998) Growth patterns in the modern human skeleton. American Journal of Physical Anthropology, 105(1), 57–72. [DOI] [PubMed] [Google Scholar]
- Jamison, P.L. & Ward, R.E. (1993) Brief communication: measurement size, precision, and reliability in craniofacial anthropometry: bigger is better. American Journal of Physical Anthropology, 90(4), 495–500. 10.1002/ajpa.1330900409 [DOI] [PubMed] [Google Scholar]
- Jeffery, N.S. , Humphreys, C. & Manson, A. (2022) A human craniofacial life‐course: cross‐sectional morphological covariations during postnatal growth, adolescence, and aging. The Anatomical Record, 305(1), 81–99. 10.1002/ar.24736 [DOI] [PubMed] [Google Scholar]
- Kesterke, M.J. , Raffensperger, Z.D. , Heike, C.L. , Cunningham, M.L. , Hecht, J.T. , Kau, C.H. et al. (2016) Using the 3D Facial Norms Database to investigate craniofacial sexual dimorphism in healthy children, adolescents, and adults. Biology of Sex Differences, 7(1), 1–14. 10.1186/s13293-016-0076-8 [DOI] [PMC free article] [PubMed] [Google Scholar]
- Kim, K.‐D. , Ruprecht, A. , Wang, G. , Lee, J.B. , Dawson, D.V. & Vannier, M.W. (2005) Accuracy of facial soft tissue thickness measurements in personal computer‐based multiplanar reconstructed computed tomographic images. Forensic Science International, 155(1), 28–34. 10.1016/j.forsciint.2004.11.004 [DOI] [PubMed] [Google Scholar]
- Kim, M. , Huh, K.‐H. , YI, W.‐J. , Heo, M.‐S., Lee, S.‐S., & Choi, S.‐C . (2012) Evaluation of accuracy of 3D reconstruction images using multi‐detector CT and cone‐beam CT. Imaging Science in Dentistry, 42(1), 25. 10.5624/isd.2012.42.1.25 [DOI] [PMC free article] [PubMed] [Google Scholar]
- Lang, J. (1989) Clinical anatomy of the nose, nasal cavity, and paranasal sinuses. New York: George Thieme Verlag. [Google Scholar]
- Likus, W. , Bajor, G. , Gruszczyńska, K. , Baron, J. & Markowski, J. (2014) Nasal region dimensions in children: a CT study and clinical implications. BioMed Research International, 2014, 1–11. 10.1155/2014/125810 [DOI] [PMC free article] [PubMed] [Google Scholar]
- Marino, R. , Tanganelli, V. , Pietrobelli, A. & Belcastro, M.G. (2019) The auricular surface of the ilium as a sex indicator in juvenile skeletons. Padova: Italian Anthropological Association Conference. [Google Scholar]
- Matthews, H. , Penington, T. , Saey, I. , Halliday, J. , Muggli, E. & Claes, P. (2016) Spatially dense morphometrics of craniofacial sexual dimorphism in 1‐year‐olds. Journal of Anatomy, 229(4), 549–559. 10.1111/joa.12507 [DOI] [PMC free article] [PubMed] [Google Scholar]
- Matthews, H.S. (2018) Changing the face of craniofacial growth curves: modelling growth and sexual dimorphism in children and adolescents using spatially dense 3D image analysis (Ph.D. dissertation, University of Melbourne).
- Meulstee, J.W. , de Jong, G.A. , Borstlap, W.A. , Koerts, G. , Maal, T.J. & Delye, H. (2020) The normal evolution of the cranium in three dimensions. International Journal of Oral and Maxillofacial Surgery, 49(6), 739–749. 10.1016/j.ijom.2019.10.012 [DOI] [PubMed] [Google Scholar]
- Moss, M.L. & Young, R.W. (1960) A functional approach to craniology. American Journal of Physical Anthropology, 18(4), 281–292. 10.1002/ajpa.1330180406 [DOI] [PubMed] [Google Scholar]
- Morimoto, N. , Ogihara, N. , Katayama, K. , & Shiota, K. (2008) Three‐dimensional ontogenetic shape changes in the human cranium during the fetal period. Journal of Anatomy, 212(5), 627–635. 10.1111/j.1469-7580.2008.00884.x [DOI] [PMC free article] [PubMed] [Google Scholar]
- New, B.T. , Wolfe, C.A. , Corron, L.K. , Spradley, K. & Stull, K. E. (2022). Implications of univariate subadult craniometric growth patterns in biological anthropology (Online) . 2022 AABA Annual Meeting, Denver, USA. https://aaba2022.pathable.co/meetings/virtual/Xt3jvqtnEQX2mSboM
- Niemann, K. , Lazarus, L. & Rennie, C.O. (2021) Developmental changes of the facial skeleton from birth to 18 years within a South African cohort (a computed tomography study). Journal of Forensic and Legal Medicine, 83, 102243. 10.1016/j.jflm.2021.102243 [DOI] [PubMed] [Google Scholar]
- Olmez, H. , Gorgulu, S. , Akin, E. , Bengi, A.O. , Tekdemir, I. & Ors, F. (2011) Measurement accuracy of a computer‐assisted three‐dimensional analysis and a conventional two‐dimensional method. The Angle Orthodontist, 81(3), 375–382. 10.2319/070810-387.1 [DOI] [PMC free article] [PubMed] [Google Scholar]
- Paetz, P. , Goetz, G. , Lanfermann, H. & Giesemann, A. (2017) The developing temporal bone: computed tomography measurements and assessment of suture closure from birth to 18 years of age. Surgical and Radiologic Anatomy, 39(6), 663–671. 10.1007/s00276-016-1786-7 [DOI] [PubMed] [Google Scholar]
- Palomo, J.M. & Broadbent, B.H. (2008) Craniofacial imaging. In: Enlow, D.H. & Hans, M.G. (Eds.) Essentials of facial growth. Ann Arbor: Needham Press, pp. 343–388. [Google Scholar]
- Pool, G.M. , Didier, R.A. , Bardo, D. , Selden, N.R. & Kuang, A.A. (2016) Computed tomography–generated anthropometric measurements of orbital relationships in normal infants and children. Journal of Neurosurgery: Pediatrics, 18(2), 201–206. 10.3171/2016.2.PEDS15475 [DOI] [PubMed] [Google Scholar]
- Przystańska, A. , Rewekant, A. , Sroka, A. , Gedrange, T. , Ekkert, M. , Jończyk‐Potoczna, K. et al. (2020) Sexual dimorphism of maxillary sinuses in children and adolescents–a retrospective CT study. Annals of Anatomy‐Anatomischer Anzeiger, 229, 151437. 10.1016/j.aanat.2019.151437 [DOI] [PubMed] [Google Scholar]
- Richard, A.H. , Parks, C.L. & Monson, K.L. (2014) Accuracy of standard craniometric measurements using multiple data formats. Forensic Science International, 242, 177–185. 10.1016/j.forsciint.2014.06.015 [DOI] [PubMed] [Google Scholar]
- Richtsmeier, J.T. , Paik, C.H. , Elfert, P.C. , Cole, T.M. & Dahlman, H.R. (1995) Precision, repeatability, and validation of the localization of cranial landmarks using computed tomography scans. The Cleft Palate‐Craniofacial Journal, 32(3), 217–227. 10.1597/1545-1569_1995_032_0217_pravot_2.3.co_2 [DOI] [PubMed] [Google Scholar]
- Riolo, M.L. , Moyers, R.E. , McNamara, J.A., Jr. & Hunter, W.S. (1974) An atlas of craniofacial growth: cephalometric standards from the university school growth study, the University of Michigan. Ann Arbor: The University of Michigan. [Google Scholar]
- Schaefer, M. , Black, S.M. , Schaefer, M.C. & Scheuer, L. (2009) Juvenile osteology. A laboratory and field manual. London: Academic Press. [Google Scholar]
- Schüler, G. (2007) Head proportion and shape of the head of children between 2 and 7 years—results of a longitudinal study. Anthropologischer Anzeiger, 65, 203–212. [PubMed] [Google Scholar]
- Schutkowski, H. (1993) Sex determination of infant and juvenile skeletons: I. Morphognostic features. American Journal of Physical Anthropology, 90(2), 199–205. 10.1002/ajpa.1330900206 [DOI] [PubMed] [Google Scholar]
- Smith, O.A. , Nashed, Y.S. , Duncan, C. , Pears, N. , Profico, A. & O'Higgins, P. (2021) 3D modeling of craniofacial ontogeny and sexual dimorphism in children. The Anatomical Record, 304(9), 1918–1926. 10.1002/ar.24582 [DOI] [PubMed] [Google Scholar]
- Spoor, F. , Jeffery, N. & Zonneveld, F. (2000) Imaging skeletal growth and evolution. In: O'Higgins, P. & Cohn, M. (Eds.) Development, growth and evolution:implications for the study of the Hominid. London: Academic Press, pp. 123–161. [Google Scholar]
- Stull, K.E. , L'Abbé, E.N. & Ousley, S.D. (2017) Subadult sex estimation from diaphyseal dimensions. American Journal of Physical Anthropology, 163(1), 64–74. 10.1002/ajpa.23185 [DOI] [PubMed] [Google Scholar]
- Teodoru‐Raghina, D. , Marinescu, M. , Diaconeasa, A. , Olteanu, B. , Perlea, P. & Dragu, M. (2017) Crania sexual dimorphism of an European subpopulation: CT scan discriminant function analysis in a Romanian subadult casuistry. Romanian Journal of Legal Medicine, 25, 373–378. 10.4323/rjlm.2017.373 [DOI] [Google Scholar]
- Tutkuviene, J. , Cattaneo, C. , Obertová, Z. , Ratnayake, M. , Poppa, P. , Barkus, A. et al. (2016) Age‐and sex‐related growth patterns of the craniofacial complex in European children aged 3–6 years. Annals of Human Biology, 43(6), 510–519. 10.3109/03014460.2015.1106584 [DOI] [PubMed] [Google Scholar]
- Ursi, W.J. , Trotman, C.‐A. , McNamara, J.A., Jr. & Behrents, R.G. (1993) Sexual dimorphism in normal craniofacial growth. The Angle Orthodontist, 63(1), 47–56. [DOI] [PubMed] [Google Scholar]
- Van Cauter, S. , Okkerse, W. , Brijs, G. , De Beule, M. , Verhegghe, B. & Braem, M. (2010) Reproducibility of landmark identification on different CT images of the head in three‐dimensional cephalometry. Proceedings of the ninth international symposium on computer methods in biomechanics and biomedical engineering. Cardiff: Cardiff University. [DOI] [PubMed] [Google Scholar]
- Viciano, J. , Tanga, C. , D'Anastasio, R. , Belcastro, M.G. & Capasso, L. (2021) Sex estimation by odontometrics of nonadult human remains from a contemporary Italian sample. American Journal of Physical Anthropology, 175(1), 59–80. 10.1002/ajpa.24132 [DOI] [PubMed] [Google Scholar]
- Viðarsdottir, U.S. (1999) Changes in the form of the facial skeleton during growth: a comparative morphometric study of modern humans and Neanderthals (Ph.D. dissertation, University of London, London).
- Viðarsdóttir, U.S. , O'Higgins, P. & Stringer, C. (2002) A geometric morphometric study of regional differences in the ontogeny of the modern human facial skeleton. Journal of Anatomy, 201(3), 211–229. 10.1046/j.1469-7580.2002.00092.x [DOI] [PMC free article] [PubMed] [Google Scholar]
- Vlastovsky, V.G. (1961) On sex dimorphism of racial‐diagnostic traits. Voprosy Antropologhii (Problems of Anthropology), 6, 57–70 [in Russian]. [Google Scholar]
- Waitzman, A.A. , Posnick, J.C. , Armstrong, D.C. & Pron, G.E. (1992a) Craniofacial skeletal measurements based on computed tomography: part I. Accuracy and reproducibility. The Cleft Palate‐Craniofacial Journal, 29(2), 112–117. 10.1597/1545-1569_1992_029_0112_csmboc_2.3.co_2 [DOI] [PubMed] [Google Scholar]
- Waitzman, A.A. , Posnick, J.C. , Armstrong, D.C. & Pron, G.E. (1992b) Craniofacial skeletal measurements based on computed tomography: part II. Normal values and growth trends. The Cleft Palate‐Craniofacial Journal, 29(2), 118–128. 10.1597/1545-1569_1992_029_0118_csmboc_2.3.co_2 [DOI] [PubMed] [Google Scholar]
- Wheat, A.D. (2015) Investigating postnatal ontogeny in the craniofacial complex of human juveniles (Ph.D. dissertation, University of Tennessee, Knoxville).
- White, J.E. (2005) A longitudinal study of facial growth in infants using a three‐dimensional imaging technique (Ph.D. dissertation, University of Glasgow, Glasgow).
- Wickham, H. (2016) ggplot2: elegant graphics for data analysis. New York: Springer‐Verlag. ISBN 978‐3‐319‐24277‐4. Available at: http://ggplot2.org [Accessed 15 March 2022]. [Google Scholar]
- Wilson, L. A. B. , & Humphrey, L. T. (2017) Voyaging into the third dimension: A perspective on virtual methods and their application to studies of juvenile sex estimation and the ontogeny of sexual dimorphism. Forensic Science International, 278, 32–46. 10.1016/j.forsciint.2017.06.016 [DOI] [PubMed] [Google Scholar]
Associated Data
This section collects any data citations, data availability statements, or supplementary materials included in this article.
Supplementary Materials
Figure S1
Table S1
Table S2
Table S3
Table S4
Data Availability Statement
The CT data is unavailable for ethical reasons. The raw linear data can be provided upon request.