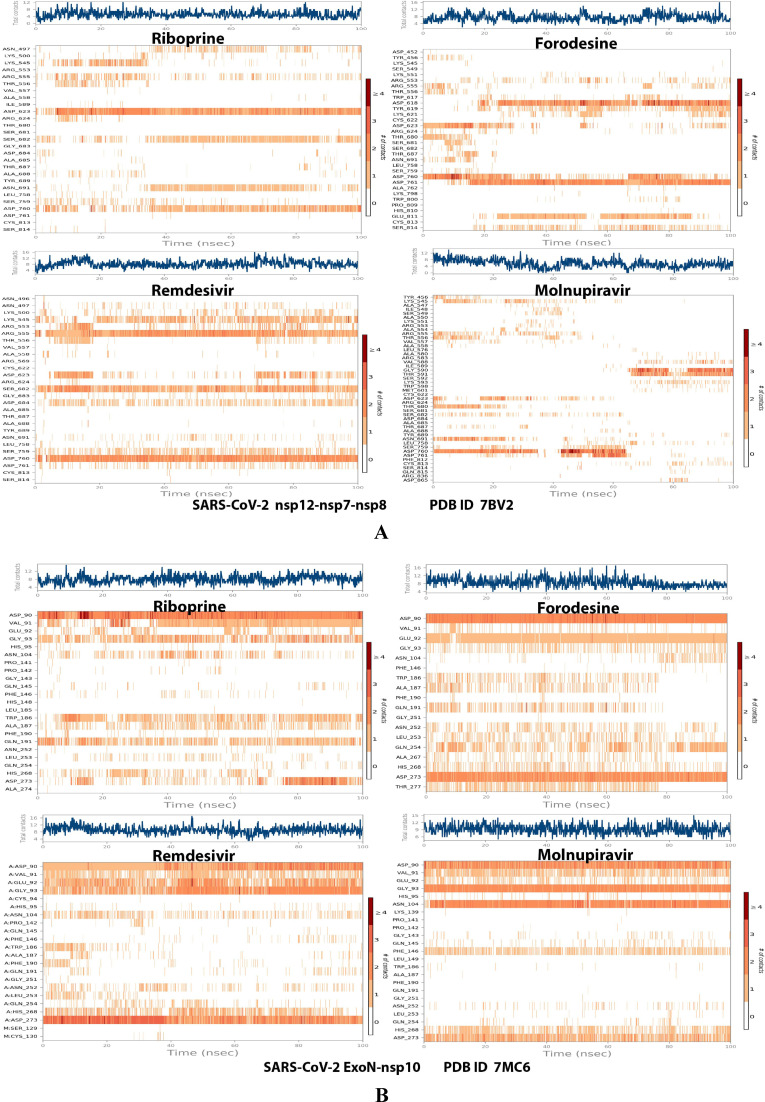
Figure 8.
Plots of the distribution of the total number of interactions (contacts) in each trajectory framework of the protein‐ligand complexes of the two NAs, riboprine and forodesine, and the two reference drugs, remdesivir and molnupiravir, respectively, with: (A) SARS‐CoV‐2 RdRp “nsp12” enzyme cocrystallized with its protein cofactors nsp7 and nsp8 (PDB ID: 7BV2). (B) SARS‐CoV‐2 ExoN “nsp14” enzyme cocrystallized with its protein cofactor nsp10 (PDB ID: 7MC6).

