

Abstract
Severe acute respiratory syndrome coronavirus 2 (SARS‐CoV‐2) has caused a global coronavirus disease 2019 (COVID‐19) pandemic that has affected the lives of billions of individuals. However, the host‐virus interactions still need further investigation to reveal the underling mechanism of SARS‐CoV‐2 pathogenesis. Here, transcriptomics analysis of SARS‐CoV‐2 infection highlighted possible correlation between host‐associated signaling pathway and virus. In detail, cAMP‐protein kinase (PKA) pathway has an essential role in SARS‐CoV‐2 infection, followed by the interaction between cyclic AMP response element binding protein (CREB) and CREB‐binding protein (CBP) could be induced and leading to the enhancement of CREB/CBP transcriptional activity. The replication of Delta and Omicron BA.5 were inhibited by about 49.4% and 44.7% after knockdown of CREB and CBP with small interfering RNAs, respectively. Furthermore, a small organic molecule naphthol AS‐E (nAS‐E), which targets on the interaction between CREB and CBP, potently inhibited SARS‐CoV‐2 wild‐type (WT) infection with comparable the half‐maximal effective concentration (EC50) 1.04 μM to Remdesivir 0.57 μM. Compared with WT virus, EC50 in Calu‐3 cells against Delta, Omicron BA.2, and Omicron BA.5 were, on average, 1.5‐fold, 1.1‐fold, and 1.5‐fold higher, respectively, nAS‐E had a satisfied antiviral effect against Omicron variants. Taken together, our study demonstrated the importance of CREB/CBP induced by cAMP‐PKA pathway during SARS‐CoV‐2 infection, and further provided a novel CREB/CBP interaction therapeutic drug targets for COVID‐19.
Keywords: cAMP‐PKA, CREB/CBP, nAS‐E, SARS‐CoV‐2
1. INTRODUCTION
The pandemic of coronavirus disease 2019 (COVID‐19) has been circulating for more than two and half years throughout the word, leading to over 600 million of confirmed cases and nearly 6.46 million deaths worldwide as reported by the World Health Organization (https://covid19.who.int/, 2022.09.05) and has shown tremendous impacts on globe health and economics. The causative agent of COVID‐19 is a novel coronavirus named as severe acute respiratory syndrome coronavirus 2 (SARS‐CoV‐2). 1 , 2 SARS‐CoV‐2, an enveloped virus with a positive‐strand RNA genome of approximately 30 kb, belongs to the genus Betacoronavirus, family Coronaviridae. 3 , 4 The viral genome contains 14 open reading frames (ORFs) and encodes 29 viral proteins, including 4 structural (spike [S], envelope [E], membrane [M], nucleocapsid [N]), 16 nonstructural, and 9 auxiliary proteins. 4 , 5 Although the major presenting symptoms are fever, cough, fatigue and muscle or body aches, patients with certain comorbidities (cancer, cardiovascular disease and chronic kidney, liver, lung disease, etc.) are at a higher risk of progressing to acute lung injury (ALI) and acute respiratory distress syndrome (ARDS). 6 Until now, though some treatment options and vaccines are available, there still lack effective antiviral agents. Moreover, the emerging SARS‐CoV‐2 variants also pose a great challenge to the protective effect of the existing vaccines. In the long run, finding an effective antiviral medication against the SARS‐CoV‐2 infection is a pressing need. Therefore, discovering the host‐virus dependencies are essential to identify and design effective antiviral therapy strategy.
2. MATERIALS AND METHODS
2.1. Cell culture
Vero E6 (ATCC, CRL‐1586) cells were cultured in Dulbecco's modified Eagle medium (DMEM); Human Calu‐3 (ATCC, HTB‐55) cells were cultured in minimum essential medium (MEM). All media were supplemented with 10% fetal bovine serum (FBS) and containing 100 IU/ml penicillin and 100 μg/ml streptomycin. All cells were cultured at 37°C in a fully humidified atmosphere containing 5% CO2, and have been tested negative for mycoplasma infection.
2.2. Virus preparation
SARS‐CoV‐2 wild‐type (WT) 2019‐nCoV‐WIV04 (IVCAS 6.7512), Delta variant (CSTR:16533.06.IVCAS 6.7593), Omicron BA.2 variant (Omicron‐BA.2‐3‐YQ‐500 μl) and Omicron BA.5 variant (GDPCC‐303‐Omicron‐BA.5‐YQ‐300 μl) were propagated in Vero E6 cells, and virus titers were determined as TCID50/ml in confluent cells in 96‐well microtitre plates. SARS‐CoV‐2 stocks used in the experiments had undergone six passages on Vero E6 cells and were stored at −80°C. All of the infection experiments were performed at BSL‐3.
2.3. RNA extraction and qRT‐PCR
Viral RNA was extracted with QIAamp Viral RNA Mini Kit (Qiagen) according to the manufacturer's instructions. Total RNA was extracted from SARS‐CoV‐2 infected Calu‐3 cells, and the RNA‐seq was implemented by Tsingke Biotechnology Co., Ltd. The quantification of specific gene transcripts was analyzed by one‐step real‐time qRT‐PCR with specific primers and the HiScript II One Step qRT‐PCR SYBR Green Kit (Vazyme) on the Applied Biosystems QuantStudio 6 Flex. The primers based on the N gene of SARS‐CoV‐2 were designed: N‐F, 5′‐GGGGAACTTCTCTTGCTAGAAT‐3′; N‐R, 5′‐CAGACATTTTGCTCTCAAGCTG‐3′. The absolute quantification was calculated by a standard curve line.
2.4. Cell viability assay
Cell viability was evaluated using a Cell Titer‐Glo Luminescent Cell Viability Assay kit (Promega) according to the manufacturer's instructions. In brief, 1 × 10⁴ cells in 100 μl culture medium were seeded into opaque‐walled 96‐well plates for 48 h and 100 μl of Cell Titer‐Glo reagent was added to each well. After a 5‐min shaking and 10‐min incubation, luminescence was measured by GloMax 20/20 (TurnerBio Systems).
2.5. RNA‐mediated interference
Calu‐3 cells in 24‐well plates were transfected with small interfering RNA (siRNA) (20 nM) by using Lipofectamine RNAiMAX reagent (Invitrogen) according to the manufacturer's instruction. The sequences of siRNAs specific for CREB1 were #1 5′‐GCCUGCAAACAUUAACCAUTT‐3′, #2 5′‐CCAACUCCAAUUUACCAAATT‐3′ and for CBP were #1 5′‐GCCAGUGAAUCGCAUGCAATT‐3′, #2 5′‐GCAAGACAUCCCGAGUCUATT‐3′. Nonsilencing siRNA with a scrambled sequence was used as a negative control (siNC). To keep the silencing efficiency for the duration of the test, the cells were transfected with the same siRNA again at 24 h post‐transfection. SARS‐CoV‐2 infection was performed 24 h after the second transfection.
2.6. Immunofluorescent confocal microscopy
A total of 2 × 10⁵ Vero E6 cells were seeded in a glass dish for 24 h. The drugs with different dilution concentrations were mixed with SARS‐CoV‐2 at a multiplicity of infection (MOI) of 0.01 for 36 h. The infected cells were then fixed with 3.7% paraformaldehyde (PFA) at room temperature overnight and permeabilized in 0.5% Triton X‐100 for 10 min at 4°C. Cover slips were blocked in 1% normal goat serum (AR1009; Boster) in phosphate‐buffered saline for 1 h. Samples were then probed with rabbit sera against the SARS‐CoV‐2 nucleoprotein (NP) as the primary antibody and Alexa 488‐labeled donkey anti‐rabbit immunoglobulin G (1:500; Thermo Fisher Scientific) as the secondary antibody, respectively. The nuclei were stained with DAPI, followed by observing glass cover slips using a Perkin Elmer UltraView Vox confocal microscope under a 60× oil objective. Two independent experiments were performed and one representative is shown.
2.7. Western blotting (WB)
Whole‐cell lysates were prepared using a lysis buffer containing 50 mM Tris‐base (pH 7.5), 1 mM EGTA, 1 mM ethylenediaminetetraacetic acid (EDTA), 1% Triton X‐100, 150 mM NaCl, 100 µM phenylmethylsulfonyl fluoride (PMSF) and protease inhibitors (Roche) for 30 min in ice. Cell lysates were centrifuged at 14 000g for 10 min at 4°C. The supernatants were recovered and followed by denaturation at 95°C for 10 min. Each sample was resolved by sodium dodecyl sulfate–polyacrylamide gel electrophoresis and transferred to nitrocellulose. Membranes were blocked with TBST (pH 7.4, containing 0.1% Tween‐20) containing 5% skimmed milk for 1 h at room temperature, followed by incubation with the SARS‐CoV‐2 NP (40143‐V08B; SinoBiological) as the primary antibody overnight at 4°C. Membranes were washed and incubated for 1 h at room temperature with the horseradish peroxidase‐conjugated secondary antibodies. Membranes were imaged using the FluorChem HD2 system (Alpha Innotech). Images were analysed using AlphaEaseFC software (Alpha Innotech).
2.8. Differentially expressed genes (DEGs) analysis
DEGs analysis was performed using the DESeq2 R package (1.26.0). DESeq2 provide statistical routines for determining differential expression in digital gene expression data using a model based on the negative binomial distribution. The resulting p values were adjusted using the Benjamini and Hochberg's approach for controlling the false discovery rate (FDR). Genes with FDR <0.05 and |log2(foldchange)| ≥1 found by DESeq2 were assigned as differentially expressed.
2.9. Principal component analysis (PCA)
PCA was performed via ggbiplot package to visualize the pattern of distribution of samples. The expression levels of all genes that passed the quality control process from RNA sequencing of eight samples were imported into ggbiplot package. Images of PCA were generated to visualize the distribution differences.
2.10. Fuzzy C‐means (FCMs) clustering
DEGs from different infection time point were grouped into different clusters using the FCMs algorithm in the Mfuzz package. The number of clusters was set to 6.
2.11. Functional analysis
Genes of identified clusters were uploaded to Metascape (https://metascape.org/), which facilitates comparative analyses of Reactome pathway enrichment analyses. The ClusterProfiler package was used to conduct functional enrichment. The bubble diagram was used to visualize the first 20 functional pathways with significance. The size of the point in the diagram represented the number of differentially annotated genes in the functional pathway, and the depth of color represented the enrichment significance of the functional pathway.
2.12. Molecular docking
Molecular docking of CREB/CBP complex with naphthol AS‐E (nAS‐E) was performed using a workflow application of Glide (v.8.2) 7 in Maestro (Schrödinger). The three‐dimensional (3D) conformation of nAS‐E was generated by the ligPrep module of Maestro. The structure of CREB/CBP complex (PDB: 1KDX) was used to generate the receptor grid for docking simulation. The structure figures were generated using UCSF ChimeraX. 8
3. RESULTS
3.1. cAMP‐protein kinase A (PKA) pathway involved in SARS‐CoV‐2 infection
To understand the role of host genes during SARS‐CoV‐2 infection, we systematically monitored gene expression profiles with Delta SARS‐CoV‐2 infection at indicated time point in Calu‐3 cells based on RNA sequencing (RNA‐seq) (Figure 1A). First, we compared the DEGs based on time‐series clustering analysis with SARS‐CoV‐2 infection. PCA of the gene expression profiles revealed that the mock and 24 h postinfection (h.p.i.) samples closely clustered together, while the cluster of 48 h.p.i. and 72 h.p.i. were further separated compared with 24 h.p.i. (Figure S1a). Then, we applied the FCMs algorithm to realize the temporal clustering which can be divided into six clusters, indicating different expression kinetics, and the quantity DEGs of each cluster was illustrated in Figure 1B. Among these, clusters 1, 2, 3, 4, and 5 represent genes displayed a bi‐modal expression pattern, whereas cluster 6 represent genes that are upregulated (Figure 1B). Meanwhile, unsupervised hierarchical clustering of genes in different temporal clusters were showed as heatmaps in Figure S1b. The same trend can be recapitulated, consistently with figure 1B. These analysis results indicated that the gene expression profile encountered a major shift at 48 h.p.i.
Figure 1.
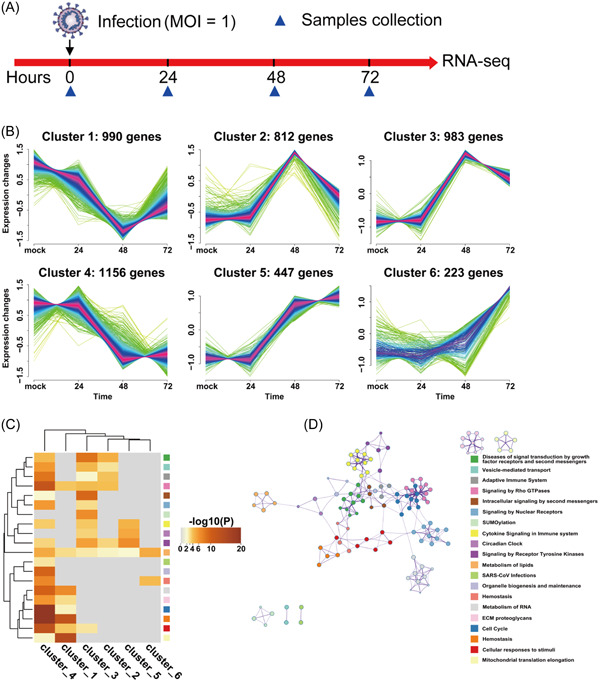
cAMP‐PKA pathway involved in SARS‐CoV‐2 infection. (A) Experiment scheme in Delta SARS‐CoV‐2‐infected Calu‐3 cells. (B) Fuzzy c‐means clustering identified six distinct temporal clusters of genes expression. The x‐axis represents four infection time points, while the y‐axis represents expression change of differentially expressed genes. The number represents the number of genes in each cluster. (C) Functional enrichment analysis for genes in different clusters using Metascape. Top 20 terms are displayed. Bar graph of enriched terms colored by p values. (D) Network of enriched terms. Each term is represented by a circle node, and the color of each node represents its cluster identity. PKA, protein kinase A; SARS‐CoV‐2, severe acute respiratory syndrome coronavirus 2.
To further investigate the functional of overlapping DEGs in different clusters, we analyzed top 20 terms in the biological process (BP). Gene ontology (GO) analysis of genes from each cluster revealed that the DEGs tend to enriched in pathways, including cell cycle, hemostasis, cellular response to stimuli, mitochondrial translation elongation, intracellular signaling by second messenger and signaling by Rho GTPases (Figure 1C). In addition, the signaling of metabolism of lipids were enriched in all clusters indicated that metabolism of lipids plays an essential role in regulating SARS‐CoV‐2 infection which was consistent with previous reports 9 , 10 , 11 , 12 (Figure 1C). Furthermore, the interaction between enriched terms were analyzed by establishing pathway interaction network. We obtained a 123‐nodes network. After removing the individual nodes, we found a core network of second messengers signaling. The hub pathway of the network was cAMP‐PKA signaling pathway (Figure 1D).
3.2. CREB/CBP participated in SARS‐CoV‐2 infection
To further exploring the detail mechanism in cAMP‐PKA signaling pathway regulating SARS‐CoV‐2, the cAMP content was first measured with virus infection. cAMP content was significantly increased with viral infection, although it slightly reduced at 48 h.p.i. SARS‐CoV‐2 infection induced the cAMP accumulation with time postinfection indicated that the cAMP relevance signaling including receptor tyrosine kinases (RTKs) and G‐protein coupled receptors (GPCRs) pathway were indeed participated in modulating SARS‐CoV‐2 infection (Figure 2A). Then WB assay was performed. The results showed that phosphorylation of AKT at Ser 473 and phosphorylation of PKA at Thr 197 were induced by SARS‐CoV‐2 in Calu‐3 cells indicating that SARS‐CoV‐2 infection involves stimulation cAMP‐PKA and PI3K‐AKT signaling pathways. An increase of phospho‐CREBSer133 levels were detected during virus infection, which also results in the expression of survival factors Bcl‐2 (Figure 2B). The phosphorylation and subsequent activation of the cyclic AMP response element binding protein (CREB) start with extracellular signals through a variety of intracellular oncogenic protein serine/threonine kinases including cAMP‐PKA and PI3K‐AKT. CREB is a signal‐dependent transcription factor that exerts its positive effects on gene transcription of a broad range of genes by recruiting coactivators including CREB‐binding protein (CBP), its paralog p300. 13 An essential step for activation of CREB‐dependent gene transcription is to recruit CBP. 14 To determine whether an association was exited between CREB and CBP with SARS‐CoV‐2 infection in Calu‐3 cells. Co‐immunoprecipitation (Co‐IP) analysis showed that the interaction between CREB and CBP only occurred when infected with SARS‐CoV‐2 rather than control cell without infection (Figure 2C).
Figure 2.
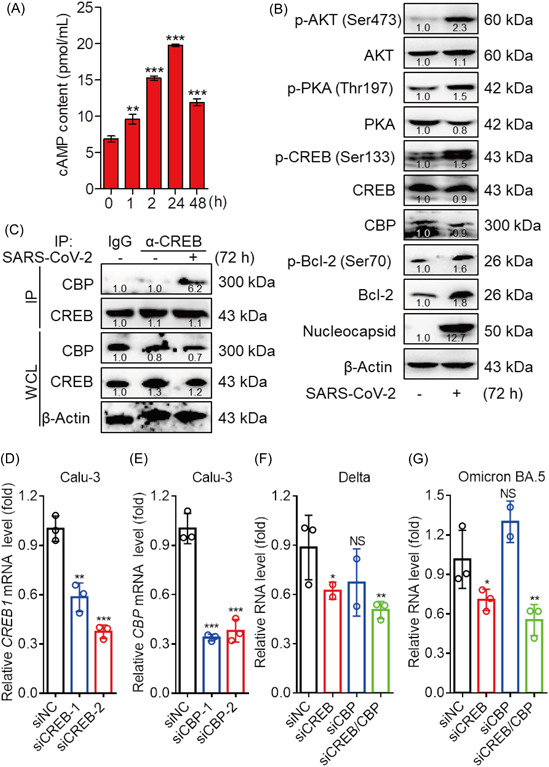
CREB/CBP participated in SARS‐CoV‐2 infection. (A) SARS‐CoV‐2 infection upregulated cAMP production in Calu‐3 cells. The Calu‐3 cells were infected with the SARS‐CoV‐2 at a MOI of 0.01 for the indicated time point. cAMP content was measured by a commercially available kit (ab133051; Abcam). Data represent mean ± SD of two independent experiments performed in duplicate. Data were fit to a sigmoidal dose‐response curve by using GraphPad Prism software. (B) Immunoblotting (IB) analysis of phosphorylated (p‐) or total AKT, PKA, CREB, Bcl2, and CBP, Nucleocapsid or β‐actin (loading control throughout) during SARS‐CoV‐2 infection in Calu‐3 cells. (C) Endogenous interactions between CREB and CBP. Calu‐3 cells were left uninfected infected with SARS‐CoV‐2 (MOI = 0.01) for 72 h before Co‐IP and IB analysis. (B, C) The relative intensity of each protein was quantified using ImageJ. (D–E), Calu‐3 cells were transfected with siRNAs targeting CREB1 or/and CBP mRNA transcripts. The CREB1 (D) and CBP (E) mRNA levels were measured at 48 h posttransfection. A nontargeting siRNA (siNC) as a negative control. (F, G) At 48 h posttransfection, Calu‐3 cells were infected with SARS‐CoV‐2 Delta (F) or Omicron BA.5 (G) variant for 24 h (MOI of 0.1). The intracellular viral RNA was quantified by qRT‐PCR. The data are presented as the means ± SD. No significance (NS), *p < 0.05, **p < 0.01, ***p < 0.001. CBP, CREB‐binding protein; MOI, multiplicity of infection; mRNA, messenger RNA; SARS‐CoV‐2, severe acute respiratory syndrome coronavirus 2; siRNA, small interfering RNA.
To confirm the specific role of CREB/CBP in SARS‐CoV‐2 infection, two human CREB or CBP specific small interfering RNAs (siRNAs) (siCREB‐1, siCREB‐2 and siCBP‐1, siCBP‐2) were synthesized, and the target genes of CREB or CBP could be knocked down efficiently with siRNA, respectively (Figure 2D,E). Calu‐3 cells were infected with SARS‐CoV‐2 Delta or Omicron BA.5 variants after 48 h posttransfection of siCREB or/and siCBP. As shown in figure 2F,G, the replication of Delta or Omicron BA.5 were decreased by about 49.4% and 44.7% compared with siNC, respectively. Next, clustering heatmaps of DEGs were selected from the predicted CREB1 target genes by the Cistrome database. Our results showed that there were 92 DEGs (30 upregulated genes and 62 downregulated genes) which predicated as CREB1 target genes (Figure S1c). GO analysis of BP on the upregulated genes indicated that nitrogen compound metabolic process, nucleobase‐containing and compounds bio‐synthetic process play a role in regulating SARS‐CoV‐2 infection. Meanwhile, GO analysis of molecular function (MF) on upregulated genes showed that the CREB1 targeted genes in SARS‐CoV‐2‐infected cells were mainly focus on double‐stranded DNA binding (Figure S1d). Whereas, GO analysis of the downregulated DEGs which showed no significantly difference of p value (around 0.1) revealed that cell cycle progress in BP, organelle membrane in cellular components (CC) and catalytic activity in MF might have a relevance with SARS‐CoV‐2 infection (Figure S1e). Take these results together, it was suggested that CREB/CBP modulates SARS‐CoV‐2 infection, and viral infection enhances the transcriptional activity of CREB/CBP.
3.3. nAS‐E had a significant inhibitory effect on SARS‐CoV‐2 infection
The CREB/CBP interaction is mediated by kinase‐inducible domain (KID) from CREB and KIX (KID‐interacting) domain from CBP. 15 Previous studies have identified a small‐molecule inhibitors of KID‐KIX interaction named nAS‐E. 13 , 16 The chemical structure of nAS‐E was shown in Figure 3A. We observed an interaction between nAS‐E and KIX (CBP) based on the docking results (Figure 3B). To further understand the basis of the inhibition of KIX‐KID interaction by nAS‐E, a molecular docking simulation against KID (pCREB) binding interface on KIX (CBP) was performed to identify the binding mode of nAS‐E. The results showed that nAS‐E was tightly confined within a hydrophobic pocket in CREB/CBP complex, consistently with previous reports 17 (Figure 3C). Then, the antiviral activity of nAS‐E against SARS‐CoV‐2 WT was first examined in Vero E6 cells (Figure 3D). The results showed that nAS‐E had an antiviral potency of the half‐maximal effective concentration (EC50) = 1.04 μM, a little weaken than Remdesivir (EC50 = 0.57 μM), and its pro‐drug KG‐501 showed less inhibition of EC50 = 2.25 μM. Additionally, drug effects were further evaluated by quantification of EC50 and the half‐cytotoxic concentration (CC50) of nAS‐E infected with SARS‐CoV‐2 in Calu‐3 cells. The selectivity index (SI) was calculated by CC50/EC50. As shown in Figure 3E,F, nAS‐E exhibited a clear antiviral affect against SARS‐CoV‐2 WT (EC50 = 1.12 μM, CC50 >100 μM, SI >89.29) and variant Delta (EC50 = 1.71 μM, CC50 >100 μM, SI >58.48) in Calu‐3 cells.
Figure 3.
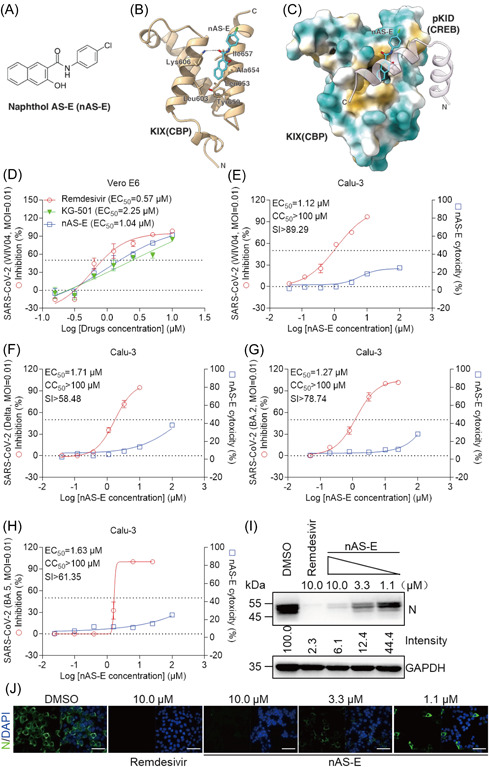
nAS‐E had a significant inhibitory effect on SARS‐CoV‐2 infection. (A) The chemical structure of naphthol AS‐E (nAS‐E). (B) The docking result of nAS‐E with CBP. The structure of CBP is shown as an orange cartoon, nAS‐E is shown as blue sticks and residues predicted to be interacting with nAS‐E are shown as sticks. (C) The docking result of nAS‐E with CREB/CBP complex. The structure of CBP is shown as surface (hydrophobic residues are colored yellow and hydrophilic residues are colored cyan), CREB is shown as a pink cartoon with transparency and nAS‐E is shown as blue sticks. (D–H) Vero E6 and Calu‐3 cells were infected with SARS‐CoV‐2 original strain WIV04 (D, E), SARS‐CoV‐2 variant Delta (F), Omicron BA.2 (G) or Omicron BA.5 (H) at a MOI of 0.01 in the treatment of different doses of the Remdesivir or nAS‐E for 48 h. The viral yield in the cell supernatant was quantified by qRT‐PCR. n = 3 biological replicates. (E–H) Cytotoxicity of these drugs to different cells was measured by a cell Titer‐Glo luminescent cell viability assays. n = 3 biological replicates. The y‐axis of the graphs represent % inhibition of virus yields or cytotoxicity of the drugs. (I) Immunofluorescence assay of SARS‐CoV‐2 infection upon treatment of the Remdesivir or nAS‐E. Virus infection and drug treatment were performed as mentioned above. Nucleocapsid, N. Bars, 50 μm. (J) Calu‐3 cells were infected with SARS‐CoV‐2 Delta strain at a MOI of 0.01 in the treatment of different doses of the Remdesivir or nAS‐E for 48 h. Western blotting assay was performed upon treatment of the Remdesivir or nAS‐E. The experiments were done in duplicates. Data are shown as mean ± SD. CBP, CREB‐binding protein; GAPDH, glyceraldehyde 3‐phosphate dehydrogenase; MOI, multiplicity of infection; SARS‐CoV‐2, severe acute respiratory syndrome coronavirus 2; siRNA, small interfering RNA.
Novel SARS‐CoV‐2 variants of concern rapidly emerge. In January 2022 the two recent Omicron lineages, BA.4 and BA.5 appeared in South Africa, which were also epidemically in China. 18 Next, the antiviral effect of nAS‐E with Omicron BA.2 or BA.5 were examined. The results showed that nAS‐E also have a good antiviral affect against SARS‐CoV‐2 variant Omicron BA.2 (EC50 = 1.27 μM, CC50 >100 μM, SI >78.74) and even against Omicron BA.5 (EC50 = 1.63 μM, CC50 >100 μM, SI >61.35) in Calu‐3 cells (Figure 3G,H). These results showed that nAS‐E have a spectrum broad role in anti‐SARS‐CoV‐2. We further did immuno‐florescent assay to visualize the drug potencies against SARS‐CoV‐2. The data in Figure 3I showed that the expression of SARS‐CoV‐2 nucleocapsid (N) protein were markedly inhibited and occurred in a dose‐dependent manner. Meanwhile, the N protein expression could be obliterated with the treatment of nAS‐E at 10 μM, corresponding to the results of Remdesivir (10 μM) on SARS‐CoV‐2 (Figure 3J). Consistently, the N expression in nAS‐E was significantly lower than the control (dimethyl sulfoxide) by WB analysis. Collectively, these results suggested that the small‐molecule inhibitors nAS‐E has a significant inhibitory effect against SARS‐CoV‐2 infection.
4. DISCUSSION
SARS‐CoV‐2, causative pathogen of the COVID‐19 pandemic, exerts a massive health and socioeconomic crisis. SARS‐CoV‐2 infection disrupts molecular processes required for normal lung homeostasis leading to impaired pulmonary function. It is reported that the pathway of lipid metabolism, immune response, RNA processing, translation, and protein trafficking play an essential role in SARS‐CoV‐2. 9 , 19 We performed RNA‐seq analysis based on the expression profiling and biological pathway with time postinfection of SARS‐CoV‐2. We found that those clusters, which are closely associated with coronavirus infection, are more likely enriched in second messengers signaling. Further, we detected that cAMP‐PKA pathway indeed participated, which induced the activation of downstream transcription factor CREB1.
CREB was well‐known as a nuclear transcription factor playing a key role in cancer. Small organic molecules with good pharmacokinetic properties and specificity, targeting CREB/CBP interaction to inhibit CREB mediated gene transcription would be better applied as cancer therapeutics. 17 Based on our results, we believed that SARS‐CoV‐2 infection increased cAMP levels and activated PKA‐CREB/CBP signaling pathway, which might have a role in the regulation of endocytosis during viral infection. 20 This study revealed that the interaction between CREB/CBP and various CREB1 target genes could be induced leading to the enhancement of CREB/CBP transcriptional activity during SARS‐CoV‐2 infection. Meanwhile, knockdown of CREB/CBP also inhibited viral replication in certain degree. In addition, we used a potent inhibitor nAS‐E to inhibit SARS‐CoV‐2 infection including WT, Delta, Omicron BA.2 and Omicron BA.5 through interrupting CREB/CBP interaction.
In summary, our study provided the first demonstration that CREB/CBP associated cAMP‐PKA pathway play a role in modulating SARS‐CoV‐2 infection, and found a small molecules nAS‐E represents a novel and promising treatment against SARS‐CoV‐2. It is expected that our results may help for developing novel CREB/CBP interaction therapeutic agents to treat COVID‐19.
AUTHOR CONTRIBUTIONS
Qi Yang and Xinwen Chen: conceived and designed the experiments. Qi Yang, Jielin Tang, and Juan Cao: carried out the experiments and analyzed the data. Fengjiang Liu: performed the docking result of nAS‐E with CREB/CBP complex. Bao Xue: conducted small interfering RNA experiments. Muqing Fu, Anqi Zhou, Sijie Chen, and Junjun Liu: contributed to the critical discussions. Yuan Zhou: helped with project management. Yongxia Shi and Wei Peng: supplied BSL‐3 laboratory and strain resources. Jielin Tang, Qi Yang, and Xinwen Chen: wrote the manuscript.
CONFLICTS OF INTEREST
The authors declare no conflicts of interest.
Supporting information
Fig. S1 SARS‐CoV‐2 infection enhanced the transcriptional activity of CREB. a, Principal component analysis (PCA) plot from the transcriptome of SARS‐CoV‐2‐infected Calu‐3 cells. Different colors correspond to infection time points. PCA plots were derived from expression data for all genes obtained by RNA‐seq. b, Unsupervised hierarchical clustering of genes in different temporal clusters. c, Clustering heatmap of CREB1 target genes. Differentially expressed genes were selected from the predicted CREB1 target genes by the Cistrome database, and their gene expression levels were used for clustering heatmaps. d‐e, Gene ontology (GO) analysis for SARS‐CoV‐2‐infected Calu‐3 cells on the upregulated (d) or downregulated (e) gene. Curated (by redundancy) enriched GO terms are shown. BP, GO biological process. MF, GO molecular function. CC, GO cellular component.
ACKNOWLEDGMENTS
We acknowledge the BSL‐3 laboratory and the Core Facility Center of Wuhan Institute of Virology, and Guangzhou Customs District Technology Center for continuous and generous support. We thank B. Wang for analysis of the RNA‐seq data; we thank L. Zhang and D. Gao for advice and assistance. This work was supported by the National Natural Science Foundation of China (32000111 to Q. Yang), Basic and Applied Basic Research Projects of Guangzhou Basic Research Program (SL2023A04J00076 to Q. Yang and 202201010594 to J. L. Tang).
Yang Q, Tang J, Cao J, et al. SARS‐CoV‐2 infection activates CREB/CBP in cellular cyclic AMP‐dependent pathways. J Med Virol. 2022;95:e28383. 10.1002/jmv.28383
Qi Yang, Jielin Tang, and Juan Cao contributed equally to this work.
Contributor Information
Qi Yang, Email: yang_qi@gzlab.ac.cn.
Xinwen Chen, Email: chen_xinwen@gzlab.ac.cn.
DATA AVAILABILITY STATEMENT
All data, materials, and methods are included in this paper.
REFERENCES
- 1. Zhou P, Yang XL, Wang XG, et al. A pneumonia outbreak associated with a new coronavirus of probable bat origin. Nature. 2020;579(7798):270‐273. [DOI] [PMC free article] [PubMed] [Google Scholar]
- 2. Zhu N, Zhang D, Wang W, et al. A novel coronavirus from patients with pneumonia in China, 2019. N Engl J Med. 2020;382(8):727‐733. [DOI] [PMC free article] [PubMed] [Google Scholar]
- 3. Kim D, Lee JY, Yang JS, Kim JW, Kim VN, Chang H. The architecture of SARS‐CoV‐2 transcriptome. Cell. 2020;181(4):914‐921. [DOI] [PMC free article] [PubMed] [Google Scholar]
- 4. Harrison AG, Lin T, Wang P. Mechanisms of SARS‐CoV‐2 transmission and pathogenesis. Trends Immunol. 2020;41(12):1100‐1115. [DOI] [PMC free article] [PubMed] [Google Scholar]
- 5. Yang H, Rao Z. Structural biology of SARS‐CoV‐2 and implications for therapeutic development. Nat Rev Microbiol. 2021;19(11):685‐700. [DOI] [PMC free article] [PubMed] [Google Scholar]
- 6. He J, Cai S, Feng H, et al. Single‐cell analysis reveals bronchoalveolar epithelial dysfunction in COVID‐19 patients. Protein Cell. 2020;11(9):680‐687. [DOI] [PMC free article] [PubMed] [Google Scholar]
- 7. Friesner RA, Banks JL, Murphy RB, et al. Glide: a new approach for rapid, accurate docking and scoring. 1. method and assessment of docking accuracy. J Med Chem. 2004;47(7):1739‐1749. [DOI] [PubMed] [Google Scholar]
- 8. Goddard TD, Huang CC, Meng EC, et al. UCSF ChimeraX: meeting modern challenges in visualization and analysis. Prot Sci. 2018;27(1):14‐25. [DOI] [PMC free article] [PubMed] [Google Scholar]
- 9. He X, Liu C, Peng J, et al. COVID‐19 induces new‐onset insulin resistance and lipid metabolic dysregulation via regulation of secreted metabolic factors. Signal Transduct Target Ther. 2021;6(1):427. [DOI] [PMC free article] [PubMed] [Google Scholar]
- 10. Song JW, Lam SM, Fan X, et al. Omics‐driven systems interrogation of metabolic dysregulation in COVID‐19 pathogenesis. Cell Metab. 2020;32(2):188‐202. [DOI] [PMC free article] [PubMed] [Google Scholar]
- 11. Reiterer M, Rajan M, Gómez‐Banoy N, et al. Hyperglycemia in acute COVID‐19 is characterized by insulin resistance and adipose tissue infectivity by SARS‐CoV‐2. Cell Metab. 2021;33(11):2174‐2188. [DOI] [PMC free article] [PubMed] [Google Scholar]
- 12. Pei R, Feng J, Zhang Y, et al. Host metabolism dysregulation and cell tropism identification in human airway and alveolar organoids upon SARS‐CoV‐2 infection. Protein Cell. 2021;12(9):717‐733. [DOI] [PMC free article] [PubMed] [Google Scholar]
- 13. Clark MD, Kumar GS, Marcum R, Luo Q, Zhang Y, Radhakrishnan I. Molecular basis for the mechanism of constitutive CBP/p300 coactivator recruitment by CRTC1‐MAML2 and its implications in cAMP signaling. Biochemistry. 2015;54(35):5439‐5446. [DOI] [PMC free article] [PubMed] [Google Scholar]
- 14. Cardinaux JR, Notis JC, Zhang Q, et al. Recruitment of CREB binding protein is sufficient for CREB‐mediated gene activation. Mol Cell Biol. 2000;20(5):1546‐1552. [DOI] [PMC free article] [PubMed] [Google Scholar]
- 15. Radhakrishnan I, Pérez‐Alvarado GC, Parker D, Dyson HJ, Montminy MR, Wright PE. Solution structure of the KIX domain of CBP bound to the transactivation domain of CREB: a model for activator:coactivator interactions. Cell. 1997;91(6):741‐752. [DOI] [PubMed] [Google Scholar]
- 16. Li BX, Xie F, Fan Q, et al. Novel type of prodrug activation through a Long‐Range O,N‐Acyl transfer: a case of water‐soluble CREB inhibitor. ACS Med Chem Lett. 2014;5(10):1104‐1109. [DOI] [PMC free article] [PubMed] [Google Scholar]
- 17. Jiang M, Yan Y, Yang K, et al. Small molecule nAS‐E targeting cAMP response element binding protein (CREB) and CREB‐binding protein interaction inhibits breast cancer bone metastasis. J Cell Mol Med. 2019;23(2):1224‐1234. [DOI] [PMC free article] [PubMed] [Google Scholar]
- 18. Mackenzie C, Batty M, Papadakis G, et al. Analytical sensitivity of lateral flow devices against SARS‐CoV‐2 Omicron subvariants BA.4, BA.5, and BA.2.75. J Clin Microbiol. 2022:e0109722. [DOI] [PMC free article] [PubMed] [Google Scholar]
- 19. Hekman RM, Hume AJ, Goel RK, et al. Actionable cytopathogenic host responses of human alveolar type 2 cells to SARS‐CoV‐2. Mol Cell. 2021;81(1):212. [DOI] [PMC free article] [PubMed] [Google Scholar]
- 20. Aslam M, Ladilov Y. Targeting the sAC‐Dependent cAMP pool to prevent SARS‐Cov‐2 infection. Cells. 2020;9(9):1962. [DOI] [PMC free article] [PubMed] [Google Scholar]
Associated Data
This section collects any data citations, data availability statements, or supplementary materials included in this article.
Supplementary Materials
Fig. S1 SARS‐CoV‐2 infection enhanced the transcriptional activity of CREB. a, Principal component analysis (PCA) plot from the transcriptome of SARS‐CoV‐2‐infected Calu‐3 cells. Different colors correspond to infection time points. PCA plots were derived from expression data for all genes obtained by RNA‐seq. b, Unsupervised hierarchical clustering of genes in different temporal clusters. c, Clustering heatmap of CREB1 target genes. Differentially expressed genes were selected from the predicted CREB1 target genes by the Cistrome database, and their gene expression levels were used for clustering heatmaps. d‐e, Gene ontology (GO) analysis for SARS‐CoV‐2‐infected Calu‐3 cells on the upregulated (d) or downregulated (e) gene. Curated (by redundancy) enriched GO terms are shown. BP, GO biological process. MF, GO molecular function. CC, GO cellular component.
Data Availability Statement
All data, materials, and methods are included in this paper.