

Abstract
In the United States, even though national guidelines for allocating scarce healthcare resources are lacking, 26 states have specific ventilator allocation guidelines to be invoked in case of a shortage. While several states developed their guidelines in response to the recent COVID‐19 pandemic, New York State developed these guidelines in 2015 as “pandemic influenza is a foreseeable threat, one that we cannot ignore.” The primary objective of this study is to assess the existing procedures and priority rules in place for allocating/rationing scarce ventilator capacity and propose alternative (and improved) priority schemes. We first build machine learning models using inpatient records of COVID‐19 patients admitted to New York‐Presbyterian/Columbia University Irving Medical Center and an affiliated community health center to predict survival probabilities as well as ventilator length‐of‐use. Then, we use the resulting point estimators and their uncertainties as inputs for a multiclass priority queueing model with abandonments to assess three priority schemes: (i) SOFA‐P (Sequential Organ Failure Assessment based prioritization), which most closely mimics the existing practice by prioritizing patients with sufficiently low SOFA scores; (ii) ISP (incremental survival probability), which assigns priority based on patient‐level survival predictions; and (iii) ISP‐LU (incremental survival probability per length‐of‐use), which takes into account survival predictions and resource use duration. Our findings highlight that our proposed priority scheme, ISP‐LU, achieves a demonstrable improvement over the other two alternatives. Specifically, the expected number of survivals increases and death risk while waiting for ventilator use decreases. We also show that ISP‐LU is a robust priority scheme whose implementation yields a Pareto‐improvement over both SOFA‐P and ISP in terms of maximizing saved lives after mechanical ventilation while limiting racial disparity in access to the priority queue.
Keywords: COVID‐19, fairness, machine learning, multiclass queueing with abandonments, priority scheduling, resource allocation, scarce ventilator capacity
1. INTRODUCTION
The COVID‐19 pandemic has adversely impacted public health outcomes and economies across the globe. As of the end of November 2021, the United States had reported over 47 million cases and over 770,000 deaths due to the COVID‐19 pandemic (Johns Hopkins, 2021). National and private health systems as well as individual healthcare providers have all reacted, preparing the best they can for a large case load of COVID‐19 patients. Nevertheless, acquiring requisite resources such as ventilators that are critical for patients' survival during treatment had proven difficult for numerous reasons such as logistical challenges, (lack of) maintenance of stockpiles, or politics. As a result, several healthcare providers had to ration ventilator use, first evidenced by the well‐publicized and dramatic shortages in Italy (Beall, 2020), and more recently in several states across the United States such as Idaho (Boone, 2021).
Reflective of the decentralized management of healthcare in the United States, there are no national guidelines for allocating ventilators during a pandemic. Instead, 26 states have developed specific ventilator allocation guidelines to be invoked in case of a shortage (Piscitello et al., 2020). Several of these guidelines have recently been enacted or revised to reflect the challenges healthcare providers have experienced during the COVID‐19 pandemic. For example, Idaho and Minnesota updated their guidelines during the pandemic in late 2020 and in August 2021, respectively. In contrast, New York State (NYS) developed their guidelines in 2015 as “pandemic influenza is a foreseeable threat, one that we cannot ignore” (New York State Department of Health, 2015).
We summarize the key features of the ventilator allocation guidelines for these three states in Figure 1, which share some similarities. For example, all three involve triaging patients into priority‐of‐use categories with a focus on improving patients' odds of surviving the acute phase of the health condition that necessitates mechanical ventilation. However, they do not consistently use the same parameters to triage patients. For example, Minnesota guidelines use the Sequential Organ Failure Assessment (SOFA) score (Ferreira et al., 2001; Piscitello et al., 2020; Vincenta, 2020) to assess how critical mechanical ventilation is for a patient. These guidelines also attempt to link survival odds to ventilator length‐of‐use (LOU), but assume patients with lower SOFA scores would use the ventilators for a shorter duration. On the other hand, NYS guidelines rely primarily on SOFA scores and do not take into account ventilator LOU. Finally, Idaho guidelines make no mention of either SOFA scores or ventilator LOU, and instead rely on clinical judgment.
FIGURE 1.
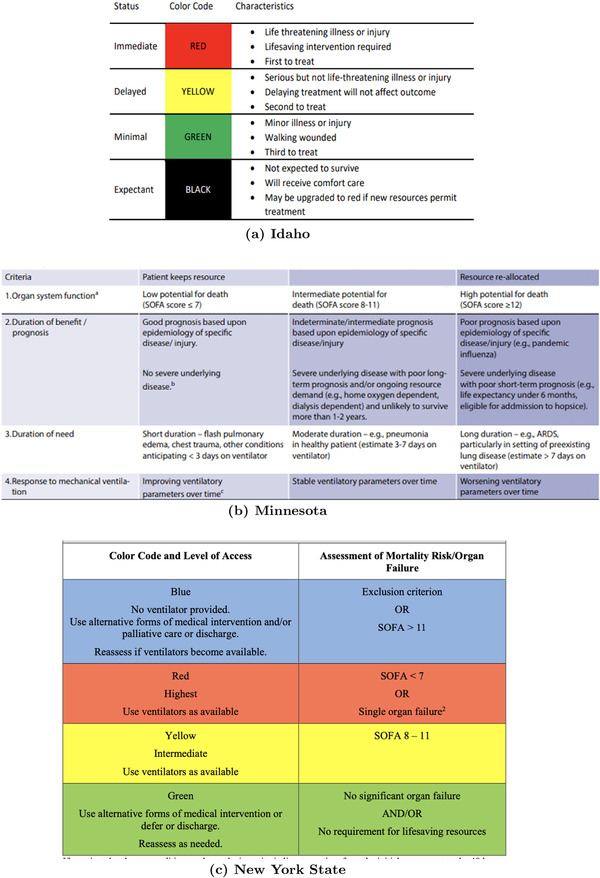
Critical standards of care and ventilator allocation rules in (a) Idaho as of late 2020, (b) Minnesota as of August 2021, and (c) New York State as of 2015
Given varied critical standards of care across different states regarding how ventilators should be allocated, the primary objective of this study is to assess the existing procedures and priority rules in place for allocating/rationing scarce ventilator capacity and to propose alternative (and improved) priority schemes. Specifically, our predictive analysis seek to identify factors beyond SOFA scores to assess mortality risk and ventilator LOU, and our prescriptive analysis seeks ways to best utilize these factors to support triage decisions.
1.1. NYS ventilator allocation guidelines and proposed priority schemes
As the data for our analysis come from COVID‐19 patients admitted to a major hospital system in New York City, we next describe the existing NYS ventilation allocation guidelines in more detail. Similar to the guidelines across other states, what underlies the NYS triage process is a multistep assessment of patient mortality risk, which yields a priority clustering of patients. In NYS, the prioritization step of the triage process produces four color‐coded clusters: BLUE, RED, YELLOW, and GREEN. 1 These clusters are obtained following an assessment of mortality risk using the SOFA score. The SOFA score measures how well each of the six organ systems (i.e., respiratory, coagulation, liver, cardiovascular, renal, and neurologic) function by assigning 0–4 points per system, thus yielding a total score out of 24 points. The higher the SOFA score of a patient is, the worse their condition is. Accordingly, BLUE patients with SOFA scores exceeding 11 are excluded from ventilator eligibility due to their low probability of survival, even with ventilator use. GREEN patients are eligible for future ventilator use; however, as they are already likely to survive with treatments that do not involve ventilator use, it is unlikely that they would be assigned a ventilator particularly when the capacity is severely scarce. RED patients are those with SOFA scores below 7, for whom immediate ventilator use is critically essential, and thus are immediately eligible for a ventilator assignment. Finally, YELLOW patients are patients with SOFA scores between 8 and 11, who are also in need of immediate ventilator use, but would be allocated a ventilator only if all RED patients had already been assigned a ventilator. It is of note that YELLOW patients are in worse health conditions relative to RED patients; however, RED patients receive priority as they are more likely to survive as a result of ventilator use relative to YELLOW patients.
A critical feature of this triage process is that when a ventilator allocation decision is to be made, if capacity is insufficient and thus rationing among patients within the same color‐coded category is necessary, the next patient who would be assigned a ventilator is determined via a lottery. Evidently, this feature indicates a desire to maintain a notion of fairness among patients with comparable health conditions. However, this random lottery feature restricts the opportunity to rank patients within the RED and YELLOW categories. Therefore, selecting a priority scheme that initially places a patient in the RED queue or the YELLOW queue is a critical decision to improve the ventilator allocation process. Further prioritization within the RED and YELLOW queues and/or dynamically reassessing and revising patients' medical conditions and priority may be opportunities for further optimization. Yet, such changes would imply a significant overhaul of the entire process, and likely meet resistance from medical policy makers and triage teams. Therefore, we keep the existing triage process flows intact, and focus on assessing the effectiveness of the existing “SOFA score based prioritization” (SOFA‐P) priority scheme and propose two additional alternatives.
Among the priority schemes we consider in this study, SOFA‐P most closely mimics the existing ventilator allocation process in NYS and some other states in the United States, and assigns patients with SOFA scores below 7 to the RED queue. However, as most COVID‐19 patients suffer from single organ system failure, their SOFA scores typically cluster around 4. Therefore, SOFA‐P does not effectively capture the characteristics of the COVID‐19 epidemic by failing to properly segment patients into the RED and YELLOW queues. Furthermore, Raschke et al. (2021) demonstrate that SOFA scores have poor discriminant accuracy for predicting survival prior to intubation in COVID‐19. The second priority scheme we consider, “incremental survival probability” (ISP), uses machine learning to predict patient‐specific survival probabilities by looking beyond SOFA scores and taking into account patient‐specific data regarding demographics, clinical values, and various comorbidities. Specifically, ISP assigns patients whose estimated survival probability is above a threshold to the RED queue. Neither SOFA‐P nor ISP puts any emphasis on bottleneck resource utilization, which is paramount when healthcare systems face scarce capacity. Therefore, we propose a third priority scheme, namely “ISP per length‐of‐use” (ISP‐LU), which, in addition to survival probabilities due to ventilator use, takes into account the expected duration for which a ventilator is committed to a specific patient. Specifically, ISP‐LU works by assigning to the RED queue patients whose ratio of estimated survival probability to ventilator LOU exceeds a threshold.
1.2. Modeling approach and contributions
We apply a two phase data‐driven decision modeling approach in order to assess the differential performances of SOFA‐P, ISP, and ISP‐LU. In Phase 1, we use patient‐level data from inpatient records of COVID‐19 patients admitted to New York‐Presbyterian/Columbia University Irving Medical Center and the Allen Hospital, an affiliated community health center, to build machine learning models to predict patient‐level (i) survival probability with ventilator use, (ii) survival probability after a fixed number of days of waiting for a ventilator assignment, and (iii) ventilator LOU. In Phase 2, we formulate a multiclass queueing system with abandonments, which represent patient deaths while waiting for a ventilator assignment. This queueing model dynamically applies one of the three priority schemes to direct different classes of arriving patients to RED and YELLOW queues, and then assigns ventilators by drawing patients from first RED and next YELLOW queues based on availability and, in case of capacity shortages, using a random lottery.
The primary performance metric we use to assess each priority scheme is the expected number of patients who would survive the acute phase of COVID‐19 due to ventilator use, which is consistent with guidelines in NYS and several other states. We also investigate the demographic discrepancies the three priority schemes may yield, an issue that has received particular attention during the COVID‐19 pandemic (Millett et al., 2020; Yancy, 2020). Cognizant of the existing triage process flows, which (i) prioritize the RED queue over the YELLOW queue, (ii) do not further rank patients within each queue, and (iii) randomly pull patients first from the RED and then from the YELLOW queue in case of a shortage, we use the probability of being assigned to the RED queue to develop fairness metrics.
Our findings prescribe important guidelines for healthcare policy makers and triage teams that are involved in setting and applying ventilator allocation procedures in case of shortages. We show that the machine learning methods we develop in Section 4, which rely on multidimensional patient‐level data, predict patients' mortality risk more accurately than SOFA scores alone do. Specifically, our predictive analysis highlights that low oxygen level, higher body mass index (BMI), older age, male gender, and reduced kidney functions are highly indicative of elevated mortality risk, and thus must be considered key factors in predicting improved survival odds due to mechanical ventilation. Furthermore, our prescriptive analysis in Section 5 highlights a consistent performance ordering of ISP‐LU, ISP, and SOFA‐P, and therefore provides support for emphasizing both predicted survival probabilities and ventilator LOU while designing a priority scheme to allocate scarce ventilator capacity. Specifically, we show that ISP, which relies on these superior survival predictions, improves the expected number of surviving patients over SOFA‐P, yet it increases patients' death risk while waiting for a ventilator assignment as it fails to account for ventilator LOU. Furthermore, we find ISP to disproportionately reduce the probability that certain demographics are provided priority access to the RED queue. We highlight that ISP‐LU, with its emphasis on “incremental improvement in a patient's survival probability due to ventilator use per each time unit that patient utilizes the ventilator,” outperforms both ISP and SOFA‐P with respect to all three performance metrics under consideration, that is, (i) the expected number of saved lives due to ventilator use, (ii) patients' death risk while waiting for a ventilator assignment, as well as (iii) how equitable RED queue assignments are across varied patient demographics.
The rest of the paper is organized as follows. We review the related literature in Section 2 before formulating a multiclass queuing model with abandonments, and describe its assumptions and data needs in Section 3. Then, we describe our machine learning models in Section 4, which produce estimations of patients' mortality risk with ventilator use and during the wait for a ventilator assignment as well as ventilator LOU. In Section 5, we use these estimates to calibrate a Monte‐Carlo simulation, and present findings regarding the performance of the three priority schemes under consideration. In Section 6, we incorporate algorithmic fairness considerations into our analysis to assess how equitable the priority schemes we study are relative to each other. We conclude the paper and discuss implications of our findings for healthcare practice in Section 7. We relegate the technical proofs and supplementary statistical analysis to Appendices A and B, respectively. Finally, in Appendix C, we provide instructions on how to replicate our simulation study using the code we make available, as well as present a series of figures for each congestion level we include in our computational study.
2. RELATED LITERATURE
Our paper builds on and contributes to the expansive literature on queueing systems and machine learning modeling applied to healthcare generally, and to decision modeling in the COVID‐19 pandemic more specifically. We briefly review these streams of literature below, starting with a high‐level overview of operations research methods applied in the healthcare context.
There is a long tradition of applying operations research modeling to healthcare across numerous application areas (Akan et al., 2012; Ayer et al., 2019; Dai et al., 2016; Goh et al., 2015; Hu et al., 2018). This includes papers that focus on patient prioritization with scarce resources. Chan et al. (2013) focus on mass casualty event with multiple burn victims, where high‐quality burn beds are a limited resource, and the benefit of a burn bed to a patient is a decreasing function of time since the event. In a different paper, Mills et al. (2013) focus on mass casualty event and study the standard prioritization scheme (known as START; Lerner et al., 2008). Using fluid modeling, the authors study the benefit of explicitly taking into account limited resources and patient changes in survival probabilities.
A number of papers from the operations research community focus on the response to COVID‐19. Examples include prediction of the evolution of the pandemic (Khalilpourazari & Doulabi, 2021), fast operational adjustments (Blackmon et al., 2021), rapid model development to answer key operational questions related to the pandemic (Kaplan, 2020), and operations‐driven containment strategies (Baveja et al., 2020), including optimization across multiple competing published models (Ahn et al., 2021). Perhaps the most closely related work is the paper by Wood et al. (2020). In this paper, the authors utilize discrete simulation to devise strategies to minimize total capacity dependent deaths. Another similar work uses interpretable machine learning to optimize allocation decisions under a partially observable Markov Decision Process (Grand‐Clément et al., 2021). Nevertheless, literature (so far) that takes a quantitative approach to evaluating scarce resource allocation policies during pandemic is limited.
There have been vast prediction efforts during the COVID‐19 epidemic. A large literature now exists that focuses on predicting the progression of the outbreak at a population level, using both machine learning and epidemiological modeling, as well as predictive diagnoses and prognosis models. This is in addition to a large literature of clinical factors associated with COVID‐19 ICU admissions, ventilator use, and mortality. Reflective of these large efforts are multiple reviews and summaries published in late 2020 and early 2021 (Biswas et al., 2020; Gupta et al., 2020; Parohan et al., 2020; Wynants et al., 2020). Among these, Wynants et al. (2020), summarized 169 COVID‐19 studies, some with multiple models. The review pointed out many significant flaws with the models studied including the risk of overfitting, dichotomization of predictors, inappropriate inclusion, or exclusion of patients from the study population, and lack of accounting or controlling for censoring or competing risk as common factors.
Mortality models that predict patient mortality risk find that, independent of study setting, older age, comorbidities (including cardiovascular disease, respiratory disease, diabetes, and cancer) and male sex are risk factors for death (Caramelo et al., 2020; Parohan et al., 2020), in addition to current or former smoking (Umnuaypornlert et al., 2021). Additionally, studies that include lab values generally find that increased mortality is association with lab values “indicating infection, immune system activation, coagulation disorder and tissue damage” (Biswas et al., 2020), in addition to oxygen saturation upon admission (Gupta et al., 2020). Most related to our settings are studies that use information available soon after hospitalization and estimate mortality (Gupta et al., 2020; Núñez et al., 2021; Torres‐Macho et al., 2020). Unfortunately, differences in patient populations, exclusion criteria, censoring and modeling approach limit the benefit of direct comparison of these models. In particular, in this paper we predict mortality for patients who are all eligible for mechanical ventilation, and therefore are all very sick, which is a more challenging prediction setting compared to many of the models presented in the literature to date.
In contrast to the already vast literature on prediction of the progression of the epidemic, diagnoses, and mortality, the literature focused on predicting length of ventilator use of COVID‐19 patients is relatively sparse. A number of papers provide summary statistics of LOU or conduct statistical analysis on factors associated with length of ventilator use (Almeshari et al., 2021; Botta et al., 2021; Karagiannidis et al., 2020). A single paper studies the progression of ventilated patients as a probabilistic process (Hazard et al., 2020). The limited literature on prediction of mechanical ventilation duration is perhaps not unexpected as predicting the need and duration of mechanical ventilation is known to be a difficult prediction problem (Young et al., 2013). To the best of our knowledge, there are no published studies that predict the length of mechanical ventilation use for COVID‐19 patients.
Finally, the allocation of scarce life‐saving critical health resources needs to be governed not only by operational efficiency but also by ethical considerations (White & Lo, 2020). The medical literature has identified four key principles associated with scarce life‐saving medical resources during a pandemic: maximizing the good derived from those resources, equal treatment under the allocation policy, supporting “instrumental value” (e.g., first helping those who can save others), and helping those who are worst off (Emanuel et al., 2020). However, one should note that even under arguably “objective” criteria, many of the prioritization policies may compound structural disadvantages of the healthcare system (Schmidt et al., 2021). For example, creatinine levels, an indicator of kidney function and part of the SOFA score, has been shown to be biased against Black patients by assuming they have higher muscle mass (Eneanya et al., 2019). In this paper, we develop policies consistent with the maximizing number of lives criteria set forward as the goal of the NYS policy, but study its impact on different race and age groups.
3. MODEL AND ASSUMPTIONS
We model patient flows and the associated ventilator allocation dynamics under ventilator capacity shortage via a multiclass queueing system with abandonments. Consistent with the existing NYS triage procedures outlined in Figure 1c, we assume that BLUE and GREEN patients are not considered eligible for ventilator allocation when capacity is scarce. Therefore, our formulation applies to patients who would be classified as RED or YELLOW, that is, patients whose health outcomes would sufficiently improve with ventilator use and who are also unlikely to survive without one. These RED and YELLOW patients still have different medical and demographic characteristics, and thus, we assume there are K allocation‐eligible classes of patients. Each class is parameterized by survival probability with ventilator use, survival probabilities of being alive after waiting t periods for an available ventilator, an ventilator use duration . We denote by vector a priority rule, each element of which indicates whether a class k patient will be assigned to the RED queue or not. For example, in a four‐class example implies class 1 and 2 patients are consistently assigned to the RED queue, whereas class 3 and 4 patients are consistently assigned to the YELLOW queue.
The true values , , and are unknown at the time of a ventilator allocation decision, and are influenced by each patients' observable patient characteristics such as BMI, various comorbidities, age. Therefore, we first apply machine learning methods to predict point estimates , , and of these parameters as well as their outcome distributions in Section 4, and then use them as inputs in our optimization models in Sections 5 and 6.
To express the queuing dynamics each allocation policy under consideration yields by time T, we denote by the number of class k patients who had arrived; by the number of class k patients who had used a ventilator and whose survival probability we predict as ; and by the number of class k patients who are still waiting for a ventilator at time T, and whose survival probability would be only if they are assigned a ventilator before death while waiting. We denote by the number of remaining class k patients who abandoned the queue for a ventilator as they had died while waiting. Then, finding the optimal ventilator allocation policy involves maximizing the expected number of surviving patients per time period over planning horizon T, that is,
| (1) |
subject to the underlying queueing dynamics, which we describe next. First, we assume a Poisson service rate with a mean of for each patient class. Next, as conservation of patient flows dictates that , we define , as well as . Then, we can leverage to obtain , and express (1) as
| (2) |
In other words, relative to a queuing system with no capacity constraints, which would have achieved an expected survival rate of , the performance of the existing queuing system is adversely affected by abandonments, thus is discounted by . We model these abandonment dynamics as follows. Denoting by the probability of death each day, we can express the probability of staying alive after t days as a geometric sequence of the form
| (3) |
As we would predict the survival probability of class k patients without a ventilator after t days as , we assume , and model deaths while waiting as a Poisson process 2 with an average rate of . Nevertheless, this death rate would materialize only when there is no ventilator capacity, as patients may be assigned a ventilator before they abandon the queue by death. As a result, the actual abandonment rate satisfies .
Our first result concerns the computational complexity of the aforementioned optimization problem, which we show via an if‐and‐only‐if reduction from the problem of minimizing the weighted flow time of a finite number of jobs over 3 or more parallel machines to a static version of our problem.
Theorem 1
Optimization problem (1) is strongly NP‐hard.
We provide a proof for Theorem 1 in Appendix A. Having proved analytical intractability, we proceed to evaluate the impact of the three priority schemes under consideration using a simulation study calibrated by the empirical distribution of point estimates , , and and their uncertainties, which rely on key observable patient characteristics for each patient class k. Next, we describe the machine learning models we use to obtain these estimates, and then describe the mechanics of and the results of our simulation study.
4. MACHINE LEARNING MODELS
4.1. Data
The data consist of patient information for 2741 patients admitted with COVID‐19 at the study hospitals during the months of March and April 2020. Specifically, we draw data records from New York‐Presbyterian/Columbia University Irving Medical Center, a major academic quaternary care hospital, and the associated Allen Hospital, a community health center, at the height of the COVID‐19 pandemic in New York City. During this period, New York City hospitals experienced high rates of severe COVID‐19 disease nearly overwhelming their ability to provide mechanical ventilation to all who required it (Kisner, 2020). Nevertheless, these two medical centers never ran out of ventilators, and thus never were forced to deny mechanical ventilation to a patient who required it. This is partially because the protocol in place called for patients to be maintained with supplemental oxygen via noninvasive methods. Intubation would be performed only if noninvasive therapy had demonstrably failed and intubation were the only remaining option for life‐saving therapy (Argenziano et al., 2020). During this period, medical teams even attempted experimental interventions to avoid or forestall mechanical ventilation (Thompson et al., 2020). For this reason, we assume that any patient who requires a ventilator but is not allocated one will eventually die in the queue. This is consistent with practices in Lombardy, Italy, where 99% of critically ill patients required mechanical ventilation (Grasselli et al., 2020).
The study population consists of all 2741 inpatient COVID‐19 patients at the two aforementioned hospitals, is 44% female, and the average age is 63. Of the patients in our data, 78% reported race; 30% are White, 26% are African American, 11% are Hispanic, and 33% are “other race or multiple races.” Of the 2741 in study data, 628 patients received mechanical ventilation and 2113 did not. Of the 2113 who were not ventilated, 345 died. These patients either had “do not intubate” (DNI) orders, or died so quickly that mechanical ventilation was never an option. Among the 628 patients who received a ventilator, 57.5% died. We provide summary descriptive statistics of the patient population in Table B1.
The information available for each patient includes time of arrivals, time of intubation, time of extubation (patient removal from the ventilator), comorbidities, BMI, vital signs, any pharmaceuticals administrated during the inpatient stay, as well as various lab values. For each patient, we use only data collected within the first 24 hours of admission, and prior to intubation. We calculate an estimated SOFA score using the data available. SOFA scores were not recorded in the electronic health records, and thus we had to recreate them using retrospective analysis of the patient lab values, medication lists, and vital status readings. Our data do not contain Glasgow Coma Scale scores, so we did not calculate neurologic scores. We also do not have bilirubin lab values, so we did not score liver function. We measured SOFA respiratory function by the PaO2/FIO2 ratio. While this ratio was not in the data, we relied on blood oxygenation levels as a proxy, which translates initial oxygen saturation to a SOFA score so that the distribution of points stays constant. As the COVID‐19 patients typically have severe single‐organ dysfunction (the lungs) (Raschke et al., 2021), these approximations serve our purposes well. In other words, the typical COVID‐19 patient does not suffer from neurological issues or reduced liver capacity.
4.2. Models and results
We build predictive models for three distinct outcomes: survival probability with a ventilator, duration of mechanical ventilation for patients who are allocated a ventilator, and survival probability while waiting for mechanical ventilation. We evaluate these models using 10‐fold cross‐validation, and so the results we report are averages across the 10 folds. For each predictive model we employ, we present explicit regression equations and detailed results in Appendix B. 3
4.2.1. Survival probability with a ventilator
To predict survival odds with a ventilator for each patient class k, we build a regularized logistic regression model using patients' medical indicators as predictors. These include lab values, oxygen saturation levels, platelet counts, white blood cell counts, kidney function measures, vital status, blood pressure, age, gender, comorbidities, and BMI. We use lasso (Tibshirani, 1996) for regularization (resulting in a reduced number of predictors) to increase the stability and robustness of the models and improve predictive performance. We use the penalty parameter that minimizes the misclassification error over 10 cross‐validation folds.
Figure 2 summarizes the predictive performance of the regularized lasso logistic regression model we chose among other alterantives. This model achieves area under the ROC curve (AUC) value of 0.73 for predicting the survival odds of patients receiving mechanical ventilation. In the same figure, we also illustrate the performance of a logistic regression model using only the SOFA score estimate as the input variable, which achieves an AUC value of 0.66. This highlights a potential limitation of relying solely on SOFA scores to prioritize patients' access to mechanical ventilation, as we show SOFA scores to have poor discrimination power between those who will survive and those who will not.
FIGURE 2.
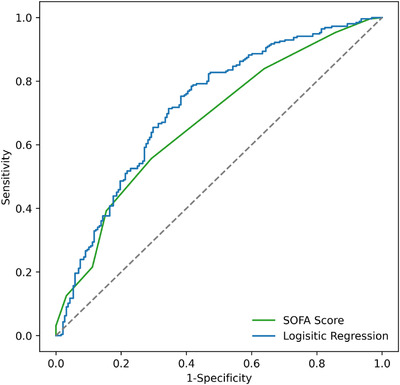
ROC curves for the mortality model with ventilation using the available information versus for a model using only the SOFA score proxy
We note that, due to the shrinkage in the regression coefficients resulting from the regularization, the coefficients from the model are no longer unbiased. The benefit of the bias in the regression coefficients is that the resulting predictions are more stable and accurate (Tibshirani, 1996). While these biased regression coefficients cannot be interpreted as the log odds of the outcome, the magnitude (considering the range of input values) and the direction of them still reflect their relative importance in predicting the outcome, and as such can provide insights into which factors drive the outcome. Consistent with prior medical literature, we find that age, comorbidities, and disease progression are significant drivers of mortality predictions. More specifically, patients who are male and/or old, have kidney disease and/or high BMI, and suffer from hypoxemia (either clinically diagnosed, or reflected by a low oxygen saturation) are at greater risk of mortality. We provide more detailed regression results that support these conclusion in Table B3.
4.2.2. Duration of mechanical ventilation
To predict estimated v values for each patient class k, we use a hurdle model (Cragg, 1971), the results of which compare favorably against the performance of more sophisticated modeling approaches. A hurdle model is a two‐step model wherein the first step predicts a binary outcome, and the second step typically models a continuous outcome as a function of the binary outcome predicted in the first step. Hurdle models are often motivated by an excess of zeroes in data of continuous outcomes, which can cause a bad statistical fit, for example, in linear regression models, which assume normally distributed error terms.
We adopt the hurdle model to our context by first predicting whether the patient will survive or not. We do so because the distributions of LOU values differ notably between those who survive and those who do not. In the second step, we predict each patient's LOU. The first‐stage model relies on the logistic regression developed in the previous subsection with one modification. Specifically, we augment the typical two‐step hurdle model, and instead of using just two cohorts (e.g., those predicted to survive, those predicted to die), we use three: likely to survive (), likely to die (), and those for whom it is hard to predict survival (). In the second stage, an independent LOU lasso regression model is then built for each of the likely to survive and likely to die cohorts, using only the patients who either lived or died as the training population. Again, for the lasso penalty parameter, we use the value that minimizes cross‐validation error. For the hard‐to‐predict cohort, the LOU model is based on the entire cohort (which proved more accurate in our testing than an independent model, in part due to small sample size).
The MAE for the LOU prediction is 10.5 days. While this MAE is relatively large, the predictions allow us to identify patients who will likely use the ventilator for long versus short duration. Patients in the highest quartile of expected LOU ( days), had average LOU of 20.4 days, while those in the bottom quartile ( days) had an average LOU of only 9 days. In Section 5, we show that these predictions are good enough to be used to increase the efficiency of ventilator allocation significantly.
In addition to the factors identified as drivers of mortality, we find that across cohorts, patients with hypoxemia are likely to require mechanical ventilation for a longer duration, patients with a diagnosis of diabetes and identified as likely to survive require significantly longer ventilator use on average (holding everything else constant). What is especially interesting is the effect of age on LOU. For the cohort that is predicted to live, older patients are predicted to have longer LOUs; these patients take longer to recover. In contrast, for the cohort predicted to die, older patients are predicted to have a shorter LOU, these are sicker patients who deteriorate faster. This highlights the benefit of the hurdle model approach: it allows us to capture these different cohort effects. The detailed results of the second stage model, the retained variables and the corresponding regression coefficients for duration of ventilator are presented in Table B5.
4.2.3. Survival probability while waiting for mechanical ventilation
To support the modeling of patients abandoning the queue (dying while waiting for a ventilator), we fit a model predicting the probability of a patient surviving without a ventilator for a fixed time period t. While every patient who required a ventilator during this period was given one, in our data there were 356 patients who died without a ventilator. We estimate the survival duration by fitting models on the data from these patients who died without receiving mechanical ventilation. The empirical distribution of survival times without ventilation reflects an exponential time‐to‐mortality distribution. Specifically, on each day after the first, between 12% and 18% of surviving patients died each day for the first two weeks. A Kolmogorov–Smirnov test fails to reject the hypothesis that survival time while waiting for a ventilator is exponentially distributed (p = 0.2715).
We fit a series of regularized logistic regression models predicting the likelihood of survival for at least 1, 2, and 3 days, as well as model mean expected survival time. The outputs from these models are all highly correlated (). We decided to we employ the model for to estimate the rate at which patients will die while waiting for a ventilator. Specifically, we use these predictions to compute the probability that a class k patient can survive 48 hours waiting for a ventilator, that is, , and calibrate the queue abandonments accordingly in the simulation models we describe in Sections 5 and 6. We choose to use , because the initial 24‐h period, that is, , is somewhat unique in terms of patient care and outcomes, and patients who die within the first 24 hours of arrival may not even have been triaged into either the RED or YELLOW queues. Of the remaining models, that is, , we find to yield the largest population, and therefore the most robust results with also good predictive power indicated by the highest AUC of 0.71. We present detailed regression results for the selected model with in Table B6. Our results highlight that younger patients with high oxygenation levels and better kidney function (measured by creatinine lab values) are more likely to survive two days without a ventilator.
5. PRIORITY SCHEMES AND CAPACITY ALLOCATION: A SIMULATION STUDY
In this section, we describe and report the results of a simulation study we use to assess the performance of the three priority rules under consideration: SOFA‐P, ISP, and ISP‐LU. We calibrate the parameters of this study using the estimates the machine learning models of Section 4 produce. More specifically, treating each patient who received mechanical ventilation in our sample as a separate class, thereby setting , (i) we use point estimate for survival probability with ventilation, (ii) we model ventilator LOU using exponentially distributed service times with mean , and (iii) we simulate deaths while waiting for a ventilator using Poisson abandonment rate , which is a function of with as we previously showed 2‐day survival probability estimates to depict the death process in the queue with sufficient accuracy.
Patient flows in our simulation mimic the triage process for the NYS Ventilator Allocation Guidelines. Specifically, when a patient arrives, we assume triage team members would use the information available within the first 24 hours of arrival to the hospital to declare this patient a class k patient with a particular SOFA score, , and . Then, according to the priority scheme under consideration, which may be SOFA‐P just using the SOFA score, or ISP using , or ISP‐LU using and , the patient is directed to the RED or YELLOW queue where s/he is likely to survive t periods with probability . While a patient's health may evolve over time in reality, according to the NYS Ventilator Allocation Guidelines, such changes do not yield further prioritization within a queue or a rerouting from one queue to another. Accordingly, in our simulations, a patient remains in the queue s/he was initially assigned to until death or when a ventilator becomes available. As a result, a class k patient dies (abandons the queue) with rate not to exceed .
We note that during the period we collected our data, the hospital system we study did not have to ration ventilators, which suggests a utilization level below 100%. As our primary objective is to test the effectiveness of each priority scheme at different congestion levels when capacity is scarce, we use the available data on ventilator LOU and vary number of ventilators for a given demand rate to construct scenarios with different implied utilization levels exceeding 100%. This is because implied utilization, along with variability, is one of the key drivers of queue wait times, and thus the resulting death rates in our context. Specifically, we assume Poisson arrivals with an average rate of 1/20 per day for each class k, which, combined with an average of 14.61 days across classes of patients, generate about 459 ventilator days of demand. Then, varying the aggregate ventilator capacity N between 200 and 350, we obtain implied utilization levels between 131% and 229%. The code for our simulations is available upon request, and we provide detailed instructions on how to execute it in Appendix C.
Each of the three priority schemes we consider implies a threshold‐type allocation policy. Therefore, having sorted patient classes with respect to a monotone ranking of a key estimate (or a combination of estimates), we can use decision vectors of the form , the elements of which represent whether a patient class is assigned to the RED queue (1) or not (0), to express how a priority scheme allocates ventilator capacity. As a result, it suffices to use to characterize each priority scheme, which indicates that the first of the elements of the corresponding ranked allocation decision vector are 1. Accordingly,
implies the priority scheme that assigns of the patient classes with the lowest estimated SOFA scores to the RED queue;
implies the priority scheme that assigns of the patient classes with the highest values to the RED queue; and
implies the priority scheme that assigns of the patient classes with the highest values to the RED queue.
For example, if a priority scheme summarized by is applied, then as , patients classes with the 377 highest values are directed to the RED queue, and the patients from the remaining 251 classes are directed to the YELLOW queue.
To find the best values for each priority scheme {SOFA‐P, ISP, ISP‐LU} at each implied utilization level we consider, we run Monte‐Carlo simulations by varying and . In each simulation run, we set the time horizon T as 500 days, and consider the first 250 days as the transient/warm‐up period before the system reaches its steady state. Then, we count patients who received mechanical ventilation. For these patients, we use the survival probability estimates of Section 4 to compute the expected number of surviving patients with ventilator use. We also count the number of patients who abandoned the queue (died while waiting). We repeat these individual simulation runs 300 times for any given α and N, and denote by the expected number of patients who survived after mechanical ventilation when priority scheme is implemented during the jth simulation run. Finally, we compute
| (4) |
to express objective function value , which is the expected number of surviving patients priority scheme achieves.
5.1. Results
We first use an example instance with 250 ventilators, that is, implied utilization of level 183.5%, to illustrate how the three priority schemes under consideration work, and summarize their patient prioritization in Figure 3 as well as their differential performances in Figure 4. For these results as well as all the subsequent results, we provide our findings for other utilization levels in several figures in Appendix C (Figures C1, C2, C3, C4, C5, C6, C7).
FIGURE 3.
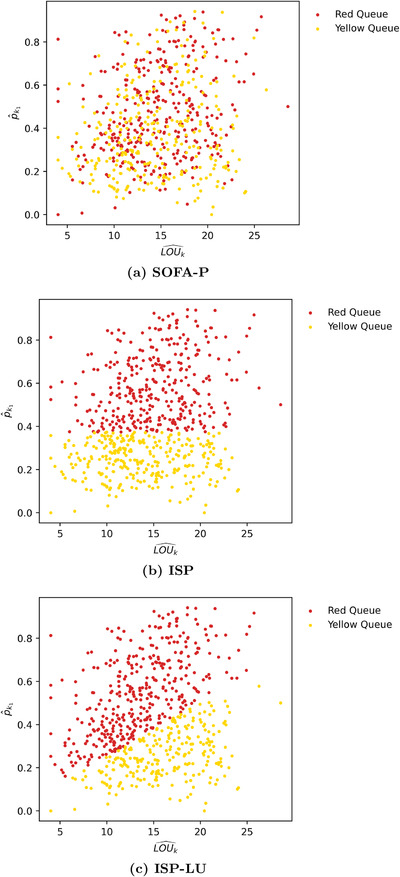
An example instance with implied utilization of 183.5% highlighting which patient classes are routed to the RED and YELLOW queues by (a) SOFA‐P, (b) ISP, and (c) ISP‐LU
FIGURE 4.
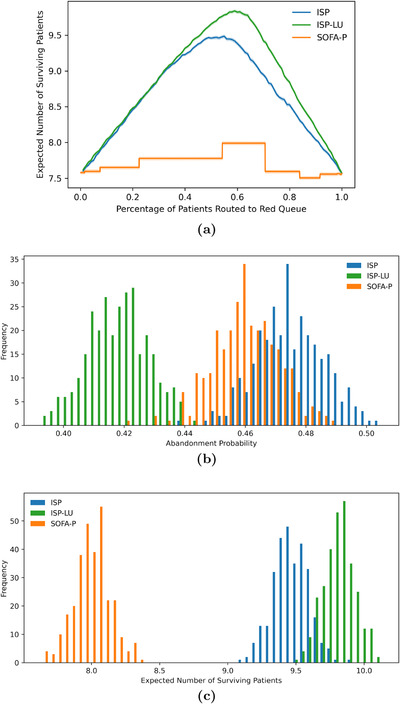
An example instance with implied utilization of 183.5% highlighting (a) the optimal , , and values, as well as the differences in (b) the probability of death while waiting, and (c) the expected number of surviving patients for SOFA‐P, ISP, and ISP‐LU
In Figure 3, we present scatter plots of all 628 patient classes with respect to key estimated parameters and , and mark which patients classes are routed to the RED and YELLOW queues according to the three priority schemes for an illustrative scenario with 183.5% implied utilization. First, Figure 3a clearly highlights how SOFA scores and estimated parameters and are not strongly correlated. For this particular instance, we find the optimal SOFA score threshold to be 4 (out of maximum 16), and as a result, SOFA‐P routes of the patients with the lowest SOFA scores to the RED queue. Nevertheless, how SOFA‐P selects these patient classes with respect to critical estimators and appears almost random.
In contrast, Figure 3b highlights that ISP implies a threshold value of about 0.40. Consequently, ISP routes patient classes whose predicted survival probability with ventilator use exceed this threshold to the RED queue, which also amounts to of all patients. The implication of this finding is that, if ISP improved upon SOFA‐P by achieving a higher expected number of surviving patients, it would be due to selecting patients with higher survival probabilities but not necessarily because of utilizing scarce ventilator capacity more efficiently.
Finally, Figure 3c highlights how ISP‐LU segments patient classes by routing patients with higher ratios to the RED queue. As a result, patients with relatively higher ventilator LOU estimates are routed to the YELLOW queue instead of the RED queue even though their survival probabilities with ventilator use exceed the optimal ISP threshold value of . In contrast, patients with sufficiently low ventilator LOU estimates are routed to the RED queue instead of the YELLOW queue despite their survival probabilities with ventilator use being below the same threshold.
The differential criteria SOFA‐P, ISP, and ISP‐LU use to provide priority RED queue access to certain classes of patients yield different segmentations in terms of and . We summarize these descriptive statistics in Table 1. First, the mean values for patients in RED queue is 0.519 for ISP, which exceeds the same statistic for both SOFA (0.473) and ISP‐LU (0.507). Second, the mean values for patients in RED queue for ISP is 14.855 days, which exceeds the same statistic for both SOFA (14.745) and ISP‐LU (13.882). This is clearly indicative of how ISP emphasizes survival odds with mechanical ventilation, yet does not take into account ventilator LOU. Also evident from these statistics is how ISP‐LU emphasizes both survival odds with ventilation and ventilator LOU, which yield significant performance implications we will discuss next.
TABLE 1.
Patient types in RED and YELLOW queues for the illustrative scenario with 183.5% implied utilization
| RED queue | YELLOW queue | |||
|---|---|---|---|---|
| Mean | Mean | Mean | Mean | |
| SOFA | 0.473 | 14.745 | 0.377 | 14.445 |
| ISP | 0.519 | 14.855 | 0.187 | 13.941 |
| ISP‐LU | 0.507 | 13.882 | 0.209 | 16.661 |
We continue our analysis of the scenario with 183.5% implied utilization by highlighting implications of ISP‐LU's differential segmentation mechanism compared to ISP. In Figure 4a, we report the expected number of surviving patients for ISP and ISP‐LU as a function of , that is, when a certain fraction of patient classes are routed to the RED queue. We note that whereas the optimal ISP routes of the patients with the highest values to the RED queue, the optimal ISP‐LU routes of the patients with the highest ratios to the RED queue. In other words, as ISP‐LU takes into account both improved survival odds with and ventilator LOU, it manages to provide priority access to a larger number of patients.
The fact that exceeds also has wait‐time implications for patients awaiting mechanical ventilation, which we highlight in Figure 4b. In this panel, we present the outcome distributions of patients' death probability while waiting for a ventilator in our simulation runs. Specifically, we show that ISP‐LU reduces average death probability in the queue from 47.46% (SE 0.06%) to 41.59% (SE 0.06%) for ISP. Furthermore, ISP performs even worse than SOFA‐P, which yields a death probability of 45.96% (SE 0.06%). This seemingly counterintuitive finding highlights how ISP indiscriminately routes patients with a high survival probability, even those with large LOU, and thus causing excess deaths in both the RED and YELLOW queues.
Next, in Figure 4c, we illustrate the differential performance of all three priority schemes by reporting the outcome distributions of the expected number of surviving patients per day in our simulation runs. Specifically, we report that that on average 9.84 (SE 0.01), 9.48 (SE 0.01), and 7.99 (SD 0.01) patients per simulated day survive when ventilator use is allocated using ISP‐LU, ISP, and SOFA‐P, respectively. (For the results we report in panels (b) and (c) of Figure 4, we note that t tests indicate that all differences are statistically significant.) Therefore, ISP improves upon SOFA‐P by 18.65%, while ISP‐LU improves upon SOFA‐P by 23.15%.
Finally, we show that the observations we highlight in Figure 4 using the illustrative example with 183.5% implied utilization are robust with respect to different congestion levels. Specifically, we vary the implied utilization levels from 131.1% to 229.3% in Figure 5, and report the expected number of surviving patients and the death probability while waiting in panels (a) and (b), respectively. Our results confirm that ISP consistently outperforms SOFA‐P in terms the expected number of surviving patients, yet lags behind ISP‐LU. This performance ordering of the three priority schemes is indicative of ISP‐LU's two operational advantages. First, similar to ISP, ISP‐LU rations limited ventilator capacity to patients with sufficiently high values. Second, and unlike ISP, ISP‐LU additionally emphasizes managing patient flows by prioritizing patients who would not occupy the bottleneck resource for a long duration, that is, it assigns priority based on ratios. As a result, ISP‐LU reduces queue times, and thus consistently achieves lower in‐queue death probabilities while waiting compared to ISP. In contrast, ISP cannot achieve even as low in‐queue death probabilities as SOFA‐P does.
FIGURE 5.
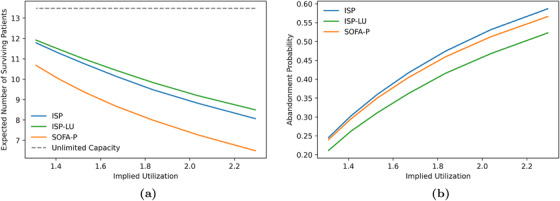
Key performance metrics: (a) expected number of surviving patients and (b) death probability while waiting as we vary implied utilization values from 131.1% to 229.3%
Also evident in both panels of Figure 5 is that the superior differential performance of ISP‐LU over ISP and SOFA‐P becomes more pronounced as the implied utilization levels increase. Specifically, in panel (a) we show that whereas ISP‐LU improves the expected number of surviving patients by 11.61% over SOFA‐P (11.92 patients per day for ISP‐LU vs. 10.68 patients per day for SOFA‐P) at 131.1% implied utilization, the performance gap increases to 30.97% when the implied utilization is 229.3% (8.50 patients per day for ISP‐LU vs. 6.49 patients per day for SOFA‐P). Similarly, we show in panel (b) that whereas the death probability while waiting are 21.14% and 24.56%, respectively, for ISP‐LU and ISP (an improvement of 3.42 percentage points) at 131.1% implied utilization, the same probabilities are 52.30% and 58.71% (an improvement of 6.41 percentage points) at 229.3% implied utilization.
6. GROUP FAIRNESS
Our analysis so far has demonstrated the superior performance of ISP and ISP‐LU priority schemes relative to SOFA‐P in terms of the primary objective of maximizing the expected number of surviving patients. An equally important concern is whether using these priority schemes, which rely on the predicted survival probability due to ventilator use (ISP) and also ventilator LOU (ISP‐LU) yields an equitable treatment of patients with varying demographics. This is a particularly important consideration for the COVID‐19 pandemic, during which Black and Hispanic communities have been disproportionately affected (Yancy, 2020), thus leading to criticisms concerning how scarce healthcare resources ought to be allocated (Schmidt et al., 2021).
In this section, we revise our models and simulation study to assess ISP and ISP‐LU priority schemes in terms of their ability yield equitable ventilator allocation outcomes for patients from different racial demographics. We first note that the metrics one needs to utilize in our context to assess how equitable a priority scheme is have to measure patients' access to the RED queue. This is because the current NYS ventilator allocation processes involve patients being drawn randomly first from the RED queue and then from the YELLOW queue. In other words, within the confines of the existing processes, whether to assign a patient belonging to a particular racial group to the RED queue is the last (and the only) decision a policy maker could make to influence access to prioritized mechanical ventilation. As such, to assess the relative fairness of the ISP and ISP‐LU priority schemes, we develop metrics that measure the dispersion among the probabilities that different racial groups would be assigned to the RED queue.
In the machine learning and algorithmic ethics literature, the notion of group fairness or statistical parity, emphasizes a desire to have the demographics of one group receiving positive (or negative) classification be similar to the demographics of the overall population (Dwork et al. 2012). A key consideration is that different racial groups may have different background characteristics, including different disease burden, and as a result may have unequal outcomes. In our context, a group fairness criterion would be that one racial group's priority access to the RED queue should be similar to the overall population's priority access.
Our formal approach to assess a priority scheme in terms of group fairness involves two metrics that measure racial groups' differential access to the priority queue. Specifically, denoting by the proportion of patients in each race group , who are routed to the RED queue by a priority scheme with allocation rule α, we define range , that is,
| (5) |
and standard deviation , that is,
| (6) |
of RED queue access proportions of racial groups. Evidently, lower values of or imply more equal outcomes across racial groups, that is, a better outcome in terms of group fairness. In Figure 6, we report how these two group fairness metrics for SOFA‐P, ISP, and ISP‐LU change with α using the running example scenario of Section 5 with 183.5% implied utilization.
FIGURE 6.
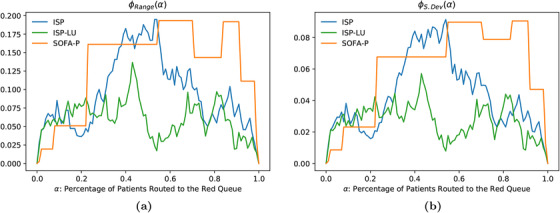
Group fairness metrics: (a) range: and (b) standard deviation: for SOFA‐P, ISP, and ISP‐LU at 183.5% implied utilization
Recall that allocation rule α implies that patients with the highest (e.g., estimated survival probability for ISP) or lowest (e.g., SOFA scores for SOFA‐P) scores would be routed to the RED queue. As such each priority scheme i aims to optimize with the primary objective to maximize lives saved due to mechanical ventilation. Nevertheless, this primary objective may not align with minimizing the dispersion of RED queue access among racial groups. This is because both or are lower for each of the three priority schemes when α is closer to 1 (i.e., most patients are routed to the RED queue) or 0 (i.e., most patients are routed to the YELLOW queue). In contrast, as we previously illustrated in Figure 4a, the optimal ISP and ISP‐LU policies use and , respectively, for this scenario. At these moderate α levels, Figure 6 clearly shows that racial disparities in terms of RED queue access are much more pronounced. Nevertheless, also evident in both panels (a) and (b) is that, relative to ISP and SOFA‐P, ISP‐LU seems to provide more equal access to different racial groups for most α levels, most notably at optimal α levels.
6.1. Operationalizing group fairness considerations
Having demonstrated a potential trade‐off between the objectives of maximizing survival after mechanical ventilation and achieving more equitable priority access to mechanical ventilation across different racial demographics, we now consider how group fairness considerations can be operationalized. This is a challenging task because implementing decision algorithms that satisfy group fairness constraints may require race‐specific decision rules (Corbett‐Davies et al., 2017), and as noted in Friedler et al. (2016), it is near impossible to have a decision rule that satisfies both individual and group fairness criteria in a society with unequal starting conditions. 4 Furthermore, there are serious ethical and legal concerns about explicitly using race as a decision factor when making medical decisions (Schmidt et al., 2020). Our discussions with practitioners have also echoed that while fairness is a goal, explicitly using race as a decision factor would not be practically implementable. Instead, procedurally fair algorithms that do not discriminate among similarly situated people are employed when possible, particularly when life‐and‐death decisions are on the line (Newdick et al., 2020), with the objective to achieve fairness through unawareness. 5 Therefore, to assess how robustly our proposed procedurally fair priority schemes, ISP, ISP‐LU, and SOFA‐P, meet a group fairness criterion, we study their performance subject to a constraint on the dispersion metrics or we developed earlier, an approach consistent with previous works by Hasankhani and Khademi (2021), Bertsimas et al. (2013), and Ata et al. (2021).
To incorporate a group fairness constraint into the analysis, we revise our previous formulation that focused solely on maximizing the expected number of surviving patients to obtain
| (7) |
and denote by its optimal objective function values for {Range, S.Dev} and {ISP, ISP‐LU, SOFA‐P}. Evidently, if the constraint in this formulation binds at optimally, the resulting optimal solution would be different than its unconstrained counterpart . As a case in point, Figure 6b shows that imposing renders = 0.55 infeasible for the scenario with 183.5% implied utilization. Evidently, this suboptimality causes the expected number of surviving patients to be lower than , which is what optimized priority access can achieve without group fairness restrictions. We will refer to this optimality gap “cost of fairness.”
6.2. Cost of fairness
We quantify cost of fairness using two alternative metrics in our simulations. These metrics are the absolute cost of fairness, which we define as
| (8) |
and the relative cost of fairness, which we define as
| (9) |
for any {ISP, ISP‐LU, SOFA‐P}. and {Range, S.Dev}. While quantifies the reduction in saved lives by priority scheme i due to the group fairness constraint relative to its unconstrained performance, quantifies the same reduction by anchoring each priority scheme's constrained performance to ISP‐LU's unconstrained performance. (As noted in Section 5, the unconstrained ISP‐LU outperforms the unconstrained ISP at all congestion levels.)
In Figure 7, we report the absolute cost of fairness at varied group fairness constraint levels for the representative scenario with 183.5% utilization. We impose a constraint on the range dispersion metric and the standard deviation dispersion metric in panels (a) and (b), respectively. In both panels, τ decreases from left to right, indicating a tighter group fairness constraint. Not surprisingly, as the constraint gets tighter, absolute cost of fairness increases for all priority schemes. What is more managerially important is that remains zero for tighter group fairness constraints relative when ISP‐LU is used to determine priority access relative to when ISP or SOFA‐P is in use. These are the scenarios wherein maximizing saved lives does not come at the expense of creating racial disparity for priority access. For example, in panel (a), for whereas for . Furthermore, even when the absolute cost of fairness is not zero, it remains lower for ISP‐LU than it is for ISP or SOFA‐P unless the group fairness constraint is really tight. These findings clearly demonstrate ISP‐LU to be more robust in terms of its ability as a priority scheme to align the objectives of maximizing saved lives and limiting racial disparities for priority access.
FIGURE 7.
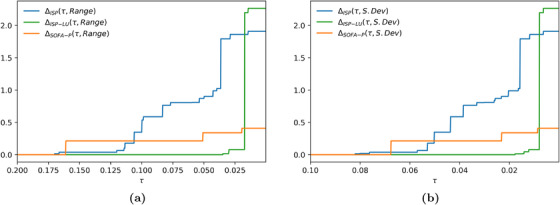
Absolute cost of fairness at 183.5% implied utilization when the racial dispersion metric is (a) and (b)
Both panels of Figure 7 also show that the absolute cost of fairness for ISP‐LU exceeds the same metric for ISP when the group fairness constraint is so tight that it does not permit effective prioritization. We highlight this observation more clearly in Figure 8 where we report the relative cost of fairness at varied group fairness constraint levels for the representative scenario with 183.5% utilization. For example, in panel (b) values are identical for {ISP, ISP‐LU, SOFA‐P} when τ is 0.008 or lower. In contrast, for all scenarios wherein the group fairness constraint is not as tight, the relative cost of fairness for both ISP and SOFA‐P are higher than it is for ISP‐LU. Combining this observation with our primary finding from Section 5 that ISP‐LU outperforms both ISP and SOFA‐P in terms of maximizing saved lives at all congestion levels, we may confidently conclude that using ISP‐LU to allocate scarce ventilators achieves a Pareto‐improvement over ISP and SOFA‐P.
FIGURE 8.
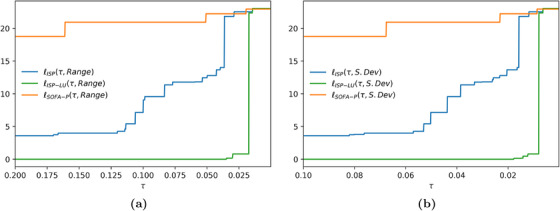
Relative cost of fairness at 183.5% implied utilization when the racial dispersion metric is (a) and (b)
7. DISCUSSION AND CONCLUSION
Motivated by the rapidly increased demand for mechanical ventilation and the ensuing capacity shortages during the COVID‐19 pandemic, in this study, we applied a quantitative lens to analyze the existing procedures in NYS to ration scarce ventilator capacity as well as to propose alternative priority schemes. In our analysis, with practical applicability concerns in mind, we intentionally did not propose any changes to the existing patient flows and decision points in situations where capacity needs to be rationed. More specifically, patients are still assessed by a triage team and split to the GREEN, BLUE, RED, and YELLOW categories, where only RED and YELLOW patients are declared eligible for ventilator use, and random draws from first the RED and next the YELLOW queue determine the order in which patients receive ventilator care. Instead, we focused on simple priority schemes that selectively directs patients to the RED queue with the objective to maximize the expected number of surviving patients after mechanical ventilation.
We studied three priority schemes: (i) SOFA‐P, which most closely mimics the existing process of assigning to the RED queue patients whose SOFA are below a threshold in NYS as well as several other states in the United States; (ii) ISP, which takes into account survival probability predictions that depend on several patient‐level features beyond SOFA scores including lab values and comorbidities; (iii) ISP‐LU, which takes into account survival probability predictions and estimated ventilator LOU.
Our findings prescribe important guidelines for healthcare policy makers and triage teams who are involved in setting and applying ventilator allocation decisions and procedures in case of shortages. We highlight that the machine learning methods we propose in Section 4 do a better job than SOFA scores in predicting survival in mechanically ventilated patients. Specifically, our predictive analysis highlights that low oxygen level, higher BMI, older age, male gender, and reduced kidney functions are highly indicative of elevated mortality risk, and thus must be considered key factors in predicting improved survival odds with mechanical ventilation. Furthermore, our simulations in Section 5 show that ISP consistently outperforms SOFA‐P. Therefore, we make a case for deployment of efficient machine learning methodologies to improve triage teams' decision‐making capabilities in high‐stress healthcare settings such as the one that motivates our study. We also show that ISP indiscriminately prioritizes patients with high predicted survival probabilities, even those with long estimated ventilator LOU, which results in increased queue wait times and therefore excess deaths due to delayed ventilator allocation. This motivates the use of an improved priority scheme, ISP‐LU, which balances survival probabilities with expected duration of mechanical ventilation. By prioritizing patients with a high ratio of survival probability to ventilator LOU, ISP‐LU services a larger number of patients relative to ISP and SOFA‐P, and routes to the RED queue even patients with moderately low survival probability provided these patients' predicted ventilator LOU is sufficiently small. As a result, ISP‐LU outperforms ISP and SOFA‐P both in terms of the expected number of surviving patients and risk of death while waiting.
Our research setting also lends itself to addressing a broader range of societal issues. One such line of inquiry is the racial discrepancies that current or proposed priority schemes may yield, an issue that has received particular attention during the COVID‐19 pandemic, as patients who belong to certain racial groups have been shown to be disproportionately affected (Millett et al., 2020; Yancy, 2020). We study these considerations in Section 6 using the notion of “group fairness,” and find ISP‐LU to be a more robust ventilator allocation scheme relative to both ISP and SOFA‐P. This is because its implementation yields a Pareto‐improvement over both ISP and SOFA‐P in terms of maximizing saved lives after mechanical ventilation while limiting racial disparity in priority access to the RED queue. Our results also show that the superior performance of ISP‐LU in terms of all performance metrics under consideration can be attributed to its dual emphasis on survival probability and ventilator LOU when allocation scarce ventilator capacity. As a result, not only does ISP‐LU route a larger proportion of patients to the RED queue but it also does so at a similar rate for each racial group.
Our study has several limitations. First, our empirical findings are based on data that came from only one hospital system in NYC, and reflect the early stages of the pandemic during spring 2020. Naturally, at that time, more comprehensive data sets were not available. In addition, our survival probability estimates while waiting for a ventilator assignment are based on patients who never received a ventilator and died, which is the closest proxy we could identify for patients who await an available ventilator. Furthermore, as mechanical ventilation capacity did not bind during the data collection period, every patient who required a ventilator was assigned one, thus preventing our ability to model patients' disease trajectory while on the waiting list. Finally, our SOFA score estimates (out of maximum 16 points) are approximations due to lack of all pertinent patient data that are used for SOFA calculations (out of maximum 24 points). Despite these shortcomings, we were successful in generating accurate estimates of survival probabilities and ventilator LOU with limited data. Our predictive models perform well in (10‐fold) cross‐validation samples, and the resulting estimates prove useful inputs for the subsequent simulation models to achieve our primary research objective of assessing the differential performances of ISP‐LU, ISP, and SOFA‐P.
While we acknowledge that a larger data set would have allowed for more detailed modeling, our findings are robust as demonstrated by the consistent ordering of ISP‐LU, ISP, and SOFA‐P across all demand congestion levels with respect to the expected number of patients who survive the acute phase of COVID‐19, which is the key performance metric outlined in NYS Ventilator Allocation Guidelines. Furthermore, the methodologies we employed to reach our conclusions are easily transferable to other healthcare settings, where data scientists and operations researchers can train and implement models using their own data. Consequently, our overarching managerial insight remains intact and applicable to several practical settings wherein scarce healthcare capacity allocation decisions are made: Triage teams should (i) use patient‐specific criteria beyond SOFA scores to better predict survival probabilities, and (ii) utilize a priority scheme that emphasizes both survival probability and bottleneck resource use duration.
ACKNOWLEDGMENTS
Dr. Michaela Restivo Anderson is supported by National Institutes of Health National Heart Lung and Blood Institute K23 HL150280. Institutional Review Board approval from Columbia University (Protocol #AAAS9982) was obtained for using these data. Approval was also obtained from the New York‐Presbyterian institutional review committee. A subsequent request was made to the warehouse, and the data were obtained by a data warehouse analyst.
APPENDIX A. PROOF OF THEOREM 1
First, we denote by and the processing and completion times of job , respectively, and by positive weights. Then, we note that minimizing the weighted flow time of n jobs over m parallel machines, that is, using the standard notation for scheduling theory, , is strongly NP‐hard (Pinedo, 2018). Evidently, the more general problem for a general function that is nondecreasing in is also strongly NP‐hard. Next, we recall that objective function
| (A1) |
can be expressed as
| (A2) |
and note that whether patient k contributes to (by death) by time t is determined in a probabilistic way according to a geometric sequence of the form
| (A3) |
Finally, we define if and 0 otherwise, where denotes the time patient k starts using a ventilator. We then construct an instance wherein all N ventilators are busy when there are K patients requiring ventilator use. Then solving
| (A4) |
implies finding the optimal times for in which patients will be placed in the RED queue each time a ventilator becomes available.
Therefore, we can construct an instance of problem (A4) by setting , , as well as , , , and for all , and conclude that an optimal solution for can be found in polynomial time if and only if an optimal solution for (A4) can be found in polynomial time if and only if an optimal solution for (A1) can be found in polynomial time.
APPENDIX B. DETAILED DATA AND DATA MODELING RESULTS
B.1. Patient characteristics
In Table B1 we present summary statistics of key patient characteristics for the entire population and broken up by whether the patient received a ventilator.
TABLE B1.
Summary statistics for patients who underwent mechanical ventilation, those who did not, and the entire patient population
| Received ventilation | No mechanical ventilation | All patients | |
|---|---|---|---|
| Number | 628 | 2113 | 2741 |
| Ventilator use | 1 | 0 | 23% |
| Age | 64.03 | 63.59 | 63.69 |
| Days on ventilator | 14.6 | NA | NA |
| Hospital LOS | 15.13 | 6.21 | 7.76 |
| Mortality rate (%) | 58 | 17 | 24 |
| SOFA score | 4.7 | 3.55 | 3.81 |
| Creatinine | 1.97 | 1.72 | 1.78 |
| Platelets | 218.37 | 222.12 | 221.26 |
| Morbid obesity (BMI ≥ 40) (%) | 11 | 6 | 8 |
| Average BMI | 30.78 | 32.28 | 31.89 |
| Average min (%) | 83.81 | 90.56 | 89.01 |
| Diabetes (%) | 26 | 19 | 21 |
| White blood cell count | 10.34 | 8.41 | 8.85 |
Note: Values are presented as averages or percentages as appropriate.
B.2. Predicting survival probability with a ventilator
We considered four machine learning approaches to predict the probability of death with ventilation; regularized logistic regression (lasso), classification trees, xgBoost, and adaptive boosting. The resulting ROC curves and the corresponding AUC values for the four models we considered are summarized in Figure B1 and Table B2, respectively. As the lasso model outperforms the other approaches, while being interpretable, we selected the lasso model to support the policy analysis.
FIGURE B1.
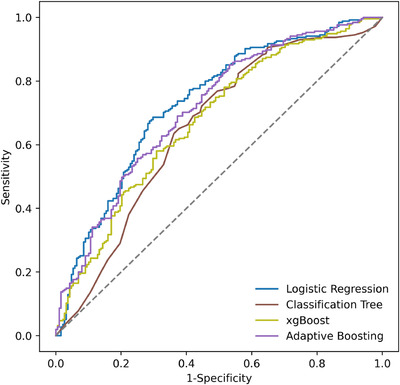
ROC curves for different models
TABLE B2.
The AUC values for different models.
| Model | Area under ROC curve (AUC) |
|---|---|
| Logistic regression a | 0.73 |
| Adaptive boosting | 0.71 |
| xgBoost | 0.67 |
| Classification tree | 0.65 |
In the main document, we employ predictions produced by the logistic regression model.
We summarize the retained variables and the corresponding regression coefficients for the lasso model in Table B3. In the table, BMI refers to the body mass index, and included in the models is BMI2 as medical studies have indicated a nonlinear association between BMI and Covid‐19 outcomes (Anderson et al., 2020). Hypoxia is an indicator variable of a recorded diagnosis of hpyoxia, Kidney is an indicator of kidney‐specific comorbid conditions, and Ferritin is the ferritin lab value, a measure of inflammation. Finally, Min is the minimum blood oxygenation level recorded in the first 24 h of admission, and before mechanical ventilation. The estimated regression model for survival with a ventilator is the following:
| (B1) |
TABLE B3.
Regression coefficients from the model predicting mortality probability with mechanical ventilation
| Variable | Coefficient |
|---|---|
| (Intercept) | −5.588*** |
| BMI | 0.0660*** |
| BMI2 | −0.000297** |
| Age | 0.0678*** |
| Male | 0.8187*** |
| Hypoxia | 0.457* |
| Kidney | 0.236 |
| Ferritin | 0.0000325* |
| Min | −0.0103 |
The significance of the coefficients are noted as follows: ***; **; *.
B.3. Predicting duration of mechanical ventilation
We trained four machine learning models for the duration of ventilation; linear regression, regression tree, a hurdle model, and xgBoost. We summarize the mean absolute error (MAE) of the different models in Table B4. We note that the MAE value for the hurdle model is comparable to that of xgBoost (and better than the linear regression and regression tree models). Given the comparable performance of the hurdle model to the xgBoost approach and its interpretability, we select the two‐stage hurdle model for further analysis.
TABLE B4.
The MAE values for different models
| Model | Mean absolute error (MAE) (days) |
|---|---|
| Linear regression | 11.4 |
| Regression tree | 11.2 |
| Hurdle model a | 10.5 |
| xgBoost | 10.4 |
In the main document, we employ predictions produced by the hurdle model.
In Table B5, we present the retained variables and the corresponding regression coefficients from the second stage of the hurdle model (which predicts the duration of use) for each of the cohorts resulting from the first stage. In the table, BMI refers to the body mass index, and included in the models is BMI2 as medical studies have indicated a nonlinear association between BMI and Covid‐19 outcomes (Anderson et al., 2020). Kidney is an indicator of kidney‐specific comorbid conditions, and Creatinine is the lab value reported in milligram per deciliter, Hypertension is an indicator of hypertension diagnosis, Immunocompromised is an indicator variable for patients in an immunocompromised state, SOFA O2 is the oxygen saturation level component of the SOFA score, SOFA platelets is the platelet component of the SOFA score, and Diabetes is an indicator variable for diagnosis of diabetes. The regression equations are given below:
| (B2) |
| (B3) |
| (B4) |
TABLE B5.
The resulting regression coefficients when predicting duration of mechanical ventilation (LOU)
| Variable | Likely to die | Hard to predict | Likely to survive |
|---|---|---|---|
| (Intercept) | 14.574*** | 12.421** | −31.039** |
| BMI | 0.192 | 1.803** | |
| BMI2 | −0.00151* | −0.023** | |
| Age | −0.171*** | −0.124*** | 0.115** |
| Male | 1.374 | 0.846 | – |
| Kidney | 5.388*** | – | |
| Creatinine | 1.314** | −0.509* | −0.682 |
| Hypertension | – | −2.736* | – |
| Hypoxia | 2.227* | 2.911** | 2.615 |
| Immunocompromised | 3.638 | 14.991 | |
| SOFA O2 | 1.418** | 1.373** | 0.750 |
| SOFA platelets | −1.130 | −2.117 | |
| Diabetes | 1.216 | 5.914*** |
The significance of the coefficients are noted as follows: ***, **, and *.
B.4. Predicting survival probability while waiting for mechanical ventilation
Table B6 details the regression coefficients for the prediction of a patient surviving 48 h without mechanical ventilation. In the table, Creatinine is the lab value reported in milligram per deciliter, Min is the minimum blood oxygenation level recorded in the first 24 h of admission, and before mechanical ventilation, SOFA platelets is the platelet component of the SOFA score, and Diabetes is an indicator variable for diagnosis of diabetes. The regression equation for surviving at least 48 h from arrival, given not being allocated a ventilator is given below:
| (B5) |
TABLE B6.
The resulting regression coefficients when predicting probability of 48‐h survival without ventilation
| Variable | Coefficient |
|---|---|
| (Intercept) | −1.778 |
| Age | −0.00792 |
| Male | 0.122 |
| Creatinine | −0.137** |
| Min | 0.0463*** |
| SOFA platelets | 0.528* |
| Diabetes | 0.640 |
The significance of the coefficients are noted as follows: ***, **, and *.
APPENDIX C. SIMULATION DETAILS
C.1. Simulation setup and code
A demonstration of our simulation study in the Jupyter Notebook file named Covid Simulation.ipynb complements the main article. Interested readers can request these files by contacting the corresponding author, and run them using a recent Python distribution and a Jupyter Notebook compiler.
In the first section of the notebook (named Parameters), we set the values for the main parameters of the simulation such as the number of servers N, the priority rule α, and time horizon T. This section also includes , the parameter that determines the end of the simulation warm‐up, and , the parameter than determines how many times each one‐shot simulation would be repeated.
The next section of the notebook (named Running the Simulation for the ISP Policy) runs our simulation study for several applications of the policy scheme for a given priority rule α. In this section, we first read a set of input data from the file named Sim Input.csv. This file includes the , , and values of patient class k for . We use , and values to derive the service and maximum abandonment rates for each class k.
Once all the input values are set, we call the function from the OneShotSim.py script file as many times as the value of the variable indicates. The function relies on enterServ, releaseServ, arrival, abandon functions, which we define in the SimEvent.py script file. These functions represent the four main events repeatedly taking place in the simulation: (i) a patient receives a ventilator (server), (ii) a patient is removed from a ventilator, (iii) a new patient arrives, and (iv) a waiting patient leaves the system without receiving a ventilator (i.e., death in the queue). The two main output values of the function are (i) the expected number of surviving patients per day and (ii) the fraction of patients who have abandoned the queue. We record these outputs and report their average values at the conclusion of the simulation runs.
The third section of the notebook (named Running the Simulation for the ISP‐LU Policy) runs our simulation study for several applications of the policy scheme for a given priority rule α. The logical sequence of how the code runs mimics what we described in the previous paragraph .
The final section of the notebook Covid Simulation.ipynb organizes all results in an output file (named Sim Results.csv).
In our demonstration file, we set and to ensure that the simulation demo ends relatively quickly. (A typical run for each policy takes 2 min). Users of this code can replicate the results we report in the manuscript by setting and . We should, however, note that this replication effort would take about 30 min for each policy.
C.2. Detailed simulation results
FIGURE C1.
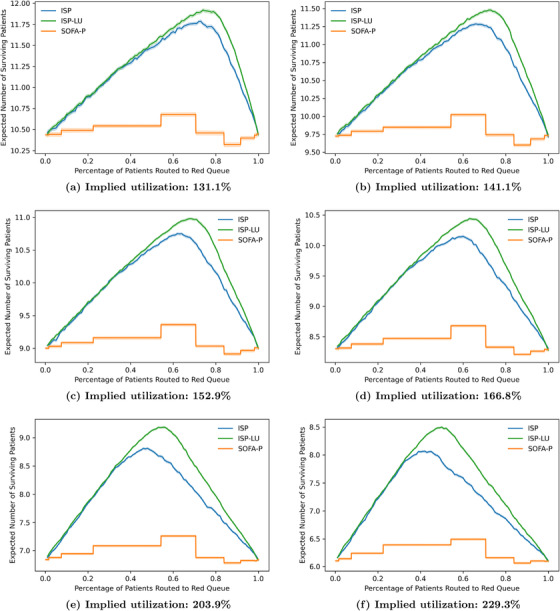
Expected number of survivals as a function of fraction α routed to the RED queue at each implied utilization level
FIGURE C2.
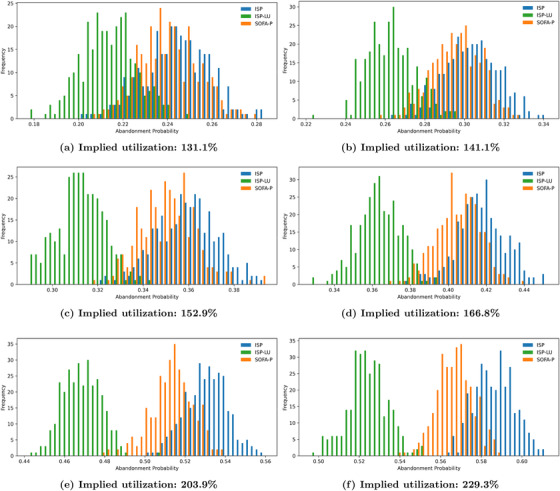
Abandonment probability at each implied utilization level
FIGURE C3.
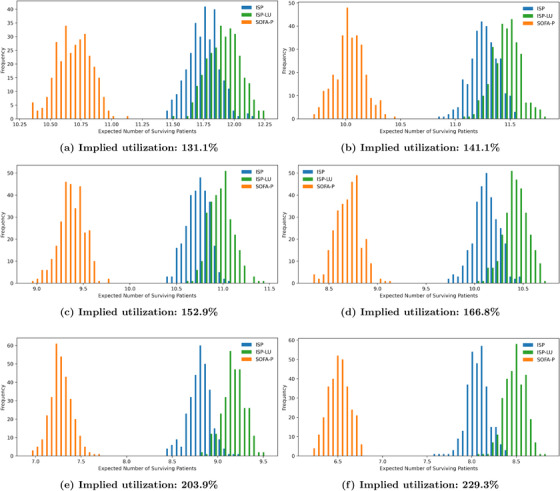
Distribution of the expected number of surviving patients at each implied utilization level
FIGURE C4.
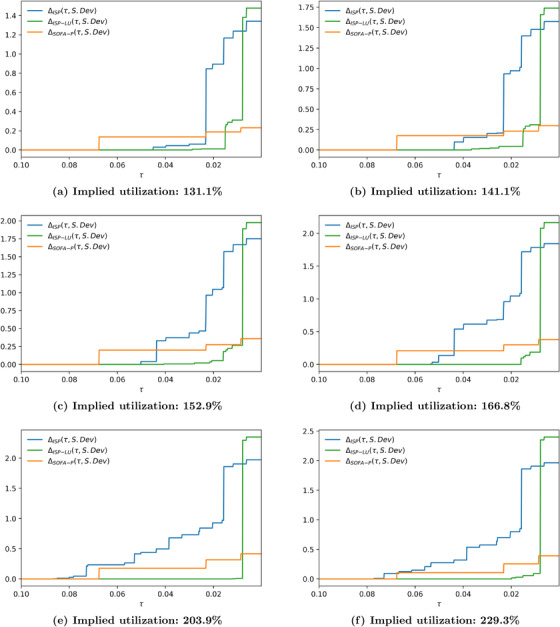
Absolute cost of fairness using the standard deviation based dispersion metric at each implied utilization level
FIGURE C5.
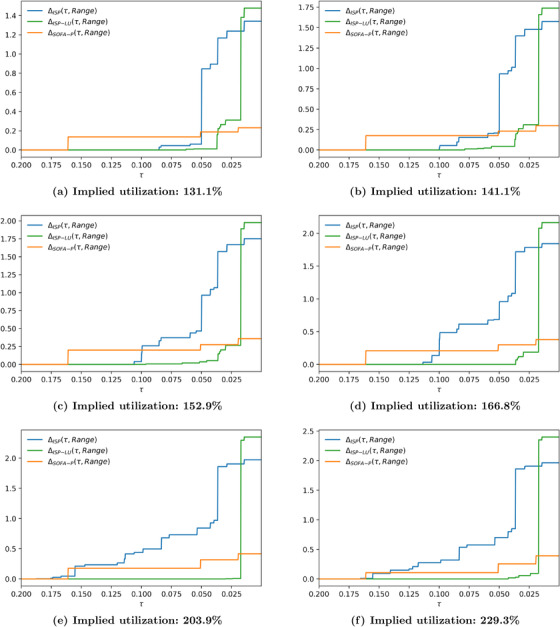
Absolute cost of fairness using range dispersion metric at each implied utilization level
FIGURE C6.
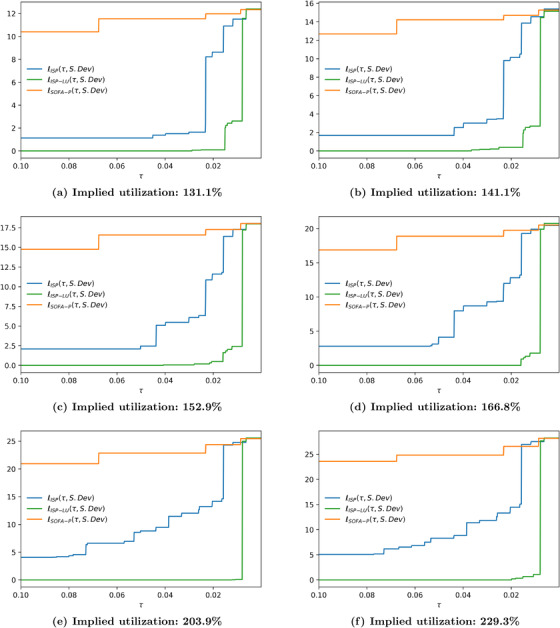
Relative cost of fairness using the standard deviation dispersion metric relative to best priority scheme (ISP‐LU) at each implied utilization level
FIGURE C7.
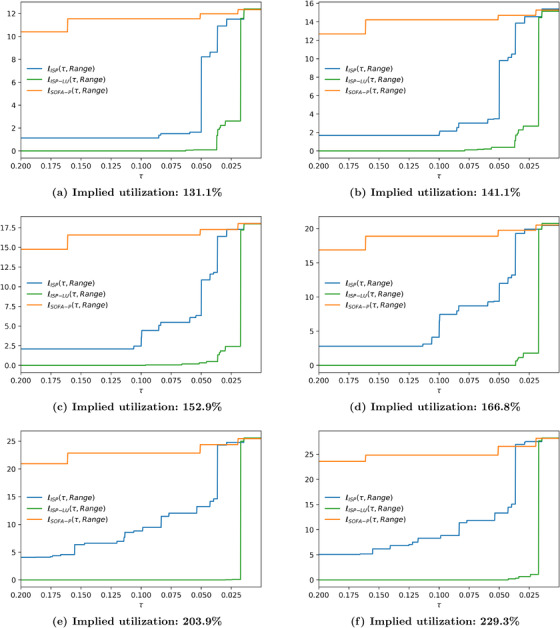
Relative cost of fairness using the range dispersion metric relative to best priority scheme (ISP‐LU) at each implied utilization level
Anderson, D. R. , Aydinliyim, T. , Bjarnadóttir, M. V. , Çil, E. B. , & Anderson, M. R. (2023). Rationing scarce healthcare capacity: A study of the ventilator allocation guidelines during the COVID‐19 pandemic. Production and Operations Management, 00, 1–28. 10.1111/poms.13934
Handling Editor: Edward Anderson
Accepted by Edward Anderson.
ENDNOTES
Preceding the prioritization step, exclusion criteria are applied to eliminate patients with irreversibly deteriorating health conditions. The aftermath of the prioritization step involves 48‐hour and 120‐hour reassessments of the patients who are presently using ventilators, which may result in withholding further ventilator use from patients who have not improved demonstrably. Withdrawal of mechanical ventilation is subject to moral debate and is rarely invoked, and thus we exclude it from our analysis. Interested readers may refer to Chuang et al. (2021) for a working paper that solely focuses on this decision.
In Section 4, we provide empirical evidence that using a Poisson death process with mean rate calibrated by setting (i.e., using 48‐h survival probabilities) is an accurate representation of patients' death rates in our data.
In Appendix B, we present a performance comparison of alternative modeling approaches. The comparison highlights that the methods we opt to employ for further analysis compare favorably to the alternatives. Specifically, lasso logistic regression yields predictive performance for survival with mechanical ventilation similar to or better than the alternatives while having the benefit of being interpretable. For duration of mechanical ventilation, we find the hurdle models to produce estimates with a mean absolute error (MAE) value that is lower than those of linear regression and regression trees, and comparable to the MAE of xgBoost. Again, as transparency and interpretability are important, we select the hurdle model over the xgBoost approach.
The machine learning community has tried to address these issues through algorithm design (Corbett‐Davies et al., 2017), measurement of impacts (Caliskan et al., 2017), and directly cleansing data sets of bias (Zemel et al., 2013), but the underlying tension remains.
Achieving fairness through unawareness (Gajane & Pechenizkiy, 2017) is not a sufficient condition to avoid discrimination when other information on individuals is available (Pedreshi et al., 2008), and some approaches prioritizing group fairness actually intentionally violate this condition in an attempt to counteract inequities. Race‐conscious decision policies like affirmative action (Aleinikoff, 1991) or race prioritization for vaccine access (Johnson et al., 2021) explicitly violate this condition.
REFERENCES
- Ahn, H.‐S. , Silberholz, J. , Song, X. , & Wu, X. (2021). Optimal Covid‐19 containment strategies: Evidence across multiple mathematical models. 10.2139/ssrn.3834668 [DOI]
- Akan, M. , Alagoz, O. , Ata, B. , Erenay, F. S. , & Said, A. (2012). A broader view of designing the liver allocation system. Operations Research, 60(4), 757–770. [Google Scholar]
- Aleinikoff, T. A. (1991). A case for race‐consciousness. Columbia Law Review, 91(5), 1060–1125. [Google Scholar]
- Almeshari, M. A. , Alobaidi, N. Y. , Al Asmri, M. , Alhuthail, E. , Alshehri, Z. , Alenezi, F. , Sapey, E. , & Parekh, D. (2021). P61 mechanical ventilation utilization in COVID‐19: A systematic review and meta‐analysis. Thorax, 76, A121.1–A121. [Google Scholar]
- Anderson, M. R. , Geleris, J. , Anderson, D. R. , Zucker, J. , Nobel, Y. R. , Freedberg, D. , Small‐Saunders, J. , Rajagopalan, K. N. , Greendyk, R. , Chae, S.‐R. , Natarajan, K. , Roh, D. , Edwin, E. , Gallagher, D. , Podolanczuk, A. , Barr, R. G. , Ferrante, A. W. , & Baldwin, M. R. (2020). Body mass index and risk for intubation or death in SARS‐CoV‐2 infection: A retrospective cohort study. Annals of Internal Medicine, 173(10), 782–790. [DOI] [PMC free article] [PubMed] [Google Scholar]
- Argenziano, M. G. , Bruce, S. L. , Slater, C. L. , Tiao, J. R. , Baldwin, M. R. , Barr, R. G. , Chang, B. P. , Chau, K. H. , Choi, J. J. , Gavin, N. , Goyal, P. , Mills, A. M. , Patel, A. A. , Romney, M.‐L. S. , Safford, M. M. , Schluger, N. W. , Sengupta, S. , Sobieszczyk, M. E. , Zucker, J. E. , … Chen, R. (2020). Characterization and clinical course of 1000 patients with coronavirus disease 2019 in New York: Retrospective case series. British Medical Journal , 369. 10.1136/bmj.m1996 [DOI] [PMC free article] [PubMed] [Google Scholar]
- Ata, B. , Ding, Y. , & Zenios, S. (2021). An achievable‐region‐based approach for kidney allocation policy design with endogenous patient choice. Manufacturing & Service Operations Management, 23(1), 36–54. [Google Scholar]
- Ayer, T. , Zhang, C. , Bonifonte, A. , Spaulding, A. C. , & Chhatwal, J. (2019). Prioritizing hepatitis c treatment in us prisons. Operations Research, 67(3), 853–873. [Google Scholar]
- Baveja, A. , Kapoor, A. , & Melamed, B. (2020). Stopping COVID‐19: A pandemic‐management service value chain approach. Annals of Operations Research, 289, 173–184. [DOI] [PMC free article] [PubMed] [Google Scholar]
- Beall, A. (2020). Shortages of equipment, beds and staff means doctors have a dreadful decision to make in the midst of the current pandemic . https://www.bbc.com/future/article/20200428‐coronavirus‐how‐doctors‐choose‐who‐lives‐and‐dies
- Bertsimas, D. , Farias, V. F. , & Trichakis, N. (2013). Fairness, efficiency, and flexibility in organ allocation for kidney transplantation. Operations Research, 61(1), 73–87. [Google Scholar]
- Biswas, P. S. , Devosri, S. , Homchoudhary, A. , Makkar, D. , Kapoor, M. , & Goyal, A. (2020). Association of demographic, clinical, laboratory, and radiological characteristics with outcomes of COVID‐19 patients: A systematic review and meta‐analysis. Journal of Microbiology and Infectious Diseases, 10(03), 121–135. [Google Scholar]
- Blackmon, L. , Chan, R. , Carbral, O. , Chintapally, G. , Dhara, S. , Felix, P. , Jagdish, A. , Konakalla, S. , Labana, J. , McIlvain, J. , Stone, J. , Tang, C. S. , Torres, J. , & Wu, W. (2021). Rapid development of a decision support system to alleviate food insecurity at the los angeles regional food bank amid the COVID‐19 pandemic. Production and Operations Management, 30, 3391–3407. [Google Scholar]
- Boone, R. (2021). Idaho hospitals begin rationing health care amid COVID surge . https://apnews.com/article/business‐health‐public‐health‐coronavirus‐pandemic‐idaho‐db21f9a14254996144e78aafb1518259
- Botta, M. , Tsonas, A. M. , Pillay, J. , Boers, L. S. , Algera, A. G. , Bos, L. D. , Dongelmans, D. A. , Hollmann, M. W. , Horn, J. , Vlaar, A. P. , Schultz, M. J. , Neto, A. S. , Paulus, F. , & PRoVENT‐COVID Collaborative Group . (2021). Ventilation management and clinical outcomes in invasively ventilated patients with COVID‐19 (PRoVENT‐COVID): A national, multicentre, observational cohort study. Lancet Respiratory Medicine, 9(2), 139–148. [DOI] [PMC free article] [PubMed] [Google Scholar]
- Caliskan, A. , Bryson, J. J. , & Narayanan, A. (2017). Semantics derived automatically from language corpora contain human‐like biases. Science, 356(6334), 183–186. [DOI] [PubMed] [Google Scholar]
- Caramelo, F. , Ferreira, N. , & Oliveiros, B. (2020). Estimation of risk factors for COVID‐19 mortality—Preliminary results. medRxiv. 10.1101/2020.02.24.20027268 [DOI]
- Chan, C. W. , Green, L. V. , Lu, Y. , Leahy, N. , & Yurt, R. (2013). Prioritizing burn‐injured patients during a disaster. Manufacturing & Service Operations Management, 15(2), 170–190. [Google Scholar]
- Chuang, E. , Grand‐Clement, J. , Chen, J.‐T. , Chan, C. W. , Goyal, V. , & Gong, M. N. (2021). Quantifying utilitarian outcomes to inform triage ethics: Simulated performance of a ventilator triage protocol under SARS‐CoV‐2 pandemic surge conditions. AJOB Empirical Bioethics, 13, 196–204. [DOI] [PubMed] [Google Scholar]
- Corbett‐Davies, S. , Pierson, E. , Feller, A. , Goel, S. , & Huq, A. (2017). Algorithmic decision making and the cost of fairness. Proceedings of the 23rd ACM SIGKDD International Conference on Knowledge Discovery and Data Mining (pp. 797–806). 10.1145/3097983.3098095 [DOI]
- Cragg, J. G. (1971). Some statistical models for limited dependent variables with application to the demand for durable goods. Econometrica: Journal of the Econometric Society, 39, 829–844. [Google Scholar]
- Dai, T. , Cho, S.‐H. , & Zhang, F. (2016). Contracting for on‐time delivery in the us influenza vaccine supply chain. Manufacturing & Service Operations Management, 18(3), 332–346. [Google Scholar]
- Emanuel, E. J. , Persad, G. , Upshur, R. , Thome, B. , Parker, M. , Glickman, A. , Zhang, C. , Boyle, C. , Smith, M. , & Phillips, J. P. (2020). Fair allocation of scarce medical resources in the time of Covid‐19. New England Journal of Medicine, 382, 2049–2055. [DOI] [PubMed] [Google Scholar]
- Eneanya, N. D. , Yang, W. , & Reese, P. P. (2019). Reconsidering the consequences of using race to estimate kidney function. Journal of the American Medical Association, 322(2), 113–114. [DOI] [PubMed] [Google Scholar]
- Ferreira, F. L. , Bota, D. P. , Bross, A. , Mélot, C. , & Vincent, J.‐L. (2001). Serial evaluation of the sofa score to predict outcome in critically ill patients. Journal of the American Medical Association, 286(14), 1754–1758. [DOI] [PubMed] [Google Scholar]
- Friedler, S. A. , Scheidegger, C. , & Venkatasubramanian, S. (2016). On the (im)possibility of fairness. Communications of the ACM, 64, 136–143. [Google Scholar]
- Gajane, P. , & Pechenizkiy, M. (2017). On formalizing fairness in prediction with machine learning . https://arxiv.org/pdf/1710.03184.pdf
- Goh, J. , Bjarnadóttir, M. V. , Bayati, M. , & Zenios, S. A. (2015). Active postmarketing drug surveillance for multiple adverse events. Operations Research, 63(6), 1528–1546. [Google Scholar]
- Grand‐Clément, J. , Chan, C. , Goyal, V. , & Chuang, E. (2021). Interpretable machine learning for resource allocation with application to ventilator triage . http://www.columbia.edu/~cc3179/vent_treeMDP_2021.pdf
- Grasselli, G. , Zangrillo, A. , Zanella, A. , Antonelli, M. , Cabrini, L. , Castelli, A. , Cereda, D. , Coluccello, A. , Foti, G. , Fumagalli, R. , Iotti, G. , Latronico, N. , Lorini, L. , Merler, S. , Natalini, G. , Piatti, A. , Ranieri, M. V. , Scandroglio, A. M. , Storti, E. , … Pesenti, A. (2020). Baseline characteristics and outcomes of 1591 patients infected with SARS‐CoV‐2 admitted to ICUs of the Lombardy Region, Italy. Journal of the American Medical Association, 323(16), 1574–1581. [DOI] [PMC free article] [PubMed] [Google Scholar]
- Gupta, R. K. , Marks, M. , Samuels, T. H. , Luintel, A. , Rampling, T. , Chowdhury, H. , Quartagno, M. , Nair, A. , Lipman, M. , Abubakar, I. , van Smeden, M. , Wong, W. K. , Williams, B. , & Noursadeghi, M. (2020). Systematic evaluation and external validation of 22 prognostic models among hospitalised adults with Covid‐19: An observational cohort study. European Respiratory Journal , 56(6). 10.1183/13993003.03498-2020 [DOI] [PMC free article] [PubMed] [Google Scholar]
- Hasankhani, F. , & Khademi, A. (2021). Is it time to include post‐transplant survival in heart transplantation allocation rules? Production and Operations Management, 30(8), 2653–2671. [Google Scholar]
- Hazard, D. , Kaier, K. , Von Cube, M. , Grodd, M. , Bugiera, L. , Lambert, J. , & Wolkewitz, M. (2020). Joint analysis of duration of ventilation, length of intensive care, and mortality of Covid‐19 patients: A multistate approach. BMC Medical Research Methodology, 20(1), 1–9. [DOI] [PMC free article] [PubMed] [Google Scholar]
- Hopkins, J. University's Systems Science and Engineering (CSSE) . (2021). Covid‐19 dashboard . https://coronavirus.jhu.edu/map.html
- Hu, W. , Chan, C. W. , Zubizarreta, J. R. , & Escobar, G. J. (2018). An examination of early transfers to the ICU based on a physiologic risk score. Manufacturing & Service Operations Management, 20(3), 531–549. [Google Scholar]
- Johnson, J. H. , Bonds, J. M. , Parnell, A. M. , & Bright, C. M. (2021). Coronavirus vaccine distribution: Moving to a race conscious approach for a racially disparate problem. Journal of Racial and Ethnic Health Disparities, 8, 799–802. [DOI] [PMC free article] [PubMed] [Google Scholar]
- Kaplan, E. H. (2020). Om forum‐Covid‐19 scratch models to support local decisions. Manufacturing & Service Operations Management, 22(4), 645–655. [Google Scholar]
- Karagiannidis, C. , Mostert, C. , Hentschker, C. , Voshaar, T. , Malzahn, J. , Schillinger, G. , Klauber, J. , Janssens, U. , Marx, G. , Weber‐Carstens, S. , Kluge, S. , Pfeifer, M. , Grabenhenrich, L. , Welte, T. , & Busse, R. (2020). Case characteristics, resource use, and outcomes of 10 021 patients with Covid‐19 admitted to 920 German hospitals: An observational study. Lancet Respiratory Medicine, 8(9), 853–862. [DOI] [PMC free article] [PubMed] [Google Scholar]
- Khalilpourazari, S. , & Doulabi, H. H. (2021). Designing a hybrid reinforcement learning based algorithm with application in prediction of the COVID‐19 pandemic in Quebec. Annals of Operations Research, 312, 1–45. [DOI] [PMC free article] [PubMed] [Google Scholar]
- Kisner, J. (2020). What the chaos in hospitals is doing to doctors . https://www.theatlantic.com/magazine/archive/2021/01/covid‐ethics‐committee/617261/
- Lerner, E. B. , Schwartz, R. B. , Coule, P. L. , Weinstein, E. S. , Cone, D. C. , Hunt, R. C. , Sasser, S. M. , Liu, J. M. , Nudell, N. G. , Wedmore, I. S. , Hammond, J. , Bulger, E. M. , Salomone, J. P. , Sanddal, T. L. , Markenson, D. , & O'Connor, R. E. (2008). Mass casualty triage: An evaluation of the data and development of a proposed national guideline. Disaster Medicine and Public Health Preparedness, 2(S1), S25–S34. [DOI] [PubMed] [Google Scholar]
- Millett, G. A. , Jones, A. T. , Benkeser, D. , Baral, S. , Mercer, L. , Beyrer, C. , Honermann, B. , Lankiewicz, E. , Mena, L. , Crowley, J. S. , Sherwood, J. , & Sullivan, P. S. (2020). Assessing differential impacts of Covid‐19 on black communities. Annals of Epidemiology, 47, 37–44. [DOI] [PMC free article] [PubMed] [Google Scholar]
- Mills, A. F. , Argon, N. T. , & Ziya, S. (2013). Resource‐based patient prioritization in mass‐casualty incidents. Manufacturing & Service Operations Management, 15(3), 361–377. [Google Scholar]
- New York State Task Force on Life and the Law, New York State Department of Health . (2015). Ventilator allocation guidelines . https://www.health.ny.gov/regulations/task_force/reports_publications/docs/ventilator_guidelines.pdf
- Newdick, C. , Sheehan, M. , & Dunn, M. (2020). Tragic choices in intensive care during the Covid‐19 pandemic: On fairness, consistency and community. Journal of Medical Ethics, 46(10), 646–651. [DOI] [PMC free article] [PubMed] [Google Scholar]
- Núñez, I. , Priego‐Ranero, Á. A. , García‐González, H. B. , Jiménez‐Franco, B. , Bonilla‐Hernández, R. , Domínguez‐Cherit, G. , Merayo‐Chalico, J. , Crispín, J. C. , Barrera‐Vargas, A. , & Valdés‐Ferrer, S. I. (2021). Common hematological values predict unfavorable outcomes in hospitalized COVID‐19 patients. Clinical Immunology , 225. 10.1016/j.clim.2021.108682 [DOI] [PMC free article] [PubMed] [Google Scholar]
- Parohan, M. , Yaghoubi, S. , Seraji, A. , Javanbakht, M. H. , Sarraf, P. , & Djalali, M. (2020). Risk factors for mortality in patients with coronavirus disease 2019 (COVID‐19) infection: A systematic review and meta‐analysis of observational studies. Aging Male, 23, 1–9. [DOI] [PubMed] [Google Scholar]
- Pedreshi, D. , Ruggieri, S. , & Turini, F. (2008). Discrimination‐aware data mining. Proceedings of the 14th ACM SIGKDD International Conference on Knowledge Discovery and Data Mining (pp. 560–568). 10.1145/1401890.1401959 [DOI]
- Pinedo, M. L. (2018). Scheduling: Theory, algorithms, and systems. Springer. [Google Scholar]
- Piscitello, G. M. , Kapania, E. M. , Miller, W. D. , Rojas, J. C. , Siegler, M. , & Parker, W. F. (2020). Variation in ventilator allocation guidelines by us state during the coronavirus disease 2019 pandemic: A systematic review. JAMA Network Open, 3(6), e2012606–e2012606. [DOI] [PMC free article] [PubMed] [Google Scholar]
- Raschke, R. A. , Agarwal, S. , Rangan, P. , Heise, C. W. , & Curry, S. C. (2021). Discriminant accuracy of the sofa score for determining the probable mortality of patients with covid‐19 pneumonia requiring mechanical ventilation. Journal of the American Medical Association, 325, 1469–1470. [DOI] [PMC free article] [PubMed] [Google Scholar]
- Schmidt, H. , Gostin, L. O. , & Williams, M. A. (2020). Is it lawful and ethical to prioritize racial minorities for Covid‐19 vaccines? Journal of the American Medical Association, 324(20), 2023–2024. [DOI] [PubMed] [Google Scholar]
- Schmidt, H. , Roberts, D. E. , & Eneanya, N. D. (2021). Rationing, racism and justice: Advancing the debate around “colourblind”COVID‐19 ventilator allocation. Journal of Medical Ethics, 48, 126–130. [DOI] [PMC free article] [PubMed] [Google Scholar]
- Thompson, A. E. , Ranard, B. L. , Wei, Y. , & Jelic, S. (2020). Prone positioning in awake, nonintubated patients with Covid‐19 hypoxemic respiratory failure. JAMA Internal Medicine, 180(11), 1537–1539. [DOI] [PMC free article] [PubMed] [Google Scholar]
- Tibshirani, R. (1996). Regression shrinkage and selection via the lasso. Journal of the Royal Statistical Society: Series B (Methodological), 58(1), 267–288. [Google Scholar]
- Torres‐Macho, J. , Ryan, P. , Valencia, J. , Pérez‐Butragueño, M. , Jiménez, E. , Fontán‐Vela, M. , Izquierdo‐García, E. , Fernandez‐Jimenez, I. , Álvaro‐Alonso, E. , Lazaro, A. , Alvarado, M. , Notario, H. , Resino, S. , Velez‐SErrano, D. , & Meca, A. (2020). The PANDEMYC score. an easily applicable and interpretable model for predicting mortality associated with COVID‐19. Journal of Clinical Medicine, 9(10), 3066. [DOI] [PMC free article] [PubMed] [Google Scholar]
- Umnuaypornlert, A. , Kanchanasurakit, S. , Lucero‐Prisno, D. E. I. , & Saokaew, S. (2021). Smoking and risk of negative outcomes among Covid‐19 patients: A systematic review and meta‐analysis. Tobacco Induced Diseases , 19. 10.18332/tid/132411 [DOI] [PMC free article] [PubMed] [Google Scholar]
- Vincenta, J.‐L. (2020). SOFA calculator . https://www.mdcalc.com/sequential‐organ‐failure‐assessment‐sofa‐score
- White, D. B. , & Lo, B. (2020). A framework for rationing ventilators and critical care beds during the Covid‐19 pandemic. Journal of the American Medical Association, 323(18), 1773–1774. [DOI] [PubMed] [Google Scholar]
- Wood, R. M. , McWilliams, C. J. , Thomas, M. J. , Bourdeaux, C. P. , & Vasilakis, C. (2020). Covid‐19 scenario modelling for the mitigation of capacity‐dependent deaths in intensive care. Health Care Management Science, 23(3), 315–324. [DOI] [PMC free article] [PubMed] [Google Scholar]
- Wynants, L. , Van Calster, B. , Collins, G. S. , Riley, R. D. , Heinze, G. , Schuit, E. , Bonten, M. M. , Dahly, D. L. , Damen, J. A. , Debray, T. P. , de Jong, V. M. T. , De Vos, M. , Dhiman, P. , Haller, M. C. , Harhay, M. O. , Henckaerts, L. , Heus, P. , Kammer, M. , Kammer, M. , … van Smeden, M. (2020). Prediction models for diagnosis and prognosis of Covid‐19: Systematic review and critical appraisal. British Medical Journal , 369. 10.1136/bmj.m1328 [DOI] [PMC free article] [PubMed] [Google Scholar]
- Yancy, C. W. (2020). Covid‐19 and African Americans. Journal of the American Medical Association, 323, 1891–1892. [DOI] [PubMed] [Google Scholar]
- Young, D. , Harrison, D. A. , Cuthbertson, B. H. , Rowan, K. , & TracMan Collaborators . (2013). Effect of early vs late tracheostomy placement on survival in patients receiving mechanical ventilation: the TracMan randomized trial. Journal of the American Medical Association, 309(20), 2121–2129. [DOI] [PubMed] [Google Scholar]
- Zemel, R. , Wu, Y. , Swersky, K. , Pitassi, T. , & Dwork, C. (2013). Learning fair representations. Proceedings of the 30th International Conference on Machine Learning , Atlanta, GA: (pp. 325–333). [Google Scholar]