Abstract
This work is motivated by the need in overcoming the electricity crisis in Gaza, which is initiated due to political reasons and the spread of COVID‐19. Building quarantine centers is one of the most important means used in combating the COVID‐19, but connecting these centers to the electricity distribution network at the appropriate time is not always possible and increases the burden on the local utility company. This article proposed a hybrid off‐grid energy system (HES) to effectively energize the quarantine COVID‐19 center in Gaza economically and environmentally. To achieve this aim, the estimated load profile of the quarantine center is fed to the HOMER‐Pro program. In addition, the various systems components are introduced to the program, then modeled, and optimized. The developed approach was tested using a real case study considering realistic input data. HOMER‐Pro program is used to simulate and optimize the system design. The results revealed the potential of the HES to provide environment‐friendly, cost‐effective, and affordable electricity for the studied quarantine center, as compared to just the diesel generators system. For the considered case study, it is found that the PV‐wind‐diesel generators HES can cover the connected load with the lowest cost ($ 0.348/kWh) in comparison to other possible HES structures. Taking into consideration the price of harmful emissions, the wining system shows a reduction of 54.89% of the cost of energy (CoE) compared to other systems. For the considered case study, it is found that a combination of 150 kW PV, 200 kW wind, and two diesel generators with capacities of 500 and 250 kW can hold 100% of the electrical load required to keep the quarantine COVID‐19 center in operation. The initial capital cost of this HES is $510,576 where the share of wind energy, solar PV, inverter, and diesel‐electric generators are $320,000, $83,076, $25,000, and $82,500, respectively. The replacemen cost ($55,918) is due to diesel generators. The total operation and maintainance cost (O&M) is $268,737, that is, 25.6% for wind turbines, 1.2% for inverters, and 70.7% for diesel electric generators. The PV/wind/diesel generators HES generate 1,659,038 kWh of electricity. The total energy requirement of 1,442,553 kWh, which means a surplus of 212,553 kWh of energy/year. The total energy (kWh) is an integration of energy sources which are 427,276 (25.8%), 274,500 (16.5%), and 857,263 (57.7%), due to wind, solar and diesel generators respectively. The cost of yearly consumed fuel is $437,828.769. The payback period for the winning system is 1.8 years. Finally, it is proved that the developed approach gives a reasonable solution to the decision‐makers to find a fast, economic and reliable solution to energize the quarantine centers.
Keywords: COVID‐19 quarantine center, HOMER‐pro, hybrid energy system, Palestine, solar energy, wind energy
1. INTRODUCTION
The Gaza Strip located in Palestine (365 km2 total area) is a narrow plain land 51 km long along the eastern coast of the Mediterranean Sea. It is home to about 1.85 million people (Figure 1) and it has very limited resources. According to the Gaza Electricity Distribution Company, the Gaza Strip electricity demand is estimated at 550 MW, the available power is only 280 MW, which is accumulated from 140 MW generated by local electrical power plant (50%), 120 MW is supplied by the Israeli Electricity Company (43%), and 20 MW (7%) is coming from Egypt. Thus, there is a 51% electricity shortage. To compensate for this deficit, the Gaza Electricity Distribution Company adopted 8 h schedule in which electricity is turned on and off, respectively. 1 , 2 The problem of the electric power shortage has worsened, especially with the spread of the COVID‐19 virus among the residents of the Gaza Strip, which necessitated emergency measures, where the number of people infected with the disease reached around 189,837 people, and the number of deaths from this disease reached to 1691 people. 3
FIGURE 1.
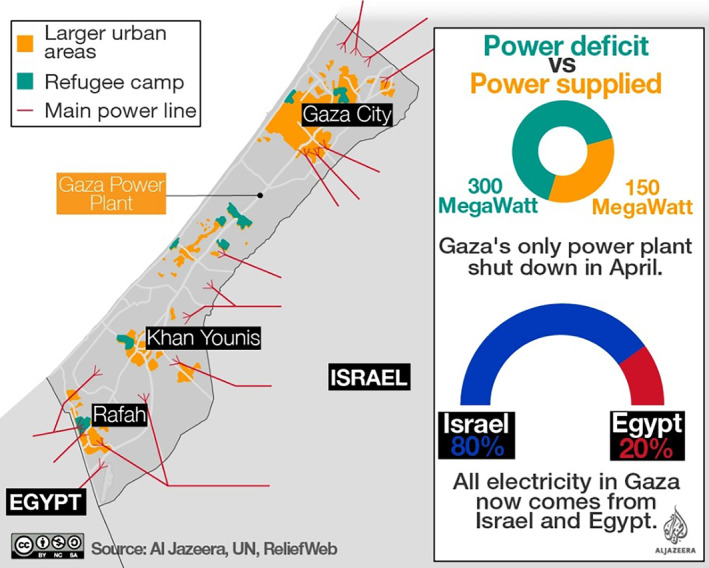
Location of COVID‐19 quarantine center in Gaza and the power deficit across the strip's cities 25
COVID‐19 is a highly contagious respiratory disease caused by the SARS‐CoV‐2 virus. 4 The first known case was identified in Wuhan, China, in December 2019. 5 The disease quickly spread across the globe, resulting in the COVID‐19 pandemic. As one precautionary procedure issued by the World Health Organization (WHO) to cease COVID‐19 disease, the Ministry of Health decided to reserve arrivals from outside the country in quarantine centers for 15 days until confirming that they are not infected with the virus. For this purpose, the Ministry established three quarantines centers next to the crossing points in the Gaza Strip (Figure 1), and of course, provided these centers with electrical appliances such as air conditioners, water heaters, lighting, television, refrigerator, and a washing machine to make the stay in these centers comfortably. With a power outage that reached 11 hours per day for the year 2021, 6 it was necessary to find a reliable source of energy as an alternative to the grid in order to supply the quarantine centers with electrical power during the intervals of a power outage. Moreover, it has been shown that COVID‐19 spread fast in air polluted areas. 7
Thus, it has been suggested to frustrate the further spread of the COVID‐19 pandemic, extensive research should be developed to increase renewable energy production as a cornerstone for supporting sustainability. 7 This presents the motivation behind the present research. Renewable and environmentally friendly sources of energy become a necessity to replace depleted and polluting fossil fuels in various applications. 8 , 9 In Reference 2, the authors studied the acceptance of using solar energy as a replacement for conventional fossil fuels in Gaza, Palestine. Results show that people have a strong tendency to use solar energy as a replacement for traditional fuel since it is abundant and environmentally friendly. Moreover, Reference 10 studied the implementation possibility of the solar system in the household in Gaza. Results show that Gazans have a great interest in implementing solar systems in their houses. The most promising sources of renewable energy in Gaza‐Strip are solar, wind, biomass, and geothermal energies. 11
Renewable energy potential in the Gaza Strip is investigated in many works, such as References 1, 12, 13, 14, 15, 16, 17, 18, 19, 20, 21. However, the drawback of using renewable energy specifically solar and wind energies is their variability from season to season and even during the day. 22 Thus, an integration of several energy sources (HES) is recommended. It has become certain that the urgent shift from conventional electricity generation to HES leads to mitigating global warming and the climate change effects. 21 , 23 , 24
In Palestine, only a few studies related to HES were performed. Alaydi presented a parametric study of solar and wind energy in the Gaza Strip in which wind power was compared with solar irradiance. Results showed that a large stand‐alone PV or wind energy converter will be needed to supply the peak demand in the months from June to September. 26
Abutaha and Shaheen investigated the different possibilities of photovoltaic solar/diesel generators HES at Nasser Hospital in Gaza. 27 The simulation results showed that the new HES decreases both operational costs and toxic emissions. 27 Al‐Najjar et al introduced an HRES of PV/biomass for the Gaza Strip using simulation HOMER‐Pro‐software. The results showed that the optimum solution with at least $2.30 M net present cost (NPC) and $0.438/kWh cost of energy (CoE). 21 In a different study, researchers proposed PV/battery/diesel generators off‐grid HES as a power source for the Islamic University of Gaza. 28 A review of the challenges and opportunities of solar and wind energy HES is given by Al Badawi et al. 29 Major power quality issues are voltage and frequency fluctuation, and harmonics for both grid‐connected and stand‐alone systems. 30 These can be mostly overcome by choosing the suitable design, advanced control systems and optimization of HES. 29
Worldwide, several studies have been conducted to investigate different types of HESs. An example of HES is an energy system that produces energy from a solar system, storage battery and electrical generators. 31 , 32 , 33 Sawle et al provided a review of HES based on PV and wind sources of energy with a comparative analysis with an off‐grid hybrid system. 34 Others take benefit from the site's topography and used the pumped hydropower as potential‐energy storage integrated PV/wind HES to supply 1.2 MW of electricity to a community in the southern region of Libya. 35
A feasibility study has been conducted by Fazelpour et al for using various hybrid energy systems in order to assess the power requirements of a 125 rooms hotel on Kish Island. 36 Babatunde et al gave an analysis of off‐grid PV/wind/battery/gasoline electric generators for a single residential apartment owned by a low‐income earner in particular technical, economic and environmental considerations. 32 The obtained results assured that HES is a promising technology with high efficiency, environmentally friendly and affordable for low‐income household, compared with using gasoline electric generators alone. 32 In a different research, the authors performed a feasibility study of electrical energy needs using PV/wind/battery HED for a household in Qeshm Island Iran using HOMER‐Pro. The obtained results suggested that the optimal configuration based on the lowest NPC and CoE is PV/wind HES with battery storage. 37 Different proposed energy systems consisting of PV/wind/diesel electrical generators are studied for a village in Saudi Arabia. 38 Palej et al provided a detailed analysis of PV/wind HES connected to the grid. 39 Sarkar et al developed and analyzed using HOMER‐Pro an integrated HES based on PV/wind/biomass/vanadium redox flow battery (VRFB) storage to satisfy daily energy demand. 40
Goswami et al in their article developed a grid‐connected solar‐wind HES to supply power to Sagar Island in India. 41 The developed hybrid renewable energy system (HRES) power plant will provide uninterrupted power to the island. The HES will also help the environment by reducing CO2 emissions by 1894.08 Tons annually and also will save 587.39 tons of coal in its lifetime. 41 In another work, Goswami and Sadh 42 proposed a floating solar photovoltaic system for wastewater treatment systems as large water surfaces are available. Their experimental study revealed that floating solar photovoltaic systems performed with 9.84% higher efficiency than land‐based PV modules. This is a very interesting result to consider in future studies.
Halabi et al in their study considered two decentralized power stations in Sabah, Malaysia; each contains a different combination of photovoltaic (PV), diesel generators, system converters, and storage batteries. 43 Their results show that the Hybrid PV/diesel/battery system has the best technical performance compared to all other scenarios. 43 A study presented by Hossain et al used HOMER‐Pro software to determine the optimal stand‐alone HES for a large resort center located in the South China Sea, Malaysia (SCSM). 44 The best optimized stand‐alone HES they obtained comprises PV, wind, diesel generator, converter and battery. The optimized system resulted in a cost of energy (COE) of $0.279/kWh. 44 A review of off‐grid systems for rural electrification in developing countries is presented by Mandelli et al. 45 Olatomiwa et al 46 present in their article a comprehensive review of both the standalone hybrid renewable energy systems and the grid‐connected hybrid renewable systems approaches as given in many papers, with focus on different HES configurations. A list of other studies that conducted the HESs have been carried out in different areas in the world is given in Table A1. The authors seek through demonstrating the experiences of other countries in Table A1 to prove the reliability of utilizing the HESs in the Gaza Strip. Thus, it can be a part of the solution to overcome the electrical crisis that Gaza suffers since 2005.
TABLE A1.
The experiences of some countries in hybrid systems
| Year | Publication | Country | Components | Load kWh/day‐ kWpeak | Grid | $/kWh |
|---|---|---|---|---|---|---|
| 2015 | Gan et al. 67 | Scotland | Wind/PV/diesel | 15 kWh/day | Off‐grid | 0.78 |
| 2015 | Diab et al. 68 | Egypt | PV/wind/diesel/battery | 1100 kwh/day | Off‐grid | 0.19 |
| 2020 | Alzaid et al. 69 | Saudi Arabia | Wind/PV | 5 kW/h | Off‐grid | 0.33 |
| 2019 | Major & Oshiemele 70 | Nigeria | Wind/diesel | 50 MWpeak | Off‐grid | 0.077 |
| 2016 | Ani 71 | Nigeria | PV/diesel | 69 kWh/day. | Off‐grid | 0. 745 |
| 2019 | Nurunnabi et al. 72 | Bangladesh | Wind/PV | 2687.54 kwh/day | On‐grid | 0.097 |
| 2019 | Nurunnabi et al. 72 | Bangladesh | Wind/PV | 1521.37 kWh/day | Off‐grid | 0.288 |
| 2020 | Rehman 73 | Saudi Arabia | PV/diesel | 11,160 kWh/day | Off‐grid | 0.349 |
| 2015 | El Khashab & Al Ghamedi 74 | Saudi Arabia | PV/wind/fuel cell | 16 kWh/day | On‐grid | 0.36 |
| 2015 | Jasim et al. 75 | Iraq | PV/diesel | 76 kW peak | Off‐grid | 3.43 |
| 2019 | El Attafi 76 | Morocco | PV/wind | 3626 kW peak | Off‐grid | 0.130 |
| 2019 | Ali and Jang 77 | South Korea | PV/Wind | 7.296 MWh/yr | Off‐grid | 0.123 |
| 2015 | Diab et al. 22 | Egypt | PV/wind/diesel/battery | 10,000 kWh/day | Off‐grid | 0.17 |
| 2020 | Costa & Villalva 78 | Brazil | PV/diesel |
6.16 kWh/day 4.08 kWpeak |
Off‐grid | 0.126 |
| 2021 | Falama et al. 79 | Cameroon | PV/battery | 12,231 Wh peak | On‐grid | 0.15 |
| 2018 | Richa & Karaki 80 | Lebanon | PV/diesel | 23 MWpeak/yr | Off‐grid | 0.0081 |
| 2021 | Canziani et al. 81 | Peru | PV//diesel/battery | 23 kWh | Off‐grid | 0.267 |
| 2013 | Bahta 82 | Ethiopia | PV/wind/diesel/battery | 1505 kWh/day | Off‐grid | 0.348 |
| 2016 | Alayan 83 | Lebanon | PV/diesel | 1775 kWh/day | On‐grid | 0.12 |
| 2021 | Maoulida et al. 84 | Comoros | PV/wind/diesel | 63 kWh/day | Off‐grid | 0.198 |
| 2016 | Hassan et al. 85 | Iraq | PV/wind/diesel | 93 kWh/day | Off‐grid | 0.321 |
| 2014 | Nour & Rohani 86 | UAE | PV/diesel | 24 MWh/day | Off‐grid | 0.313 |
| 2016 | Sawle et al. 87 | China | PV/wind/diesel/battery | 110.6 kWh/day | Off‐grid | 0.099 |
| 2021 | Chauhan et al. 88 | India | PV/diesel/battery | 89.80 kWpeak | Off‐grid | 0.261 |
| 2017 | Rajbongshi et al. 89 | India | PV/biomass gasifier/diesel and grid | 178 kWh/day | On‐grid | 0.91 |
Nowadays, the HES becomes a competition variant in the energy market even in low‐income countries (such as Palestine), and is cost‐effective compared to diesel fueled generators which makes them very attractive for wide exploitations instead of diesel generators. 32 HES may be a stand‐alone or on/off‐grid system. This selection depends on parameters such as grid availability, cost of grid‐supplied electricity, and the potential of the renewable energy resource in the application site. 47 The significance of the present paper lies in proposing a hybrid system to generate electric power, completely independent of the public electricity grid for COVID‐19 quarantine centers. Therefore, this study is the most comprehensive in this field. In this context, it is believed that the present study has the following contributions:
Highlighting the technical, economic and environmental feasibility of hybrid renewable energy resources in Gaza‐Strip;
Proposing the first HES that consists of three sources of energy in the country;
Providing the optimum design parameters of a HES consists of PV/wind/diesel generators to provide 100% of electrical energy for a COVID‐19 quarantine center in Gaza‐Strip;
Proving the capability of the local renewable energies to be a part of the solution in overcoming the economic and social crisis the sector is experiencing as a result of the electricity deficit;
Calculating The payback period and
Estimating the cost of producing energy from HES considering the cost of an environmental hazard.
2. METHODOLOGY
The considered simulated hybrid renewable energy system consists of a wind turbine, photovoltaic (PV) array and diesel generators. Diesel generators, exist on the site, are used as a base and backup unit for the considered system. Therefore, we did not consider adding batteries. The considered system is designed specifically for an off‐grid case. The data required for solar and wind resources for the designated site were taken from online data of the NASA methodological department.
2.1. Modeling of the HES system
The proposed system to be studied (Figure 2) consists of a PV system, wind turbines, and two diesel generators (DGs) as well as the connected loads. The mathematical models of the major components of the system are presented in section 2.2.
FIGURE 2.
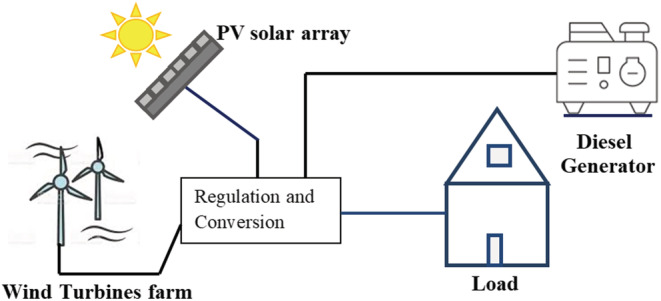
The layout of the proposed hybrid off‐grid energy system
2.2. Scheme of the proposed HES
2.2.1. PV solar energy system
The PV panel is the responsible party of the solar system to convert the solar power into an electrical one. The produced power by a PV panel is calculated as follows 48 :
| (1) |
where P PV represents output power, is the nominal output energy at standard test condition (STC), T cell , T STC are the temperature of the PV module and the STC cell temperatures, respectively. is the power temperature coefficient (W/°C), and and are the global and STC solar radiations, respectively.
2.2.2. Wind energy system
The generated power by a wind turbine varies with wind speed and wind turbine structure. Based on Reference 33, the generated power by a wind turbine can be formulated as follows:
| (2) |
ρ is the air density, A is the rotor area in m2, V is wind velocity in m/s, C p is the performance density of air coefficient of the turbine and η t and η g are the efficiencies of the wind turbine and the generator, respectively.
2.3. HOMER‐Pro software
The HOMER software is used to model and perform the determination of optimal sizing and operational strategy for a hybrid renewable energy system based on simulations and optimization.
2.3.1. HOMER‐Pro simulation
Design of the considered system based on the selection of components by the design engineer. In this process, energy balance calculation will be performed by HOMER‐Pro based on the system configuration comprising several numbers of sizes of the component. Here, the considered components are PV array, wind turbine, and diesel generator for the purpose of analysis. After simulation, it determines the best optimal system configuration which is suitable to provide the energy demand. HOMER‐Pro will simulate the designed system based on the estimation of installation cost, replacement cost, operation and maintenance cost, fuel and interest rate. 49 , 50
2.3.2. HOMER‐Pro optimization
The optimal solution is obtained after simulating the entire possible number of selections of hybrid renewable energy system configuration. A list of configuration results is displayed in a sorted form considering NPC and CoE. HOMER is utilized to analyze the different types of system configurations from the lowest to the highest NPC value. 49 , 50
2.3.3. Optimal design approach
The load inputs are given to the Homer‐Pro system to do the simulation and obtain the optimal design. Figure 3a shows the interaction between simulation and optimization, and Figure 3b presents key information for the modeling. Figure 3c gives a detailed flowchart of the process of optimization of the system using HOMER‐Pro.
FIGURE 3.
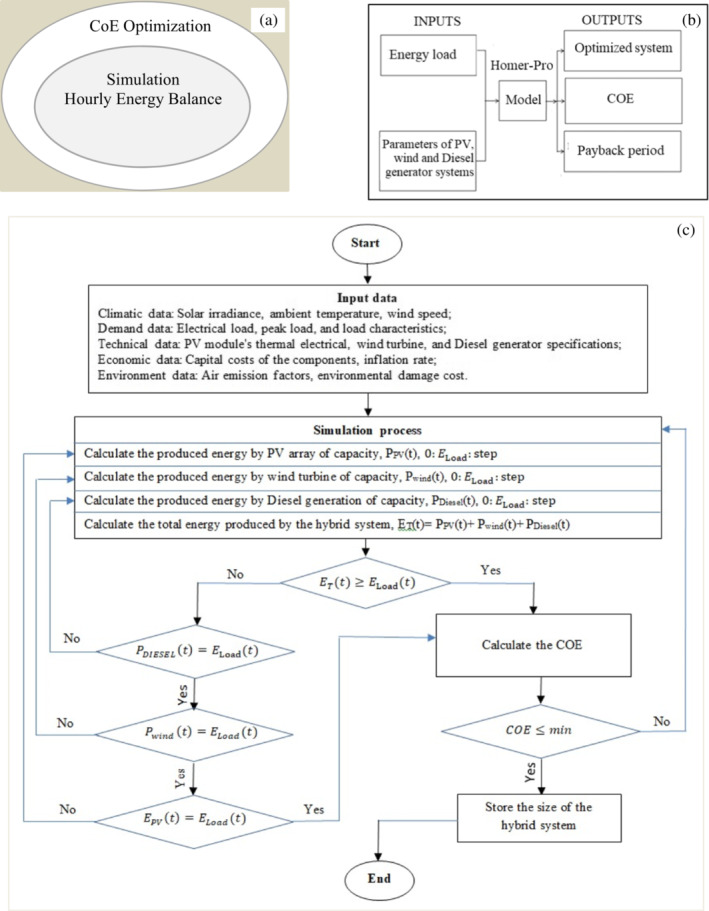
(a) Interactions between simulation and optimization (b) key information for modeling (c) flowchart presents the optimization process used by HOMER‐Pro
As discussed before, the HES system should be designed to cover the connected loads economically and environmentally in simultaneous way. In the proposed approach, the PV system size , the diesel generator size , the number of the diesel generators , and wind turbines number should be optimized to minimize the capital cost of energy and the harmful gas emissions. Therefore, the optimal design problem can be formulated as follows:
| (3) |
Subject to:
is the given set for the possible diesel generators to be installed by the user. Moreover, the CoE equals the total‐annualized cost of the consumed energy divided by the total served energy by the system as follows:
| (4) |
In addition, the harmful gas emissions that include carbon dioxide (CO2), carbon monoxide (CO), unburned hydrocarbons, particulate matter, sulfur dioxide, and nitrogen oxide are studied.
2.4. Case study
2.4.1. Proposed site
HES is proposed to power the quarantine center (Figure 4) locate in Dier El Balah city in the middle of Gaza‐Strip, Palestine. This information is fed to HOMER‐Pro to get data about solar irradiance and wind speed in the region. Presently, the quarantine center is powered by two diesel generators and by a power line from the Gaza electricity distribution company (GEDCo). Gaza imports diesel causing a high price for electricity production by a diesel generator and urging the exploration of renewable energy as an alternative to meet load demands. The input data, used to simulate and analyze the HES as well as the design results of different HES configurations, are discussed in the following sections.
FIGURE 4.
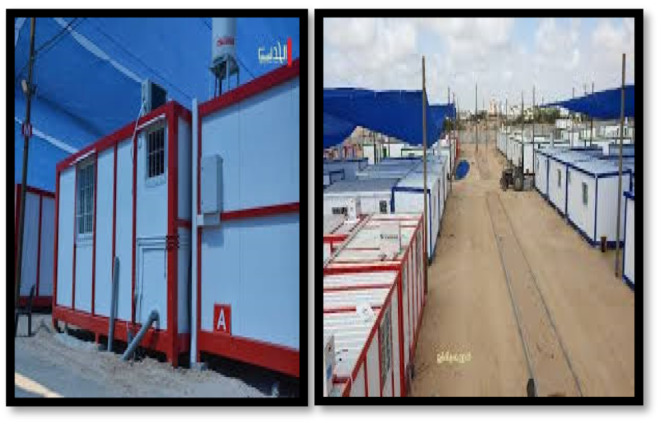
Dier El‐Balah quarantine center 51
2.4.2. Electrical load
The Palestinian Ministry of Health recommended 14–21 days as a quarantine period. Therefore, the appliances for each tenant in the quarantine center should provide an adequate comfort level during the infected person's stay. In this study, air conditioners, heaters, refrigerators, washing machines, and lights are the specified appliances for a tenant in the quarantine center. The estimated power consumption* of the presented appliances are listed in Table 1. The load demand is measured and plotted as shown in Figure 5.
TABLE 1.
Typical appliance rating power in a quarantine center a
| Electrical device | Power (W) | Quantity | Operating hours (h/day) | Energy consumed kWh/day |
|---|---|---|---|---|
| Air conditioner 12000 BTU | 1060 | 165 | 9 | 1574.1 |
| Heater (40 L) | 2500 | 165 | 3 | 1237.5 |
| Heater (2 L) | 2200 | 165 | 1.5 | 544.5 |
| Refrigerator (6 cu. ft) | 150 | 165 | 9 | 222.8 |
| Washing machine | 1500 | 16 | 12 | 288 |
| Inner light | 40 | 165 | 9 | 59.4 |
| Outer light | 100 | 20 | 13 | 26 |
| Total energy consumed | 3592 | |||
Meeting with the head of the safety health department (Ministry of Health).
FIGURE 5.
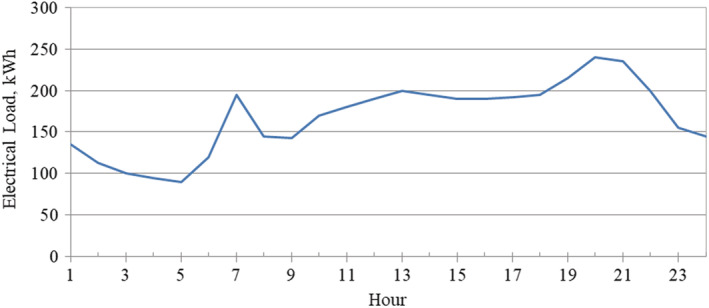
Daily electrical load profile for the study site
2.4.3. Wind speed
Wind speed is obtained from the HOMER‐Pro website. Figure 6 exhibits the hourly wind speed and the wind rose at an altitude of 30 m above the ground level for the study site. It can be seen from Figure 6, that the site experiences minimum and maximum average speed values of 3.99 m/s and 5.41 m/s in August and February respectively. The average yearly wind speed is around 4.68 m/s.
FIGURE 6.

Hourly wind speed and wind rose at the study location
2.4.4. Solar radiation
Solar radiation and temperature data are taken from the HOMER‐Pro website. The hourly global horizontal irradiation (GHI) at the site is used to calculate the output of the flat panel PV array as in Figure 7. The maximum solar radiation occurs in summer (June and July) with an average of 7.985 kWh/m2/day/year. The annual average solar GHI is equal to 5.57 kWh/m2/day.
FIGURE 7.
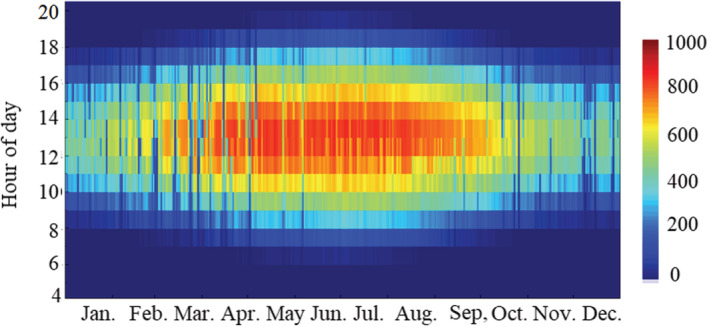
Hourly global horizontal solar irradiance at the study site
2.4.5. Ambient temperature
Ambient temperature is playing a crucial role in energy systems design. 52 , 53 It can also be seen explicitly from Equation (1). Figure 8 presents a contour plot of the hourly air temperature of Dier El Balah. August is the hottest month with temperatures ranging from 24 to 32°C. While January is the coldest month with temperatures varying from 9 to 18°C. The year around mean temperature is considered 24°C.
FIGURE 8.
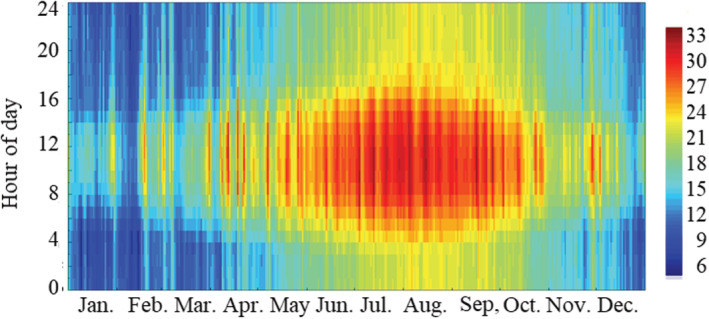
Hourly ambient temperature at the study site 54
2.4.6. Assumptions, limitations and uncertainties
The following assumptions are considered in the present work to facilitate the simulation process:
A fixed operating cost which includes maintenance, insurance and labor costs in addition to fuel cost for diesel generator;
Constant efficiencies for all systems;
The land and land preparing costs are not included;
The degradation rate is taken constantly during the lifespan 0.2%.
The O&M costs included all daily or periodic expenses, including workers' salaries, taxes, and so on.
The major sources of uncertainty are data availability, model selection and parameter estimation. It was reported that the uncertainty values for global solar irradiation are 2%–5% for ground measurements and for satellite‐derived data, respectively. 55 This value will be exacerbated when the horizontal solar radiation is converted to tilted one by using the transposition models. 56 The price of renewable energy facilities is also considered a source of uncertainty. Nassar and Alsadi 12 reported that the variance in the prices of the PV modules exceeded 360%. Also, the rate of exchange is one of the uncertainty sources in the results, especially in research that uses several currencies, which must eventually be converted into one currency. The main limitation of the present study is that it does not provide a sensitivity analysis of the effect of various design and operating parameters and their weights on the decision.
3. PROPOSED HYBRID ENERGY SYSTEM DESIGN OPTIONS AND RESULTS
In this section, four different schemes are presented in which the base system is considered the two diesel‐electric generators, the second system consists of wind/diesel generators HES, the third system consists of PV/diesel generators HES, and the fourth system is PV/wind/diesel generators HES as in the following subsections.
The obtained results from HOMER‐Pro software are presented in Figure 9 including hourly yields of 150 kW capacity PV solar system, wind turbine of 200 kW capacity and two diesel generators with 250‐ and 500‐kW capacities as compared to the electric load. The operation regime, behavior and the rated power obtained by each source are plotted as a series view in Figure 9.
FIGURE 9.
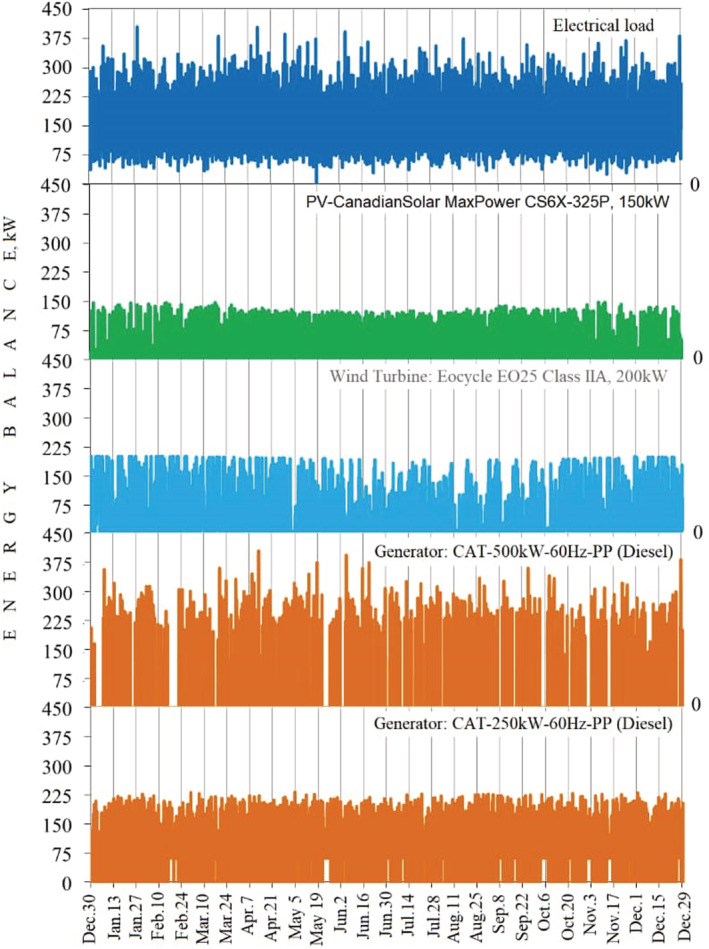
The Hourly electrical production of 150 kW PV solar system capacity, 200 kW wind turbine capacity, 250 and 500 kW diesel generators capacities as compared with the load capacity
3.1. The power system consists of two diesel electric generators
The techno‐economics analysis for two AC‐diesel generators with 500 kW (CAT‐500 kW) and 250 kW (CAT‐250 kW) ratings (current situation on site) is conducted using HOMER‐Pro. Both generators have 20,000 h lifetimes, 25% minimum load radio, and $1.47/l fuel cost. Additional costs related to 500 and 250 kW generators are $120/kW and $60/kW capital cost, $90/kW and $45/kW replacement cost, and $1/h and $0.5/h operation and maintenance cost (O&M), respectively. Figure 10 presents the schematic diagram of the proposed design where the two generators are connected to the load via the AC bus line.
FIGURE 10.
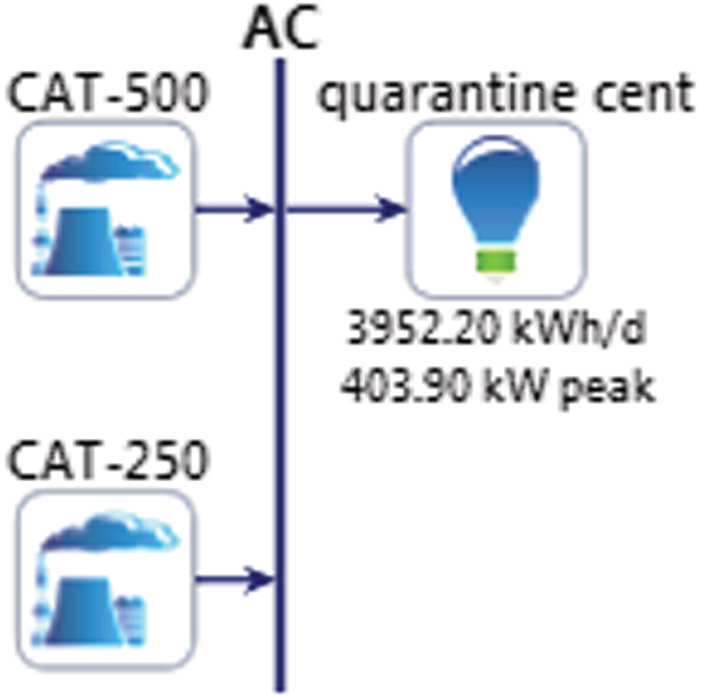
Diesel electric‐generators‐based system
Table 2 displays HOMER‐Pro simulation results where the first and second row shows the results when using two generators vs. one generator second row, respectively. Table 3 indicates that the optimal cost of electric energy occurs when operating the two generators and equals $0.43/kWh. In this case, CAT‐500 kW and CAT‐250 kW operated for 1248 and 7512 h per year respectively and 413,184 liters of fuel were used which is lower than the system with only CAT‐500 kW. The net present cost of the optimal system as calculated by HOMER‐Pro is $8.06 M, which is lower than the net present cost of the system only CAT‐500 kW which is $ 9.3 M. The optimal system has lower CO2 (kg/year) emission compared to a base system where it is found the optimal system emits 1,091,681 kg/year and the base system emits 1237,331 kg/year.
TABLE 2.
Simulation results of diesel only case
| CAT‐500 (kW) | CAT‐250 (kW) | Cost/CoE ($) | System/total fuel (m3/yr) | CAT‐500/hours | CAT‐500/production (MWh) | CAT‐500/fuel (m3) | CAT‐500/fuel cost ($/yr) | CAT‐250/hours | CAT‐250/production (MWh) | CAT‐250/fuel (m3) | CAT‐250/fuel cost ($/yr) | Cost/NPC ($) |
|---|---|---|---|---|---|---|---|---|---|---|---|---|
| 500 | 250 | 0.43 | 413 | 1248 | 326 | 93 | 137,257 | 7512 | 1119 | 320 | 470,123.5 | 8,061,773 |
| 500 | ‐ | 0.50 | 468 | 8760 | 1509 | 468 | 687,637 | ‐ | ‐ | ‐ | ‐ | 9,297,429 |
TABLE 3.
Simulation results of wind/diesel HES
| EO25IIA | CAT‐500 (kW) | Architecture/CAT‐250 (kW) | Cost/CoE ($) | System/total fuel (m3/yr) | CAT‐500/Hours | CAT‐500/production (MWh) | CAT‐500/fuel (m3) | CAT‐500/fuel cost ($/yr) | CAT‐250/hours | CAT‐250/production (MWh) | CAT‐250/fuel (m3) | CAT‐250/fuel cost ($/yr) | EO25IIA/production (MWh/yr) | Cost/NPC ($) | System/renewable fraction (%) |
|---|---|---|---|---|---|---|---|---|---|---|---|---|---|---|---|
| 8 | 500 | 250 | 0.38 | 332 | 742 | 182 | 53 | 774,70 | 7988 | 923 | 280 | 410,811 | 433 | 7,034,956 | 23.4 |
| 500 | 250 | 0.43 | 413 | 1248 | 326 | 93 | 137,257 | 7512 | 111,9 | 320 | 470,124 | 8,061,773 | 0 | ||
| 8 | 500 | 0.48 | 419 | 8730 | 1308 | 419 | 615,876 | 433 | 8,895,312 | 9.3 | |||||
| 500 | 0.50 | 468 | 8760 | 1509 | 468 | 687,637 | 9,297,429 | 0 |
Table 2 lists the value of total energy generated in 1 year (1,444,039 kWh/year), jointly produced by the two generators where 22.5% and 77.5% of energy production was generated by CAT‐500 kW and CAT‐250 kW generators, respectively. Accordingly, there is 1486 kWh/year of excess energy. It is also noticed that there is a reduction in the cost by $1,235,656 in favor of the optimized system.
3.2. Wind/diesel electric generators HES
To reduce diesel consumption and mitigate the environmental impact in Gaza‐Strip, the system analyzed in section 3.1 is integrated with wind turbines (referred to by ES25IIA in Figure 11) each has three blades and produces 25 kW. It is assumed that the wind turbine capacities are taken to be 25, 50, 75, 100, 125, 150, 175, 200 kW to 500 kW. Thus, for example, the accumulated power by eight wind turbines is 200 kW. The wind turbine considered in this study has a 30 m rotor diameter and 30 m height and 20 years lifetime. The cut‐in wind speed and rated speeds are 3.5 and 12 m/s, respectively. The capital cost and O&M costs are $40,000/year and $2000/year, respectively for each wind turbine.
FIGURE 11.
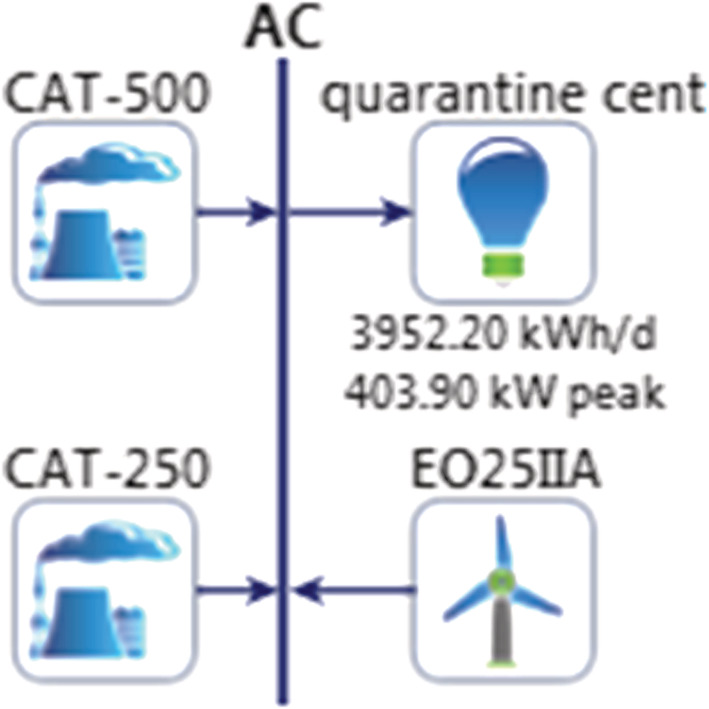
Wind/diesel hybrid off‐grid energy system
Table 3 displays the HOMER‐Pro simulation results of the proposed system. The optimal HES consists of two diesel generators and 8 wind turbines with the minimum cost of energy (CoE) ($0.377/kWh). This is lower than the CoE of the diesel generators only (CoE = $0.43/kWh). It can also be noticed that via using wind/diesel electric generators HES, there is a reduction in consuming diesel by 332,164 liters compared to using the diesel‐electric generators only which consume 413,184 liters saving of 81,020 liters/year. Moreover, the total diesel generator operating time in the optimal system is lower than the operating time of diesel‐electric generators only system by 30 h in the year where this system operates 8730 h while diesel only system operates 8760 h. The HES produced 1,538,335 kWh electricity/year, 28.2% produced by wind turbines, 11.8% and 60% of energy produced by 500 and 250 kW generators, respectively. Excess energy equals 95,782 kWh/year is produced by wind/diesel electric generators HES as compared with the base system. The total capital cost of the wind/diesel electric generators HES equals $402,500/year and the total replacement and O&M costs are $5295/year and $268,065/year, respectively. The replacement cost for wind turbines and diesel generators are considered zero and $52,952/year, respectively. Further, the O&M costs for wind turbines and diesel generators are $206,840/year and $61,225/year, respectively. In addition, Table 3 shows a reduction in the net cost as we add renewable energy sources which have participated by 23.4% in the optimal system.
3.3. PV/diesel electric generators HES
In this section, a solar PV/diesel‐electric generator HES is proposed (Figure 12) and analyzed using HOMER‐Pro. In Figure 12, CS6X represents PV panels. The load data and diesel generator inputs are kept the same as in section 3.1. Solar radiation data, discussed in section 2.4.4, and PV panel‐related technical specifications (Table 4) have been considered as input. A 30 years lifetime 325 W PV panel cost is taken as $180. PV efficiency is 16.17%, and its derating factor is 80%. The replacement cost and the capital cost are chosen to be equal and $1/year per PV panel is assigned for O&M cost. The PV is assumed to have a 30.9° tilt angle (angle with the ground). The total capacity of the PV panel and inverter capacity is ranged 25, 50, 75, 100, 125, 150, 175, 200 kW till 500 kW. The inverter cost equals $5000/30 kW and its maintenance cost is $0/year/30 kW. The technical specifications of the inverter are listed in Table 4. The lifetime and efficiency of the inverter were 20 years and 93%, respectively.
FIGURE 12.
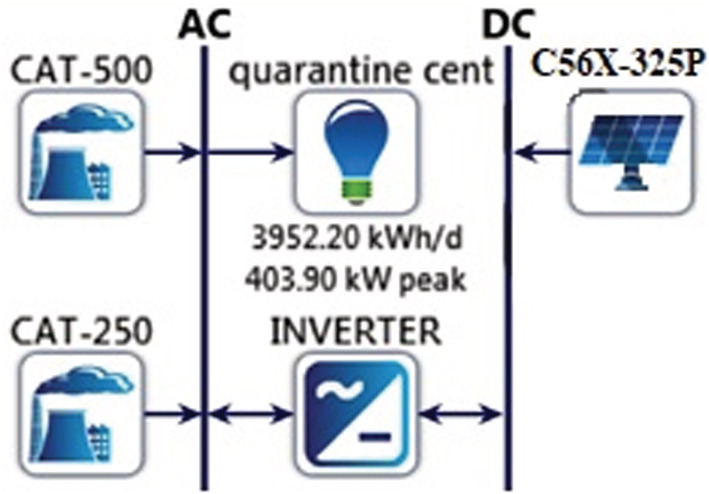
PV/diesel hybrid power system
TABLE 4.
PV module specifications
| Item description | Value |
|---|---|
| PV panels 57 | |
| Brand name | Canadian |
| P max at STC | 325Wp |
| V mp | 39.1 V |
| I mp | 10.42 |
| V o | 45.8 V |
| I s | 9.28 A |
| Module efficiency | 16.17% |
| Operating module temperature | 40°C to +85°C |
| Maximum system voltage | 1000 V DC |
| Maximum series fuse rating | 20 A |
| Price | $180 |
| Inverter 58 | |
| Brand Name | STP |
| Max. DC power/DC‐rated power | 25,550 W/25,550 W |
| Max. input voltage 1000 V | Max. input voltage 1000 V |
| Output wave | Pure Sine Wave |
| Output voltage | 230VAC |
| Output frequency | 50/60 Hz |
| System voltage | 48VDC |
| Solar charger | 60A, MPPT |
| AC charger | 60A @ 48VDC |
| Max. efficiency | 93% |
Table 5 shows that the optimal solution (from HOMER‐Pro analysis) has a minimum CoE equal $0.38/kWh which consists of 150 kW PV, 150 kW inverter and two generators. The CoE for this system is lower than for a diesel‐electric generator system but higher than for wind/diesel‐electric generator HES. In the PV/diesel‐electric generator HES, 16.6% of total energy is produced by PV systems. Diesel consumption was increased to 357088.26 L compared to 332,164 L for wind/diesel‐electric generator HES but lower than 413,184 L for diesel generators only system. Thus, the PV/diesel electric generators HES saved 56,096 L compared with the diesel generators only system.
TABLE 5.
HOMER‐pro results for PV/diesel HES
| CS6X‐325P (kW) | CAT‐500 (kW) | CAT‐250 (kW) | Inverter (kW) | Net present cost ($) | CoE ($) | Operating cost ($/yr) | Initial capital cost ($) | Renewable fraction (%) | System fuel consumption (m3/yr) |
|---|---|---|---|---|---|---|---|---|---|
| 150 | 500 | 250 | 150 | 7,103,314 | 0.38 | 534,731 | 190,577 | 16.59 | 357 |
| ‐ | 500 | 250 | ‐ | 8,061,773 | 0.43 | 617,232 | 82,500 | ‐ | 413 |
| 150 | 500 | ‐ | 100 | 8,741,314 | 0.47 | 663,822 | 159,744 | 5.36 | 433 |
| ‐ | 500 | ‐ | ‐ | 9,297,429 | 0.50 | 714,556 | 60,000 | ‐ | 468 |
The solar PV panels produced a total of 274,500 kWh while diesel generators produce 1,203,219 kWh of electricity for a total of 1,477,719 kWh during 1 year of operation. This means that solar energy and diesel‐electric generators contributed by 16.6% and 83.4% of the total energy, respectively. Of this total energy, 28,857 kWh (1.95%) is surplus. The total capital cost of the HES is $190,577 as follows; $83,077 PV system cost, $25,000 invertor cost, and $82,500 diesel generators cost. The replacement cost of HES is $67,382 due to diesel‐electric generators and PV system and zero for invertor. The O&M cost of the HES for 1 year is $67,501($1293 for PV, $63,623 for diesel‐electric generators, and $2586 for the inverter).
3.4. PV/wind/diesel electric generators HES
Figure 13 displays a PV/wind/diesel‐electric generator HES. In HES, the wind turbine capacities are taken to be 25, 50, 75, 100, 125, 150, 175, 200 kW till 500 kW; PV system capacities and inverter capacities are taken similarly, and the two diesel generators capacities are 250 and 500 kW as they are given by the site operator. These values are fed to HOMER‐Pro software as input. The simulation is done using HOMER‐Pro which revealed the optimum HES with minimum CoE. Table 6 presents the simulation results that showed PV/wind/diesel electric generators HES have a minimum CoE of $0.348/kWh. The wining system consists of eight wind turbines (200 kW), PV panels (150 kW), an inverter (150 kW), and two diesel generators (750 kW). The initial capital cost of this HES is $510,576 where the share of wind energy, solar PV, inverter, and diesel‐electric generators are $320,000, $83,076, $25,000, and $82,500, respectively. The replacement cost ($55,918) is due to diesel generators. The total O&M cost is $268,737, that is, 25.6% for wind turbines, 1.2% for inverters, and 70.7% for diesel electric generators.
FIGURE 13.
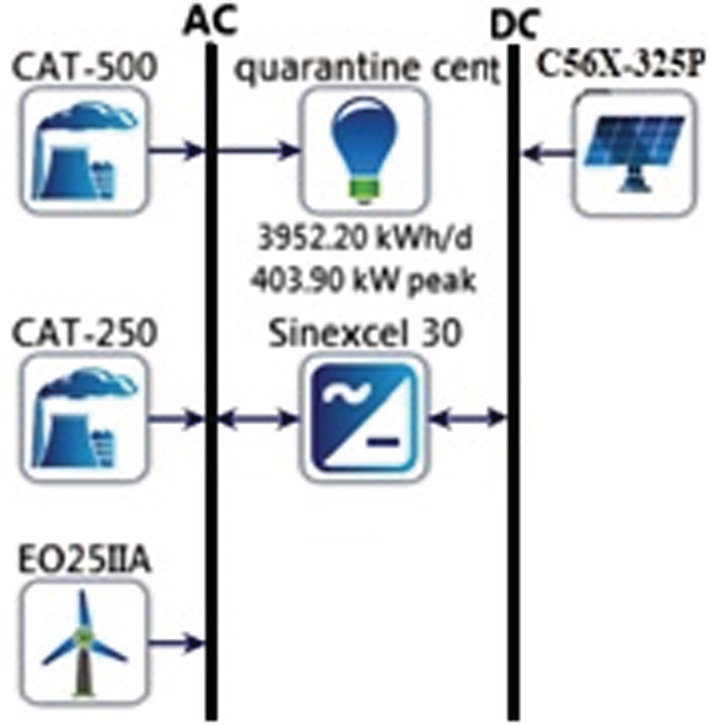
PV/wind/diesel hybrid off‐grid energy system
TABLE 6.
HOMER‐Pro simulation output for PV/wind/diesel generators HES
| PV (kW) | Wind converter (kW) | Diesel generator 500 (kW) | Diesel generator 250 (kW) | Inverter 30 (kW) | Cost/CoE ($/kWh) | System/total fuel (m3/yr) | Cost/operating cost ($/yr) | Cost/initial capital ($) | Cost/NPC ($) | System/Ren Frac (%) | System/total fuel (L/yr) |
|---|---|---|---|---|---|---|---|---|---|---|---|
| 150 | 8 | 500 | 250 | 150 | 0.348 | 298 | 462603.5 | 510,576 | 6,490,890 | 33.6 | 297,842.7 |
| 150 | ‐ | 500 | 250 | 150 | 0.38 | 357 | 534530.5 | 190,576 | 7,100,728 | 16.6 | 357,088.3 |
| 150 | 4 | 500 | ‐ | 100 | 0.46 | 413 | 642714.1 | 319,742.7 | 8,628,440 | 11.0 | 413,403 |
| 150 | ‐ | 500 | ‐ | 100 | 0.47 | 433 | 663688.7 | 159,742.7 | 8,739,589 | 5.3 | 433,109.2 |
The PV/wind/diesel generators HES generate 1,659,038 kWh of electricity. The total energy requirement of 1,442,553 kWh, which means a surplus of 212,553 kWh of energy/year. The total energy (kWh) is an integration of energy sources which are 427,276 (25.8%), 274,500 (16.5%), and 857,263 (57.7%), due to wind, solar and diesel generators, respectively. The cost of yearly consumed fuel is $437,828.769.
Accordingly, the total monthly accumulated energy generated by a HES consisting of PV/wind/diesel electric generators is depicted in the form of stacked bars as shown in Figure 14.
FIGURE 14.
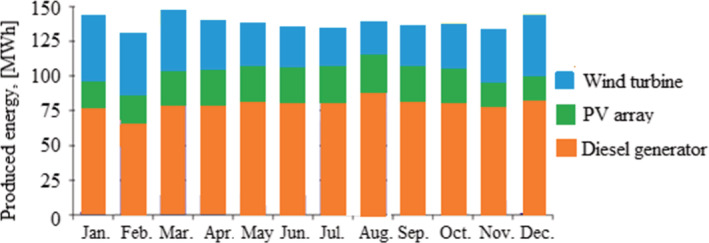
The accumulated power generated via three combinations of hybrid off‐grid energy system
3.5. Economic–environmental assessment of the HES options
In this work, we present four HESs which are diesel electric generators, wind/diesel electric generators HES, PV/diesel electric generators HES, and PV/wind/diesel electric generators HES. In the analysis, the fuel cost is considered equal to $1.47/l while looking for the optimal HES with minimum CoE. The results for different HES are given in Table 7. The results show that the lowest CoE is $0.348/kWh in the case of PV/wind/diesel electric generators HES.
TABLE 7.
Comparison between different HES options
| Item | Diesel‐electric generators | Wind/diesel electric generators | PV/diesel electric generators | PV/wind/diesel electric generators |
|---|---|---|---|---|
| Renewable Fraction, % | 0 | 28.2 | 18.6 | 42.3 |
| CoE, ($/kWh) | 0.430 | 0.377 | 0.380 | 0.348 |
| Fuel consumed, (L/yr) | 413,184 | 332,164 | 357,088 | 297,843 |
| Fuel cost, ($/yr) | 607,381 | 488,281 | 524,920 | 437,829 |
| Capital cost, ($) | 82,500 | 402,500 | 190,577 | 510,576 |
The utility company in Gaza‐Strip, Palestine (GEDCo) that distributes energy to local customers in Gaza‐strip receives energy mainly from Israel, Egypt and the only local power station. The local station relies on diesel to generate electricity, the emission factor for producing electricity is more than 0.81 kg CO2/kWh. 59 The emission factor includes carbon monoxide, unburned hydrocarbons, particulate matter, the proportion of fuel sulfur converted to PM (%), and nitrogen oxide. According to HOMER‐Pro simulation results, the types and values of greenhouse gases (GHG) (kg/year) for the proposed systems are listed in Table 8.
TABLE 8.
Emissions associated with each HES options
| Pollutant (kg/yr) | Diesel‐electric generators | Wind/diesel electric generators | PV/diesel electric generators | PV/wind/diesel electric generators |
|---|---|---|---|---|
| CO2 | 1,091,618 | 877,475 | 943,404 | 786,803 |
| CO | 947 | 816 | 826 | 735 |
| Unburned hydrocarbons | 38 | 32.3 | 33.1 | 29.1 |
| Particulate matter | 40.8 | 33.9 | 35.4 | 30.5 |
| Sulfur dioxide | 2710 | 2179 | 2342 | 1954 |
| Nitrogen oxides | 7837 | 6304 | 6773 | 5653 |
It is obvious that the emissions are reduced significantly when adding renewable energy resources in addition to diesel generators. The best case with the lowest harmful emission is when using PV/wind/diesel electric generators HES. The CO2 mitigation cost saving can be calculated as follows 60 , 61 :
| (5) |
is the emission factor of CO2 [kg CO2/kWh], is the generated electrical power [kW], refers to the friction coefficient of the renewable energy [kW], and indicates to the international price of CO2. And it is expected to be $79.10/ton CO2 for 2022. 62
Accordingly, calculations were carried out for all generation options, including connection with the public electricity grid, and for all HES options. Table 9 listed the obtained results.
TABLE 9.
The cost of CO2 mitigation cost saving for all options of generation
| Pollutant | [MWh/yr] | , [ton/MWh] |
|
$/yr | |
|---|---|---|---|---|---|
| Diesel‐electric generators | 1443 | 0.81 | 0 | 0 | |
| Wind/diesel electric generators | 1443 | 0.81 | 0.282 | 26,073 | |
| PV/diesel electric generators | 1443 | 0.81 | 0.186 | 17,197 | |
| PV/wind/diesel electric generators | 1443 | 0.81 | 0.423 | 39,109 |
The cost of environmental damage from an annual generating 1443 MWh is about $136,970/year from the Gaza electrical station, while from the diesel electric generators is about $92,455/year.
The new trend of economic evaluation of renewable energy systems is involving the cost of environmental damage in the CoE estimation. This way gives a fair opportunity for alternative energies to compete in the energy market. 61 A precise way for estimating CoE for specific HES installation is expressed in terms of key financial aspects as 63 , 64 :
| (6) |
where present the annual capital cost of PV, wind and diesel electric generators systems respectively. refer to the annual O&M costs of PV, wind and diesel electric generators systems respectively. r is the discount rate (8%) and n is the lifetime (25 years). By applying Equation (6), new values for the cost were obtained. These values are tabulated in Table 10.
TABLE 10.
The CoE by considering the CO2 mitigation cost‐saving approach
| Item description | Diesel‐electric generators | Wind/diesel electric generators | PV/diesel electric generators | PV/Wind/diesel electric generators |
|---|---|---|---|---|
| CoE $/kWh | 0.430 | 0.253 | 0.296 | 0.157 |
|
Percentage of reduction in CoE value; % |
0 | 32.9% | 22.1% | 54.89% |
It is clear from Tables 9 and 10 that, increasing the renewable energy fraction coefficient will raise the share of renewables in installed HES and raise the environmental damage saving value. Accordingly, the cost of energy production is reduced. From the data in Table 10, it became clear that PV/wind/diesel electric generators HES option is the best among all the options studied, even though it is cheaper than the price of electricity provided by the Israeli company ($0.20/kWh).
3.6. Payback period
A simple payback period is the years at which the cash flow difference between the winning HES and base HES changes signs from negative to positive. It measures the period it takes to recover the difference in investment costs (initial installation cost and operational cost and maintenance cost) between the two systems. 65 To calculate, the payback period of the generated 1,659,038 kWh of electricity of the winning HES, PV/diesel generators are used as the base system (first and last row in Table 6).
Table 11 displays different costs for both systems. Where the wining system has CoE lower by $0.121/kWh than the base system. This means that increasing the renewable energy share in the hybrid system produces a safer and more affordable system. The NPC difference between the two systems is $2.25 M indicating that the winning system saves money compared to the base system.
TABLE 11.
Optimal design system compared with the base system
| NPC($) | Initial capital cost ($) | O&M cost ($) | CoE (per Kwh) | |
|---|---|---|---|---|
| Base case | 8.74 M | 159,743 | 663,689 | 0.469 |
| Hybrid system | 6.49 M | 510,576 | 462,604 | 0.348 |
In the results obtained in this work, the internal rate of return (IRR) (%) is 55.7%, the simple payback (year) equals 1.88 year and the discount payback (year) equals 2.04. In the calculations, discounted payback year is measured as the time needed to recover the initial cost if the cash inflows are discounted to their present value. 66
4. CONCLUSIONS
A new Hybrid energy system for Dier El Balah quarantine center in Gaza Strip was proposed. HOMER‐Pro software was used to analyze, simulate and evaluate the proposed systems. The choice of quarantine center in Deir al‐Balah as a case study of our work since Gaza Strip has shortages in electric power and at the same time it faces COVID‐19. Thus, providing a quarantine center with electricity is a challenging task. In this work, we present four HESs which are diesel electric generators only, wind/diesel electric generators HES, PV/diesel electric generators HES, and PV/wind/diesel electric generators HES. In the analysis, the fuel cost is considered equal to $1.47/l while looking for the optimal HES with minimum CoE. The results for different HES were given in Table 8. The result shows that the lowest CoE is $0.348/kWh in the case of PV/wind/diesel generators HES. When considering the cost of harmful emission, CoE for the systems were listed in Table 11 with a minimum CoE is $0.157/kWh for PV/wind/diesel generators HES. Fuel consumed and fuel cost of PV/wind/diesel electric generators HES is the lowest value. The simple payback interval is 1.88 years. Therefore, PV/wind/diesel generators HES are the most economical and environmentally friendly system.
AUTHOR CONTRIBUTIONS
Hala J. El‐Khozondar: Conceptualization (lead); formal analysis (lead); methodology (supporting); software (equal); supervision (lead); writing – review and editing (lead). Fady El‐batta: Formal analysis (equal); methodology (equal); software (equal); writing – original draft (supporting). Rifa El‐Khozondar: Formal analysis (supporting); methodology (lead); software (supporting); writing – original draft (supporting). Yasser Nassar: Formal analysis (supporting); writing – review and editing (supporting). Mansour Alranlawi: Formal analysis (supporting); methodology (supporting). Samer Alsadi: Formal analysis (supporting); writing – review and editing (supporting).
CONFLICT OF INTEREST
The authors declare no conflict of interest.
ACKNOWLEDGMENTS
Author Hala J. El‐Khozondar would like to thank Dr. Tarek Djerafi, IRNS (Energy, Materials, and Communications), Quebec, Canada, for his valuable discussion. Authors would like to thank Dr. Guzlan M. Miskeen (the head of Medical Engineering Dept., University of Wadi Alshatti, Brack, Libya) for language proofreading the article.
El‐Khozondar HJ, El‐batta F, El‐Khozondar RJ, Nassar Y, Alramlawi M, Alsadi S. Standalone hybrid PV/wind/diesel‐electric generator system for a COVID‐19 quarantine center. Environ Prog Sustainable Energy. 2022;e14049. doi: 10.1002/ep.14049
The work is for great importance to Palestinian Ministry of Health and Palestinian energy authority. They provided us with needed information as they will consider this research results to power the proposed center.
Footnotes
The interviews made with the tenants.
DATA AVAILABILITY STATEMENT
The data that support the findings of this study are available from the corresponding author upon reasonable request.
REFERENCES
- 1. Nassar YF, Alsadi SY. Economical and environmental feasibility of the renewable energy as a sustainable solution for the electricity crisis in the Gaza strip. Int J Eng Res Dev. 2016;12(3):35‐44. [Google Scholar]
- 2. El‐Khozondar HJ, El‐batta FF. Solar Energy as an alternative to conventional energy in Gaza Strip: Questionnaire based study. An ‐Najah Univ J Res. 2018;32(1):47‐74. [Google Scholar]
- 3. MOH . COVID‐19 pademic daily status in Palestine. 2020; https://www.moh.gov.ps/portal/coronavirus/?fbclid=IwAR0XWxmS_pb2uyAbeUd0FpMuwF0UFTJ98YncqS8vdEQtGP4yPA0s2SAk1r8.
- 4. NCI Dictionaries , National Cancer Instituite (NCI), https://www.cancer.gov/publications/dictionaries/cancer-terms/def/covid-19.
- 5. Page J, Hinshaw D, McKay B. In hunt for Covid‐19 origin, patient zero points to second Wuhan market—the man with the first confirmed infection of the new coronavirus told the WHO team that his parents had shopped there. Wall Street J. 2021. [Google Scholar]
- 6. United Nations Office . 2021. Crisis: Power deficit in Gaza as of 20 May 2021. Report published on line by United Nations office for the Coordination of Humanitarian Affairs. 2021. https://www.ochaopt.org/page/gaza-strip-electricity-supply [Google Scholar]
- 7. Coccia M. How (un)sustainable environments are related to the diffusion of COVID‐19: the relation between coronavirus disease 2019, air pollution. Wind Resour Energy. 2020;12(22):9709. [Google Scholar]
- 8. Inayat A, Nassef AM, Rezk H, Sayed ET, Abdelkareem MA, Olabi AG. Fuzzy modeling and parameters optimization for the enhancement of biodiesel production from waste frying oil over montmorillonite clay K‐30. Sci Total Environ. 2019;666:821‐827. [DOI] [PubMed] [Google Scholar]
- 9. Jaisin C, Intaniwet A, Nilkhoa T, et al. A prototype of a low‐cost solar‐grid utility hybrid load sharing system for agricultural DC loads. Int J Energy Environ Eng. 2019;10:137‐145. [Google Scholar]
- 10. El‐Khozondar HJ, El‐batta FF. Solar energy implementation at household In Gaza strip. Energy Sustain Soc. 2022;12:12‐17. [Google Scholar]
- 11. Salameh T, Abdelkareem MA, Olabi AG, Sayed ET, Al‐Chaderchi M, Rezk H. Integrated standalone hybrid solar PV, fuel cell and diesel generator power system for battery or supercapacitor storage systems in Khorfakkan, United Arab Emirates. Int J Hydrog Energy. 2021;46(8):6014‐6027. [Google Scholar]
- 12. Nassar YF, Alsadi SY. Assessment of solar energy potential in Gaza strip‐Palestine. Sustain Energy Technol Assess. 2019;31:318‐328. [Google Scholar]
- 13. Ajlouni E, Alsamamra H. A review of solar energy prospects in Palestine. Am J Mod Energy. 2019;5(3):49‐62. [Google Scholar]
- 14. Juaidi A, Montoya FG, Ibrik IH, Manzano‐Agugliaro F. An over view of renewable energy potential in Palestine. Renew Sust Energ Rev. 2016;65:943‐960. [Google Scholar]
- 15. Albisher H, Alsamamra H. An overview of wind energy potentials in Palestine. J Energy Nat Res. 2019;8(3):98‐108. [Google Scholar]
- 16. Salem HS. The potential of wind energy in Palestine with healthcare and residential examples int he West Bank and the Gaza strip. J Nat Sci Sustain Technol. 2019;13(2):74‐97. [Google Scholar]
- 17. Kreitem GM, Al‐khatib IA. Renewable energy exploitation in Palestine: Current practice and future. LAP LAMBERT Academic Publishing; 2018. [Google Scholar]
- 18. Nassar YF, Alsadi SY. Wind energy potential in Gaza strip‐Palestine state. Solar Energy Sustain Dev. 2018;7(2):42‐57. [Google Scholar]
- 19. Elnaggar M, Edwan E, Ritter M. Wind energy potential of Gaza using small wind turbines: a feasibility study. Energies. 2017;10(8):1‐13. [Google Scholar]
- 20. Nassar Y, Hafez A, Alsadi S. Multi‐factorial comparison for 24 distinct transposition models for inclined surface solar irradiance computation in the State of Palestine: a case study. Front Energy Res. 2020;7(163):1‐19. [Google Scholar]
- 21. Al‐Najjar H, El‐Khozondar HJ, Pfeifer C, Al Afif R. Hybrid grid‐tie electrification analysis of bio‐shared renewable energy systems for domestic application. Sustain Cities Soc. 2021;77:103538. [Google Scholar]
- 22. Diab F, Zhang L, Ali S. An environmentally‐friendly Tourist Village in Egypt based on a hybrid renewable energy system––part one: what is the Optimum City? Energies. 2015;8(7):6926‐6944. [Google Scholar]
- 23. Issa K. Quantities Inventory of CO2 Emitted from the Energy Industry Sector in Libya: A Case Study. Sebha University; 2022. [Google Scholar]
- 24. Bahramara S, Haghifam M. Optimal planning of hybrid renewable energy systems using HOMER: a review. Renew Sust Energ Rev. 2016;62:609‐620. [Google Scholar]
- 25. Aljazeera News . Gaza's electricity crisis. Humanitarian Crises. June 19, 2017. https://www.aljazeera.com/news/2017/6/19/gazas‐electricity‐crisis
- 26. Alaydi JY. A parametric study of solar and wind energy in Gaza strip. Int J Sci Eng Res. 2013;4(12):140‐147. [Google Scholar]
- 27. Abu Taha J, Shaheen H. PV Diesel Hybrid Energy Supply for Nasser Hospital in Gaza Strip. in 2019 IEEE 7th Palestinian International Conference on Electrical and Computer Engineering (PICECE). 2019. IEEE.
- 28. Abu Dabousa TI, Abdelati MM. Modelling, simulation, and optimization of a hybrid PV solar system. J Al Azhar Univ‐Gaza (Natural Sciences). 2018;20(2):63‐80. [Google Scholar]
- 29. Al Badwawi R, Abusara M, Mallick T. A review of hybrid solar PV and wind energy system. Smart Science. 2015;3(3):127‐138. [Google Scholar]
- 30. Karimi M, Mokhlis H, Naidu K, Uddin S, Bakar A. Photovoltaic penetration issues and impacts in distribution network ‐ A review. Renew Sustainable Energy Rev. 2016;53: 594‐605. [Google Scholar]
- 31. Dreglea L, Foley A, Häger U, Sidorov D, Tomin N. Hybrid renewable energy systems, load and generation forecasting, new grids structure, and smart technologies. In: Vacca JR, ed. Solving Urban Infrastructure Problems Using Smart City Technologies. Elsevier; 2021:475‐484. [Google Scholar]
- 32. Babatunde OM, Munda JL, Hamam Y. Hybrid Energy System for Low‐Income Households. Paper presented at: 2017 IEEE AFRICON; IEEE. September 18‐20, 2017; Town, South Africa. [Google Scholar]
- 33. Shezan SA. Optimization and assessment of an off‐grid photovoltaic–diesel–battery hybrid sustainable energy system for remote residential applications. Environ Prog Sustain Energy. 2019;38(6):1‐13. [Google Scholar]
- 34. Sawle Y, Gupta SC, Bohre AK. Review of hybrid renewable energy systems with comparative analysis of off‐grid hybrid system. Renew Sust Energ Rev. 2018;81(2):2217‐2235. [Google Scholar]
- 35. Nassar Y, Abdunnabi M, Sbeta M, et al. Dynamic analysis and sizing optimization of a pumped hydroelectric storage‐integrated hybrid PV/wind system: a case study. Energy Convers Manag. 2021;229:113744. [Google Scholar]
- 36. Fazelpour F, Soltani N, Rosen MA. Feasibility of satisfying electrical energy needs with hybrid systems for a medium‐size hotel on Kish Island. Iran Energy Explor Exploit. 2014;73:856‐865. [Google Scholar]
- 37. Fazelpour F, Shariatzadeh M, Soltani N. Techno‐economic feasibility of grid‐connected photovoltaic power plant in Qeshm Island, Iran. in 2016 IEEE 16th International Conference on Environment and Electrical Engineering (EEEIC). 2016.
- 38. Rehman S, El‐Amin I. Study of a solar pv/wind/diesel hybrid power system for a remotely located population near Arar, Saudi Arabia. Energy Explor Exploit. 2015;33(4):591‐620. [Google Scholar]
- 39. Palej P, Qusay H, Kleszcz S, Hanus R, Jaszczur M. Analysis and optimization of hybrid renewable energy systems. Polityka Energetyczna – Energy Policy Journal. 2019;22(2):107‐120. [Google Scholar]
- 40. Sarkar T, Bhattacharjee A, Samanta H, Bhattacharya K, Saha H. Optimal design and implementation of solar PV‐wind‐biogas‐VRFB storage integrated smart hybrid microgrid for ensuring zero loss of power supply probability. Energy Convers Manag. 2019;191:102‐118. [Google Scholar]
- 41. Goswami A, Sadhu P, Sadhu PK. Development of a grid connected solar‐wind hybrid system with reduction in levelized tariff for a Remote Island in India. J. Solar Energy Eng. 2020;142(4):044501. [Google Scholar]
- 42. Goswami A, Sadhu PK. Adoption of floating solar photovoltaics on waste water management system: a unique nexus of water‐energy utilization, low‐cost clean energy generation and water conservation. Clean Techn Environ Policy. 2021. [Google Scholar]
- 43. Halabi LM, Mekhilef S, Olatomiwa L, Hazelton J. Performance analysis of hybrid PV/diesel/battery system using HOMER: a case study Sabah. Malaysia Energy Convers. Manage. 2017;144:322‐339. [Google Scholar]
- 44. Hossain M, Mekhilef S, Olatomiwa L. Performance evaluation of a stand‐alone PV‐wind‐diesel‐battery hybrid system feasible for a large resort center in South China Sea. Malaysia Sustain Cities Soc. 2017;28:358‐366. [Google Scholar]
- 45. Mandelli S, Barbieri J, Mereu R, Colombo E. Off‐grid systems for rural electrification in developing countries: definitions, classification and a comprehensive literature review. Renew Sust Energ Rev. 2016;58:1621‐1646. [Google Scholar]
- 46. Olatomiwa L, Mekhilef S, Ismail MS, Moghavvemi M. Energy management strategies in hybrid renewable energy systems: a review. Renew Sust Energ Rev. 2016;62:821‐835. [Google Scholar]
- 47. Erdinc O, Uzunoglu M. Optimum design of hybrid renewable energy systems: overview of different approaches. Renew Sust Energ Rev. 2012;16:1412‐1425. [Google Scholar]
- 48. Nassar Y, Salem A. The reliability of the photovoltaic utilization in southern cities of Libya. Desalination. 2007;209:86‐90. [Google Scholar]
- 49. Rodrigues A, Dentinho T, Silva C, Azevedo EO. Cost benefit analysis to select clean energy solutions in dairy farm milk collection posts in Azores. J Renewable Energy and Power Quality Journal. 2010;1:1357‐1362. [Google Scholar]
- 50. Kumar P, Pukale R, Kumabhar N, Patil U. Optimal design configuration using HOMER. Procedia Technology. 2016;24:499‐504. [Google Scholar]
- 51. Donia AlWatan News . Palestiniand affairs: Dier El Balah Quantine Center. 2020. https://www.alwatanvoice.com/arabic/news/2020/08/11/1358584.html
- 52. Sanusi YK, Fajinmi GR, Babatund EB. Effects of ambient temperature on the performance of a photovoltaic solar system in a tropical area. Pac J Sci Technol. 2011;12:175‐180. [Google Scholar]
- 53. El‐Khozondar HJ, El‐Khozondar RJ, Matter K. Parameters influence on MPP value of the photo voltaic cell. Energy Procedia. 2015;74:1142‐1149. [Google Scholar]
- 54. TimeandDate . Weather in Gaza, Gaza Strip, Palestine. 2020; Available from: https://www.timeanddate.com/weather/palestine/gaza/climate.
- 55. Nassar Y. Solar Energy Engineering Active Applications. Sebha University; 2006. [Google Scholar]
- 56. Nassar Y, Abuhamoud N, Miskeen G, El‐Khozondar HJ, Alsadi S, Ahwidi O. Investigating the applicability of horizontal to tilted sky‐diffuse solar irradiation transposition models for Key Libyan cities. 2nd Maghreb International Conference on Sciences and Techniques of Automatic Control and Computer Engineering. 2022, IEEE Xplore.
- 57. Canadian solar CS6X‐325P Solar Panel . Solar Electric Supply, INC; 2020; Available from: https://www.solarelectricsupply.com/canadian‐solar‐max‐power‐cs6x‐325p‐solar‐panel‐wholesale‐price.
- 58. SMA . Sunny Tripower. 2020; Available from: https://files.sma.de/downloads/STP15-25TL-30-DS-en-41.pdf.
- 59. Nassar Y, Salem M, Iessa K, AlSareef I, Ali K, Fakher M. Estimation of CO2 emission factor for the energy industry sector in Libya: a case study. Environ Dev Sustain. 2021;23:13998‐14026. [Google Scholar]
- 60. Nassar Y, Iessa K, Alsadi S. Air pollution sources in Libya. Res Rev. 2017;5:63‐79. [Google Scholar]
- 61. Nassar Y, Iessa K, Alsadi S. Estimation of environmental damage costs from CO2 emissions in Libya and the revenue from carbon tax implementation. Low Carbon Economy. 2017;8:118‐132. [Google Scholar]
- 62. Twidale S. Analysts raise EU carbon priceforecasts as gas rally drives up coal power. Reuters. October 14, 2021. Availabe From: https://www.reuters.com/business/energy/analysts-raise-eu-carbon-price-forecasts-gas-rally-drives-up-coal-power-2021-10-14/ [Google Scholar]
- 63. Ali A, Karram K, Nassar Y, Hafez A. Reliable and Economic Isolated Renewable Hybrid Power System with Pumped Hydropower Storage, in The 22nd International Middle East Power Systems Conference (MEPCON 2021). 2021: Assiut University.
- 64. Hafez A, Nassar Y, Hammdan M, Alsadi S. Technical and economic feasibility of utility‐scale solar energy conversion systems in Saudi Arabia. Iran J Sci Technol. 2019;44(1):213‐225. [Google Scholar]
- 65. Ali B, Sopian KB, Alghoul M, Othman MY. Economics of domestic solar hot water heating systems in Malaysia. Eur J Sci Res. 2009;26(1):20‐28. [Google Scholar]
- 66. Al‐Ani MK. A strategic framework to use payback period in evaluating the capital budgeting in energy and oil and gas sectors in Oman. Int J Econ Financ. 2015;5(2):469‐475. [Google Scholar]
- 67. Gan LK, Shek J, Mueller M. Hybrid wind–photovoltaic–diesel–battery system sizing tool development using empirical approach, life‐cycle cost and performance analysis: a case study in Scotland. Energy Convers Manag. 2015;106:479‐494. [Google Scholar]
- 68. Diab F, Lan H, Zhang L, Ali S. An environmentally friendly factory in Egypt based on hybrid photovoltaic/wind/diesel/battery system. J Clean Prod. 2016;112:3884‐3894. [Google Scholar]
- 69. Alzaid OS, Salim B, Orfi J, Khan S, Alshehri H. Hybrid solar and wind power generation in Saudi Arabia. Energy Environ Res. 2020;10(2):25‐38. [Google Scholar]
- 70. Major IE, Oshiemele B. Simulation of wind‐diesel hybrid power system for a rural community in Nigeria. Nigerian J Technol (NIJOTECH). 2019;38(3):636‐646. [Google Scholar]
- 71. Ani VA. Design of a reliable hybrid (PV/diesel) power system with energy storage in batteries for remote residential home. J Energy. 2016;4:1‐16. [Google Scholar]
- 72. Nurunnabi M, Roy K, Hossain E, Pota HR. Size optimization and sensitivity analysis of hybrid wind/PV micro‐grids—a case study for Bangladesh. IEEE Access. 2019;7:150120‐150140. [Google Scholar]
- 73. Rehman S. Hybrid power systems – sizes, efficiencies, and economics. Energy Explor Exploit. 2021;39(1):3‐43. [Google Scholar]
- 74. El Khashab H, Al Ghamedi M. Comparison between hybrid renewable energy systems in Saudi Arabia. J Electr Syst Inf Technol. 2015;2(1):111‐119. [Google Scholar]
- 75. Jasim K, Abdul‐hussien M, Sarhan M. Design of hybrid solar PV diesel mini grids in Iraq. J College Basic Educ. 2015;21:109‐128. [Google Scholar]
- 76. El Attafi S. Design and Optimisation of a Hybrid System (PV and Wind) With Grid Connection: Case Study a Typical Refrigeration Unit. 2019, Al Akhawayn University.
- 77. Ali S, Jang C. Evaluation of PV‐wind hybrid energy system for a small Island. In: Okedu K, Tahour A, Aissaou A, eds. Wind Solar Hybrid Renewable Energy System. Intechopen; 2020. [Google Scholar]
- 78. Costa TS, Villalva MG. Technical evaluation of a PV‐diesel hybrid system with energy storage: case study in the Tapajós‐Arapiuns extractive reserve, Amazon, Brazil. Energies. 2020;13(11):2969. [Google Scholar]
- 79. Zieba Falama R, Ngangoum Welaji F, Dadjé A, et al. A solution to the problem of electrical load shedding using hybrid PV/battery/grid‐connected system: the case of households' energy supply of the northern part of cameroon. Energies. 2021;14(10):2836. [Google Scholar]
- 80. Richa A, Karaki SH. Optimal Design of Hybrid Renewable Energy Systems in Lebanon. in 2018 IEEE International Multidisciplinary Conference on Engineering Technology (IMCET). 2018.
- 81. Canziani F, Vargas R, Gastelo‐Roque J. Hybrid Photovoltaic‐Wind Microgrid With Battery Storage for Rural Electrification: A Case Study in Perú. Front Energy Res. 2021;8:347. [Google Scholar]
- 82. Bahta S. Design and Analyzing of an Off‐Grid Hybrid Renewable Energy System to Supply Electricity for Rural Areas (Case Study: Atsbi District, North Ethiopia), in Division of Heat and Power Technology. 2013, KTH School of Industrial Engineering and Management.
- 83. Alayan S. Design of a PV‐Diesel Hybrid System with Unreliable Grid Connection in Lebanon. Master Thesis. European Solar Engineering School, Dalarna University; 2016. [Google Scholar]
- 84. Maoulida F, Rabah D, El Ganaoui M, Aboudou K. PV‐wind‐diesel system for energy supply on remote area applied for telecommunication towers in Comoros. Open J Energy Efficiency. 2021;10:50‐72. [Google Scholar]
- 85. Hassan Q, Jaszczur M, Abdulateef J. Optimization of PV/WIND/DIESEL hybrid power system in HOMER for rural electrification. J Phys Conf Ser. 2016;745:032006. [Google Scholar]
- 86. Nour M, Rohani G. Prospect of stand‐alone PV‐diesel hybrid power system for rural electrification in UAE. Int J Renew Energy Res. 2014;4(3):749‐758. [Google Scholar]
- 87. Sawle Y, Gupta SC, Bohre AK. PV‐wind hybrid system: a review with case study. Cogent Eng. 2016;3(1):1189305. [Google Scholar]
- 88. Chauhan A, Upadhyay S, Khan MT, Hussain SMS, Ustun TS. Performance investigation of a solar photovoltaic/diesel generator based hybrid system with cycle charging strategy using BBO algorithm. Sustain For. 2021;13:8048. [Google Scholar]
- 89. Rajbongshi R, Borgohain D, Mahapatra S. Optimization of PV‐biomass‐diesel and grid base hybrid energy systems for rural electrification by using HOMER. Energy. 2017;126:461‐474. [Google Scholar]
Associated Data
This section collects any data citations, data availability statements, or supplementary materials included in this article.
Data Availability Statement
The data that support the findings of this study are available from the corresponding author upon reasonable request.


