Abstract
Well bottomhole pressure optimization issue has been a significant concern for efficiently developing unconventional systems due to strong stress sensitivity. Therefore, it is of practical interest to clarify influence mechanisms involved in stress sensitivity for gas shale, which is further included in the production model to determine main controlling factors for bottomhole pressure strategy optimization for long term hydrocarbon extraction. Currently, many production models were limited in exploring stress sensitivity mechanisms but adopted common empirical equations regarding net pore stress instead. In addition, geophysical control analysis for unconventional systems optimization was mostly conducted using local sensitivity qualitative analysis, which should be validated to be reliable and applicable to fields using multi-parameter interaction influence. As a result, in this paper, an efficient workflow to rationally optimize gas well production system was provided by combining the production model, orthogonal design approach, and response surface method. To be specific, the compound flow model for shale gas reservoirs, incorporating multiple stress sensitivity mechanisms, was proposed to function as a theoretical basis for production optimization simulation. Last but not least, local sensitivity analysis was conducted to qualitatively analyze the impact of influencing factors on 20 year-production of gas wells under different bottomhole production methods. The simulation results showed that the managed pressure drawdown scheme can be adopted for reservoirs with high reservoir pressure and tight matrix properties, while the high-pressure drawdown scheme is suitable for reservoir with better fracturing effect and high external water content. Finally, based on the proposed gas flow model and orthogonal design experiments, response surface design and single factor analysis as well, an optimization mathematical model for shale gas multi-parameter interaction was established, which intuitively quantified the effects of multi-geophysical controls on EUR increase in different production durations, including matrix properties, fracture properties, and production system indicator parameters. These findings provide a more reliable reference for production system optimization based on a series of mathematical approaches to improve overall long-term recovery from shale gas reservoirs.
1. Introduction
Shale gas, an unconventional hydrocarbon resource, has been a major portion in energy structure composition in the world due to its environment-protection and abundance, as well as demand for fossil energy with the rapid development of the global economy.1 Due to complex structures and poor pore throats,2,3 horizontal well technology and volume fracturing methods4 are used to extract hydrocarbon out of the shale by inducing “artificial fracture network”. The rapid decline rate in initial daily gas production for shale gas wells can be attributed to strong stress sensitivity, an extremely common phenomenon, which weakens the reservoir conductivity and restricts the long-term production of gas reservoirs as well. During the production stage of a shale gas well, the porous medium is gradually compacted with the increase in net pore pressure, thus leading to a deformation in main flow path and a reduction in seepage capacity. Therefore, optimizing the well bottomhole pressure difference can alleviate the increase in effective stress and ultimately promote long-term stable production of shale gas wells.
Reservoir stress-sensitivity can exist in the multi-scale shale gas mass transfer stage. In the early production stage, a large amount of free gas in proppant-contained hydraulic fractures breaks through early under large pressure drop. In the case, the decline in hydraulic fracture pore pressure can increase overlying stress in the reservoir, thereby weakening the hydraulic fracture conductivity and enhancing the reservoir stress sensitivity. Subsequently, free gas can transport from secondary fracture network to hydraulic fractures. Less distribution of proppant and fracture fluid intrusion into the secondary fracture network and inside the matrix5−7 might generate higher stress sensitivity. The final mass transfer stage is that the matrix pore structure changes with the effective stress, resulting in a decline in porosity and permeability, which affects long-term gas production of shale gas wells. To sum up, there are three specific production system mechanisms: (1) artificial fractures conductivity loss;8−12 (2) micro-fractures stress sensitivity;13−17 and (3) matrix stress sensitivity.18−20
The diverse scale of the pore structure from shale reservoirs makes complex gas flow process, including desorption, diffusion, and seepage. The flow path also covers from molecular scale to macroscale. As a result, the gas productivity should be closely related with matrix and fracture parameters. Most studies have been carried out on the local sensitivity analysis on shale gas production21−27 but have not yet formed a direct guidance for influencing factors in the production system plans formulation as well as a systematical theory of influencing factors interaction on production plan optimization.
Therefore, with respect to the above scientific issues, we proposed a semi-analytical compound flow model for production prediction from shale gas reservoirs considering multiple stress sensitivity mechanisms and nonlinear flow process. Furthermore, based on the local sensitivity analysis, we then clarified how single influential factors functioned in the selection of the production system from the geological background and engineering parameters. In addition, based on the flow model in this paper, we proposed a multi-parameter optimization model for shale gas by introducing orthogonal experimental design and response surface methods. The model was applied to the regression analysis between the EUR increase and the multiple independent variables interaction in different production schemes of shale gas wells. The above analysis can intuitively quantify the interaction influence mechanism of matrix properties, fracture properties, and production system indicator parameters on the EUR increase in different production years. This research provides a more reliable reference for production system optimization based on a series of mathematical approaches to improve overall long-term recovery from shale gas reservoirs.
2. Methodology
2.1. Physical Model
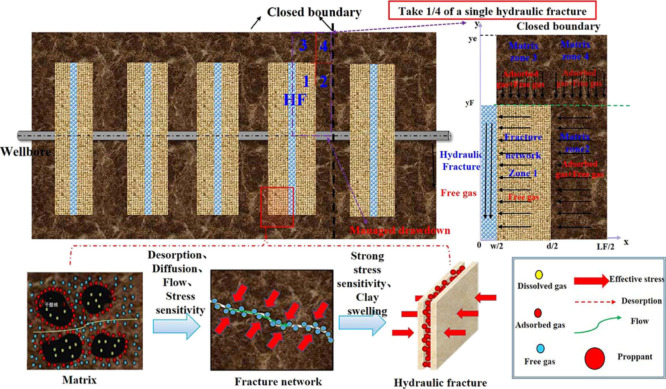
It is assumed that all the hydraulic fractures can be characterized by bi wing Transverse,28 note that the increased effective stress may lead to elastic embedding and deformation of proppant in hydraulic fractures. Furthermore, the secondary fracture network and matrix are considered as equivalent medium. Considering that there are some unstimulated reservoir zones between the hydraulic fractures and outside the fracture tip, the proposed model in the paper can include the following five flow areas: hydraulic fractures, fracture network area 1, matrix area 2 between hydraulic fractures, and unstimulated matrix area 3 and matrix area 4, as shown in Figure 1. The stress sensitivity, high-pressure adsorption, and diffusion and viscous flow are all considered in the matrices 2, 3, and 4. Moreover, the hydration expansion of the unproppant fracture network can aggravate the clay swelling, which is the focus of pressure control protection for gas wells.
Figure 1.
Simplified five-zone composite physical model of multi-fractured horizontal well.
2.1.1. Pressure Control Mechanism
-
1
Artificial fracture conductivity loss
The effective support performance of proppants to fractures is the key to forming the required fracture conductivity.29 The increase in the effective net stress pressure causes the proppant inside the artificial fracture to be embedded, deformed, and ruptured; thus, the effective flow channel width of the fracture is reduced, and the fracture conductivity can be impaired.30 Assuming the impact of proppant elastic embedding and deformation of the proppant on the width of hydraulic fractures is linearly related to the net confining pressure, the expressions1 and2 are expressed as follows9
Width loss caused by elastic embedding of proppant
| 1 |
width loss caused by elastic fracture of proppant
| 2 |
the effective width of the proppant-fracture is
| 3 |
-
2
Microfracture water–shale interaction
Compared with matrix and proppant hydraulic fractures, unsupported microfractures are more sensitive to net reservoir stress. Even after the stress is restored, the permeability can only recover to 10–15% of the initial permeability.31 In this work, the permeability is assumed to decrease exponentially with the increase of effective stress.32 The stress sensitivity coefficient after fracturing fluid soaking is not constant but is negatively correlated with effective stress.
The permeability in the water-bearing equivalent fracture network is given by eq 4(32)
| 4 |
where
-
3
Matrix stress sensitivity
The increase effective stress on the rock skeleton of the reservoir results in obvious elastoplastic deformation of the rock pore structure, and thus, matrix permeability, porosity, and rock physical parameters have changed. Therefore, an exponential stress sensitivity empirical model32 was introduced to characterize the influence of matrix stress sensitivity on matrix seepage capacity
| 5 |
2.1.2. Gas Nonlinear Flow Effects
-
1
High-pressured physical properties
The pseudo pressure and pseudo-time33 are adopted to linearize the high-pressured physical property parameters in the flowing control equation to solve the equations easily.
The pseudo-pressure is
| 6 |
the pseudo-time is
| 7 |
-
2
Supercritical adsorption model
It can be demonstrated that conventional Langmuir adsorption equation is not suitable for describing high pressure adsorption for shale gas reservoirs. In the paper, the excess high-pressure isothermal adsorption model34 based on the adsorption phase volume theory is adopted as follows
| 8 |
-
3
Apparent permeability model
Considering the high-pressured desorption and stress sensitivity of the matrix, an apparent permeability model of gas flow in the shale matrix micro-/nanopores based on molecular dynamics theory35 was used to superimpose the real gas viscous flow and Knudsen diffusion by weighting coefficients
| 9 |
where effective Knudsen number is as follows
| 10 |
considering stress sensitivity and desorption process, the effective hydraulic flow radius is as follows
| 11 |
surface coverage of adsorbed gas on matrix pore wall is as follows
| 12 |
2.2. Mathematical Model
2.2.1. Governing Equation for Gas Flow in Matrix Zone 4
The matrix gas of zone 4 merges into the matrix of zone 2 along the y direction. The stress sensitivity, supercritical desorption, and diffusion and viscous flow are coupled. The outer boundary condition is closed, and reservoir pressure on the inner boundary is continuous.
According to the dimensionless parameters definition in Table 1, dimensionless gas percolation equation in the matrix zone 4 can be derived in eq 13
| 13 |
boundary conditions expressed in dimensionless form are as follows
| 14 |
| 15 |
| 16 |
Table 1. Definition of Dimensionless Parameters.
| dimensionless parameter | definition | dimensionless parameter | definition | ||
|---|---|---|---|---|---|
| dimensionless pseudo-pressure | dimensionless production | ||||
| dimensionless pseudo-time | storage capacity ratio | ||||
| dimensionless length in x direction | zone 2–4 mass transfer coefficient | ||||
| dimensionless length in y direction | zone 3–1 mass transfer coefficient | ||||
| dimensionless conductivity in zone 3 | zone 1–F mass transfer coefficient | ||||
| dimensionless conductivity in zone 4 | dimensionless formation conductivity |
2.2.2. Governing Equation for Gas Flow in the Matrix Zone 3
Considering the reservoir stress sensitivity, gas desorption, and diffusion and viscous flow from matrix zone 3 into zone 1 along the y direction, the dimensionless gas percolation equation in the matrix zone 3 can be derived using eq 17
| 17 |
As outer boundary condition is closed and reservoir pressure on the inner boundary is continuous, the dimensionless initial and boundary conditions are reflected in eqs 18–20 as follows
| 18 |
| 19 |
| 20 |
2.2.3. Governing Equation for Gas Flow in Matrix Zone 2
Considering the unsteady gas flow exchange in matrix zone 4 and matrix zone 2, the dimensionless gas seepage equation in the matrix zone 2 is established in eq 21
| 21 |
The outer boundary is closed, the inner boundary pressure is continuous, and the initial and boundary conditions are expressed in eqs 22–24
the initial condition
| 22 |
outer boundary
| 23 |
inner boundary
| 24 |
2.2.4. Governing Equation for Gas Flow in Fracture Network Zone 1
Considering the influence of hydration on gas seepage capacity in the equivalent fracture network zone 1, the flow rate on the outer boundary between zone 1 and zone 2 is continuous, and inner boundary pressure is continuous. The dimensionless gas flow equation in fracture network zone 1 can be depicted in expression25
| 25 |
the boundary conditions are as followed in eqs 26–28
initial condition
| 26 |
outer boundary
| 27 |
inner boundary
| 28 |
2.2.5. Governing Equation for Gas Flow in Inner Zone Hydraulic Fracture
The gas mass transfer in the hydraulic fracture is mainly dominated by viscous flow, and elastic embedding and deformation of proppant in the hydraulic fractures cannot be ignored. Then the dimensionless flow control eq 29 in the hydraulic fracture is established
| 29 |
considering the constant bottom hole pressure of the gas well and the outer boundary is closed, the initial and boundary conditions are as follows
The initial condition
| 30 |
outer boundary
| 31 |
inner boundary
| 32 |
2.3. Model Solution
Dimensionless bottomhole pseudo pressure gradually decreases from the initial reservoir pressure to the constant flowing pressure and then generates continuously at the constant pressure; thus, the dimensionless bottom hole pressure can be expressed with the dimensionless time as form of Piecewise function36
| 33 |
the Heaviside (x) function37 was introduced to transform eq 33 into a continuity function 34
| 34 |
the dimensionless bottom hole pseudo
pressure  was transformed
in the Laplace space as
the expression 35
| 35 |
the second integral term on the right side of the above formula35 can be simplified to obtain expression36
| 36 |
discretize eq 36, then eq 37 can be obtained
| 37 |
where
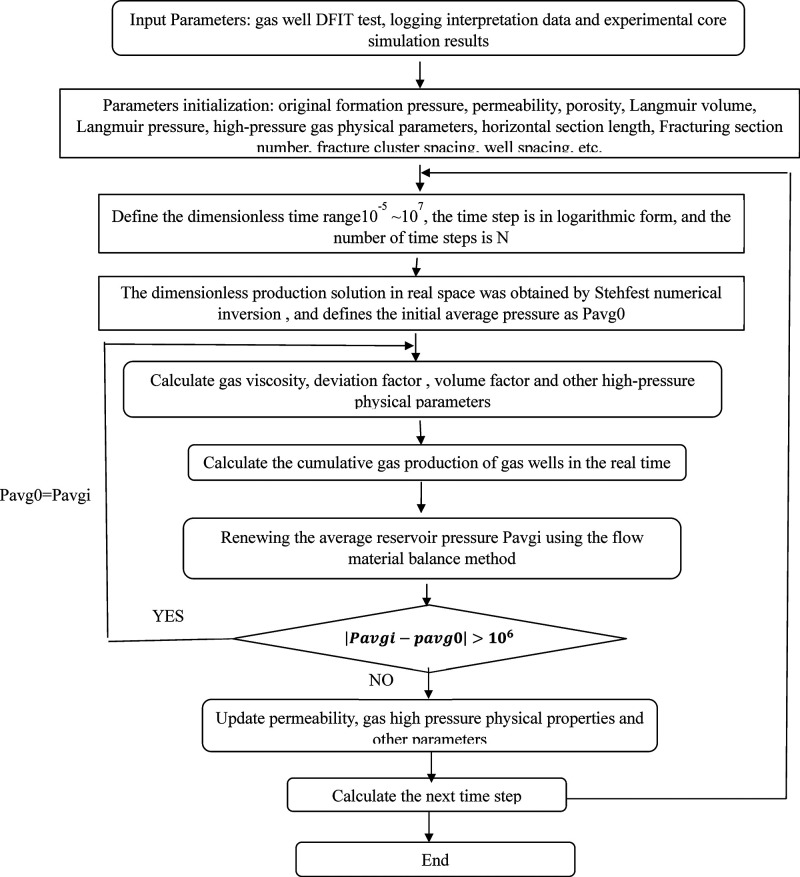
next, the dimensionless seepage equations can be transformed in Laplace domain and the final solution was acquired. Then the semi-analytical solution of the dimensionless production in the real space is acquired with the Stehfest numerical inversion.38 By the Newton iteration method, the production solution in the real space at constant pressure can be derived and the specific solution process is shown in Figure 2. As the highlights of this paper are theoretical analysis of dynamic production performance of gas wells with managed pressure drawdown and optimization of pressure drop strategies rather than model derivation, the solution of the model is directly given in this paper. The specific solution derivation details have been illustrated.39
Figure 2.
Flow chart of solving pressure control production model.
The total dimensionless production rate at the bottom hole of the shale gas well in Laplace space can be derived in eq 38
| 38 |
3. Local Sensitivity Analysis of Production Strategy
For production wells in shale production areas, the key influencing factors affecting productivity are mostly qualitatively analyzed by local sensitivity, mainly including reservoir geological parameters and engineering parameters. In this paper, productivity was taken as the dependent variable in the production strategy optimization research, and the single factor analysis of the key influencing factors of gas well productivity was carried out with an example well in the Sichuan shale gas area, including reservoir physical parameters (original reservoir pressure, matrix permeability, and matrix porosity), engineering parameters (artificial fracture conductivity, cluster spacing, fracture network stress sensitivity, and reservoir exogenous water cut). The geological parameters and engineering of this example well are shown in Table 2.
Table 2. Geological Parameters and Engineering Parameters of an Example Well.
| parameter name | value | parameter name | value | |
|---|---|---|---|---|
| basic parameters | initial pressure/MPa | 80 | fractured sections | 20 |
| reservoir temperature/K | 400 | number of fracturing clusters per section | 6 | |
| reservoir thickness/m | 16 | constant bottomhole flowing pressure/MPa | 3 | |
| length of horizontal section/m | 1800 | |||
| matrix | matrix permeability/mD | 0.0004 | Langmuir volume/(m3/t) | 3.5 |
| matrix porosity/% | 4.0 | Langmuir pressure/MPa | 8 | |
| stress sensitivity coefficient/MPa–1 | 0.20 | |||
| fracture network | permeability in the fracture network/mD | 1 | initial stress sensitivity coefficient/MPa–1 | 0.26 |
| porosity/% | 5.3 | |||
| hydraulic fracture | half-length of hydraulic fracture | 100 | width of fracturing zone between two clusters/m | 10 |
| width of hydraulic fracture/m | 0.01 | permeability in the hydraulic fracture/mD | 50 | |
| cluster spacing/m | 15 | well spacing/m | 300 |
3.1. Original Reservoir Pressure
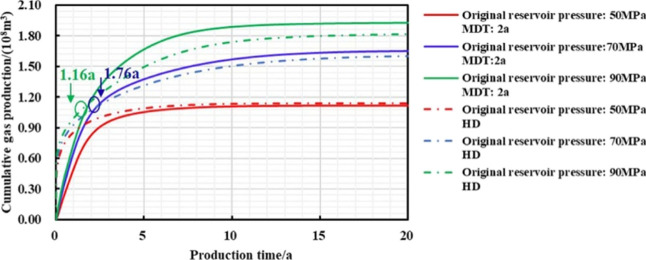
When other parameters remain constant, original reservoir pressure is, respectively, set as 50, 70, and 90 MPa, the trend of gas well production with respect to reservoir pressure under different production systems is analyzed, and a typical gas production chart is drawn to further compare the gas production and pressure control production effect under different reservoir pressures.
As shown in Figures 3–5 and Table 3, the daily peak gas production and EUR of pressure-controlled production are positively correlated with original reservoir pressure; the stress-sensitivity does not play any obvious roles on the production system at the low pressure conditions, and thus, high pressure drawdown production (HD) is preferred to be adopted than managed pressure drawdown production (MD). When the original reservoir pressure gradually increases, the effective stress range is getting wider and the permeability loss caused by the stress-sensitivity is larger. Therefore, the earlier the “productivity reversal” occurs, the higher the final reservoir pressure drop percentage and EUR increase, which can result in a higher pressure control production effect.
Figure 3.
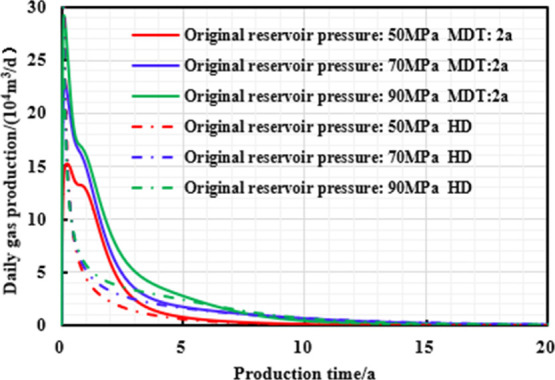
Chart of daily gas production and production time with different production strategies under different original reservoir pressures.
Figure 5.
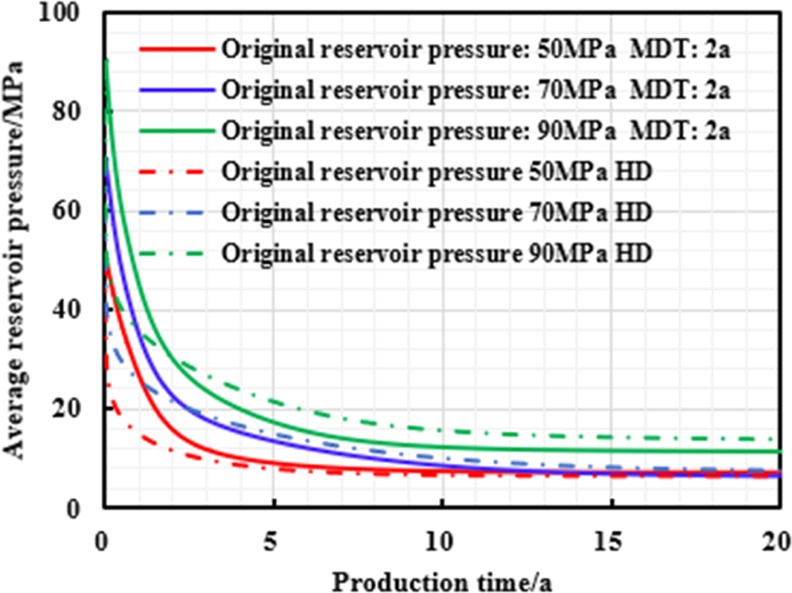
Chart of average reservoir pressure and production time with different production strategies under different original reservoir pressures.
Table 3. Relationship between EUR and Original Reservoir Pressure for Different Production Systems.
| Pe value/MPa | EUR depressurization production/(108 m3) | EUR under 2 year managed pressure drawdown/(108 m3) | 20 year-EURincrease/% |
|---|---|---|---|
| 50 | 1.1395 | 1.1174 | –1.94 |
| 70 | 1.6014 | 1.6509 | 3.09 |
| 90 | 1.8157 | 1.9266 | 6.10 |
Figure 4.
Chart of cumulative gas production and production time with different production strategies under different original reservoir pressures.
3.2. Matrix Permeability
It is commonly accepted that the permeability of the reservoir with poor pore connectivity for shale gas reservoirs is between 10–5 and 10–3 mD.2,3,40 So when other parameters remain unchanged, the matrix permeability is set to change between 5 × 10⁻⁵ and 5 × 10⁻³ mD to analyze its influence on the production under pressure control for 2 years and high pressure drawdown and compare the production effects under different production systems.
Figures 6–8 and Table 4 show that when km0 is small, the daily peak gas production and EUR of pressure-controlled production are lower; when km0 is gradually reduced, the earlier the “production reversal” appears, the higher the residual reservoir pressure and EUR increase, and ultimately the higher the yield increase effect of managed pressure drawdown production (MD). This is because more little permeability means more developed micro-throat or pore and small average throat radius. The increase in effective stress can easily cause the closure of these micro-throat and high permeability loss, finally enhancing stress sensitivity. Therefore, a reasonable bottom-hole pressure drop should be formulated to ensure long-term stable production of gas wells to obtain an ideal EUR value.
Figure 6.
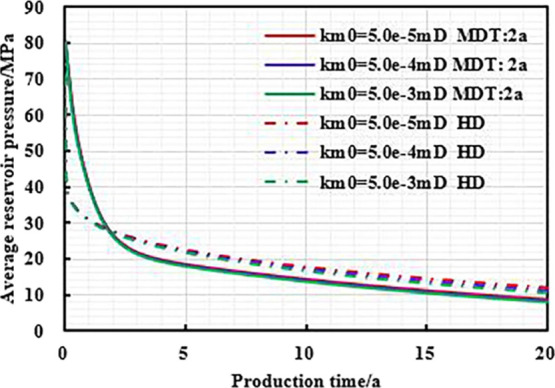
Chart of daily gas production and production time with different production strategies under different matrix permeabilities.
Figure 8.
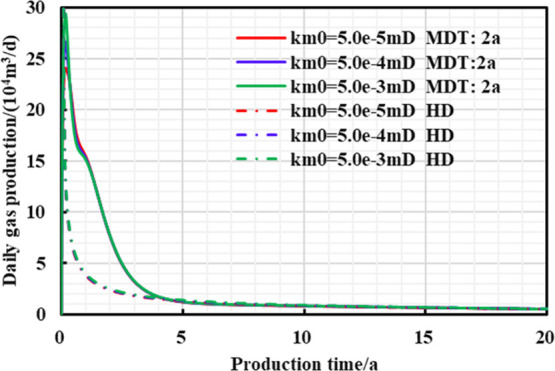
Chart of average reservoir pressure and production time with different production strategies under different matrix permeabilities.
Table 4. Relationship between EUR and Matrix Permeability for Different Production Systems.
| km0 value/mD | EUR depressurization production/(108 m3) | EUR under 2 year managed pressure drawdown/(108 m3) | 20 year-EURincrease/% |
|---|---|---|---|
| 5.0 × 10⁻⁵ | 1.6630 | 1.8062 | 8.61 |
| 5.0 × 10⁻⁴ | 1.6946 | 1.8245 | 7.67 |
| 5.0 × 10⁻³ | 1.7264 | 1.8411 | 6.64 |
Figure 7.
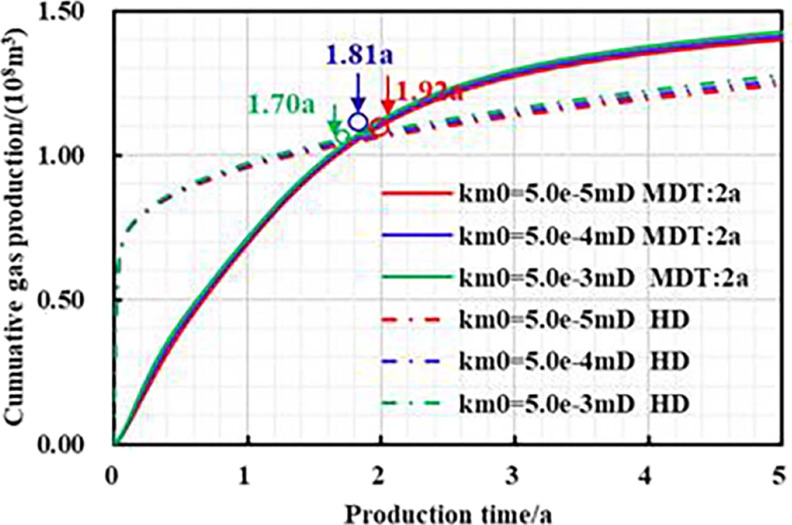
Chart of cumulative gas production and production time with different production strategies under different matrix permeabilities.
3.3. Matrix Porosity
Similarly, when the other parameters are maintained constant, the matrix porosity is changed as 0.4, 0.55, and 0.7, respectively, and the influence of porosity on gas well production under different production systems can be calculated.
It can be seen from Figures 9–11 and Table 5 that when the porosity is smaller, the daily gas production decline rate of managed pressure drawdown production system and high pressure drawdown production system can be conversely higher, and the 20 year EUR is lower; the decreasing porosity means higher proportion of channels and micropores, and the number of effectively connected pores can be small as well. Therefore, the micropores are more likely to be closed and deformed under the effective stress, resulting in little gas production in the matrix. To sum up, the lower the porosity, the earlier the “productivity reversal” occurs, the lower the residual pressure of the reservoir, the higher the EUR increase rate, and the more ideal the stimulation effect of pressure-controlled production.
Figure 9.
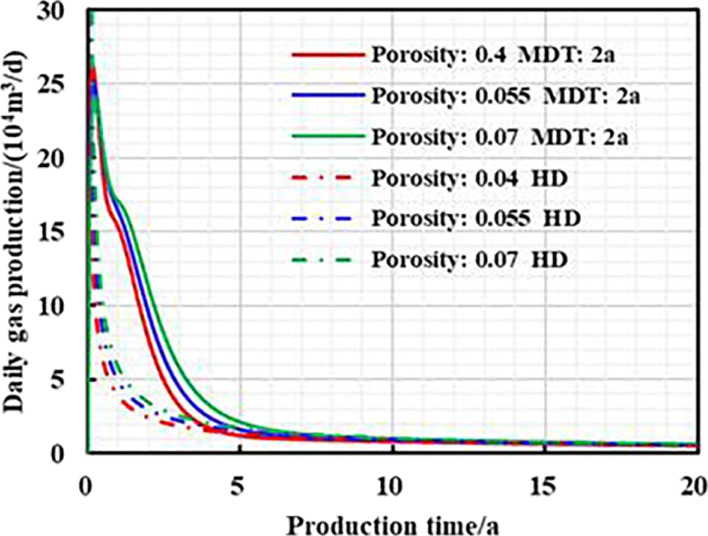
Chart of daily gas production and production time with different production strategies under different matrix porosities.
Figure 11.
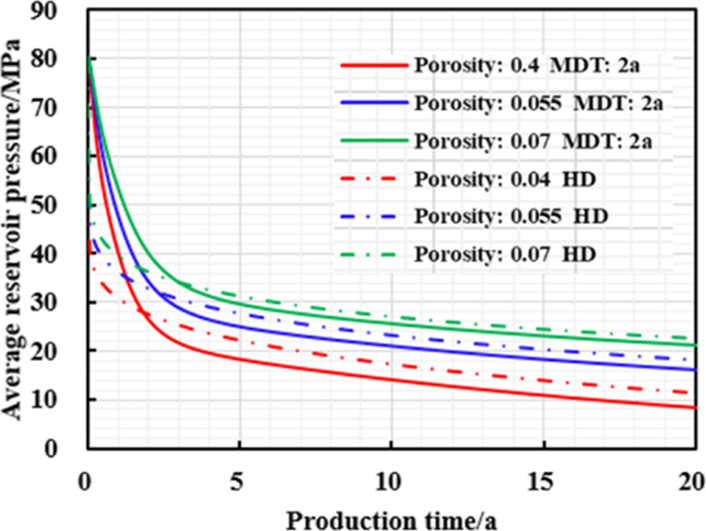
Chart of average reservoir pressure and production time with different production strategies under different matrix porosities.
Table 5. Relationship between EUR and Matrix Porosity for Different Production Systems.
| φ value | EUR depressurization production/(108 m3) | EUR under 2 year managed pressure drawdown/(108 m3) | 20 year-EURincrease/% |
|---|---|---|---|
| 0.04 | 1.6934 | 1.8220 | 7.64 |
| 0.055 | 1.9442 | 2.0568 | 5.79 |
| 0.07 | 2.1790 | 2.2756 | 4.43 |
Figure 10.
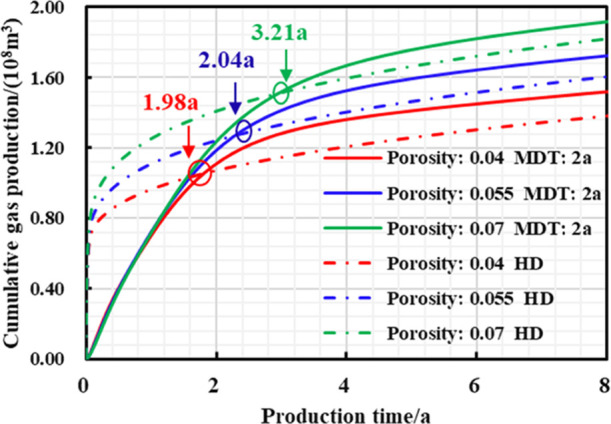
Chart of cumulative gas production and production time with different production strategies under different matrix porosities during short-term production.
3.4. Reservoir Exogenous Water Content
The field flowback data of shale gas volume fractured wells show that the flowback rate of gas wells is extremely low, and the flowback rate of most shale reservoirs is less than 50%. For instance, the flowback rate of the Eagle Ford Basin in the United States is 20%, and the flowback rate of shale gas wells in the Haynesville Basin is only 5%; some shale gas wells in the Fuling area of China are even as low as 3%. A large amount of fracturing fluid retention may not only cause huge damage to shale reservoirs but also ultimately weaken the gas flow capacity. Therefore, several sets of comparison schemes were designed, such as 40, 50, and 60% of reservoir exogenous water content, to study its influence on cumulative gas production of gas wells under different production systems in 20 years.
It can be seen from Figures 12–14 and Table 6 that when the reservoir water content is higher, the daily gas production decline rate of two different production systems is higher, and the EUR in 20 years is lower; when reservoir water content gradually increases, the earlier the “productivity reversal” occurs, the higher the residual pressure of the reservoir, the higher the increase in EUR, and the higher the stimulation effect of pressure-controlled production. This is because after the foreign liquid intrusion to the shale gas reservoir, long-term contact with the clay minerals in the reservoir leads to the decrease of Young’s modulus, elastic modulus, Poisson’s ratio, and other mechanical parameters, ultimately resulting in the weakened cementation performance, and the enhanced stress sensitivity as well. Moreover, the higher the water content, the higher the stress sensitivity, and thus, the more reasonable the bottom hole pressure difference should be.
Figure 12.
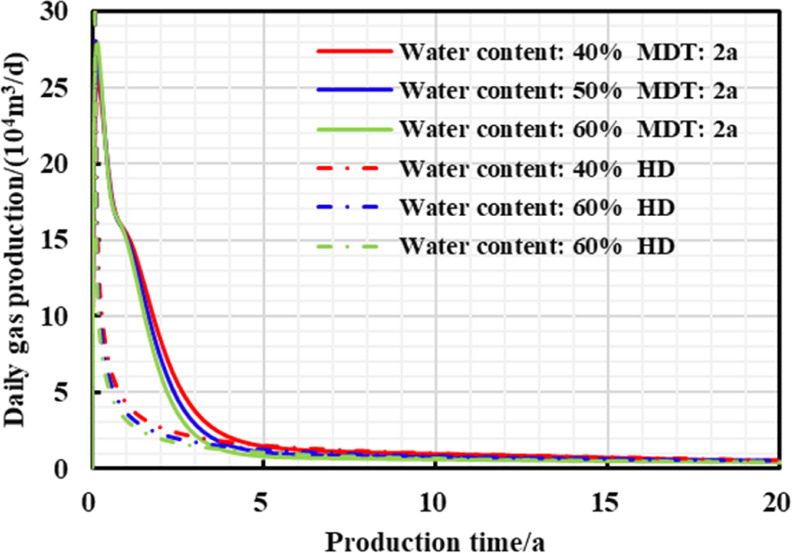
Chart of daily gas production and production time with different production strategies under different exogenous water content.
Figure 14.
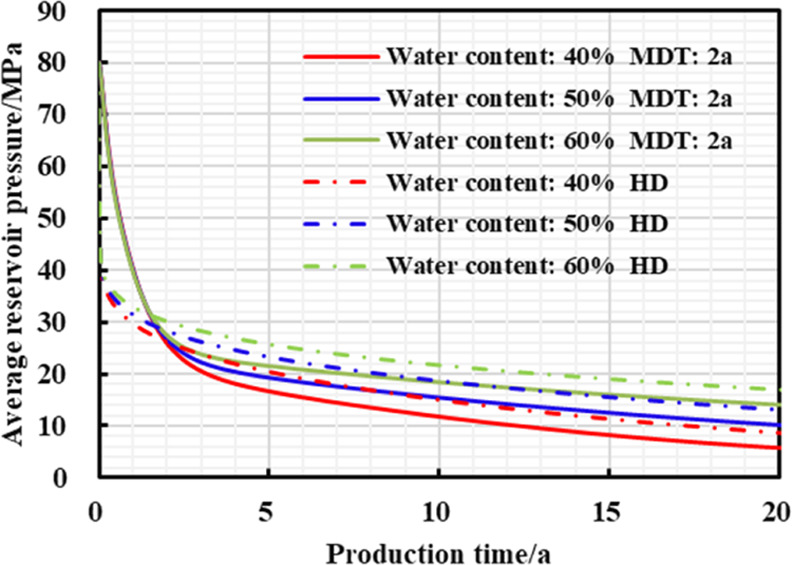
Chart of average reservoir pressure and production time with different production strategies under different exogenous water content.
Table 6. Relationship between EUR and Exogenous Water Content for Different Production Systems.
| sw value (%) | EUR depressurization production/(108 m3) | EUR under 2 year managed pressure drawdown/(108 m3) | 20 year-EURincrease/% |
|---|---|---|---|
| 40 | 1.8081 | 1.9298 | 6.73 |
| 50 | 1.6201 | 1.7476 | 7.56 |
| 60 | 1.4620 | 1.5833 | 8.30 |
Figure 13.
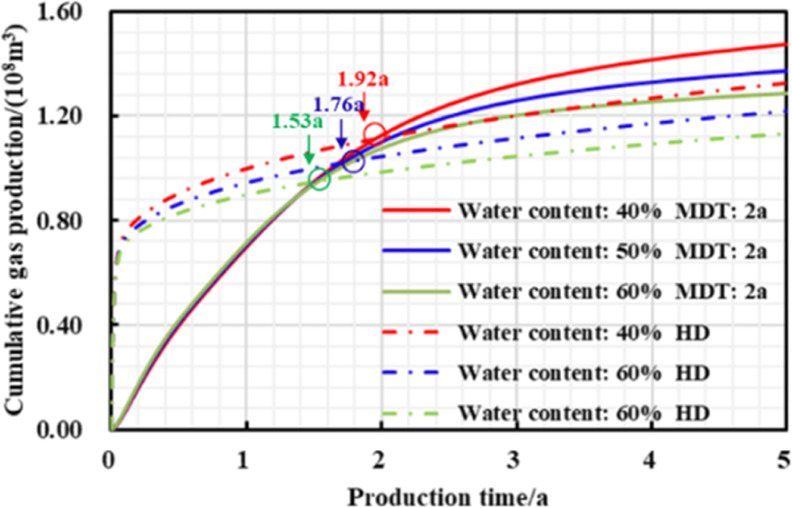
Chart of cumulative gas production and production time with different production strategies under different exogenous water content during short-term production.
3.5. Stress Sensitivity in Unproppant Fracture Network
As unsupported secondary fracture network is susceptible to fracture closure due to changes in formation pressure, the gas flow capacity is greatly weakened, and the impact of the fracture network stress sensitivity on productivity cannot be ignored. When the reservoir parameters and engineering parameters remain unchanged, the fracture network stress sensitivity parameters are 0.2, 0.25, and 0.3 MPa–1, and then the gas well production curve with time, gas production and fracture network stress sensitivity are obtained, respectively.
As shown in Figures 15–17 and Table 7, when the stress sensitivity of the fracture network is higher, the daily gas production decline rate of two different production systems is higher, and the 20 year EUR is lower; as the stress sensitivity gradually increases, “productivity reversal” occurs comparatively earlier, reservoir residual pressure and the increase in 20 year-EUR remains higher, and the stimulation effect of managed pressure drawdown production become stronger as well.
Figure 15.
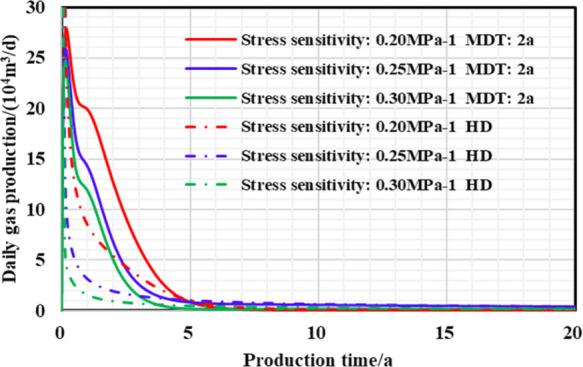
Chart of daily gas production and production time with different production strategies under different stress sensitivities.
Figure 17.
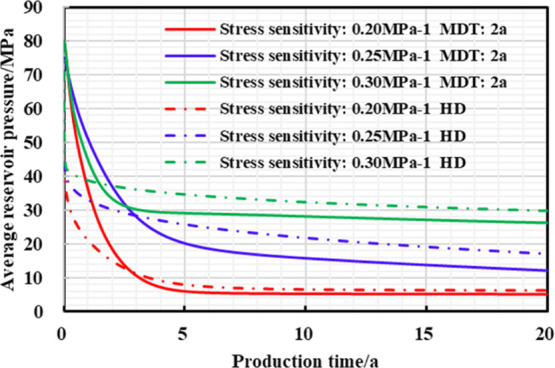
Chart of average reservoir pressure and production time with different production strategies under different stress sensitivities.
Table 7. Relationship between EUR and Stress Sensitivity for Different Production Systems.
| γ value MPa–1 | EUR depressurization production/(108 m3) | EUR under 2 year managed pressure drawdown/(108 m3) | 20 year-EURincrease/% |
|---|---|---|---|
| 0.2 | 1.9068 | 1.9571 | 2.63 |
| 0.25 | 1.4565 | 1.5788 | 8.39 |
| 0.3 | 0.9951 | 1.1149 | 12.04 |
Figure 16.
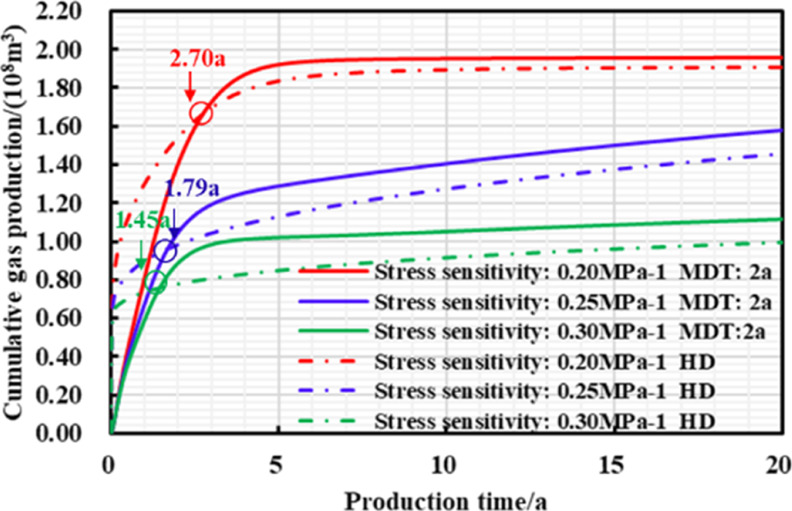
Chart of cumulative gas production and production time with different production strategies under different stress sensitivities.
3.6. Hydraulic Fracture Cluster Spacing
When other parameters remain unchanged and hydraulic fracture cluster spacing changes from 15 to 25 m, the influence of hydraulic fracture cluster spacing on production is analyzed.
Figures 18–20 and Table 8 show that the distance between hydraulic fracture clusters goes negatively with the density of hydraulic fracture strips and reservoir utilization. Then the peak value of daily gas production with managed pressure drawdown production and 20 year-EUR can be greatly increased due to small cluster spacing; furthermore, when fracture cluster spacing decreases, the “productivity reversal” can exist, and the reservoir residual pressure will drop down, finally causing high increase in EUR and strong stimulation effect of pressure-controlled production.
Figure 18.
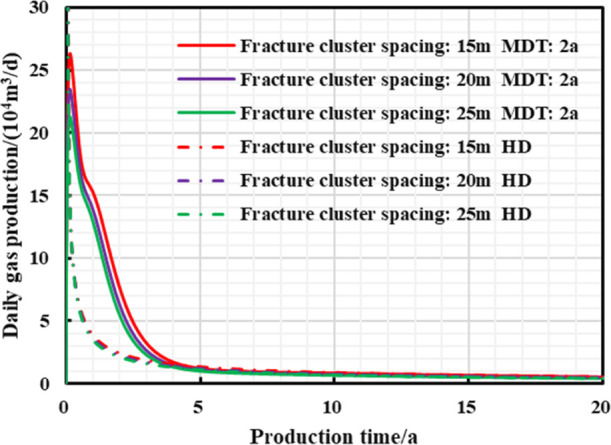
Chart of daily gas production and production time with different production strategies under different hydraulic fracture cluster spacings.
Figure 20.
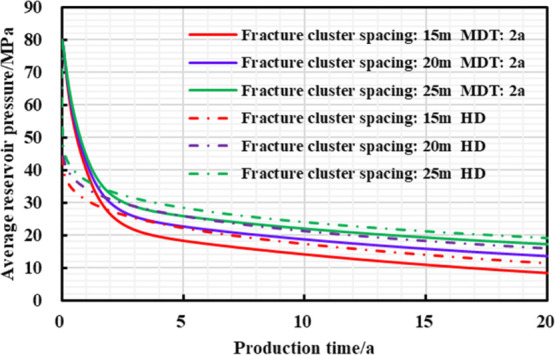
Chart of average reservoir pressure and production time with different production strategies under different hydraulic fracture cluster spacings.
Table 8. Relationship between EUR and Hydraulic Fracture Cluster Spacing for Different Production Systems.
| Lf value m | EUR depressurization production/(108 m3) | EUR under 2 year managed pressure drawdown/(108 m3) | 20 year-EURincrease/% |
|---|---|---|---|
| 15 | 1.6934 | 1.8195 | 7.45 |
| 20 | 1.5044 | 1.6024 | 6.51 |
| 25 | 1.3768 | 1.4546 | 5.65 |
Figure 19.
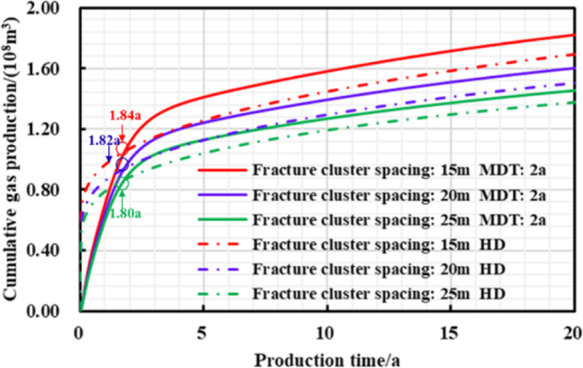
Chart of cumulative gas production and production time with different production strategies under different hydraulic fracture cluster spacings.
3.7. Single Hydraulic Fracture Conductivity
The hydraulic fracture conductivity is the product of the hydraulic fracture permeability and width, which reflects the ability of gas transmission in fractures to wellbore. When hydraulic fracture permeability is kept constant, the width of the fracturing zone controlled by a single hydraulic fracture is changed to 2, 4, and 8 m, respectively. Thus, different hydraulic fracture conductivities are calculated and the influence on gas well production and pressure control production increase effect is analyzed.
As is seen in Figures 21–23 and Table 9, the large fracturing zone width means big density of induced fractures. Next, an ideal fracturing stimulation effect can be obtained so that fracture network conductivity is strong, and the daily gas rate and cumulative gas production under managed pressure drawdown are high. However, reservoir stress sensitivity can be enhanced by gradual increase in the fracturing zone width. The earlier the “productivity reversal” occurs, the lower reservoir residual pressure and then the higher the EUR increase, ultimately obtaining stronger stimulation effect of pressure control production.
Figure 21.
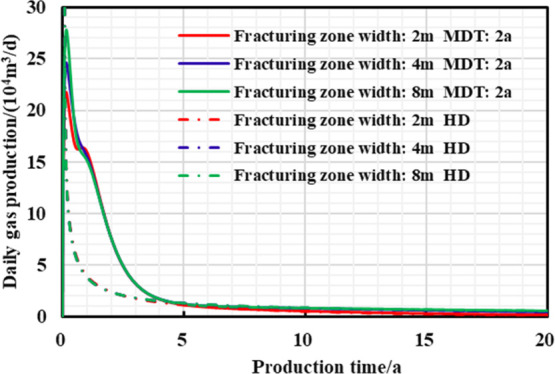
Chart of daily gas production and production time with different production strategies under different fracturing zone widths.
Figure 23.
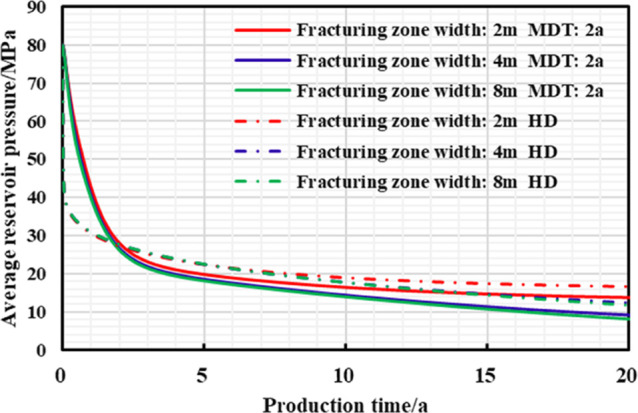
Chart of average reservoir pressure and production time with different production strategies under different fracturing zone widths.
Table 9. Relationship between EUR and Hydraulic Fracture Fracturing Zone Width for Different Production Systems.
| D value/m | EUR depressurization production/(108 m3) | EUR under 2 year managed pressure drawdown/(108 m3) | 20 year-EURincrease/% |
|---|---|---|---|
| 2 | 1.4764 | 1.5952 | 8.05 |
| 4 | 1.6520 | 1.7889 | 8.28 |
| 8 | 1.6777 | 1.8336 | 9.29 |
Figure 22.
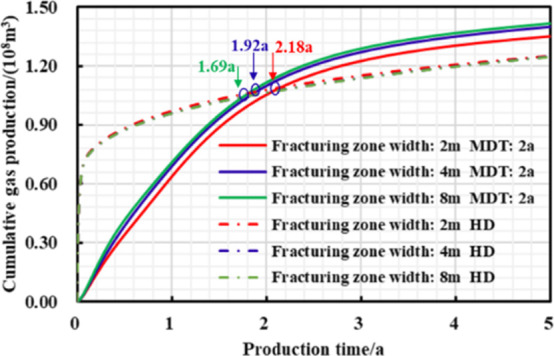
Chart of cumulative gas production and production time with different production strategies under different fracturing zone widths during short-term production.
3.8. Hydraulic Fracture Half Length
When other parameters are constant and hydraulic fracture half-lengths are 60, 80, and 100 m, respectively, the variation trend of gas well production with respect to fracture half-length under different production strategies is analyzed, and gas well production typical curves under different fracture half-length is calculated and besides a 20 year EUR comparative analysis of different production systems is made.
As shown in Figures 24–26 and Table 10, the larger the hydraulic fracture half-length, the higher the peak daily gas production, daily gas production decline rate, and 20 year EUR of different production systems; when the half-length of hydraulic fracture gradually increases, the stress sensitivity is also more obvious; then the lower final reservoir residual pressure and higher EUR increase rate can be realized by the controlled pressure production.
Figure 24.
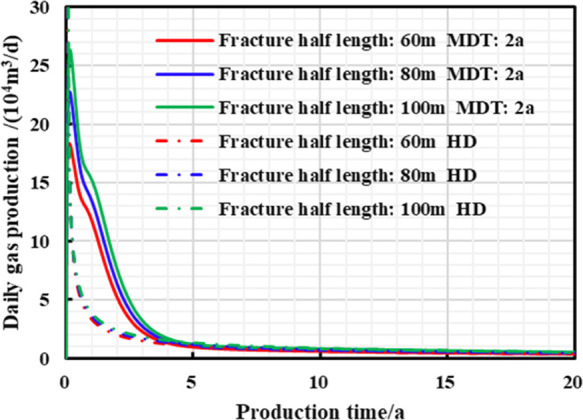
Chart of daily gas production and production time with different production strategies under different hydraulic fracture half lengths.
Figure 26.
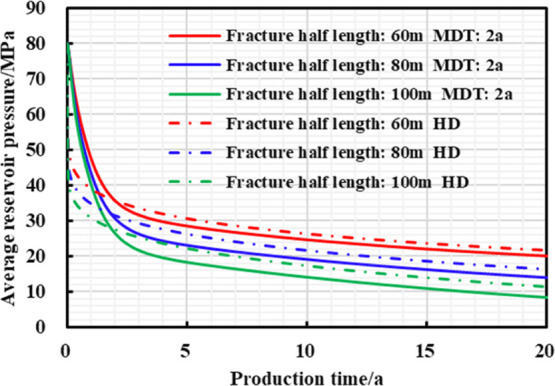
Chart of average reservoir pressure and production time with different production strategies under different hydraulic fracture half lengths.
Table 10. Relationship between EUR and Hydraulic Fracture Half-Length for Different Production Systems.
| yF value m | EUR depressurization production/(108 m3) | EUR under 2 year managed pressure drawdown/(108 m3) | 20 year-EURincrease/% |
|---|---|---|---|
| 60 | 1.2785 | 1.3416 | 4.94 |
| 80 | 1.4881 | 1.5867 | 6.63 |
| 100 | 1.6934 | 1.8221 | 7.60 |
Figure 25.
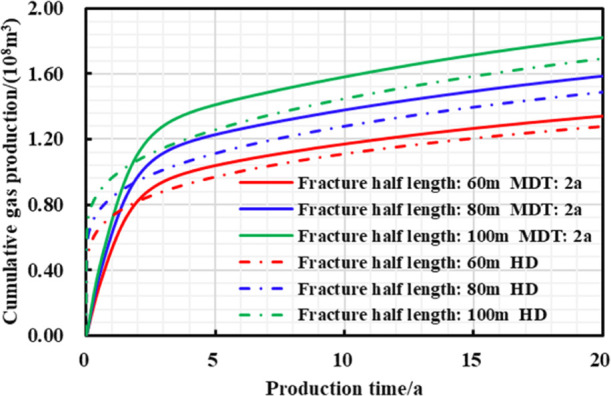
Chart of cumulative gas production and production time with different production strategies under different hydraulic fracture half lengths.
4. Multi-Parameter Interaction Impact Analysis
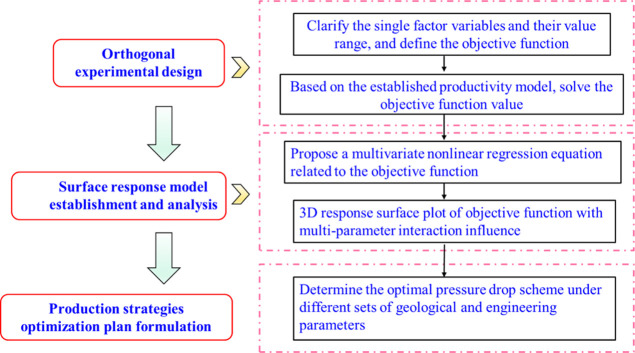
The optimization research of production system index parameters generally takes the productivity and productivity increase of gas wells with different production systems as dependent variables. Therefore, the parameters sensitivity and interaction mechanism between parameters are studied and optimal combination of these parameters can be expected to significantly maximize the objective function. At present, most relevant researches are carried out by local sensitivity analysis. Thus, a suitable multi-parameter optimization model becomes the key to solving the above issues. In addition, the current production system index parameter optimization merely concludes the pressure drop path optimization, ignoring the optimization of pressure drawdown duration and initial controlled pressure. Thus, for typical shale gas multi-stage fractured horizontal well, a multi-parameter optimization method was proposed by combining the response surface quantitative method (optimizing the objective function) with the pressure-controlled productivity model (model calculation). Regarding long-term (20 years) production EUR and EUR increase with different production strategies of shale gas reservoirs, regression analysis was carried out on the above 9 parameters, and the influence mechanism and effect of multi parameter interaction on pressure-controlled production and EUR increase was analyzed, which can efficiently and reasonably achieve the gas well production system plan optimization. The specific analysis process is presented in Figure 27 as follows.
Figure 27.
Optimization model implementation flowchart.
4.1. Orthogonal Experimental Design
Design of Experiments (DoE) is a research method for process analysis between influence parameters and the response, which was used to statistically assess the significance of different factors with the lowest experimental cost. Traditional experimental designs can include factorial design, uniform design, center combination design, Box-Behnken design, and so on.41 The above approaches are more common in solving the linear regression between factors and responses. Due to the large number of influencing factors and complex interaction of multiple factors, the regression between factors and responses shows strong nonlinear characteristics. Thus, there exists significant defects on traditional experimental design method. Orthogonal experimental design, as a widely used high-efficiency test method, adopts a normalized orthogonal table to properly design a multi-factor test plan and seeks the optimal combination of multiple tests, which can effectively analyze test results and overcome the limitations of traditional experimental design. In addition, the results of orthogonal experimental design are also quite believable, which verifies the method a good design choice.
In order to better understand the interaction impact of fracturing parameters, geological parameters and production system parameters on the development effect of shale gas wells, and to provide theoretical support for subsequent optimization of production system scheme, an orthogonal experimental design was used in this paper to conduct a comprehensive analysis of multiple indicators to obtain the optimal solution. To be more specific, the test concluded above 9 factors, in each of which 5 levels were considered, as shown in Table 11. According to the orthogonal design Table 1, 63 groups of schemes can be designed and then simulated by proposed mechanism productivity model to compare shale gas well production effects with different production systems, which was presented in Table 12.
Table 11. Multi-Factor Orthogonal Design for Shale Gas Wells.
| reservoir
parameter |
engineering
parameter |
production
system parameter |
|||||||
|---|---|---|---|---|---|---|---|---|---|
| original reservoir pressure/MPa | matrix permeability/mD | water content | hydraulic fracture number | hydraulic fracture half-length/m | fracture network stress sensitivity/MPa–1 | managed pressure drawdown duration/a | initial controlled pressure | pressure drop path | |
| level | A | B | C | D | E | F | G | H | I |
| 1 | 50 | 5 × 10⁻⁵ | 0.4 | 72 | 60 | 0.2 | 0.1 | 0.2 | –0.6 |
| 2 | 60 | 1 × 10⁻⁴ | 0.45 | 85 | 70 | 0.225 | 0.5 | 0.4 | –0.3 |
| 3 | 70 | 5 × 10⁻⁴ | 0.5 | 90 | 80 | 0.25 | 1 | 0.6 | 1 |
| 4 | 80 | 1 × 10⁻³ | 0.55 | 105 | 90 | 0.275 | 2 | 0.8 | 2 |
| 5 | 90 | 5 × 10⁻³ | 0.6 | 120 | 100 | 0.3 | 3 | 0.95 | 3 |
Table 12. Orthogonal Design Scheme Running Result.
| reservoir
parameters |
engineering
parameters |
production
system parameters |
objective function | |||||||
|---|---|---|---|---|---|---|---|---|---|---|
| run | original reservoir pressure/MPa | matrix permeability/mD | water content | hydraulic fracture number | hydraulic fracture half-length/m | fracture network stress sensitivity/MPa–1 | managed pressure drawdown duration/a | Pwf0/Pe | pressure drop path | 20 year-EURincrease/% |
| 1 | 60 | 5.00 × 10⁻⁵ | 0.5 | 120 | 90 | 0.25 | 2 | 0.2 | –0.3 | 13.46 |
| 2 | 60 | 5.00 × 10⁻⁴ | 0.4 | 120 | 80 | 0.225 | 0.5 | 0.2 | 1 | 17.06 |
| 3 | 80 | 5.00 × 10⁻³ | 0.4 | 72 | 70 | 0.25 | 0.1 | 0.4 | 1 | 5.42 |
| 4 | 50 | 1.00 × 10⁻⁴ | 0.5 | 120 | 80 | 0.225 | 0.5 | 0.4 | 2 | 10.74 |
| 5 | 50 | 5.00 × 10⁻³ | 0.45 | 85 | 100 | 0.25 | 1 | 0.6 | –0.6 | 0.03 |
| 6 | 60 | 5.00 × 10⁻⁵ | 0.4 | 80 | 80 | 0.3 | 1 | 0.4 | 2 | 4.45 |
| 7 | 60 | 5.00 × 10⁻⁵ | 0.55 | 70 | 70 | 0.3 | 0.5 | 0.6 | 1 | 2.24 |
| 8 | 90 | 5.00 × 10⁻³ | 0.6 | 100 | 100 | 0.3 | 0.1 | 0.95 | 3 | 5.94 |
| 9 | 80 | 5.00 × 10⁻⁴ | 0.45 | 100 | 100 | 0.225 | 0.5 | 0.2 | –0.6 | 7.77 |
| 10 | 50 | 5.00 × 10⁻⁴ | 0.45 | 80 | 80 | 0.3 | 0.1 | 0.2 | –0.3 | 6.73 |
| 11 | 70 | 5.00 × 10⁻⁵ | 0.45 | 60 | 60 | 0.275 | 0.1 | 0.6 | –0.3 | 3.75 |
| 12 | 70 | 5.00 × 10⁻⁴ | 0.5 | 80 | 80 | 0.25 | 0.1 | 0.6 | 1 | 4.79 |
| 13 | 90 | 5.00 × 10⁻⁵ | 0.45 | 90 | 90 | 0.225 | 0.5 | 0.6 | 1 | 9.84 |
| 14 | 70 | 5.00 × 10⁻³ | 0.55 | 80 | 80 | 0.225 | 2 | 0.4 | –0.6 | –2.29 |
| 15 | 80 | 5.00 × 10⁻⁵ | 0.5 | 70 | 70 | 0.25 | 2 | 0.2 | 3 | 6.25 |
| 16 | 70 | 5.00 × 10⁻⁴ | 0.5 | 100 | 100 | 0.225 | 1 | 0.2 | 2 | 6.08 |
| 17 | 70 | 1.00 × 10⁻³ | 0.4 | 60 | 60 | 0.25 | 0.5 | 0.95 | –0.3 | 10.26 |
| 18 | 70 | 5.00 × 10⁻⁴ | 0.5 | 80 | 80 | 0.25 | 0.1 | 0.6 | 1 | 4.85 |
| 19 | 50 | 5.00 × 10⁻⁴ | 0.6 | 90 | 90 | 0.25 | 0.5 | 0.4 | –0.3 | –8.08 |
| 20 | 50 | 5.00 × 10⁻⁵ | 0.4 | 60 | 60 | 0.2 | 0.1 | 0.2 | –0.6 | –8.53 |
| 21 | 70 | 5.00 × 10⁻⁵ | 0.6 | 60 | 60 | 0.225 | 0.1 | 0.6 | 2 | 2.92 |
| 22 | 70 | 5.00 × 10⁻³ | 0.45 | 90 | 90 | 0.2 | 1 | 0.2 | 1 | 0.95 |
| 23 | 60 | 5.00 × 10⁻³ | 0.5 | 60 | 60 | 0.225 | 0.5 | 0.6 | –0.6 | 6.31 |
| 24 | 70 | 1.00 × 10⁻⁴ | 0.45 | 80 | 80 | 0.275 | 2 | 0.95 | –0.6 | 5.12 |
| 25 | 60 | 5.00 × 10⁻⁴ | 0.55 | 60 | 60 | 0.2 | 1 | 0.95 | 1 | –16.05 |
| 26 | 80 | 1.00 × 10⁻⁴ | 0.6 | 80 | 80 | 0.2 | 3 | 0.6 | –0.3 | –2.61 |
| 27 | 90 | 5.00 × 10⁻⁴ | 0.4 | 70 | 70 | 0.2 | 2 | 0.6 | 2 | 4.55 |
| 28 | 60 | 1.00 × 10⁻⁴ | 0.45 | 70 | 70 | 0.225 | 0.1 | 0.2 | –0.3 | 5.10 |
| 29 | 80 | 5.00 × 10⁻⁵ | 0.4 | 80 | 80 | 0.225 | 1 | 0.95 | –0.3 | 10.37 |
| 30 | 90 | 1.00 × 10⁻⁴ | 0.4 | 80 | 80 | 0.275 | 0.5 | 0.2 | 1 | 12.16 |
| 31 | 90 | 5.00 × 10⁻⁵ | 0.45 | 80 | 80 | 0.225 | 1 | 0.4 | –0.6 | 7.50 |
| 32 | 70 | 5.00 × 10⁻⁴ | 0.4 | 70 | 70 | 0.225 | 3 | 0.8 | –0.6 | 10.79 |
| 33 | 50 | 1.00 × 10⁻⁴ | 0.4 | 90 | 90 | 0.225 | 1 | 0.6 | 3 | –9.71 |
| 34 | 90 | 1.00 × 10⁻³ | 0.5 | 70 | 70 | 0.2 | 0.1 | 0.4 | –0.6 | 11.35 |
| 35 | 50 | 5.00 × 10⁻⁵ | 0.5 | 70 | 70 | 0.225 | 3 | 0.95 | 1 | –12.35 |
| 36 | 70 | 5.00 × 10⁻⁴ | 0.4 | 90 | 90 | 0.3 | 3 | 0.4 | –0.6 | 6.99 |
| 37 | 60 | 5.00 × 10⁻⁴ | 0.4 | 100 | 100 | 0.2 | 2 | 0.6 | –0.3 | –1.46 |
| 38 | 60 | 1.00 × 10⁻³ | 0.45 | 80 | 80 | 0.2 | 3 | 0.6 | 3 | –14.37 |
| 39 | 50 | 5.00 × 10⁻⁴ | 0.55 | 80 | 80 | 0.225 | 0.1 | 0.2 | 3 | 2.95 |
| 40 | 60 | 5.00 × 10⁻⁴ | 0.6 | 70 | 70 | 0.275 | 0.5 | 0.2 | –0.6 | 7.56 |
| 41 | 70 | 5.00 × 10⁻⁵ | 0.45 | 70 | 70 | 0.2 | 0.5 | 0.8 | 3 | 5.10 |
| 42 | 80 | 5.00 × 10⁻⁴ | 0.45 | 60 | 60 | 0.2 | 1 | 0.4 | 1 | 4.38 |
| 43 | 50 | 5.00 × 10⁻³ | 0.4 | 70 | 70 | 0.275 | 1 | 0.6 | –0.3 | –36.74 |
| 44 | 90 | 5.00 × 10⁻⁴ | 0.5 | 60 | 60 | 0.225 | 1 | 0.8 | –0.3 | 11.52 |
| 45 | 60 | 1.00 × 10⁻⁴ | 0.5 | 90 | 90 | 0.2 | 0.1 | 0.95 | –0.6 | 4.04 |
| 46 | 70 | 1.00 × 10⁻⁴ | 0.6 | 70 | 70 | 0.2 | 1 | 0.2 | 1 | 5.31 |
| 47 | 60 | 5.00 × 10⁻⁵ | 0.6 | 80 | 80 | 0.25 | 1 | 0.8 | –0.6 | 6.33 |
| 48 | 50 | 1.00 × 10⁻⁴ | 0.45 | 60 | 60 | 0.3 | 2 | 0.8 | 1 | –7.71 |
| 49 | 50 | 5.00 × 10⁻⁵ | 0.5 | 100 | 100 | 0.275 | 3 | 0.4 | 1 | –0.46 |
| 50 | 50 | 1.00 × 10⁻³ | 0.6 | 60 | 60 | 0.225 | 2 | 0.4 | 1 | –29.93 |
| 51 | 70 | 5.00 × 10⁻⁵ | 0.55 | 100 | 100 | 0.2 | 0.5 | 0.4 | –0.3 | 9.52 |
| 52 | 80 | 1.00 × 10⁻⁴ | 0.5 | 60 | 60 | 0.3 | 0.5 | 0.6 | –0.6 | 7.21 |
| 53 | 60 | 1.00 × 10⁻⁴ | 0.4 | 100 | 100 | 0.25 | 0.1 | 0.8 | 1 | 5.63 |
| 54 | 90 | 1.00 × 10⁻⁴ | 0.55 | 60 | 60 | 0.25 | 3 | 0.2 | –0.3 | 11.23 |
| 55 | 70 | 1.00 × 10⁻⁴ | 0.4 | 60 | 100 | 0.25 | 0.5 | 0.4 | 3 | 9.34 |
| 56 | 60 | 5.00 × 10⁻⁴ | 0.5 | 60 | 60 | 0.275 | 1 | 0.4 | 3 | 2.99 |
| 57 | 60 | 1.00 × 10⁻⁴ | 0.45 | 70 | 60 | 0.225 | 0.1 | 0.4 | –0.3 | 5.41 |
| 58 | 80 | 1.00 × 10⁻³ | 0.55 | 90 | 60 | 0.275 | 0.1 | 0.8 | 2 | 16.61 |
| 59 | 50 | 5.00 × 10⁻⁴ | 0.45 | 70 | 70 | 0.25 | 0.5 | 0.95 | 2 | –8.23 |
| 60 | 60 | 5.00 × 10⁻³ | 0.45 | 60 | 60 | 0.25 | 3 | 0.2 | 2 | –10.54 |
| 61 | 70 | 1.00 × 10⁻³ | 0.5 | 70 | 70 | 0.3 | 1 | 0.2 | –0.3 | 15.87 |
| 62 | 50 | 5.00 × 10⁻³ | 0.5 | 80 | 89 | 0.2 | 0.5 | 0.8 | –0.3 | –13.64 |
| 63 | 50 | 5.00 × 10⁻⁵ | 0.4 | 60 | 60 | 0.2 | 0.1 | 0.2 | –0.6 | –7.89 |
4.2. Surface Response Model Establishment and Analysis
The traditional mathematical statistics method requires a large amount of data and cannot consider the comprehensive effect of several factors. Orthogonal experimental design can consider several factors but cannot find a clear functional expression between the factors and the response value, so the optimal combination of factors and the response value cannot be found. Therefore, a regression analysis method is expected to be conducted with few experiments, short experimental period, and high accuracy, which can be used to study the interaction between several factors. The response surface method (RSM) satisfies these requirements to a large extent by qualitatively adopting reasonable experimental design, deterministic experimental results, and quantitatively combining multiple quadratic regression to fit the functional relationship between influencing variables and response values. It can also form response surfaces to study the interaction between factors and response values and make up for the shortcomings of traditional univariate tests. By estimating the multivariate terms coefficients by the least squares principle, the regression equation after the initial fitting can be obtained. Then the F-test method is used to analyze the significance of regression model terms, and the variables with the least significant coefficients in the above estimation are, respectively, eliminated, and the eliminated response surface equation is established, which is the final surface equation. Finally, the influence mechanism of each factor on the response value is clarified, and a reasonable combination of multi-parameters is ultimately determined to optimize the response value.
4.2.1. Regression Model Establishment
Based on the above principles, the form of the selected response surface model should be first considered. When selecting an appropriate model, statistical methods are used to screen polynomials to better fit the equation such as linear models, two-factor interaction models (2FI), quadratic models, or cubic models. The second-order polynomial model based on Taylor expansion is most commonly used, which considers all quadratic terms, linear terms, and interaction terms. Generally speaking, the quadratic regression model is accurate enough to approximate the real data in the field of science and technology.
The quadratic regression response surface equation can be expressed as eq 39
| 39 |
The above formula 39 can be rewritten as 40 in matrix form
| 40 |
where
the F test method was used
to verify the significance of regression equation. The significance
level α is an important index parameter of the F test, which
means that there is a certain degree of confidence in making a judgment,
and finally a relevant variance analysis table (Table 13) was established to judge
the significance of the regression equation. The expression of the F-test method is  .
.
Table 13. Regression ANOVA Result.
| source of variance | deviation sum of squares | degrees of freedom | variance | F ratio | significance | |
|---|---|---|---|---|---|---|
| regression | SR | m | VR = SR | |||
| residual | Se | n | ||||
| sum | ST | m + n |
F follows an F distribution with (m,n) degrees of freedom. Under the given significance level α (usually 0.01 or 0.05), if F > F0.01(m,n), it means that the regression equation is highly significant, which confirms that the established regression equation fits well with the test data; when F0.01(m,n) ≥ F ≥ F0.05(m,n), the regression equation is significant; in addition, F0.05(m,n) ≥F≥ F0.1(m,n), the regression equation is significant below 0.1; F< F0.1(m,n), the regression equation is not significant.
According to the above orthogonal test design results, the EUR increase of gas wells with different production system schemes was regarded as the dependent variable, and the 20 year EUR increase was adopted as the response values. The multiple regression nonlinear equations between response values and the multi-influencing variables were successively established and the significance test analysis was carried out.
-
a
multivariate nonlinear regression equation
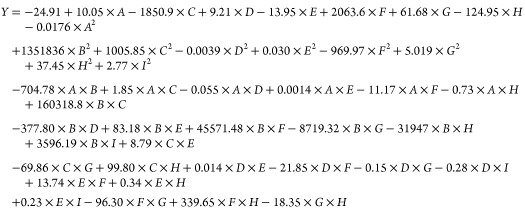 |
41 |
-
b
The significance analysis of the regression equation was carried out by the F test method. Table 14 was variance regression analysis results of the equation, which showed that the equation has a certain rationality and can be used to carry out the influence research of multiple independent influencing variables interaction on the 20 year EUR increase.
Table 14. Variance Regression Equation Analysis of 20 Year-EUR Increase.
| source of variance | deviation sum of squares | degrees of freedom | variance | F ratio | significance |
|---|---|---|---|---|---|
| regression | 6.980 × 10³ | 42 | 1.661 × 10² | 9.843 | F > F0.01(m,m – n – 1) |
| residual | 3.376 × 10² | 20 | 16.884 | ||
| sum | 7.317 × 10³ | 62 |
4.2.2. Results Analysis
According to the polynomial regression equation of EUR increase in different years of production, all fixed parameters are set as their median values, and some three-dimensional response surfaces between the interaction of two parameters are drawn to describe the interaction mechanism impact between different variables on EUR increase in different production stages of shale gas.
-
1
Managed pressure drawdown duration and fracture network stress sensitivity interaction
It can be seen from Figures 28 and 29, when the high pressure drawdown production strategies are adopted for shale gas reservoirs, the excessive stress sensitivity of the fracture network is not conducive to long-term production effect of gas wells, while a reasonable pressure-controlled production system has a positive impact on the long-term EUR of strongly stress-sensitive reservoir. When the fracture network stress sensitivity is constant, the managed pressure drawdown duration has an optimal value range (1 year to 2 years), thus the 20 year-EUR increase can reach the maximum value: when the stress sensitivity increases from 0.2 to 0.3 MPa–1, the optimal value of pressure control duration is increased from 1 year to 2 years, and the maximum in 5 year-EUR is increased from 3.34 to 16.12%, indicating that the more stress sensitive the reservoir is, the longer the pressure control duration should be used to make the final reservoir production effect better.
-
1
Pwf0/Pe and matrix permeability interaction
Figure 28.
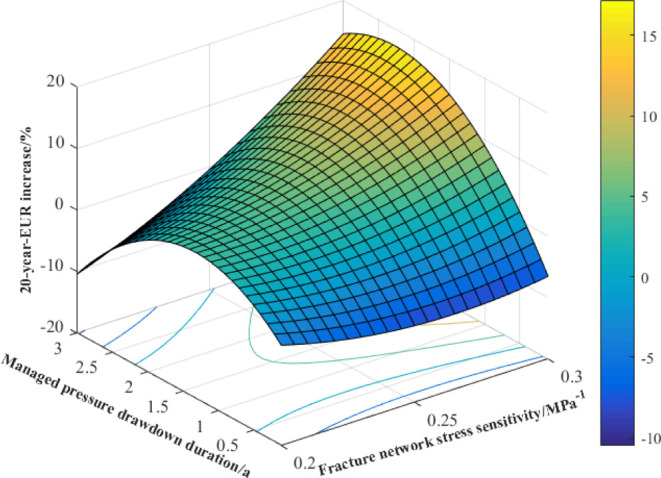
3D surface response for interaction effect of fracture network stress sensitivity and managed pressure drawdown duration on 20 year EUR increase.
Figure 29.
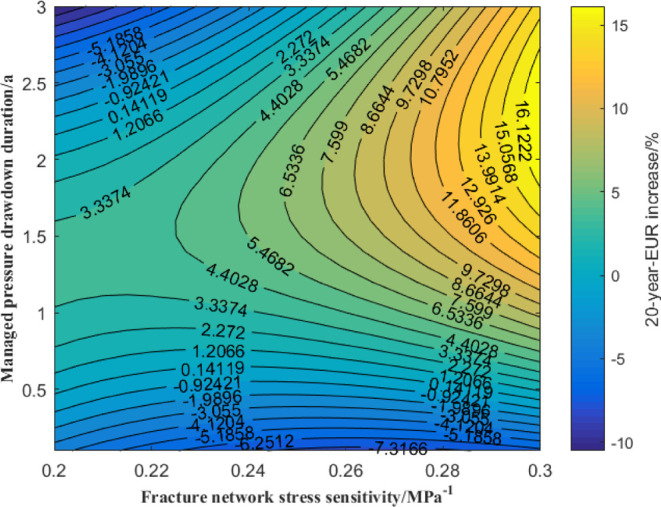
2D map of the 3D response surface.
As is shown in Figures 30 and 31, when Pwf0/Pe is lower than 0.4, the matrix permeability is positively correlated with the 20 year-EUR increase, and furthermore, the lower the Pwf0/Pe, the greater the EUR increase. When Pwf0/Pe is higher than 0.4, the 20 year-EUR increase can decline with the increase of matrix permeability. The greater the Pwf0/Pe, the greater the decrease of 20 year-EUR increase with the rise of matrix permeability. When the matrix permeability is higher than 0.0025 mD, the 20 year EUR increase is negatively correlated with the initial controlled pressure. When the matrix permeability increases from 0.0025 to 0.0045 mD, the 20 year EUR increase decreases significantly with the increase of the matrix permeability; when the matrix permeability is lower than 0.0025 mD, the greater the Pwf0/Pe, the greater the long-term EUR increase, of which the magnitude is negatively correlated with matrix permeability.
-
2
Pressure drop path and original reservoir pressure interaction
Figure 30.
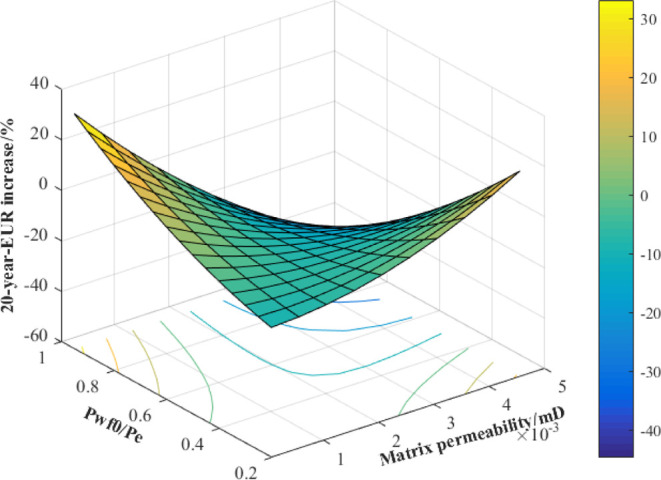
3D surface response for the interaction effect of matrix permeability and Pwf0/Pe on 20 year EUR increase.
Figure 31.
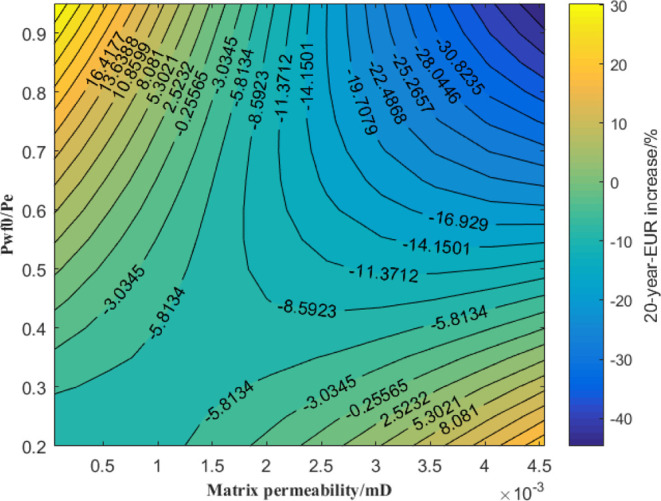
2D map of the 3D response surface.
As is shown in Figures 32 and 33, when the pressure drop path parameter is greater than 0, the 20 year EUR increase is negatively correlated with original reservoir pressure, and then the larger the pressure drop path parameter is, the greater decline in the 20 year-EUR increase with the increase of original reservoir pressure. Therefore, too much controlled pressure development method is not advisable, otherwise it can easily make final recoverable production of gas wells to be too low. When pressure drop path parameter is lower than 0, the 20 year-EUR increase performs positively with original reservoir pressure; while original reservoir pressure remains unchanged, there exists an optimal pressure drop path parameter range (0–1), thus the 20 year EUR increase can reach maximum value: when original reservoir pressure is gradually increased from 50 to 90 MPa, the optimal pressure drop path parameter increases from 0 to 1, and the maximum 20 year-EUR increase changes from 16.08 to 18.78%; when the pressure drop path parameter exceeds optimal value, the long-term EUR increase can be reduced gradually, of which the decrease is negatively correlated with original reservoir pressure.
Figure 32.
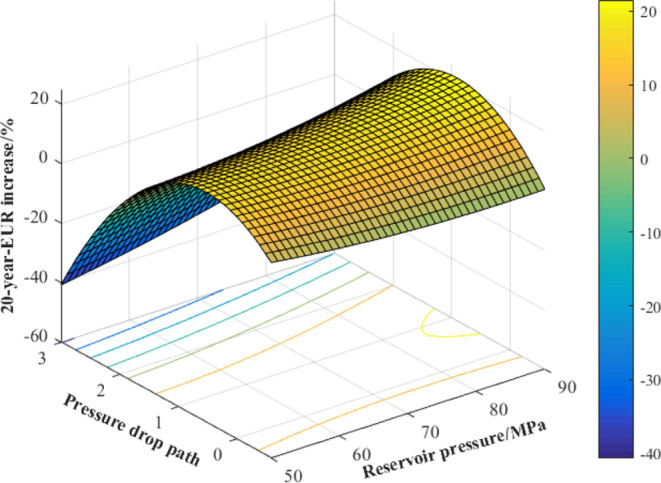
3D surface response for interaction effect of reservoir pressure and pressure drop path on 20 year EUR increase.
Figure 33.
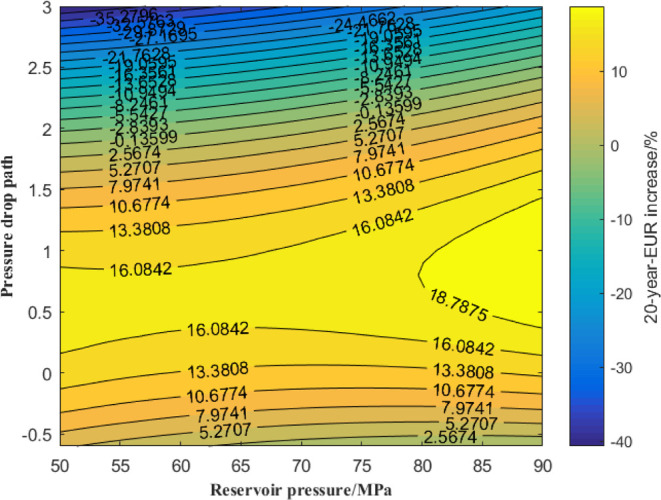
2D map of 3D response surface.
The analysis showed that the combination of different geological parameters and engineering parameters has a significant impact on the formulation and optimization of the gas well production system. Therefore, when arranging the production method of gas wells and optimizing the production index parameters, the influence of specific geological background and fracturing factors should be comprehensively considered to obtain the ideal reservoir production effect. However, ignoring the interaction between parameters and simply examining the impact of a certain parameter on shale gas productivity of different production schemes is one-sided and unreliable for understanding the increase or decrease of EUR growth.
5. Results and Discussion
-
1
The stress sensitivity for hydrocarbon extraction from gas shale provides a theoretical basis for production system optimization. A theoretical composite flow model, including various stress-sensitivity mechanisms, was established for the production simulation optimization.
-
2
Based on the local sensitivity analysis method, 20 year production characteristic curves under different single factor and production methods were obtained and the effects of influencing factors on 20 year-EUR increase were identified as well. The results showed that the managed pressure drawdown should be applied to the shale reservoir with high original reservoir pressure and tight matrix. The reservoir pressure rapid drop and poor physical properties can result in strong rock stress sensitivity. This phenomenon can destroy main flow path into the matrix and fracture systems and further impair gas flow out of the shale. For the reservoir with better fracturing design and higher external water content, the stress sensitivity cannot be ignored during the gas production period, thus the pressure-controlled production scheme should be selected as well.
-
3
Finally, the mathematical model of multi-parameter interaction optimization intuitively quantified the effect of single influencing factor and multi-parameter on the EUR increase in different production years. This research provides a more reliable reference for production system optimization based on a series of mathematical approaches to improve overall long-term recovery from shale gas reservoirs. This paper also emphasizes that ignoring the interaction between parameters and simply examining the impact of a certain parameter on shale gas productivity is one-sided and unreliable for understanding the increase or decrease of EUR growth in different production duration.
Acknowledgments
This research was funded by the Research on New Techniques and Methods of Shale Gas Experimental Testing (grant no. 2021DJ1905).
The authors declare no competing financial interest.
References
- Jia B.; Tsau J. S.; Barati R. A workflow to estimate shale gas permeability variations during the production process. Fuel 2018, 220, 879–889. 10.1016/j.fuel.2017.11.087. [DOI] [Google Scholar]
- Tian L.; Li H. F.; Ma J. X.; Xie Q.; Gu D. H.; Ren X. X. Multi-layer and multi-stage seepage flow model for tight gas reservoirs based on start-up pressure gradient and stress sensitivity. Nat. Gas Geosci. 2017, 28, 1898–1907. [Google Scholar]
- He J. L.; Liu W.; Yu Q.. The controlling effect of oil source faults on shale gas enrichment of Longmaxi Formation in Sichuan Basin. China Earth Sciences Joint Academic Annual Meeting; Chinese Academy of Sciences, 2017; pp 549–551.
- Lan Y.; Yang Z.; Wang P.; Yan Y.; Zhang L.; Ran J. A review of microscopic seepage mechanism for shale gas extracted by supercritical CO2 flooding. Fuel 2019, 238, 412–424. 10.1016/j.fuel.2018.10.130. [DOI] [Google Scholar]
- Xiao-qing Z.; Jian L. I.; Kang B. I.; Shang-ge L.; Zhen-ping L.; Fei A. Softening micro-mechanism and mechanical properties of water-saturated shale in Northwestern Hubei[J]. Rock Soil Mech. 2017, 38, 2022–2028. [Google Scholar]
- Xu L. Q.; Liu H. B.; Meng Y. F. Experiment study on relationship between swelling pressure and mechanical parameters[J]. Sci. Technol. Eng. 2014, 14, 151–154. [Google Scholar]
- Liu X.; Zhuang Y.; Liang L.; Xiong J. Investigation on the influence of water-shale interaction on stress sensitivity of organic-rich shale. Geofluids 2019, 2019, 2598727. 10.1155/2019/2598727. [DOI] [Google Scholar]
- Luo Z.; Zhang N.; Zhao L.; Liu F.; Liu P.; Li N. Modeling of pressure dissolution, proppant embedment, and the impact on long-term conductivity of propped fractures. J. Petrol. Sci. Eng. 2020, 186, 106693. 10.1016/j.petrol.2019.106693. [DOI] [Google Scholar]
- Gao C.; Du C. M.. Evaluating the impact of fracture proppant tonnage on well performances in Eagle Ford play using the data of last 3-4 years. Presented at the SPE Annual Technical Conference and Exhibition; OnePetro: San Antonio, Texas, 2012. 8-10 October.SPE-160655-MS.
- Chang C.; Zoback M. D.. Creep in unconsolidated and its implication on rock physical properties. Presented at the 42nd US Rock Mechanics Symposium (USRMS); OnePetro: San Francisco, Califormia, 2008. 29 June to 2 July ARMA-08-130.
- Shi X. J.; Li C. B.; Adnan A.; Huang J. H.; Zhao C. Viscoelastic Model with Variable Parameters for Earth Media. Chin. J. Geophys. 2009, 52, 33–39. 10.1002/cjg2.1324. [DOI] [Google Scholar]
- Sone H.; Zoback M. D.. Strength, creep and frictional properties of shale gas reservoirs rocks. Presented at the 44th US Rock Mechanics Symposium and 5th US-Canada Rock Mechanics Symposium; OnePetro: Salt Lake City, Utah, 2010. 27–30 June. ARMA-10-463.
- Wilson K.Analysis of drawdown sensitivity in shale reservoirs using coupled geomechanics models. Paper Presented at the SPE Annual Technical Conference and Exhibition; OnePetro: Houston, Texas, USA, 2015.
- Britt L. K.; Smith M. B.; Klein H. H.; Deng J. Y.. Production benefits from complexity—effects of rock fabric, managed drawdown, and propped fracture conductivity. Paper Presented at the SPE Hydraulic Fracturing Technology Conference; OnePetro: The Woodlands, Texas, USA, 2016.
- Briggs K.; Hill A. D.; Zhu D.; Olson K.. The relationship between rock properties and fracture conductivity in the Fayetteville Shale. Paper Presented at SPE Annual Technical Conference and Exhibition; OnePetro: Amsterdam, The Netherlands, 2014. SPE 170790.
- Wu W.; Kakkar P.; Zhou J.; Russell R.; Sharma M. M.. An experimental investigation of the conductivity of unpropped fractures in shales. SPE Hydraulic Fracturing Technology Conference and Exhibition; OnePetro, 2017.
- Kumar A.; Seth P.; Shrivastava K.; Sharma M. M.. Optimizing drawdown strategies in wells producing from complex fracture networks. SPE International Hydraulic Fracturing Technology Conference and Exhibition; OnePetro, 2018; SPE-191419-18IHFTMS.
- Rui Z.; Zhengfu N.; Feng Y.; Huawei Z. Shale stress sensitivity experiment and mechanism. Acta Pet. Sin. 2015, 36, 224–231. [Google Scholar]
- Liu H. H.; Rutqvist J.; Berryman J. G. On the relationship between stress and elastic strain for porous and fractured rock. Int. J. Rock Mech. Min. Sci. 2009, 46, 289–296. 10.1016/j.ijrmms.2008.04.005. [DOI] [Google Scholar]
- Zheng J.; Ju Y.; Liu H. H.; Zheng L.; Wang M. Numerical prediction of the decline of the shale gas production rate with considering the geomechanical effects based on the two-part Hooke’s model. Fuel 2016, 185, 362–369. 10.1016/j.fuel.2016.07.112. [DOI] [Google Scholar]
- Skurtveit E.; Aker E.; Soldal M.; Angeli M.; Wang Z. Experimental investigation of CO 2 breakthrough and flow mechanisms in shale. Petrol. Geosci. 2012, 18, 3–15. 10.1144/1354-079311-016. [DOI] [Google Scholar]
- Memon A.; Li A.; Memon B. S.; Muther T.; Han W.; Kashif M.; Tahir M. U.; Akbar I. Gas adsorption and controlling factors of shale: review, application, comparison and challenges. Nat. Resour. Res. 2021, 30, 827–848. 10.1007/s11053-020-09738-9. [DOI] [Google Scholar]
- Bowker K. A. Barnett Shale gas production, Fort Worth Basin: Issues and discussion. AAPG Bull. 2007, 91, 523–533. 10.1306/06190606018. [DOI] [Google Scholar]
- Zhang J.; Ouyang L.; Hill A. D.; Zhu D.. Experimental and numerical studies of reduced fracture conductivity due to proppant embedment in shale reservoirs. SPE Annual Technical Conference and Exhibition; One Petro, 2014.
- Zhu Y. H.; Jia C. G.; Jiang T. X. Calculation of shale propped fractures conductivity under the influence of multiple factors. J. Petrol. Nat. Gas 2014, 36, 129–132. [Google Scholar]
- Wen Q.; Jin X.; Subhash N. S.; Li Y.. Experimental investigation of propped fracture network conductivity in naturally fractured shale reservoirs SPE Annual Technical Conference and Exhibition; One Petro, 2013.
- Liang Z.; Jiang Z.; Wu W.; Guo J.; Wang M.; Nie Z.; Li Z.; Xu D.; Xue Z.; Chen R.; et al. Study and Classification of Porosity Stress Sensitivity in Shale Gas Reservoirs Based on Experiments and Optimized Support Vector Machine Algorithm for the Silurian Longmaxi Shale in the Southern Sichuan Basin, China. ACS Omega 2022, 7, 33167–33185. 10.1021/acsomega.2c03393. [DOI] [PMC free article] [PubMed] [Google Scholar]
- Anderson D. M.; Nobakht M.; Moghadam S.; Mattar L.. Analysis of production data from fractured shale gas wells. Paper Presented at SPE Unconventional Gas conference; Society of Petroleum Engineers, 2010.
- Dong D.; Shi Z.; Sun S.; Guo C.; Zhang C.; Guo W.; Guan Q.; Zhang M.; Jiang S.; Zhang L.; et al. Petroleum geological features and exploration prospect of Linhe Depression in Hetao Basin, China. Petrol. Explor. Dev. 2018, 45, 763. 10.1016/s1876-3804(18)30085-5. [DOI] [Google Scholar]
- Xu J.; Ding Y.; Yang L.; Liu Z.; Gao R.; Yang H.; Wang Z. Effect of proppant deformation and embedment on fracture conductivity after fracturing fluid loss. J. Nat. Gas Sci. Eng. 2019, 71, 102986. 10.1016/j.jngse.2019.102986. [DOI] [Google Scholar]
- Mirani A.; Marongiu-Porcu M.; Wang H.; Enkababian P.. Production pressure drawdown management for fractured horizontal wells in shale gas formations. SPE Reservoir Evaluation & Engineering; One Petro, 2016; SPE-181365-ms.
- Perrosa O. A.Pressure transient response in stress-sensitive formationSPE15115. Presented at SPE California Regional Meeting held in Oakland, California; One Petro, 1986. April 2–4.
- Gerami S.; Darvish M. P.; Morad K.; Mattar L.. Type curves for dry CBM reservoirs with equilibrium desorption. Canadian International Petroleum Conference; One Petro, 2007.
- Shen W.; Li X.; Ma T.; Cai J.; Lu X.; Zhou S. High-pressure methane adsorption behavior on deep shales: Experiments and modeling. Phys. Fluids 2021, 33, 063103. 10.1063/5.0054486. [DOI] [Google Scholar]
- Wu K. L.; Li X. F.; Wang C. C.. Apparent permeability for gas flow in shale reservoirs coupling effects of gas diffusion and desorption. Unconventional Resources Technology Conference; Society of Exploration Geophysicists, American Association of Petroleum, 2014; Vol. 152, pp 1–11.
- Wang J. L.; Luo W.; Chen Z.. An integrated approach to optimize bottomhole-pressure drawdown management for a hydraulically fractured well using a transient inflow performance relationship. SPE Reservoir Evaluation & Engineering; One Petro, 2020, 23( (1), ), 095–111.
- Wang X. S. Several theorems of Laplace Transformation and their applications. Mathematics in Practice and Knowledge 1988, 27–31. [Google Scholar]
- Stehfest H. Algorithm 368: Numerical inversion of Laplace transforms [D5]. Commun. ACM 1970, 13, 47–49. 10.1145/361953.361969. [DOI] [Google Scholar]
- Gong J.; Cao L.; Guan Y.; Tian J.; Wang T. Productivity prediction methods of multi fracture horizontal wells in low permeability reservoirs: progress and challenges. Front. Energy Res. 2022, 10, 223. [Google Scholar]
- Yu S. Y. The best practice of empirical method for predicting tight/shale gas reservoir production and estimating the ultimate recoverable volume. News in Petroleum Geology Science and Technology 2015, 000, 19–36. [Google Scholar]
- Zhu X. G.; Xi X. L.; Nie Z. R.; Ma L. W.; Zhu J. J. Optimization of extraction of gold from waste printed circuit board using response surface methodology[J]. Chin. J. Nonferrous Metals 2013, 23, 1739–1745. [Google Scholar]


