



Abstract
Background: Also known as Simple Sequence Repetitions (SSRs), microsatellites are profoundly informative molecular markers and powerful tools in genetics and ecology studies on plants.
Objective: This research presents a workflow for developing microsatellite markers using genome skimming.
Methods: The pipeline was proposed in several stages that must be performed sequentially: obtaining DNA sequences, identifying microsatellite regions, designing primers, and selecting candidate microsatellite regions to develop the markers. Our pipeline efficiency was analyzed using Illumina sequencing data from the non-model tree species Pterodon emarginatus Vog.
Results: The pipeline revealed 4,382 microsatellite regions and drew 7,411 pairs of primers for P. emarginatus. However, a much larger number of microsatellite regions with the potential to develop markers were discovered from our pipeline. We selected 50 microsatellite regions with high potential for developing markers and organized 29 microsatellite regions in sets for multiplex PCR.
Conclusion: The proposed pipeline is a powerful tool for fast and efficient development of microsatellite markers on a large scale in several species, especially nonmodel plant species.
Keywords: Bioinformatics, genome skimming, PCR multiplex, primer design, Pterodon emarginatus, microsatellite markers
1. INTRODUCTION
Also known as Simple Sequence Repetitions (SSRs), microsatellites consist of tandem repetitions of sequences varying from 1 to 6 base pairs in size [1]. They are abundant in the genomes of most species and tend to be uniformly distributed in DNA molecules, being found in genes and intergenic regions [2]. Microsatellite regions have a relatively high mutation rate, such as 10-2 per generation, mainly due to polymerase slippage in the DNA replication or repair process, errors in recombination processes and uneven crossing-over [2]. Mutations result in changes in the number of repeat units and may generate a large number of alleles at each microsatellite locus in a population, increasing the genotype variation [1, 3]. Variations in the number of tandem repetitions accumulate more quickly in the population than point mutations detected by other molecular techniques.
Microsatellites have emerged as an important molecular marker due to characteristics such as abundance, wide genomic distribution, small locus size, high intraspecific polymorphism, high reproducibility, and co-dominant inheritance [1, 3]. Microsatellite markers are deeply informative and powerful tools in various studies on plants such as genetic diversity studies, population structure analysis, kinship studies, conservation genetics, forensic investigations, evolutionary studies, and phylogenetic studies on natural populations of endangered species, among others [4, 5]. Microsatellite markers are widely used in cultivated species as well, for example, to build link maps, map Loci of Quantitative Characteristics (QTL), and marker-assisted selection (MAS) to the desired characteristics [6, 7].
The Developing microsatellite markers depends on identifying the repeat region and sequences of the flanking region. DNA sequences that flank the microsatellites are generally conserved within the same species, which allows the design of specific primers that amplify, through the Polymerase Chain Reaction (PCR), fragments containing the microsatellite in all genotypes. In recent years, the development of New Generation Sequencing platforms (NGS) and advances in bioinformatics tools have revolutionized the ability to develop microsatellite markers [8, 9].
NGS technologies allow for generating large amounts of DNA or RNA sequences in a short time and low cost [10, 11]. Bioinformatics tools allow to assembly genomes with or without a reference sequence, and annotate microsatellite regions on a large scale, consequently learning the abundance and distribution of these repetitive elements in the genome [12]. In this scenario, NGS-based strategies have been characterized as faster, cheaper, and more efficient than Sanger-based protocols for developing markers, even for nonmodel species with little or no genetic information [1, 2].
Although many recent researches have developed micro-satellite markers based on NGS data [1, 2, 9, 13], most of them present no detailed methodological elements. In this article, we present a complete pipeline for the development of microsatellite markers using NGS data. The pipeline is proposed in several stages that must be performed sequentially: obtaining DNA sequences, identifying microsatellite regions, designing primers, and selecting candidate microsatellite regions for the development of markers. Our pipeline efficiency was analyzed using NGS data from the nonmodel species Pterodon emarginatus Vog.
The tree P. emarginatus species, belonging to the family Leguminosae and subfamily Papilionoideae, is popularly known as white “sucupira”. Despite not being endemic to Brazil, P. emarginatus is widely geographically distributed in the country and occurs commonly in the Brazilian Cerrado [14]. P. emarginatus has economic importance mainly due to its medicinal use and pharmacological properties already proven by scientific studies, such as anti-inflammatory, analgesic, antitumor, and antimicrobial activities [15, 16]. In addition, P. emarginatus can be used to recover degraded areas and in wood extraction [17, 18]. However, the literature reports only little genetic and genomic information on the species. P. emarginatus has the number of chromosomes 2n = 16 and genome size estimated by flow cytometry at 606 Mb (Dutra et al., 2012; Albernaz et al. unpublished data). Therefore far, the literature has no reports of microsatellite markers developed specifically for P. emarginatus.
2. MATERIALS AND METHODS
Leaf DNA samples from P. emarginatus were collected in Planaltina-DF (Voucher 68411) and sequenced using Illumina's MiSeq platform. Read quality (2x300 bp, reads paired-end) was assessed using the fastQC software [19, 20] and low-quality base and adapter strings were removed using the Trimmomatic software [21]. Trimmomatic functions HEADCROP (18), CROP (250), and ILLUMINACLIP (2:30:10) were applied. Each library read was cut based on the phred values 10, 15, 20, 25, and 30 as the minimum quality threshold. For such purposes, these phred values were used in the LEADING, TRAILING, and SLIDING WINDOW functions of the Trimmomatic software. The five sets of filtered reads were aligned to the genome of the Medicago truncatula, used as a reference in this filtering optimization analysis, using the bowtie2 software [22]. The set with the largest number of aligned reads was selected to assemble the genomic sequences. Reads smaller than 50 base pairs were eliminated.
We performed the de novo assembly using the assembler Masurca [23], based on the construction of Bruijn graphs as algorithm. Organelle sequences were identified and excluded from the assembly. For this, we created a database for chloroplasts and mitochondria with known sequences for other species of angiosperms and deposited it in the GenBank RefSeq (NCBI). The similarity analysis between the sequences assembled for P. emarginatus and the sequences of the organellar database was performed with Blastn [24]. Sequences with an identity percentage above 80%, an e-value above 10-16, and coverage above 50% were excluded. The quality of the assembly, after removing the organellar sequences, was assessed using the script “assemblathon_stats.pl” prepared by Keith Bradnam (2011).
The annotation of perfect microsatellite regions and the design of large-scale primers were performed using the QDD v.3.1.2 software [25]. Aiming to use the future deve-loped microsatellite markers, we selected 50 pairs of primers. The amplification primers of some microsatellite regions were redesigned using the FastPCR software [26] to enable the PCR multiplex execution. The detailed metho-dology for identifying microsatellite regions and primer design is described below.
3. RESULTS
3.1. Pipeline
3.1.1. Step 1: Obtaining DNA Sequences
The first step in the pipeline is obtaining the DNA sequences for the species of interest in fasta file format. Many species have full or partial genome sequences available in public databases, such as the National Center for Biotechnology Information Genbank (https://www.ncbi.nlm.nih.gov/genome/). It is possible to download the genomic sequences available in databases to detect the microsatellites and develop markers. In the case of species without existing genomic resources, such as P. emarginatus, it is necessary to sequence and assemble the genomic sequences (see materials and methods). Sequencing data can be obtained from different NGS platforms. This pipeline can be executed from draft assemblies with low coverage, that is, it does not require to sequencing or assembling the complete genome for the species of interest.
3.1.2. Step 2: Detecting Microsatellite Regions and Primer Design
The second pipeline stage is detecting microsatellite regions and design of primers. QDD is a software that detects microsatellite regions and designs primers for large genome sequencing projects. The QDD software (http://net.imbe.fr/~emeglecz/qdd.html) was installed in a Linux environment using VirtualBox v. 5.0.14 for Windows hosting (https://www.virtualbox.org/).
The analyses are performed in four steps, also called “pipes” in the QDD software: pipe 1 detects and extracts microsatellites from the fasta file with the genomic sequences; pipe 2 detects the similarity between sequences by comparing all against all of blast, and only single sequences (singletons) are maintained for the design of primers; pipe 3 designs primers for the selected sequences using Primer3 software;, and pipe 4 analyzes the sequences with the RepeatMasker software to remove microsatellite regions associated with transposable elements or other types of repetitive DNA. The QDD software was chosen to compose our pipeline because it can work with large amounts of sequences, performing important analyses such as selecting singletons and detecting other repetitive elements, in addition to designing primers on a large scale.
The command-line version of the QDD manual is run with standard parameters, with two exceptions. In pipe 1, the minimum number of repetitions for each motif size was changed to: ten for dinucleotides, six for tri and tetranucleotides, and five for microsatellite penta and hexanucleotides. The parameters used to design the primers in pipe 3 have been modified to amplicon size of 150-400 bp, GC content of 30-60% (ideal GC: 40%), melting temperature value (Tm) of 52-62 °C (ideal Tm: 56 °C), with a maximum difference of 1 °C between primers of the same pair, and primer lengths of 20-25 bp (ideal size: 22 bp). These parameters have been rigorously defined to improve the QDD ability to detect microsatellite regions and design primers most likely to have a successful PCR amplification.
3.1.3. Step 3: Selection of Candidate Microsatellite Regions for Developing Markers
The analysis using the QDD software resulted in the detection of hundreds to thousands of microsatellite regions with projected pairs of primers from which a restricted number of regions were selected for further marker deve-lopment tests. Several quality filters were used to select 50 microsatellite regions with a high potential for developing markers. The first filter was the exclusion in QDD pipe 2 of sequences that resulted in multiple BLAST hits and the selection of singletons for primer design. This filter was important to design only primer pairs that anneal to a single genomic region. This first filter was applied automatically by the QDD software, however, the other selection filters were applied by the researchers to the final QDD result spreadsheet, generated in pipe 4. The second filter applied was the exclusion of all microsatellite regions whose sequences were associated with other types of repetitive elements (RM_HIT_REPEAT). The association of microsatellites with transposable elements can generate null alleles in PCR. The third filter was the exclusion of all microsatellite regions with AT or AT-rich motifs (MOT_TRANS), a motif avoided because they can form a hairpin and reduce the efficiency of PCR amplification. The fourth filter was the selection of microsatellite regions with the highest number of tandem repetitions (TARGET_MS_LENGTH_IN_REPEAT _NUMBER), as these are more likely to be associated with the genotypic variation.
QDD software generally designs more than one primer pair for each microsatellite region. For each microsatellite region, only one primer pair was chosen and based on the following criteria: the lower the alignment score with different sequences from the annealing site (PCR_PRIMER _ALIGNSCORE), the greater the distance of 20 bp between the primers and the target microsatellite (MIN_PRIMER_ TARGET_DIST), and different lengths of PCR product (PCR_PRODUCT_SIZE) to facilitate sequencing multiplexing. All values used in the selection of microsatellite regions and primers are provided in columns in the final QDD results table.
3.1.4. Step 4: Design of PCR Multiplex Primers
Step 4 of the pipeline is redesigning the primers for the selected microsatellite regions at the end of the third step, aiming to enable the multiplex PCR. Although this step is optional, multiplexing the PCR can reduce the time and costs of population genetic analysis, with a large sample. Step 4 was performed using the FastPCR software [26]. Initially, the sequences containing the 50 selected microsatellite regions and their flanking regions, available in one of the columns (SEQUENCE) of the spreadsheet generated in pipe 4 of the QDD software, were organized in a fasta format file. Before loading the file with the sequences with the FastPCR software, we delimited the stretch of the flanking sequences in which each of the primers, left and right primers, should be drawn using square brackets [ ]. Microsatellite regions were previously highlighted by QDD in the base sequences with lowercase letters, which facilitated to detection of the target regions for designing the primers. The position of the brackets influences the size of the PCR product that will be generated from the primers, that is, the farther from the microsatellite region, the larger the size of the amplicon.
For P. emarginatus, the size of the PCR product was adjusted between 75 and 300 bp to be compatible with some NGS platforms that can be used for genotyping. In the FastPCR primer design tab, we selected the PCR multiplex option, set the minimal difference between multiplex PCR products to 50 bp, and the maximal difference between TA of multiplex PCR products to 2 °C. For the other parameters, we used default values.
3.2. Pipeline Application for Pterodon emarginatus Data
The sequencing on Illumina's MiSeq platform generated 8.3 Gb of data, corresponding to 14.6 million paired-end reads. The phred15 value was defined as the optimal filtering for the P. emarginatus data set and used as a minimum threshold for the quality of bases and reads. After the quality cuts, 6.3 gb of data were maintained. The reads were assembled on 97,308 nuclear sequences with N50 equal to 915. The size of the largest and smallest sequences, as well as the total size of the sequences, were 61,455,300 and 80,873,057 bp, respectively. The assembly has 81 Mb of sequences from the nuclear genome of P. emarginatus, corresponding to 13.3% of the complete genome (Albernaz et al., under review).
In pipe 1 of the QDD software, 4,382 microsatellite regions were detected, distributed in 6,100 sequences assembled for P. emarginatus. In the QDD pipe 2, 3,463 singleton sequences were detected and only the microsatellite regions found in these sequences were used to design the primers. In pipe 3 of the QDD, 7,411 pairs of primers were designed to amplify 2,458 microsatellite regions of P. emarginatus, that is, an average of three pairs of primers per microsatellite region was designed. From the QDD pipe 4 results, 669 microsatellite regions were excluded for being associated with other types of repetitive elements, such as transposable elements. Moreover, 605 microsatellite regions with AT or AT-rich motifs (AAT, AATAT, and AATT) were excluded.
After applying these initial filters, 1,184 microsatellite regions were maintained, in which the motifs of repetition dinucleotides (47.9%) were the most frequent, followed by trinucleotides (37.1%), tetranucleotides (6.6%), pentanucleotides (5.5%), and hexanucleotides (2.9%) (Fig. 2). The tri- and hexanucleotide microsatellite regions were not selected for the development of markers. The most common repetition motifs were AG (63.8%) and AC (36.2%). Microsatellite motifs were repeated in tandem between 5 (hexanucleotides) and 23 times (dinucleotides). Microsatellite regions with at least 16 tandem replications for dinucleotides, 6 for tetranucleotides, and 5 for pentanucleotides were selected for the development of markers (Table S1).
Fig. (2).
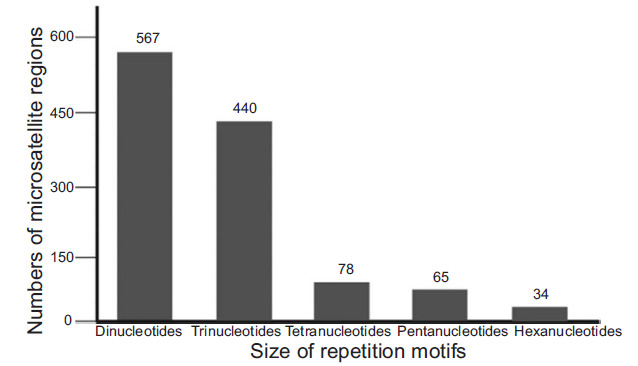
Distribution of microsatellites found in nuclear genomic sequences of P. emarginatus by the size of repetition motif. Numbers were assessed after excluding microsatellite regions associated with other types of DNA repetition and with AT motifs.
The FastPCR software redesigned primer pairs for all 50 microsatellite regions shown in Supplementary Table S1 (184.4KB, docx) . Twenty-nine primer pairs were grouped into multiplex sets for PCR. 5 multiplex sets were generated with 4 microsatellite regions and 3 multiplex sets with 3 microsatellite regions (Supplementary Table S2).
4. DISCUSSION
Our pipeline presents the workflow for rapid, efficient development of microsatellite markers using NGS data. NGS technologies allow the generation of nucleotide sequences with high throughput, also contributing to a larger amount of sequences deposited in databases. NGS technologies have facilitated access to genomic data and have signi-ficantly enabled the large-scale development of molecular markers [2]. Currently, Illumina is the most widely used platform for developing markers [2]. In this study, the data generated by Illumina platform allowed us to assemble part of the genome of P. emarginatus and discover thousands of microsatellites regions. Draft assemblies with low coverage were used to detect microsatellite regions and design large-scale primers for other species, such as Dipteryx alata Vogel and Passiflora edulis Sims [9, 27, 28].
Our pipeline suggests the use of the QDD software, a tool that detects a large scale of perfect microsatellites [25]. Microsatellites are generally classified as perfect or imperfect. The perfect ones are composed by the tandem repetition of a single motif for repetition, while the imperfects have some bases not belonging to the motif between repetitions [2]. Higher levels of genetic variation are generally found in perfect microsatellites compared to imperfect [29], which justifies the choice of the QDD software to compose our pipeline. Other tools have also been used to develop microsatellite markers, such as the SSR finder software, Microsatellite Identification Tool (MISA), and IMEX webserver software [5, 9, 30].
The analysis of the QDD software allowed the discovery of microsatellite regions and the design of large-scale primers for P. emarginatus. The efficiency of our pipeline was maximized by the selection of the most promising micro-satellite regions for developing markers. Excluding micro- satellite regions associated with other repetitive elements and with AT motifs are important due to the possible generation of null alleles in PCR and hairpin formation during amplification, which can negatively influence the forward genetics analysis.
The PCR technique is used to validate the developed microsatellite markers. The microsatellite regions of P. emarginatus with trinucleotide and hexanucleotide motifs were not used to develop the markers either since they are common in coding regions of the genome. Studies indicate low occurrence of microsatellites in coding regions as they can compromise gene expression. Moreover, gene regions have a predominance of microsatellites with tri- and hexanucleotide motifs due to the selection pressure on other motif sizes that alter the reading matrix during the protein translation process [2, 29].
Aimed at developing markers, microsatellite regions of P. emarginatus were selected with the largest number of tandem repetitions. Long repetitive sequences generally have greater polymorphism due to the greater likelihood of mutation by sliding polymerase during DNA replication. Sequences with shorter repetition motifs, such as dinucleotides, often have a higher number of tandem repetitions and are more variable [29]. Most microsatellite regions (66%) selected for the development of P. emarginatus markers have dinucleotide motifs due to their higher number of tandem repetitions. Thus, the selection filters proposed in our pipeline can help researchers to select efficient markers for population screening, consequently saving time and resources.
Developing microsatellite markers involves knowing in advance the DNA sequences that contain such repetitive elements, designing primers for regions that flank the microsatellites, validating the primers through PCR, and performing electrophoresis and detection of polymorphisms among various individuals of the target species [2, 31]. The 50 promising microsatellite markers obtained for P. emarginatus using our pipeline can be validated and used for genotyping populations. Currently, microsatellite genotyping is mainly based on the discrimination of alleles according to the size of the locus using capillary electrophoresis [32]. Although it is an efficient strategy, it does not allow to detection of molecular variations that can influence the size of the analyzed locus, such as single nucleotide polymorphisms (SNPs) or insertion or deletion events (indels). In this context, some studies have performed sequence-based genotyping of microsatellites using NGS platforms. Sequence-based genotyping offers more refined estimates of population genetic parameters [32]. Our pipeline can be used for developing markers for sequence-based genotyping, however, when choosing such a genotyping strategy, it is important to decrease the amplicon size values to 120-200 bp in pipe 3 of the QDD software. PCR products up to 200 bp in size can be sequenced by a wide range of NGS platforms.
Step 4 of our pipeline is redesigning the primers for the microsatellite regions to enable PCR multiplex during the primer validation stage. Despite being optional, it is a very relevant step since multiplexing allows several microsatellite regions to be amplified together in the same PCR reaction, which can reduce the time and cost of the primer validation process. During multiplex PCR, the microsatellite regions that will be replicated together must not have overlapping allele lengths; the primers need to have close annealing temperatures, and secondary structures must not be formed between the primers [2]. Using specific software for multiplexing, such as FastPCR, contributes to all these points to be optimized. In step 4 of our pipeline, we adjusted the maximum amplicon size to 300 bp to subsequently genotype the population of P. emarginatus using the Illumina MiSeq platform, which generates reads with up to 300bp.
CONCLUSION
Our pipeline suggests a set of bioinformatics tools and analysis parameters that can be used for the rapid, efficient development of microsatellite markers. Researchers using the NGS approach to develop markers generally identify microsatellites and design primers on a large scale, a process that involves difficulty in selecting candidate regions for further testing on the target species. This pipeline enabled the discovery of microsatelite regions and design primers on a large scale for P. emarginatus and generated promising microsatellite markers. A total of 50 microsatellite markers were selected, out of which 29 were organized in sets for PCR multiplex aiming at further validation and genotyping of the species populations. However, a much larger number of microsatellite regions with the potential to develop markers were discovered from our pipeline. Thus, the proposed pipeline is a powerful tool for developing microsatellite markers on a large scale in several species, especially non-model plant species.
Fig. (1).
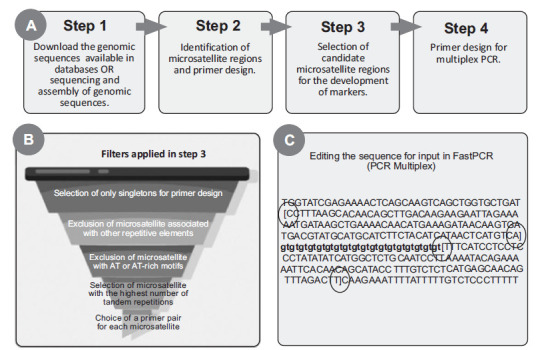
Pipeline for developing microsatellite markers. 1A: Four-step pipeline. 1B: Sequential filters to obtain microsatellite regions and primers with high potential for developing markers. 1C: Editing of genomic sequences for input of Fast PCR software aiming to assemble PCR multiplexes. The microsatellite sequence is highlighted by lowercase letters. The square brackets, evidenced by the circles, delimit the regions for drawing the primers.
ACKNOWLEDGEMENTS
This research was elaborated in the context of the PRONEM (Public Call N ° 07/2016 Program to Support Emerging Nuclei PRONEM/FAPEG/CNPq) and MCTIC/ CNPq Nº 28/2018 – Universal, proc. 431320/2018-7. It also integrates the Working Group on Genetics and Evolutionary Genomics of the Instituto Nacional de Ciência e Tecnologia (INCT) in Ecology, Evolution and Conservation of Biodiversity – MCTIC/CNPq (process 465610/2014-5) and FAPEG. It was also supported by a scholarship from the National Post-Doctoral Program of CAPES (PNPD / CAPES) linked to the Post-Graduate Program in Genetics and Plant Breeding (PGMP) at the Federal University of Goiás. TNS and MPCT are partially financed by research productivity grant of Conselho Nacional de Desenvolvimento Científico e Tecnológico (CNPq).
ETHICS APPROVAL AND CONSENT TO PARTICIPATE
Not applicable.
HUMAN AND ANIMAL RIGHTS
No animals/humans were used for studies that are the basis of this research.
CONSENT FOR PUBLICATION
Not applicable.
AVAILABILITY OF DATA AND MATERIALS
The authors confirm that the data supporting the findings of this study are available within the article.
FUNDING
None.
CONFLICT OF INTEREST
The authors declare no conflict of interest, financial or otherwise.
SUPPLEMENTARY MATERIAL
Supplementary material is available on the publisher’s website along with the published article.
REFERENCES
- 1.Taheri S., Lee Abdullah T., Yusop M.R., Hanafi M.M., Sahebi M., Azizi P., Shamshiri R.R. Mining and development of novel SSR markers using Next Generation Sequencing (NGS) data in plants. Molecules. 2018;23(2):1–20. doi: 10.3390/molecules23020399. [DOI] [PMC free article] [PubMed] [Google Scholar]
- 2.Vieira M.L.C., Santini L., Diniz A.L., Munhoz C.F. Microsatellite markers: What they mean and why they are so useful. Genet. Mol. Biol. 2016;39(3):312–328. doi: 10.1590/1678-4685-GMB-2016-0027. [DOI] [PMC free article] [PubMed] [Google Scholar]
- 3.Deng P., Wang M., Feng K., Cui L., Tong W., Song W., Nie X. Genome-wide characterization of microsatellites in Triticeae species: Abundance, distribution and evolution. Sci. Rep. 2016;6(1):32224. doi: 10.1038/srep32224. [DOI] [PMC free article] [PubMed] [Google Scholar]
- 4.Teshome Z., Terfa M.T., Tesfaye B., Shiferaw E., Olango T.M. Genetic diversity in anchote (Coccinia abyssinica (Lam.) Cogn) using microsatellite markers. Curr. Plant Biol. 2020;24:100167. doi: 10.1016/j.cpb.2020.100167. [DOI] [Google Scholar]
- 5.Kumar C., Kumar R., Singh S.K., Goswami A.K., Nagaraja A., Paliwal R., Singh R. Development of novel g-SSR markers in guava (Psidium guajava L.) cv. Allahabad Safeda and their application in genetic diversity, population structure and cross species transferability studies. PLoS One. 2020;15(8):e0237538. doi: 10.1371/journal.pone.0237538. [DOI] [PMC free article] [PubMed] [Google Scholar]
- 6.Kristamtinila T., Basunanda P., Murti R.H. Application of microsatellite markers as marker assisted selection (mas) in the f3 generation results crosses of black rice and white rice. AIP Conf. Proc. 2020;2260:0–9. [Google Scholar]
- 7.Miah G., Rafii M.Y., Ismail M.R., Puteh A.B., Rahim H.A., Islam KhN., Latif M.A. A review of microsatellite markers and their applications in rice breeding programs to improve blast disease resistance. Int. J. Mol. Sci. 2013;14(11):22499–22528. doi: 10.3390/ijms141122499. [DOI] [PMC free article] [PubMed] [Google Scholar]
- 8.Bastías A., Correa F., Rojas P., Almada R., Muñoz C., Sagredo B. Identification and characterization of microsatellite loci in maqui (Aristotelia chilensis [molina] stunz) using Next-Generation Sequencing (NGS). PLoS One. 2016;11(7):e0159825. doi: 10.1371/journal.pone.0159825. [DOI] [PMC free article] [PubMed] [Google Scholar]
- 9.Guimarães R.A., Telles M.P.C., Antunes A.M., Corrêa K.M., Ribeiro C.V.G., Coelho A.S.G., Soares T.N. Discovery and characterization of new microsatellite loci in Dipteryx alata Vogel (Fabaceae) using next-generation sequencing data. Genet. Mol. Res. 2017;16(2):16. doi: 10.4238/gmr16029639. [DOI] [PubMed] [Google Scholar]
- 10.Mardis E.R. Next-generation DNA sequencing methods. Annu. Rev. Genomics Hum. Genet. 2008;9(1):387–402. doi: 10.1146/annurev.genom.9.081307.164359. [DOI] [PubMed] [Google Scholar]
- 11.Metzker M.L. Sequencing technologies - the next generation. Nat. Rev. Genet. 2010;11(1):31–46. doi: 10.1038/nrg2626. [DOI] [PubMed] [Google Scholar]
- 12.Mehrotra S., Goyal V. Repetitive sequences in plant nuclear DNA: Types, distribution, evolution and function. Proteom. Bioinform. 2014;12(4):164–171. doi: 10.1016/j.gpb.2014.07.003. [DOI] [PMC free article] [PubMed] [Google Scholar]
- 13.Pandey M., Sharma J. Efficiency of microsatellite isolation from orchids via next generation sequencing. Open J. Genet. 2012;2(4):167–172. doi: 10.4236/ojgen.2012.24022. [DOI] [Google Scholar]
- 14.Lima H.C., Lima I.B. Pterodon in Lista de Espécies da Flora do Brasil. In: Jard Botânico do Rio Janeiro. 2015. Available from: http://floradobrasil.jbrj.gov.br/jabot/floradobrasil/FB29840.
- 15.Pascoa H., Diniz D.G.A., Florentino I.F., Costa E.A., Bara M.T.F. Microemulsion based on Pterodon emarginatus oil and its anti-infammatory potential. Braz. J. Pharm. Sci. 2015;51(1):117–126. doi: 10.1590/S1984-82502015000100013. [DOI] [Google Scholar]
- 16.Bavaresco O.S.A., Pereira I.C.P., Melo C.D., Lobato F., Falcai A., Bomfim M.R.Q. Popular use of Pterodon spp. in the treatment of rheumatic diseases. Rev. Investig. Biomed. 2016;8(1):81–91. doi: 10.24863/rib.v8i1.32. [DOI] [Google Scholar]
- 17.Lorenzi H. Brazilian Trees: Manual for the identification and cultivation of native tree plants in Brazil. nhbs. 2008;2:384. [Google Scholar]
- 18.Hansen D., Haraguchi M., Alonso A. Pharmaceutical properties of “sucupira” (Pterodon spp.). Braz. J. Pharm. Sci. 2010;46(4):607–616. doi: 10.1590/S1984-82502010000400002. [DOI] [Google Scholar]
- 19.Dutra R.C., Silva P.S., Pittella F., Viccini L.F., Leite M.N., Raposo N.R.B. Phytochemical and cytogenetic characterization of Pterodon emarginatus Vogel seeds. IFSC Tech. Sci. J. 2012;3(1):99–109. [Google Scholar]
- 20.Andrews S. FastQC: a quality control tool for high throughput sequence data. 2010. Available from: http://www.bioinformatics. babraham.ac.uk/projects/fastqc/ (Accessed on: March 16, 2022).
- 21.Bolger A.M., Lohse M., Usadel B. Trimmomatic: A flexible trimmer for Illumina sequence data. Bioinformatics. 2014;30(15):2114–2120. doi: 10.1093/bioinformatics/btu170. [DOI] [PMC free article] [PubMed] [Google Scholar]
- 22.Langmead B., Trapnell C., Pop M., Salzberg S.L. Ultrafast and memory-efficient alignment of short DNA sequences to the human genome. Genome Biol. 2009;10(3):R25. doi: 10.1186/gb-2009-10-3-r25. [DOI] [PMC free article] [PubMed] [Google Scholar]
- 23.Zimin A.V., Marçais G., Puiu D., Roberts M., Salzberg S.L., Yorke J.A. The MaSuRCA genome assembler. Bioinformatics. 2013;29(21):2669–2677. doi: 10.1093/bioinformatics/btt476. [DOI] [PMC free article] [PubMed] [Google Scholar]
- 24.Altschul S.F., Gish W., Miller W., Myers E.W., Lipman D.J. Basic local alignment search tool. J. Mol. Biol. 1990;215(3):403–410. doi: 10.1016/S0022-2836(05)80360-2. [DOI] [PubMed] [Google Scholar]
- 25.Meglécz E., Costedoat C., Dubut V., Gilles A., Malausa T., Pech N., Martin J.F. QDD: A user-friendly program to select microsatellite markers and design primers from large sequencing projects. Bioinformatics. 2010;26(3):403–404. doi: 10.1093/bioinformatics/btp670. [DOI] [PubMed] [Google Scholar]
- 26.Kalendar R., Khassenov B., Ramankulov Y., Samuilova O., Ivanov K.I. FastPCR: An in silico tool for fast primer and probe design and advanced sequence analysis. Genomics. 2017;109(3-4):312–319. doi: 10.1016/j.ygeno.2017.05.005. [DOI] [PubMed] [Google Scholar]
- 27.Antunes A.M., Nunes R., Novaes E., Coelho A.S.G., Soares T.N., Telles M.P.C. Large number of repetitive elements in the draft genome assembly of Dipteryx alata (Fabaceae). Genet. Mol. Res. 2020;19(2):1–9. doi: 10.4238/gmr18463. [DOI] [Google Scholar]
- 28.Araya S., Martins A.M., Junqueira N.T.V., Costa A.M., Faleiro F.G., Ferreira M.E. Microsatellite marker development by partial sequencing of the sour passion fruit genome (Passiflora edulis Sims). BMC Genomics. 2017;18(1):549. doi: 10.1186/s12864-017-3881-5. [DOI] [PMC free article] [PubMed] [Google Scholar]
- 29.Merritt A.B.J., Culley T.M., Avanesyan A., Stokes R. An empirical review: Characteristics of plant microsatellite markers that confer higher levels of genetic variation. Appl. Plant Sci. 2015;3(8):1–12. doi: 10.3732/apps.1500025. [DOI] [PMC free article] [PubMed] [Google Scholar]
- 30.Han Z., Ma X., Wei M., Zhao T., Zhan R., Chen W. SSR marker development and intraspecific genetic divergence exploration of Chrysanthemum indicum based on transcriptome analysis. BMC Genomics. 2018;19(1):291. doi: 10.1186/s12864-018-4702-1. [DOI] [PMC free article] [PubMed] [Google Scholar]
- 31.Mason A. In: Batley J. Ed., Plant Genotyping; Springer: New York, NY. SSR Genotyping. 2015. pp. 77-89.
- 32.Lepais O., Chancerel E., Boury C. Fast sequence-based microsatellite genotyping development workflow. Prepr. bioRxiv. 2019;2019:1–30. doi: 10.7717/peerj.9085. [DOI] [PMC free article] [PubMed] [Google Scholar]
Associated Data
This section collects any data citations, data availability statements, or supplementary materials included in this article.
Supplementary Materials
Supplementary material is available on the publisher’s website along with the published article.
Data Availability Statement
The authors confirm that the data supporting the findings of this study are available within the article.