Abstract
This study aims to reveal the relationship between the number of femicide in Turkey, the female unemployment rate, the male unemployment rate, and inflation. The contribution of the study to the literature is that it estimates the relationship between femicides and macroeconomic variables with a method that incorporates the count data. The dataset was analyzed by using the INGARCH model, one of the most popular approaches for count time series data. This model is particularly attractive for dealing with serial dependence and over-dispersion. The findings revealed that an increase in the female unemployment rate and a decrease in the male unemployment rate increases the number of femicide. In addition, it was observed that the number of femicide in the previous month had a negative effect on the current month’s number. Increasing the employment rate of women, and women's economic freedom generally, are essential factors in reducing femicide. To prevent femicides, policymakers should aim to increase women's employment.
Keywords: Gender-based violence, Femicide, Count time series model, Female unemployment rate
Introduction
The World Health Organization (2012) calls violence against women a worldwide problem and a major challenge to global public health. It has defined violence against women as “physical, sexual or psychological suffering for women, including threats of such acts, coercion or arbitrary deprivation of liberty, whether occurring in public life or in private life” (The United Nations). Femicide, or the killing of women, is the most extreme form of violence against women. The term “femicide” was first used at the beginning of the nineteenth century by Corry (1801) and was legally recognized by Russell (1982).
The phenomenon of femicide refers to the killing of women, through masculine violence, because they are women. The ecological approach, first proposed by Heise (1998), conceptualizes violence as four systems: personal, microsystem, exosystem, macrosystem, and the interaction of these systems. In this study, an analysis is made from the perspective of the exosystem, which includes low socioeconomic status/unemployment, isolation of women and families, and criminal peer associations.
The most common form of violence against women is intimate partner violence (IPV). According to the Global Study on Homicide Report prepared by the United Nations Office on Drugs and Crime (UNODC 2019), women were killed in 82% of intimate partner murders in 2017. This is a strong indicator that women are exposed to gender inequality.
The fact that femicide rates are higher in underdeveloped and developing countries than in other country groups necessitates an examination of the level of development and, accordingly, the role of macroeconomic factors on femicide. Countries with high incomes and high female labor force participation rates have lower femicide rates compared to other countries. In Turkey, while the labor force participation rate for men over the age of 25 was 72.5% in 2020, this rate for women was just 31.6% (TurkStat). Men participate in the workforce more than women, in other words. This leads to the formation of a patriarchal societal structure. Patriarchal family structure and unemployment increase the number of femicide.
Studies on femicides can be divided into various groups. Agüero (2019), Srebot-Roeder (2021) and Colagrossi et al. (2022) investigated the impact of raising women's awareness through media, campaign announcements, or calls to a helpline on violence against women. Estévez-Soto (2021) and Hoehn-Velasco et al. (2021) investigated whether violence against women has changed due to the COVID-19 pandemic. Durrance et al. (2011), Roberts (2009), Murillo et al. (2018), Zeoli and Webster (2010) and Stamatel (2016) examined the impact of alcohol, drugs, firearms, and the restriction of their use on violence against women, including murder. Silva (2018), Amaral et al. (2021), Lin (2001), Álvarez-Garavito and Acosta-González (2021) and González et al. (2020) examined the effects of various issues, such as proximity to a police station, using a panic button, and legal regulations on violence against women and femicide. Monteiro et al. (2021) looked into whether being a black or white woman in different age groups has a significant effect on violence against women and femicide.
Dugan (2002), Brown and Mercy (2008), Roman and Reid (2012) and Torrecilla et al. (2019) focused on the issue of IPV. Femicide was investigated in terms of macroeconomic indicators by Koç and Kutlar (2021) and Çiğdem (2021), and with regards to socio-demographic conditions by Burbano (2016), Valdivia & Castro (2013), Peñaloza et al. (2020), Bekaroğlu (2021) and Kavaklı (2020).
The aim of this study is to investigate the relationship between the number of femicides committed in Turkey between January 2013 and November 2021 and certain macroeconomic variables. For this purpose, the relationship between the number of femicide, the unemployment rate for men and women, and the inflation rate was examined. The contribution of this study to the literature is to estimate femicides by using the count time series model. The subject studied is of great interest and the INGARCH approach chosen for data analysis is not commonly used in the literature. The advantage of the INGARCH model is to deal with serial dependence and over-dispersion.
The rest of the study is organized as follows. The second section gives information about the problem of femicide in Turkey. The methodology used is explained in the third section. The fourth section explains the dataset and reports the empirical results. Finally, the fifth section provides concluding remarks.
The history of Femicide in Turkey
Turkey has one of the highest rates of violence against women, including murder. Between 2013 and 2021, 3035 women were killed (We Will Stop Femicide Platform 2022). Studies carried out to predict and prevent murders of women have made more recognizable the extent of violence against women and femicide.
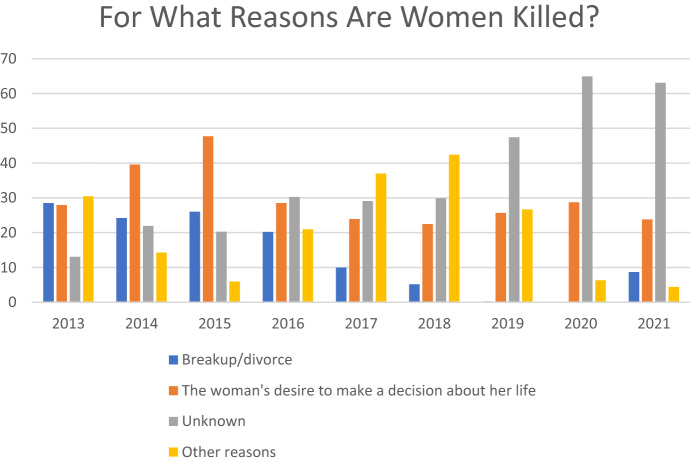
When the causes of femicides committed in Turkey are examined, it is found that most of the murders have no stated motivation. Of the murders with stated motivations, the woman's desire to make decisions about her own life and the decision to divorce/separation are the most common cases. Femicides committed for reasons besides these are expressed by the category “other”.1 Figure 1 illustrates the rates at which women were killed, broken out by reason.
Fig. 1.
The reasons why women were killed (annual average distribution, %)
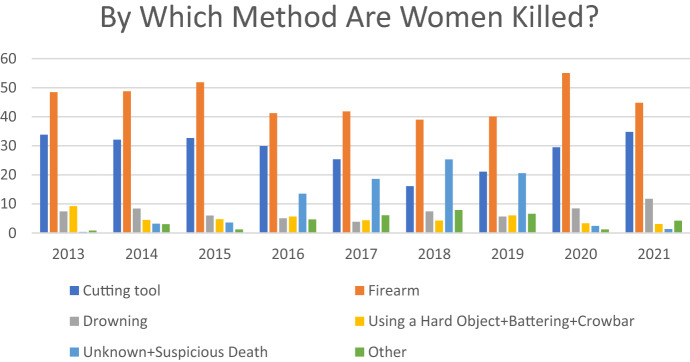
Figure 2 shows the methods by which women were killed. The most used method is firearms and cutting tools. The remaining methods are drowning, using a hard object, battering, crowbar, unknown, suspicious death, and other.
Fig. 2.
The methods by which women were killed (annual average distribution, %)
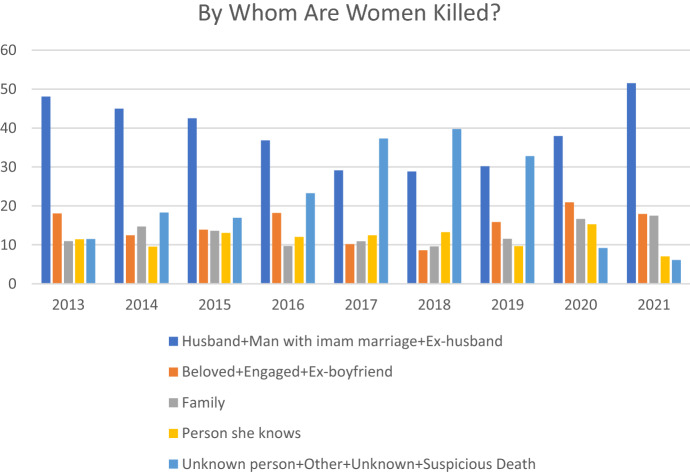
Figure 3 shows by whom the women were killed. As seen in the figure, women were killed mostly by their intimate partners.
Fig. 3.
By whom the women were killed (annual average distribution, %)
Seeing how femicides happen over a 10-year period allows us to see the patterns that repeat, grow, and diminish when it comes to the killing of women. It shows us once again that femicide is not at all unexpected, sudden, or the result of “momentary anger”; on the contrary, it is predictable and preventable. Women are mostly killed at home by their close partners with firearms, most often due to the woman's desire to make decisions about her life. The reason why this human right cannot be exercised is the dominance of the patriarchal social structure and the lack of gender equality.
Methodology
The non-negative integer-valued data in a time series can be stated as a time series of counts, if the observations are registered by counting the number of events at a specific time instance (Vieira 2019a). The autoregressive moving average (ARMA) model was introduced by Box and Jenkins (1970) by combining the moving average and autoregressive models. We can write the ARMA (p, q) model as
| 1 |
where is zero mean white noise and for . In this formula, p denotes the AR degree and q denotes the MA degree.
If the dependent variable is not stationary in the ARMA model, the autoregressive integrated moving average (ARIMA) model2 is estimated by taking the difference according to the stationarity degree. The Box-Jenkins approach can be used in the ARIMA models to define, predict, and perform diagnostic tests of a time series. Firstly, the time-series should be stationary or be differentiated to make it stationary. After that, p and q order can be detected by using the autocorrelation function (ACF) or partial ACF (PACF) in a visual manner or by comparing information criteria like Akaike information criteria (AIC) or Schwartz information criteria (SIC). After determining the p and q degrees in the count time series analysis, the link function and the appropriate distribution are decided.
Serial dependence and over-dispersion are common problems in time series of counts data (Vieira 2019b). Generalized linear models (GLM) approaches can deal with these problems through a link function for time series of counts. Let and denote the count time series. is a time-varying r-dimensional covariate vector and is the filter containing past observations. The conditional mean of on can be modeled by using a stochastic process with a latent mean process . This model can be written as follows:
| 2 |
where present AR parameters, is a transformation function, is a link function defined in the set , is the parameter vector corresponding to the effects of the covariates, and represents the linear predictor. For a good model fit, the link and transformation functions must be chosen correctly. When the link function is chosen as identity, the transformation function becomes . If the distribution is assumed as the Poisson and the covariates are excluded, the model can be defined as the following equation:
| 3 |
Equation (3) is called the Integer-valued Generalized Autoregressive Conditional Heteroscedasticity (INGARCH) model3 of order (p, q) when has the Poisson distribution. If the link function is taken in the logarithmic form, and the dependent variable is expressed as , the resulting model is:
| 4 |
The log-linear model in Eq. (4) has a multiplicative effect on the response variable and captures the effects of covariates better than the INGARCH model in Eq. (3). In Eq. (3) having the identity link function, the assumptions , , and must be provided (Ferland et al. 2006). In Eq. (4) with the log link function, while it is possible for the coefficients of , and to be negative or positive, the conditions for , and must be met (Manolakis et al. 2019).
As an alternative to the Poisson distribution, the negative binomial distribution can also be used. By assuming a negative binomial distribution, the conditional variance is allowed to be larger than the mean. In fact, the Poisson distribution is a special case of the negative binomial distribution and the conditional variance and mean being the same corresponds to the Poisson distribution.
Data and empirical results
In this study, which aims to reveal the relationship between the number of femicide in Turkey, the female unemployment rate, the male unemployment rate, and the inflation rate, the monthly frequency series belonging to the 2013.M1–2021.M11 periods has been analyzed. Explanations of the variables are given in Table 1. Since there is no data on demographic variables such as age, education, employment status, and marital status of the murdered women and the murderers, the factors affecting the number of female deaths were examined by taking the variables at the macroeconomic level with monthly frequency.
Table 1.
Description and source of the variables
| Variable name | Variable description | Source |
|---|---|---|
| FEMALE | The number of killed females | We Will Stop Femicide Platform 2022 |
| UNEMP_F | The unemployment rate of females | Turkish Statistical Institute (TurkStat) (2022) |
| UNEMP_M | The unemployment rate of males | Turkish Statistical Institute (TurkStat) |
| INFLATION | The rate of inflation (monthly percentage change) | Turkish Statistical Institute (TurkStat) |
In the study, since the dependent variable, the number of femicides, was count data, analysis was performed with count time series models by using R, with the tscount package developed by Liboschik et al. (2017) and the Python package programs. The dependent variable used in the study is illustrated in Fig. 4 and the descriptive statistics belonging to all variables are given in Table 2.
Fig. 4.
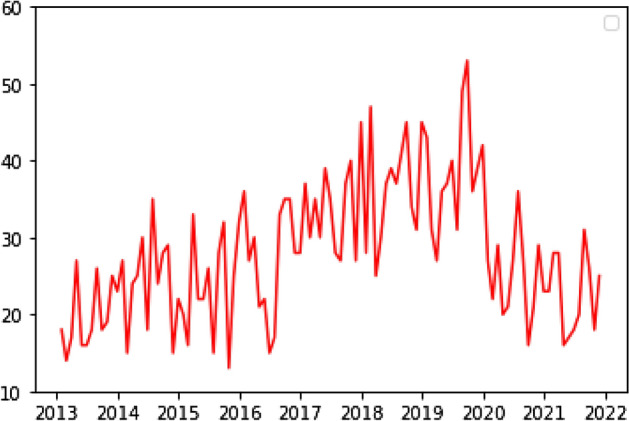
The numbers of femicides
Table 2.
Descriptive statistics
| Variable | Mean | Median | Maximum | Minimum | Standard Deviation | Skewness | Kurtosis | Jarque-Bera |
|---|---|---|---|---|---|---|---|---|
| FEMALE | 28.047 | 27.000 | 53.000 | 13.000 | 8.780 | 0.430 | 2.683 | 3.739 |
| UNEMP_F | 14.044 | 13.800 | 17.900 | 10.400 | 1.850 | 0.052 | 1.984 | 4.654 |
| UNEMP_M | 10.248 | 9.800 | 14.100 | 7.900 | 1.693 | 0.492 | 1.937 | 9.356* |
| INFLATION | 0.983 | 0.860 | 6.300 | − 1.440 | 0.947 | 1.750 | 11.176 | 352.658* |
*At the 5% significance level, the null hypothesis is rejected
When Fig. 4 is examined, it is seen that the number of murdered women followed a slightly increasing trend until 2020 and reached its highest levels in 2019.
It is seen that the average monthly number of femicides is 28, with a maximum of 53 women in Table 2. When the female and male unemployment rates are analyzed, it is seen that the average female unemployment rate is higher than males. It is observed that all the series of the analyzed variables are right-skewed and all of them are flattened compared to the normal distribution, except for the inflation series. It is seen that the FEMALE and UNEMP_F series are normally distributed, while the UNEMP_M and INFLATION series do not fit the normal distribution.
Analyzing the count time series model, in which the number of killed women is the dependent variable, was done by first determining the degrees of the AR/MA/ARMA or ARIMA model that best represented this series. For this purpose, the autocorrelation and partial autocorrelation functions of the series were examined (see Fig. 5) and the stationarity degree was determined by unit root tests (see Table 3).
Fig. 5.
ACF & PACF for FEMALE
Table 3.
The results of unit root for FEMALE
| Variable: female | With constant | With constant & trend |
|---|---|---|
| PP | − 6.393* | − 6.728* |
| DF-GLS | − 1.373* | − 2.559* |
At the *%1, **%5, ***%10 significance level, the null hypothesis is rejected
The FEMALE series was found to be stationary, and the analysis was continued by estimating the ARMA model. Looking at the ACF and PACF graphs, it was seen that the partial autocorrelation function was cut off after the first lag and the autocorrelation function decreases gradually. However, due to the subjectivity in the Box-Jenkins model selection approach, we estimated alternative ARIMA models, with AR terms ranging from 0 to 14 and MA terms from 0 to 3. The preferred model was selected as ARMA (1, 1) by using the AIC and SIC information criteria. For the most suitable ARMA model, the results of the models with different link functions and distributions are given in Table 4.
Table 4.
ARMA model selection
| AR | MA | Link | Distribution | AIC | SIC |
|---|---|---|---|---|---|
| 1 | 1 | Log | Poisson | 716.096 | 724.115 |
| Negative Binomial | 708.479 | 719.170 | |||
| Identity | Poisson | 720.051 | 728.070 | ||
| Negative Binomial | 711.329 | 722.021 |
Although the link function was log and the distribution was negative binomial when the AIC and SIC criteria were evaluated together in Table 4, the distribution and link function were also evaluated by considering other criteria in the other analyses of the study.
Model experiments were continued with various independent variables, link functions and distributions to determine which explanatory variables would be more appropriate to include in the model in the estimation of the count time series model of the number of femicides. The results in Table 5 were evaluated by considering the AIC and SIC criteria together, and it was decided that the most appropriate model had the explanatory variables UNEMP_F and UNEMP_M. Moreover, the most appropriate model was also the model with the log link function and the distribution of which was the negative binomial. Due to the negative values in the inflation variable, the models could not be estimated with the identity link function.
Table 5.
Variable selection
| Model | Independent variable | Link | Distribution | AIC | SIC |
|---|---|---|---|---|---|
| 1 | UNEMP_M | Log | Poisson | 715.841 | 726.533 |
| Negative Binomial | 708.775 | 722.139 | |||
| Identity | Poisson | 716.998 | 727.689 | ||
| Negative Binomial | 709.553 | 722.917 | |||
| 2 | UNEMP_F | Log | Poisson | 717.166 | 727.860 |
| Negative Binomial | 709.724 | 723.088 | |||
| Identity | Poisson | 748.786 | 759.478 | ||
| Negative Binomial | 728.776 | 742.140 | |||
| 3 | INFLATION | Log | Poisson | 721.022 | 731.713 |
| Negative Binomial | 712.427 | 725.791 | |||
| Identity | Poisson | 720.211 | 730.902 | ||
| Negative Binomial | 711.899 | 725.264 | |||
| 4 |
UNEMP_M UNEMP_F |
Log | Poisson | 696.096 | 709.460 |
| Negative Binomial | 692.809 | 710.940 | |||
| Identity | Poisson | 744.111 | 757.475 | ||
| Negative Binomial | 727.125 | 743.162 | |||
| 5 |
UNEMP_M UNEMP_F INFLATION |
Log | Poisson | 692.838 | 708.870 |
| Negative Binomial | 694.904 | 711.519 | |||
| Identity | Poisson | 750.584 | 766.621 | ||
| Negative Binomial | 731.596 | 750.306 |
The bold characters in the table indicate the appropriately selected model
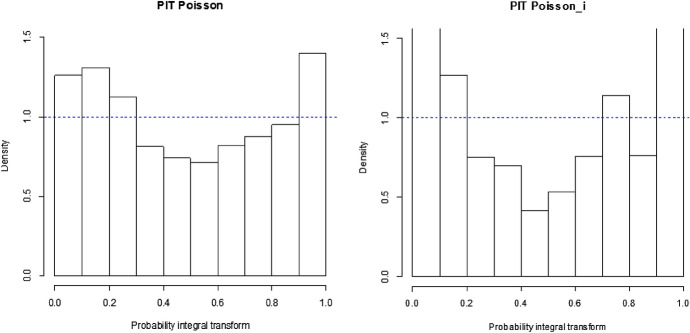
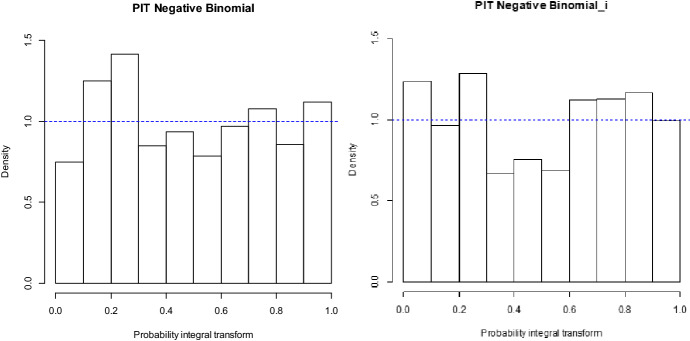
The evaluations of the link function and distribution function were continued by examining the probability integral transform (PIT) histograms. Figures 6 and 7 belong to models estimated by using log and identity link functions with Poisson and negative binomial distributions. When the figures were examined, it was concluded that the model with negative binomial distribution and log link function was suitable due to the greatest similarity to the uniform distribution.
Fig. 6.
PIT of Poisson_log & Poisson_identity
Fig. 7.
PIT of Negative Binomial_log & Negative Binomial _identity
Another way to determine the link function of the appropriate distribution is to calculate and compare the score values for each distribution/link function. Findings obtained for this purpose are presented in Tables 6 and 7.
Table 6.
Link function for Poisson distribution
| Logarithmic | Quadratic | Spherical | rankprob | dawseb | normsq | sqerror | |
|---|---|---|---|---|---|---|---|
| Poisson log | 3.206 | − 0.046 | − 0.214 | 3.401 | 4.602 | 1.290 | 35.765 |
| Poisson identity | 3.430 | − 0.034 | − 0.188 | 4.055 | 5.026 | 1.701 | 48.177 |
rankprob: ranked probability score, dawseb: Dawid-Sebastiani score, normsq: normalized squared error score, sqerror: squared error score
Table 7.
Link function for negative binomial distribution
| Logarithmic | Quadratic | Spherical | rankprob | dawseb | normsq | sqerror | |
|---|---|---|---|---|---|---|---|
| NegBin log | 3.191 | − 0.047 | − 0.217 | 3.382 | 4.572 | 0.953 | 35.765 |
| NegBin identity | 3.342 | − 0.039 | − 0.198 | 3.956 | 4.853 | 0.953 | 48.177 |
rankprob: ranked probability score, dawseb: Dawid-Sebastiani score, normsq: normalized squared error score, sqerror: squared error score
In the scores calculated for both distributions, the log function had smaller values. Therefore, it was decided that the appropriate link function was log.
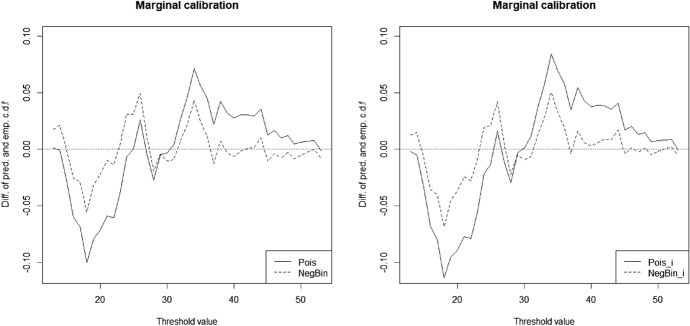
Another criterion used in the evaluation of the appropriate distribution and link function are the marginal calibration graphs. Marginal calibration graphs obtained by using log and identity link functions with both Poisson and negative binomial distributions are included in Figs. 8, 9 and 10.
Fig. 8.
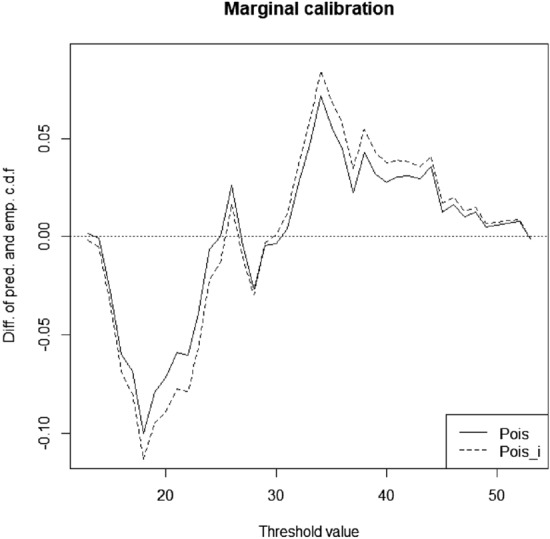
Marginal calibration for Poisson_log & Poisson_identity
Fig. 9.
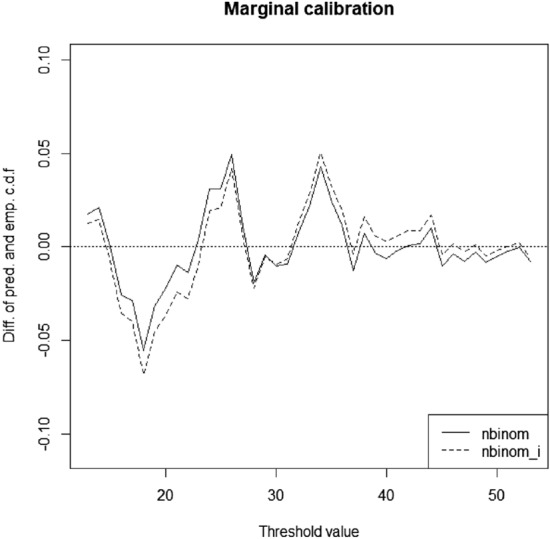
Marginal calibration for Negative Binomial_log and Negative Binomial _identity
Fig. 10.
Marginal calibration for Poisson_log/Negative Binomial_log and Poisson_identity / Negative Binomial_identity
When the link functions of the distributions were examined separately, it seemed that the appropriate link function was log (see Figs. 8 and 9). When we evaluated each function with a different distribution in marginal calibration graphs evaluated according to proximity to the zero line, the appropriate distribution was again negative binomial (see Fig. 10). By evaluating all the findings together, it was concluded that the number of femicides was modeled most conveniently by using the log link function with the negative binomial distribution. The obtained results were also in line with our expectations because the negative binomial distribution allows higher variance (dispersion) than the Poisson distribution.
The findings obtained by using the INGARCH model, one of the count time series models, are given in Table 8. It was determined that the most suitable model was the negative binomial distribution with the log link function and the model contained female and male unemployment rates as the explanatory variables. When the results in Table 8 were examined, the suitability of the model compared to other models was seen once again. All variables in Model 1, which was determined to be the appropriate model, were statistically significant at the 5% significance level. According to the findings obtained from the INGARCH model, the number of femicides increased as the female unemployment rate increased and decreased as the male unemployment rate increased. In addition, it was observed that the number of femicides in the previous month had a negative effect.
Table 8.
Results of the INGARCH model
| Model 1 | Model 2 | Model 3 | Model 4 | Model 5 | Model 6 | |
|---|---|---|---|---|---|---|
| Link-Dist | log-nbinom | identity-nbinom | log-nbinom | log-poisson | identity-poisson | log-poisson |
| Coefficients | Estimate | Estimate | Estimate | Estimate | Estimate | Estimate |
| Intercept | 0.123** | 9.530** | 0.082** | 0.130** | 9.530** | 0.082** |
| beta_1 | − 0.045** | 0.372** | − 0.029** | − 0.045** | 0.372** | − 0.029** |
| alpha_1 | 0.999** | 0.262** | 0.999** | 0.999** | 0.262** | 0.999** |
| UNEMP_M | 0.019** | 0.053** | 0.015** | 0.019** | 0.053** | 0.015** |
| UNEMP_F | − 0.024** | 7.15e−06** | − 0.017** | − 0.024** | 7.15e−06** | − 0.017** |
| INFLATION | – | – | − 8.21e−05 | – | – | − 8.21e−05 |
| Sigmasq | 0.013** | 0.028** | 0.011** | – | – | – |
| Log-likelihood | − 341.452 | − 357.562 | − 339.404 | − 343.048 | −367.055 | − 340.416 |
| AIC | 692.809 | 727.125 | 694.904 | 696.096 | 744.111 | 692.833 |
| SIC | 710.940 | 743.162 | 711.518 | 709.460 | 757.475 | 708.870 |
**At the 5% significance level, the null hypothesis is rejected
The bold characters in the table indicate the appropriately selected model.
The analysis revealed that increasing the employment rate of women is a crucial factor in reducing femicide. A higher unemployment rate for men also reduces femicide. The number of femicides in the previous month leads to a decrease in the number of femicides in the current month.
The real and predicted values for femicides are illustrated in Fig. 11. As seen in the figure, the real and predicted values of the number of femicides follow the same trend. The proximity of the numbers for the real and predicted values indicates the success of using the count time series modelling.
Fig. 11.
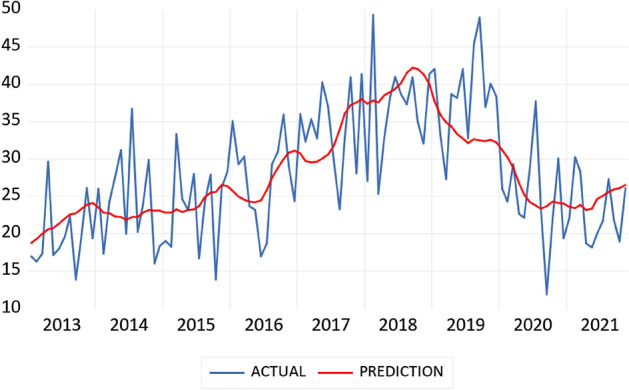
Actual and predicted values
Conclusion
Femicide is a social problem that damages the social structure and prevents human development, since it causes avoidable deaths (Murillo et al. 2018). According to the United Nations, gender equality and violence against women are one of the major obstacles to succeeding the Sustainable Development Goals for 2030.
The biggest difficulty in analyzing femicides is that the data is not collected properly and shared with transparency. This situation also created limitations for our study, so the analysis was made with independent variables at the macro level. We aimed to reveal the relationship between the number of femicides in Turkey, the female unemployment rate, the male unemployment rate, and the inflation rate in this study. For this purpose, we drew on the data for the period of January 2013 to November 2021 by using the count time series model. The findings revealed that an increase in the female unemployment rate and a decrease in the male unemployment rate both increase the number of femicides. In addition, it was observed that the number of femicides in the previous month had a negative effect on the number in the current month. There was no statistically significant relationship between the inflation rate and the number of femicides. When the obtained findings are interpreted, it becomes clear that increasing the employment rate of women, which ensures women's economic freedom, is a crucial factor in reducing femicide. The fact that men do not have economic freedom devastates the dominance of the patriarchal structure and decreases the probability of femicide. The negative coefficient of the number of femicides in the previous month suggests that drawing attention to cases of femicide through the media brings down the number of femicide in the current month.
Femicide is a violation of human rights and, unfortunately, is one of the least reported forms of crime. Women tend to fear male backlash, economic hardship, and adverse consequences for their children if they attempt to call attention to it. The success of sustainable development policies based on gender equality is possible, first of all, if women are respected within the family. For this reason, the causes of domestic violence and femicide should be examined and optimal solutions should be proposed so that women can take part in society as strong individuals.
Another avenue for preventing femicides is mapping the regions where women are killed the most. In this sense, the map will be a data-based guide that facilitates location-based thinking in studies to be carried out to prevent femicides. As a result, finding effective tools, including collecting data and legislation to avoid femicide, represents a crucial requirement for policymakers.
Acknowledgements
Not applicable
Author contributions
The collection of the data was done by AA, the analysis was made by EYK, and the remaining parts were prepared jointly. All authors read and approved the final manuscript.
Funding
Not applicable.
Data availability
The datasets used and/or analysed during the current study are available from the corresponding author on reasonable request. The female variable was created by compiling the reports on the website of We Will Stop Femicide Platform (https://kadincinayetlerinidurduracagiz.net/). The variables Unemp_f, Unemp_m, and Inflation are available on the website of Turkish Statistical Institute (http://www.turkstat.gov.tr/Start.do).
Declarations
Competing interests
The authors declare that they have no competing interests.
Footnotes
The category “other” includes family council decision, honor killing, suspicious death, making it seem like an accident, resistance to rape/violence, economic reasons, crisis and unemployment, infertility and child arguments, jealousy, rejection, theft-money-substance abuse, and saving the life of another woman.
There are also hands-on studies using versions such as seasonal ARIMA (SARIMA) model (Öncel Çekim 2018) or ARIMA with explanatory variable (ARIMAX) (Öncel Çekim and Koyuncu 2022).
See Ferland et al. (2006), Weiss (2018), Zhu (2011), Kim (2020) and Zhu (2012) for further reading.
The category other includes family council decision, honor killing, suspicious death, making it seem like an accident, resistance to rape/violence, economic reasons, crisis and unemployment, infertility and child arguments, jealousy, rejection, theft-money-substance abuse, and saving the life of another woman.
Publisher's Note
Springer Nature remains neutral with regard to jurisdictional claims in published maps and institutional affiliations.
Contributor Information
Aygül Anavatan, Email: aanavatan@pau.edu.tr.
Eda Yalçın Kayacan, Email: eyalcin@pau.edu.tr.
References
- Agüero, J. M.: Information and behavioral responses with more than one agent: the case of domestic violence awareness campaigns (No. 2019-04). In: University of Connecticut, Department of Economics (2019)
- Álvarez-Garavito C, Acosta-González HN. Femicide in latin America: an economic approach. Desarrollo y Sociedad. 2021;88:11–42. doi: 10.13043/DYS.88.1. [DOI] [Google Scholar]
- Amaral, S., Bhalotra, S., & Prakash, N.: gender, crime and punishment: evidence from women police stations in India. In: CESifo Working Papers No. 9002 (2021). 10.2139/ssrn.3827615
- Bekaroğlu C. evaluating femicide rates through hofstede cultural dimensions. Manag Polit Sci Rev. 2021;3(1):15–32. [Google Scholar]
- Box GEP, Jenkins GM. Time series analysis: forecasting and control. San Francisco: Holden-Day; 1970. [Google Scholar]
- Brown DS, Mercy JA. Methods for estimating medical expenditures attributable to intimate partner violence. J. Interpers. Violence. 2008;23(12):1747–1766. doi: 10.1007/s12445-013-0244-6. [DOI] [PubMed] [Google Scholar]
- Burbano, E.: The persistence of patriarchy in latin America: an analysis of negative and positive trends [Union College]. (2016). https://digitalworks.union.edu/theses/123
- Çiğdem, G.: The relationship between foreign exchange rate and femicide in Turkey : evidence from the cointegration tests based on nonlinear and Fourier functions. In: SciELO Preprints. (2021). 10.1590/SciELOPreprints.1669
- Colagrossi, M., Deiana, C., Dragone, D., Geraci, A., Giua, L., Iori, E.: Intimate partner violence and help-seeking: the role of femicide news. In: Quaderni - Working Paper DSE N° 1169. (2022). 10.2139/ssrn.4005008 [DOI] [PMC free article] [PubMed]
- Corry, J.: A Satirical View of London at the Commencement of the Nineteenth Century, 4th Editon. London, Robert Dutton Gracechurch Street. (1801).
- Da Silva ABR. Essays on the Econometrics of Gender, Domestic and Intimate Partner Violence. Fortaleza: Federal University of Ceara; 2018. [Google Scholar]
- Dugan L. Identifying unit-dependency and time-specificity in longitudinal analysis: a graphical methodology. J. Quant. Criminol. 2002;18(3):213–236. doi: 10.1023/A:1016033203101. [DOI] [Google Scholar]
- Durrance CP, Golden S, Perreira K, Cook P. Taxing sin and saving lives: can alcohol taxation reduce female homicides? Soc. Sci. Med. 2011;73:169–176. doi: 10.1016/j.socscimed.2011.04.027. [DOI] [PMC free article] [PubMed] [Google Scholar]
- Estévez-Soto PR. Crime and COVID-19: effect of changes in routine activities in Mexico City. Crime Sci. 2021;10(15):1–17. doi: 10.1186/s40163-021-00151-y. [DOI] [PMC free article] [PubMed] [Google Scholar]
- Ferland R, Latour A, Oraichi D. Integer-valued GARCH process. J. Time Ser. Anal. 2006;27(6):923–942. doi: 10.1111/j.1467-9892.2006.00496.x. [DOI] [Google Scholar]
- González, N., Pérez, M., & Arenas, A.: Efficiency in combating femicides in Estado de México. Revista Latinoamericana de Investigación Social. 3(3), 1–18 (2020)
- Heise LL. Violence against women: an integrated, ecological framework. Violence Against Woman. 1998;4(3):262–290. doi: 10.1177/1077801298004003002. [DOI] [PubMed] [Google Scholar]
- Hoehn-Velasco L, Silverio-Murillo A, de la Miyar JRB. The great crime recovery: crimes against women during, and after, the COVID-19 lockdown in Mexico. Econ. Hum. Biol. 2021;41: 100991 . doi: 10.1016/j.ehb.2021.100991. [DOI] [PMC free article] [PubMed] [Google Scholar]
- Kavakli KC. Women’s murders and the interaction between gender (In)equality and economic development: a subnational analysis in Turkey. J. Interpers. Violence. 2020 doi: 10.1177/0886260520967164. [DOI] [PubMed] [Google Scholar]
- Kim M. Network traffic prediction based on INGARCH model. Wirel. Netw. 2020;26:6189–6202. doi: 10.1007/s11276-020-02431-y. [DOI] [Google Scholar]
- Koç, P., & Kutlar, A.: Makroekonomik Göstergeler ve Kadın Cinayetleri Arasındaki İlişkinin Analizi: OECD Ülkeleri Üzerine Bir Araştırma. In: 3rd international baku scientific research congress, pp. 241–248 (2021)
- Liboschik T, Fokianos K, Fried R. tscount: an R package for analysis of count time series following generalized linear models. J. Stat. Softw. 2017 doi: 10.18637/jss.v082.i05. [DOI] [Google Scholar]
- Lin, M.: Risk markers of intimate assaulters on Danger assessment (DA) instrument—toward a cross-cultural understanding from Taiwan samples. Michigan State University. (2001)
- Manolakis D, Bosowski N, Ingle VK. Count time-series analysis: a signal processing perspective. IEEE Signal Process. Mag. 2019;36(3):64–81. doi: 10.1109/MSP.2018.2885853. [DOI] [Google Scholar]
- Monteiro MFG, Romio JAF, Drezett J. Is there race/color differential on femicide in Brazil? The inequality of mortality rates for violent causes among white and black women. J. Hum. Growth Dev. 2021;31(2):358–366. doi: 10.36311/jhgd.v31.12257. [DOI] [Google Scholar]
- Murillo FHS, Chica Olmo J, de Cortázar ARG. The spatial heterogeneity of factors of feminicide: the case of Antioquia-Colombia. Appl. Geogr. 2018;92:63–73. doi: 10.1016/j.apgeog.2018.01.006. [DOI] [Google Scholar]
- Öncel Çekim H, Koyuncu A. The impact of google trends on the tourist arrivals: a case of antalya tourism. Alphanumer. J. 2022;10(1):1–14. doi: 10.17093/alphanumeric.931652. [DOI] [Google Scholar]
- Öncel Çekim, H.: Examination of industry production index in Turkey with time series method. Balıkesir Üniversitesi Fen Bilimleri Enstitüsü Dergisi, 20(1), 547–554 (2018). 10.25092/baunfbed.423143
- Peñaloza AO, Bautista JP, Rodriguez DV. Contribution of municipality-level socio-economic and cultural factors on violence against women in Colombia: does geographic setting matter? Int. J. Gend. Women’s Stud. 2020;8(2):35–47. doi: 10.15640/ijgws.v8n2a5. [DOI] [Google Scholar]
- Roberts DW. Intimate partner homicide relationships: relationships to alcohol and firearms. J. Contemp. Crim. Justice. 2009;25(1):67–88. doi: 10.1177/1043986208329771. [DOI] [Google Scholar]
- Roman CG, Reid SE. Assessing the relationship between alcohol outlets and domestic violence: routine activities and the neighborhood environment. Violence Vict. 2012;27(5):811–828. doi: 10.1891/0886-6708.27.5.811. [DOI] [PubMed] [Google Scholar]
- Russell D. Rape in Marriage. New York: Macmillan; 1982. [Google Scholar]
- Srebot Roeder, C. M.: Femicide media coverage and violence reporting behavior (Master's thesis, University of San Andres, Department of Economics), Lima, Perú (2021)
- Stamatel JP. The effects of detrimental drinking patterns and drug use on female homicide victimization rates across Europe. Curr. Sociol. 2016;64(7):1090–1107. doi: 10.1177/0011392115617815. [DOI] [Google Scholar]
- The United Nations. https://www.un.org/en/ (n.d.). Accessed 21 April 2022
- Torrecilla JL, Quijano-Sanchez L, Liberatore F, López-Ossorio JJ, González-Á Lvarez JL. Correction: evolution and study of a copycat effect in intimate partner homicides: a lesson from Spanish femicides. PLoS One. 2019;14:6. doi: 10.1371/journal.pone.0217914. [DOI] [PMC free article] [PubMed] [Google Scholar]
- Turkish Statistical Institute (TurkStat). http://www.turkstat.gov.tr/Start.do. (n.d.) Accepted 14 April 2022
- UNODC. Global Study on Homicide Report. (2019) https://www.unodc.org/documents/data-and-analysis/gsh/Booklet1.pdf
- Valdivia M, Castro R. Gender bias in the convergence dynamics of the regional homicide rates in Mexico. Appl. Geogr. 2013;45:280–291. doi: 10.1016/j.apgeog.2013.09.015. [DOI] [Google Scholar]
- Vieira, A. B.: Modeling time series of counts : an application to basketball analytics. Instituto Superior Tecnico, Lisboa, Portugal. (2019a)
- Vieira, A. B.: (2019b). Modeling time series of counts : an application to basketball analytics. https://fenix.tecnico.ulisboa.pt/downloadFile/281870113704928/Resumo_AlargadoFinal.pdf
- We Will Stop Femicide Platform. https://kadincinayetlerinidurduracagiz.net/ (n.d.). Accesssed 14 April 2022
- Weiss CH. An Introduction to Discrete-Valued Time Series. New York: John Wiley & Sons; 2018. [Google Scholar]
- World Health Organization.: Understanding and addressing violence against women: femicide. (2012)
- Zeoli AM, Webster DW. Effects of domestic violence policies, alcohol taxes and police staffing levels on intimate partner homicide in large US cities. Inj. Prev. 2010;16(2):90–95. doi: 10.1136/ip.2009.024620. [DOI] [PMC free article] [PubMed] [Google Scholar]
- Zhu F. A negative binomial integer-valued GARCH model. J. Time Ser. Anal. 2011;32:54–67. doi: 10.1111/j.1467-9892.2010.00684.x. [DOI] [Google Scholar]
- Zhu F. Modeling time series of counts with COM-Poisson INGARCH models. Math. Comput. Model. 2012;56(9–10):191–203. doi: 10.1016/j.mcm.2011.11.069. [DOI] [Google Scholar]
Associated Data
This section collects any data citations, data availability statements, or supplementary materials included in this article.
Data Availability Statement
The datasets used and/or analysed during the current study are available from the corresponding author on reasonable request. The female variable was created by compiling the reports on the website of We Will Stop Femicide Platform (https://kadincinayetlerinidurduracagiz.net/). The variables Unemp_f, Unemp_m, and Inflation are available on the website of Turkish Statistical Institute (http://www.turkstat.gov.tr/Start.do).


