

Abstract
Predictive modeling of neuroimaging data (predictive neuroimaging) for evaluating individual differences in various behavioral phenotypes and clinical outcomes is of growing interest. However, the field is experiencing challenges regarding the interpretability of the results. Approaches to defining the specific contribution of functional connections, regions, or networks in prediction models are urgently needed, which may help explore the underlying mechanisms. In this article, we systematically review the methods and applications for interpreting brain signatures derived from predictive neuroimaging based on a survey of 326 research articles. Strengths, limitations, and the suitable conditions for major interpretation strategies are also deliberated. In-depth discussion of common issues in existing literature and the corresponding recommendations to address these pitfalls are provided. We highly recommend exhaustive validation on the reliability and interpretability of the biomarkers across multiple datasets and contexts, which thereby could translate technical advances in neuroimaging into concrete improvements in precision medicine.
Introduction
The past few decades have witnessed significant improvements toward a cumulative understanding of neural mechanisms underlying high-order cognitive functioning [1], by investigating how these constructs map to the brain [2] or are impaired in complex brain disorders. These advances have led to compelling insights into human brain function. Specifically, research paradigm shift from group-level inference to individual-level prediction is exceedingly impressive, with analytical tools transferring from mass-univariate correlation to multivariate data mining in parallel [3].
Tremendous effort has been devoted to predicting individual differences on a continuum for both health and disease using regression-based predictive modeling approaches (hereafter referred to as predictive neuroimaging), in an extensive battery of behavioral phenotypes [4, 5], or clinical outcomes [6, 7]. Nevertheless, the field is experiencing immense challenges in translating neuroimaging findings into concrete improvements in real-world settings [8]. One of the key factors that may lead to the translational failure is the low or fair interpretability of prediction models, where interpretability means identifying the unique contribution of individual brain features to the models decoding predictions, thereby hoping to identify the underlying neuro-substrates of the decoded target variable [9]. Although interpretability has attracted substantial attention from other research fields, it is often an overlooked issue in predictive neuroimaging, compared to classification or diagnosis [9–11] in many of research hotspots based on deep learning models [12–16]. Few previous studies have provided a systematical review summarizing the strategies and recommendations for interpreting regression-based predictive neuroimaging markers. Therefore, we provide a detailed review of approaches and applications for interpreting brain signatures here, and more importantly, offer a guideline on how to use them in predictive neuroimaging.
Our primary focus is connectome-based prediction, due to its ability to leverage functionally coherent but spatially distributed whole-brain patterns [17] and to yield more reproducible biomarkers [18]. We first outline multiple essential aspects that distinguish predictive neuroimaging from traditional brain mapping studies. Then, based on 326 research studies, we systematically summarize methodological solutions to interrogating predictor contribution, discuss the strengths and limitations for each of them, and provide recommendations and cautions against scenarios that may potentially result in bias and misleading findings when interpreting brain findings. Moreover, in an experimental analysis, we compared these interpretation approaches by applying each representative method to the same data. Finally, some encouraging and challenging directions were presented, which show promise to make the black-box transparent of this active field.
Common issues in current neuroimaging study
Group mean vs individual differences
For over two decades, neuroimaging research has predominately focused on revealing group differences. However, focusing on group effects may ignore the rich information that makes an individual unique, and obscure true neural signal. Specifically, voxels showing large variations across individuals do not necessarily correspond well to those showing large mean activation [19] (Figure 1a, Supplementary File S1), implying that brain regions with weak average activation may also carry valuable, individualized information. In contrast, predictive neuroimaging emphasizes both intra- and inter-subject variabilities. For example, functional connectivity can serve as a unique and reliable fingerprint distinguishing oneself from others [18] and is capable of predicting individual cognitive abilities or specific symptoms [5, 20]. Convergent evidence suggests that the inter-subject variability in multimodal brain measurements shapes the substantial variance in human behavior [3, 21, 22].
Figure 1. Key aspects distinguishing predictive neuroimaging from traditional brain mapping studies.
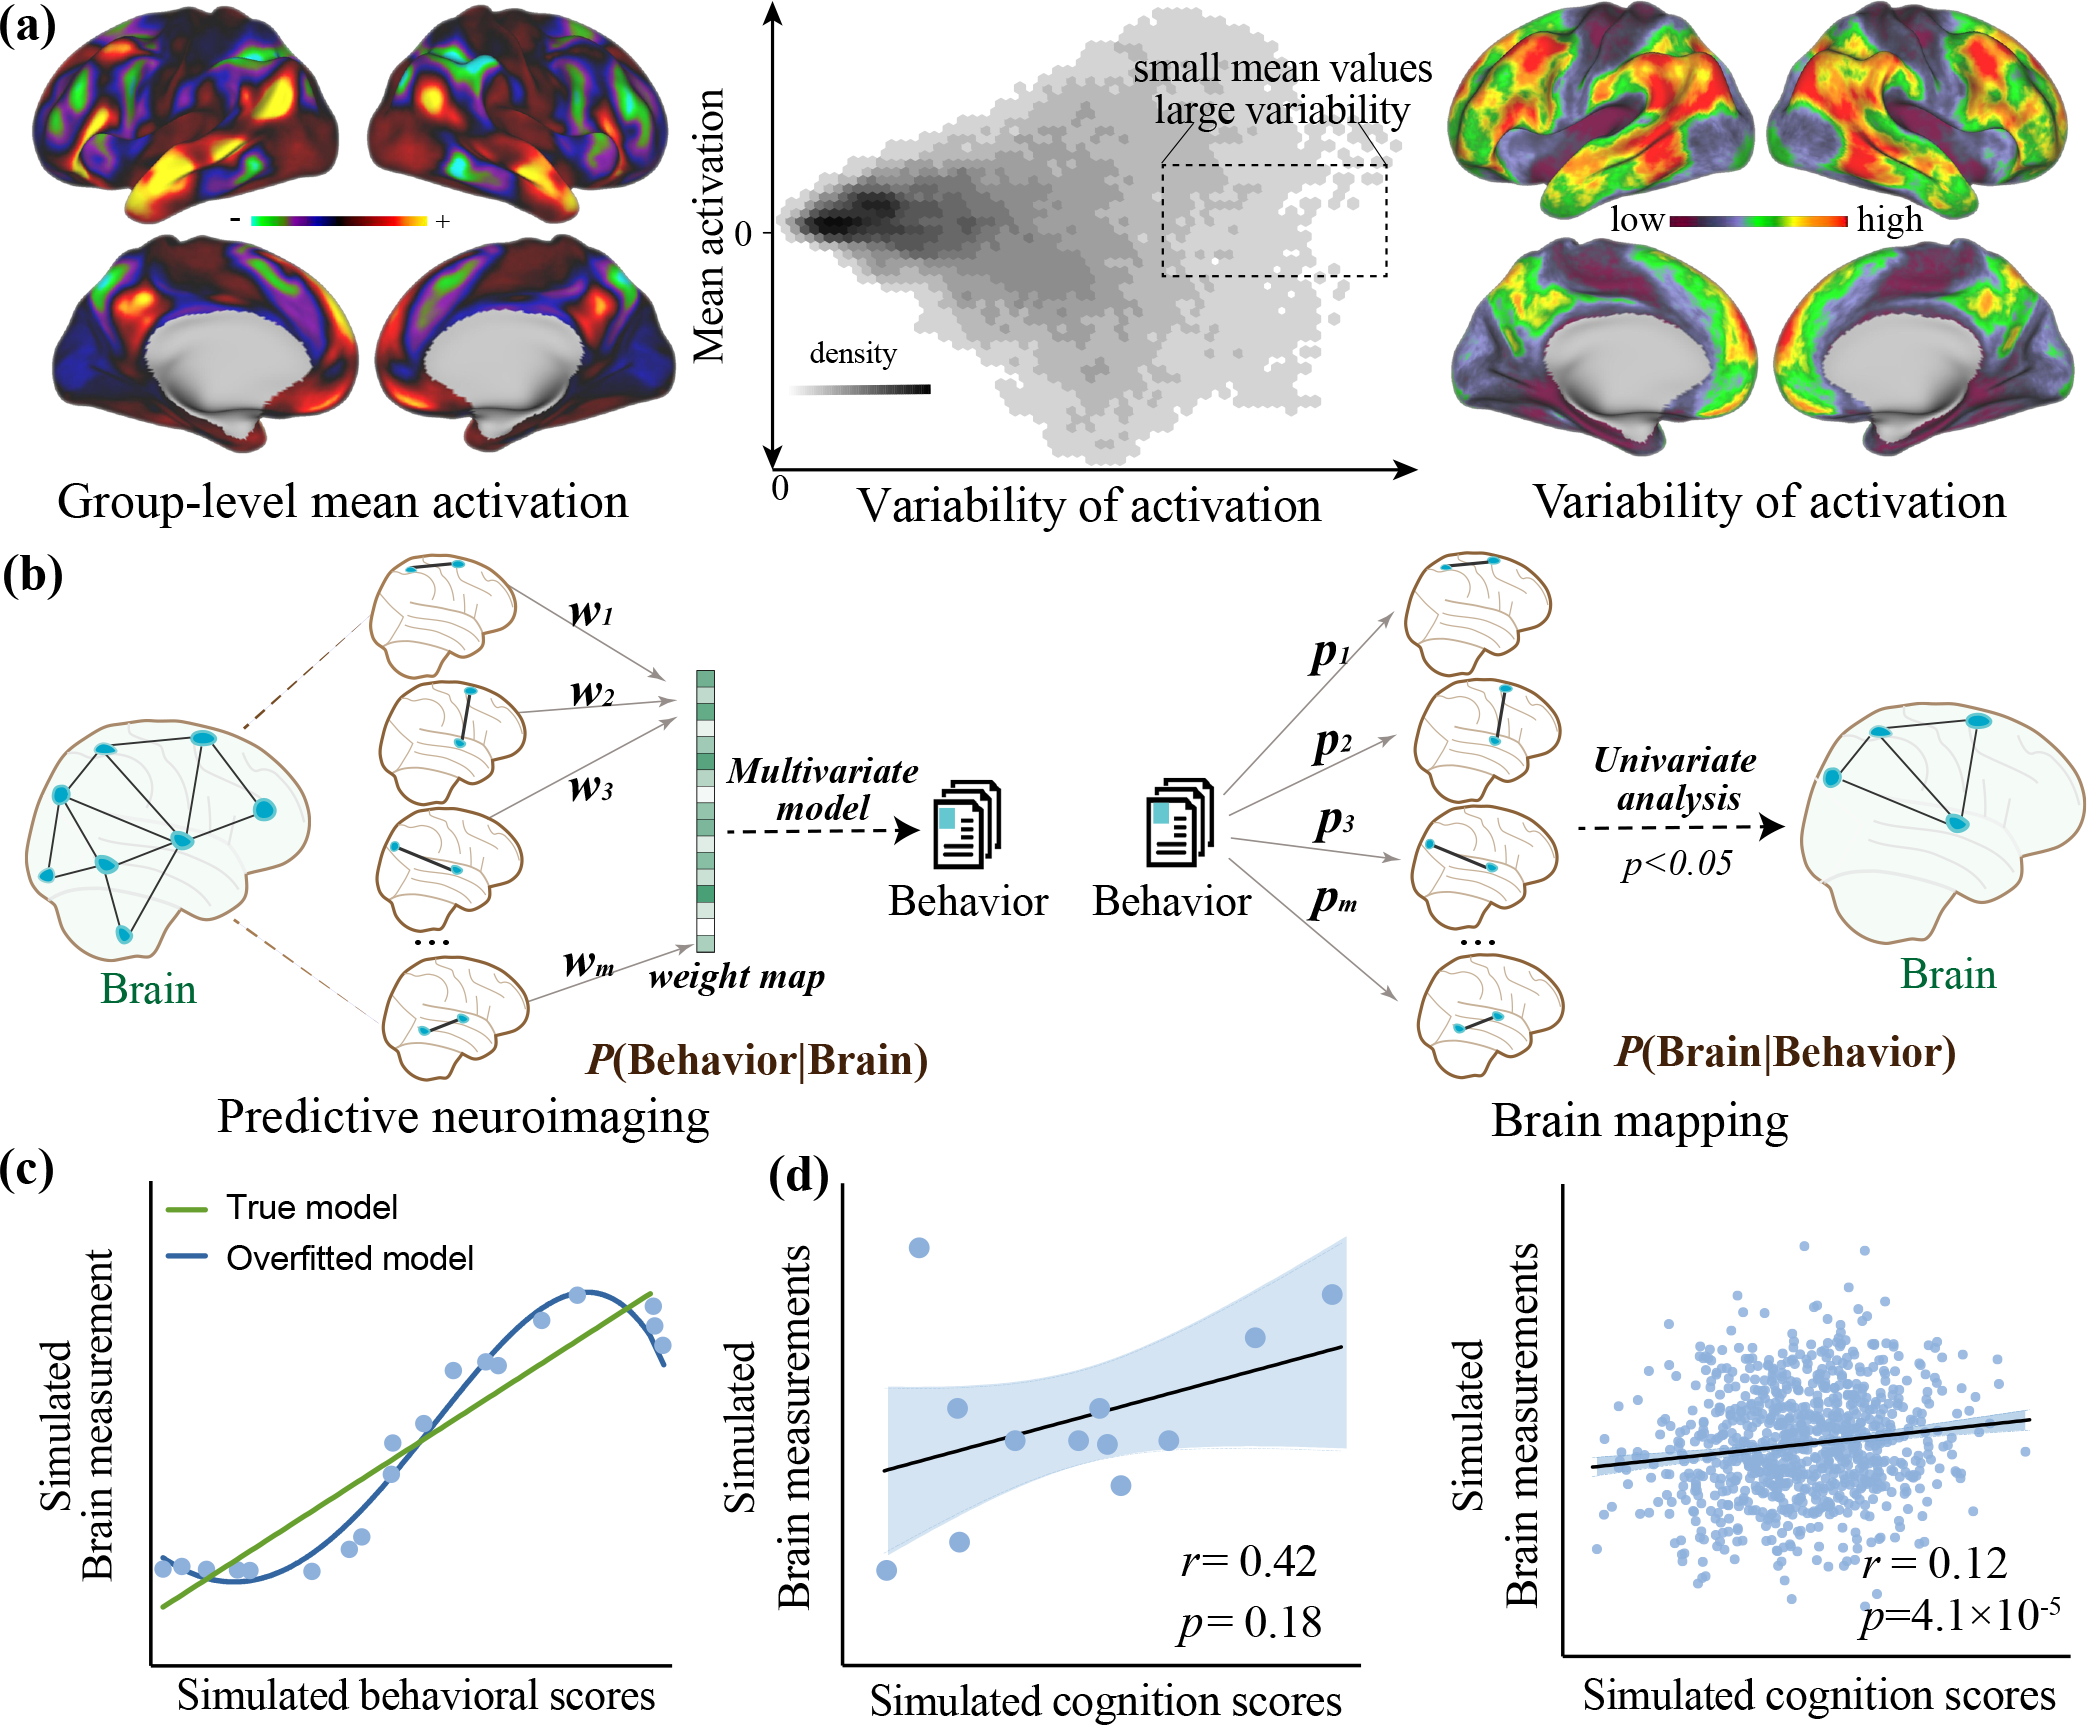
(a) The abundance of information is encoded in individual differences in brain measurements. Voxels showing large variations across individuals do not necessarily correspond well to those showing large mean activation (for example, voxels in the box have a small mean activation but large variations). Data in this plot is from the publicly available Human Connectome Project (HCP) dataset. Top left: the average whole-brain activation across 922 subjects performing language task. Top right: the corresponding variability in voxel activation across 922 subjects. Top center: Scatter plot showing the correlation between averaged activation and the variability. (b) Conventional brain mapping focuses on making inference about which brain regions are involved in the manipulated mental process; Predictive neuroimaging makes an inference about how well the behavioral outcomes, can be forecast from measured brain features. (c) Evaluating models based on “goodness of fit” to the entire dataset is in danger of being affected by overfitting. (d) When samples size is small, the correlational results are sensitive to outliers. Correlational analysis in large samples can generate associations with extremely small p-values but tiny effect sizes. Please note that plots in c, and d are generated using toy data, and thus are provided for illustrative purposes only.
Inference vs prediction
Conventional brain mapping investigations usually aim at making inferences about which brain regions are involved in the manipulated mental process by assessing the probability of P(brain|behavior) [20]. In this framework, the behavioral outcomes are independent variables and neural measures are dependent variables (Figure 1b). Predictive neuroimaging is instead focusing on evaluating how well the behavioral outcomes can be predicted from measured brain features, i.e., P(behavior|brain). Traditional analyses are often evaluated based on ‘goodness of fit’ to the entire dataset, which increases the likelihood of overfitting [23] (Figure 1c). Moreover, they have a heavy reliance on in-sample population inference, leaving the generalizability of established relationship to out-of-sample data largely unknown. In contrast, predictive neuroimaging employs cross-validation to mitigate overfitting, and increases the likelihood that the established relationship will hold in independent data, offering more translational implications [24].
Furthermore, the emphasis of correlational study is on examining whether the association reaches significance beyond the chance level, and whether the direction of effect matches existing evidence [25]. However, a statistically significant in-sample correlation is descriptive and may be insufficient to guarantee robust and useful generalization [26]. When sample size is small, the correlational results are sensitive to outliers; whereas working with very large datasets can also lead to serious problems [1], e.g., generating extremely small p-values but with tiny effect sizes (Figure 1d). In comparison, predictive neuroimaging quantitatively predicts the value of a continuously behavioral dimension, which is able to better characterize the full range of target metrics [27]. Being trained within a cross-validation framework, models built using predictive neuroimaging can be directly applied to brain features from out-of-sample individuals, enabling the model to generalize to more accurately predict behavioral scores.
Univariate analysis vs multivariate integrated model
Brain mapping studies typically analyze brain-behavior associations across a myriad of isolated brain features (i.e., voxels or regions) in parallel [28]. Performing massive statistical comparisons can increase false positives. In addition, a correction for multiple tests can in turn lead to false negatives when the feature dimension is much larger than the sample size [20].
Another issue is that univariate analysis focuses on information from circumscribed voxels or brain regions. However, decades of research has shown that there exists an intricate interplay among distinct brain regions, and the generation of mental traits is not constrained to any a priori region but engages multiple interacting systems spanning across the whole brain [29]. Consequently, many behavioral constructs can’t be decoded from isolated brain regions. A predictive neuroimaging approach can tap into the rich multimodal information by jointly combining individual features that have selective relationships with the target outcome within an integrated model [30].
Why interpretability is an overlooked ingredient in predictive neuroimaging
Although the specific implementations vary across studies, the workflow for predictive neuroimaging analyses generally includes similar steps [24] (Supplementary File S2). The interpretability step, however, has received much less attention in predictive neuroimaging. One potential reason is that the neuroimaging community tends to reward higher prediction performance over neurobiologically meaningful interpretation. Specifically, existing studies often incorporate prediction accuracy as the gold standard to evaluate model quality, no matter whether the research objective is to develop novel algorithms or to determine the involved neural circuits [9]. Another reason is that many researchers in predictive neuroimaging are not domain experts in neuroscience, but experts in machine learning, and thus they are more enthusiastic about and better at developing effective models than interpreting the results.
However, in addition to pursuing higher predictive performance, determining which specific connections, regions, or functional networks contribute to the prediction may significantly advance our knowledge of how the brain implements cognition; and more importantly, facilitate the translation of neuroimaging findings into clinical practice [20, 31]. Moreover, machine learning methods tend to be treated as a black-box, which results in focusing on the highest-possible predictive performance rather than mechanism understanding [2]. This may lead to the current dilemma that researchers treat interpretation as a secondary goal, e.g., explaining feature importance in their own way and attempting to link with neurobiological significance in a relatively shallow manner without taking full advantage of interpretable models. In this regard, the arbitrary interpretation of models may be hard to reveal the neural underpinnings of behavioral traits [9].
Approaches to build interpretable models in predictive neuroimaging
As listed in Table 1, we systematically describe three most popular interpretation strategies in the context of regression-based predictive neuroimaging by reviewing 326 relevant articles published since 2010 via keyword searching from Google Scholar and PubMed [5]. The searching strategy was provided in supplementary file. Key points such as interpretation method, imaging modality, sample size, prediction algorithm, and validation strategy are listed in supplementary Table S1 and Figure S1. Moreover, to better demonstrate the utility of the interpretation strategies, we constructed predictive models for working memory performance based on HCP activation maps and extracted the most predictive features using each of the three interpretation strategies (Figure 2, details can be found in Supplementary File S3).
Table 1.
Summary of interpretability approaches in predictive neuroimaging
| Interpretability approach | Description | Cautions and Recommendations | Ref |
|---|---|---|---|
| Beta weight-based metrics | Using regression coefficients as representative of individual feature importance. | • Input features should be scaled in a standardized manner. • Techniques should be adopted to alleviate multicollinearity among neuroimaging features (e.g., relative importance analysis). • Using averaged beta weight across multiple repetitions of cross validation to enhance interpretability. • Reporting the reliability of beta weights across different cross-validation folds to provide an overall measure of stability. |
[34, 39–42, 45, 69] |
| Stability-based metrics | Determining feature contribution by counting the number of occurrences over multiple different prediction models built on cross-validation or resampling data regardless of the magnitude of regression coefficients. | • Additional thresholding technique is required to retain the most predictive ones when there are a vast number of candidate features. • It is recommended to demonstrate consensus features for interpretation, which are defined as those with an occurrence rate of 100%. • Combining beta weights-based and stability-based quantification metrics together can gain a better interpretability. |
[4, 29, 50, 52, 63, 70] |
| Prediction performance-based metrics | Evaluating feature importance by examining whether certain brain regions individually carry more predictive information than others (specificity analysis), or to what extent excluding certain features degrades the overall performance (virtual lesion analysis). | • Before concluding the unique contribution of any single network, it is necessary to test against null models to examine the possibility of whether network size influences the prediction accuracy more than the network identity. • Specificity analysis or virtual lesion analysis relates to increased computational loads. • The unique predictive power of individual network may have a high reliance on the parcellation scheme of the brain space. |
[4, 18, 33, 51, 57–59, 61] |
Figure 2. Comparison of interpretation approaches by applying each representative method to the same data.
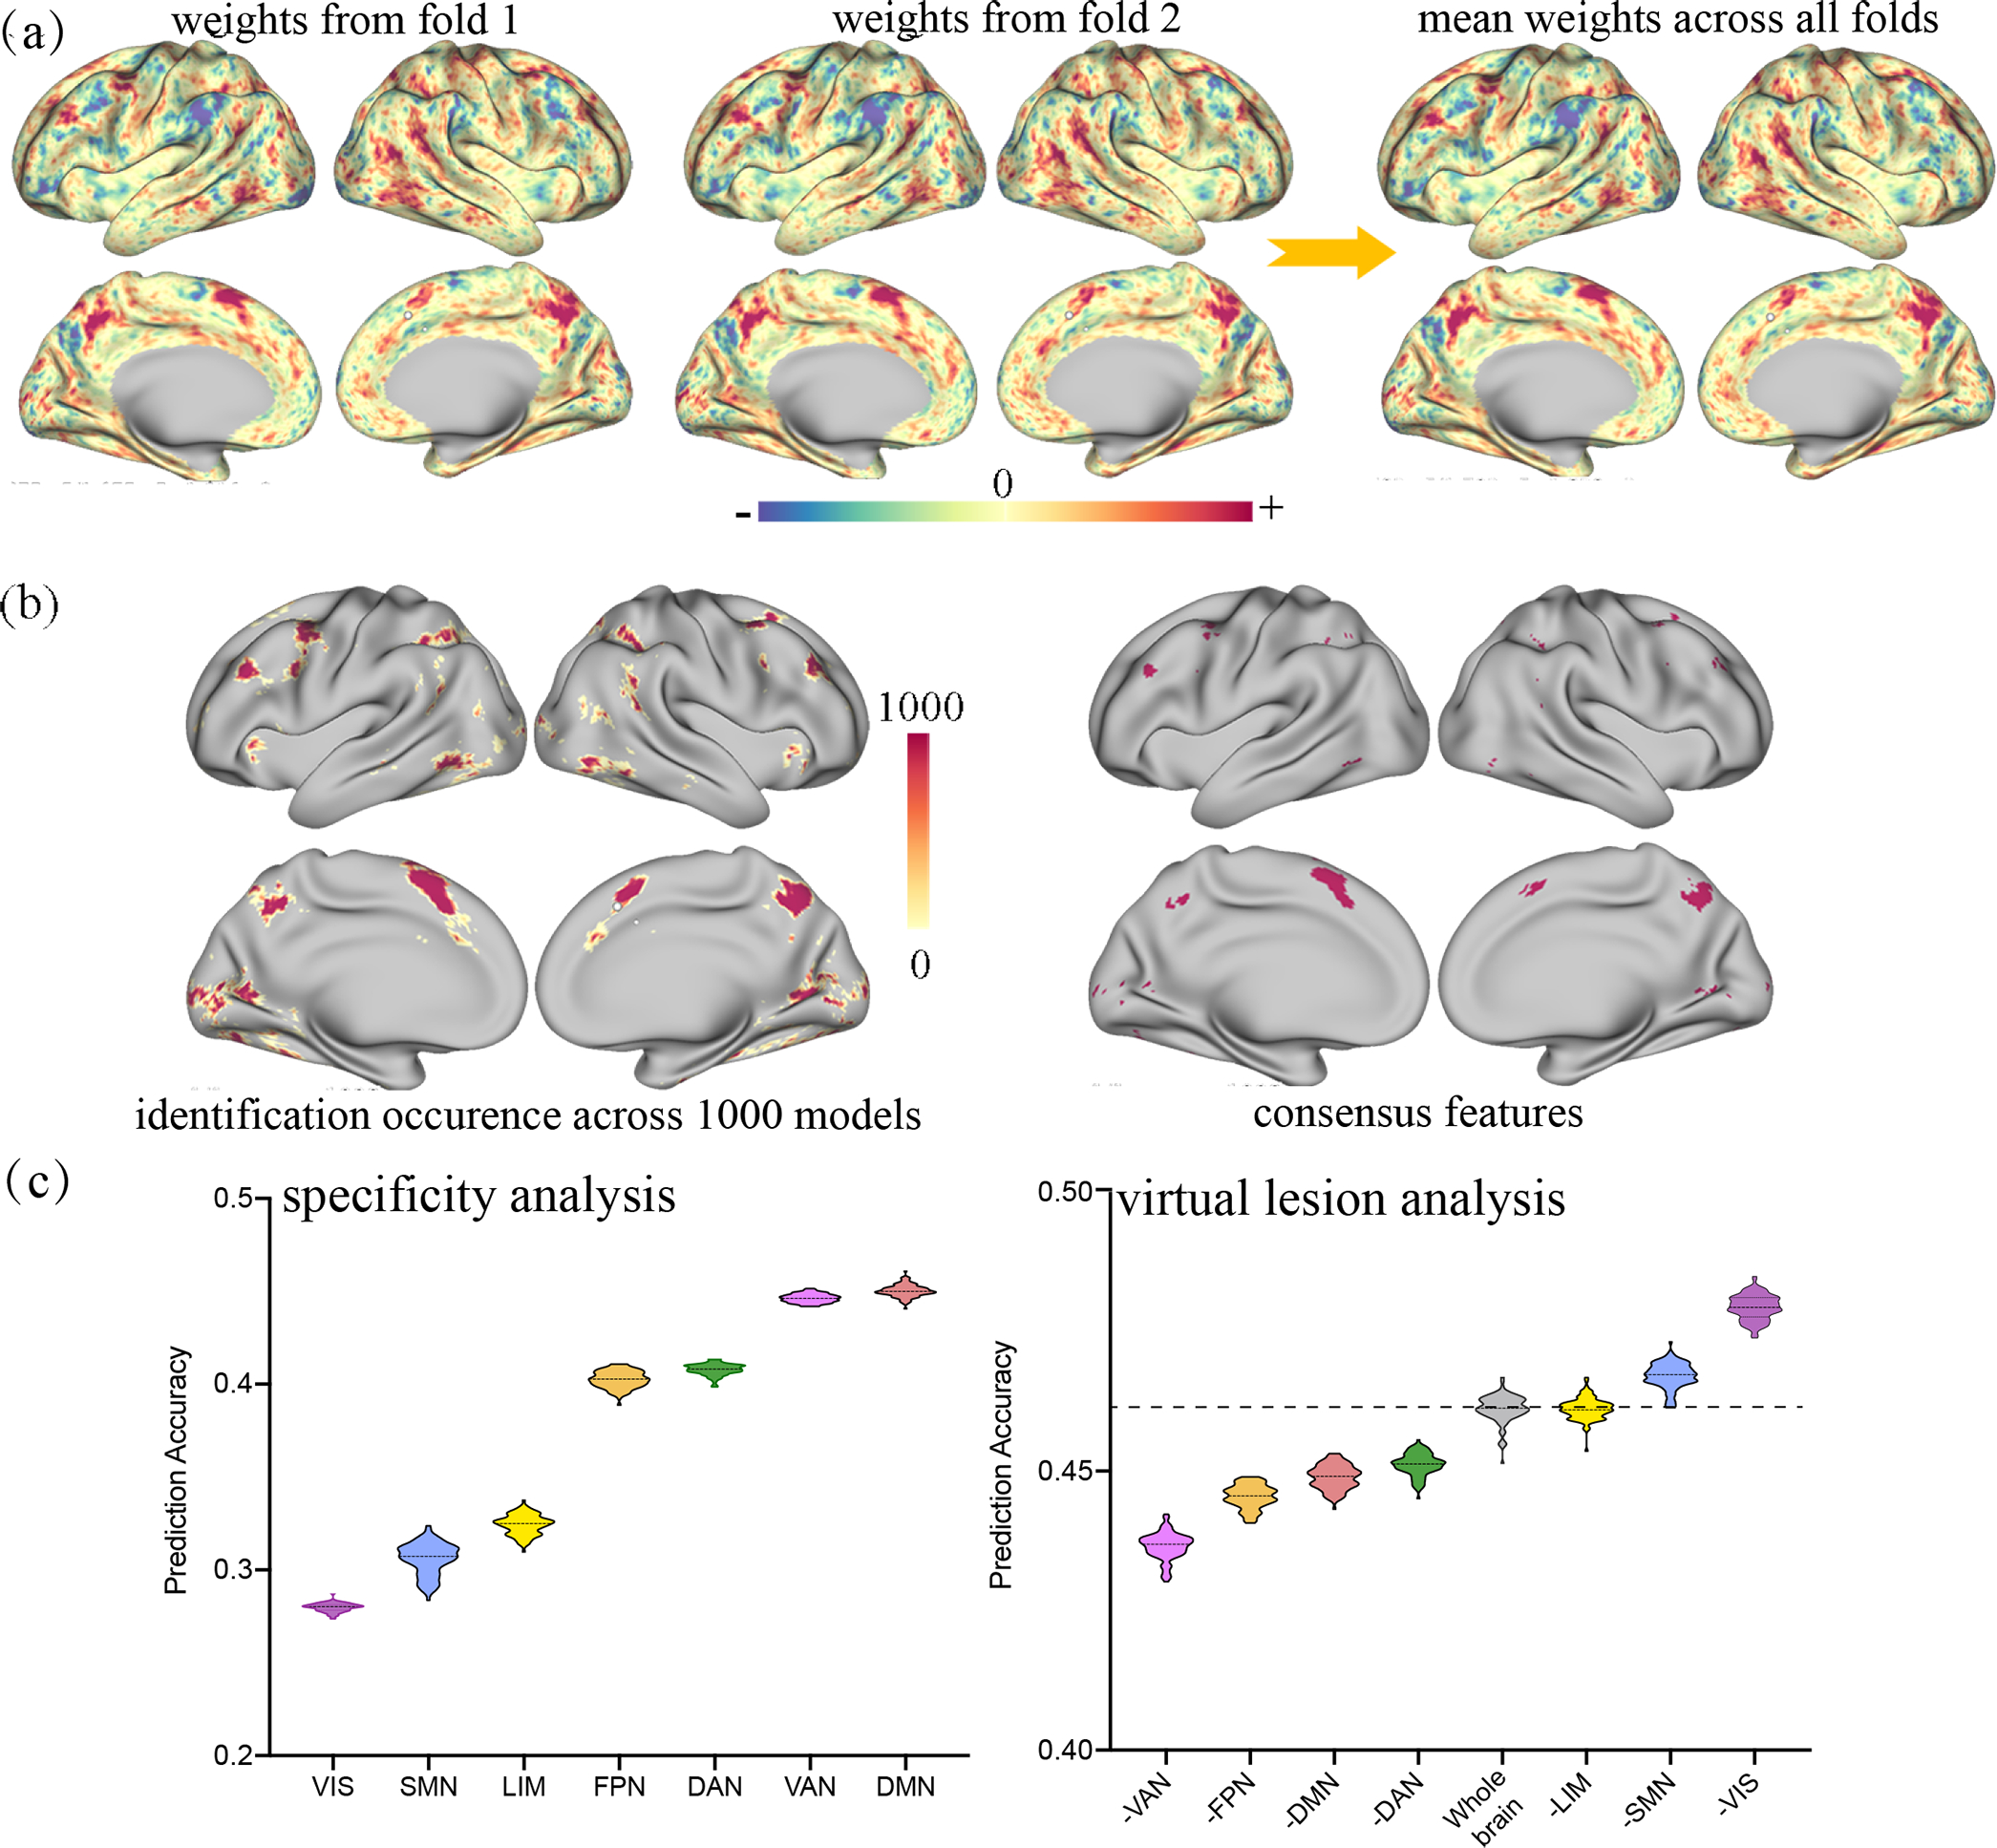
Leveraging whole-brain activation maps from the 2-back condition of working memory task in HCP, we constructed predictive models for working memory performance and extracted the most predictive features on the basis of each of the three interpretation strategies. (a) Beta-weights for whole-brain features derived from two example cross-validation loops and the mean beta-weights averaged across all models. (b) Across 100 rounds of 10-fold cross-validation, a total of 6063 distinct voxels appeared in all predictive models, while the consensus features comprised 614 voxels, representing approximately 1.0% of the brain’s total voxels. (c) In specificity analysis, the ventral attention and default mode networks emerged as the top two most predictive networks. In virtual lesion analysis, the ventral attention and frontoparietal networks degraded the prediction performance the most upon removal, reflecting their great contribution in prediction. Although these interpretation strategies vary in multiple aspects, predictive biomarkers derived from different quantification approaches are more likely to be consistent with each other when the model is reliable enough. More details can be found in Supplementary File S3. DAN, dorsal attention network; DMN, default mode network; FPN, frontoparietal network; LIM, limbic network; SMN, somatomotor network; VAN, ventral attention network; VIS, visual network.
Beta weights-based quantification metrics
The simplest way to determine feature importance from a regression model is to extract the beta weight from each standardized predictor. This mathematically assigns the expected credit each predictor receives in predicting the outcome variable given a one unit change in it while holding the other independent variables constant [32]. Consequently, it is reasonable to assume that predictors with larger beta weights have greater contributions. A crucial consideration in using such a quantification method is that prediction models are frequently placed within a cross-validation framework, which means that the identified predictive features and their beta weights may vary across folds. To cope with this problem, researchers favor the practice of computing an overall mean contribution for each predictor [33] or using the full data to train the final model and extracting the beta weights. For example, in predicting brain maturity and executive functions, Cui et al. [34] applied a 2-fold cross-validation with 100 repetitions, and summarized the feature contribution by averaging beta weights from all 200 prediction models (Figure 3a). In our example data, the mean weight map was highly similar to that from each cross-validation loop but with a relative low variability due to the effect of averaging (Figure 2a).
Figure 3. Approaches to build interpretable models in predictive neuroimaging.
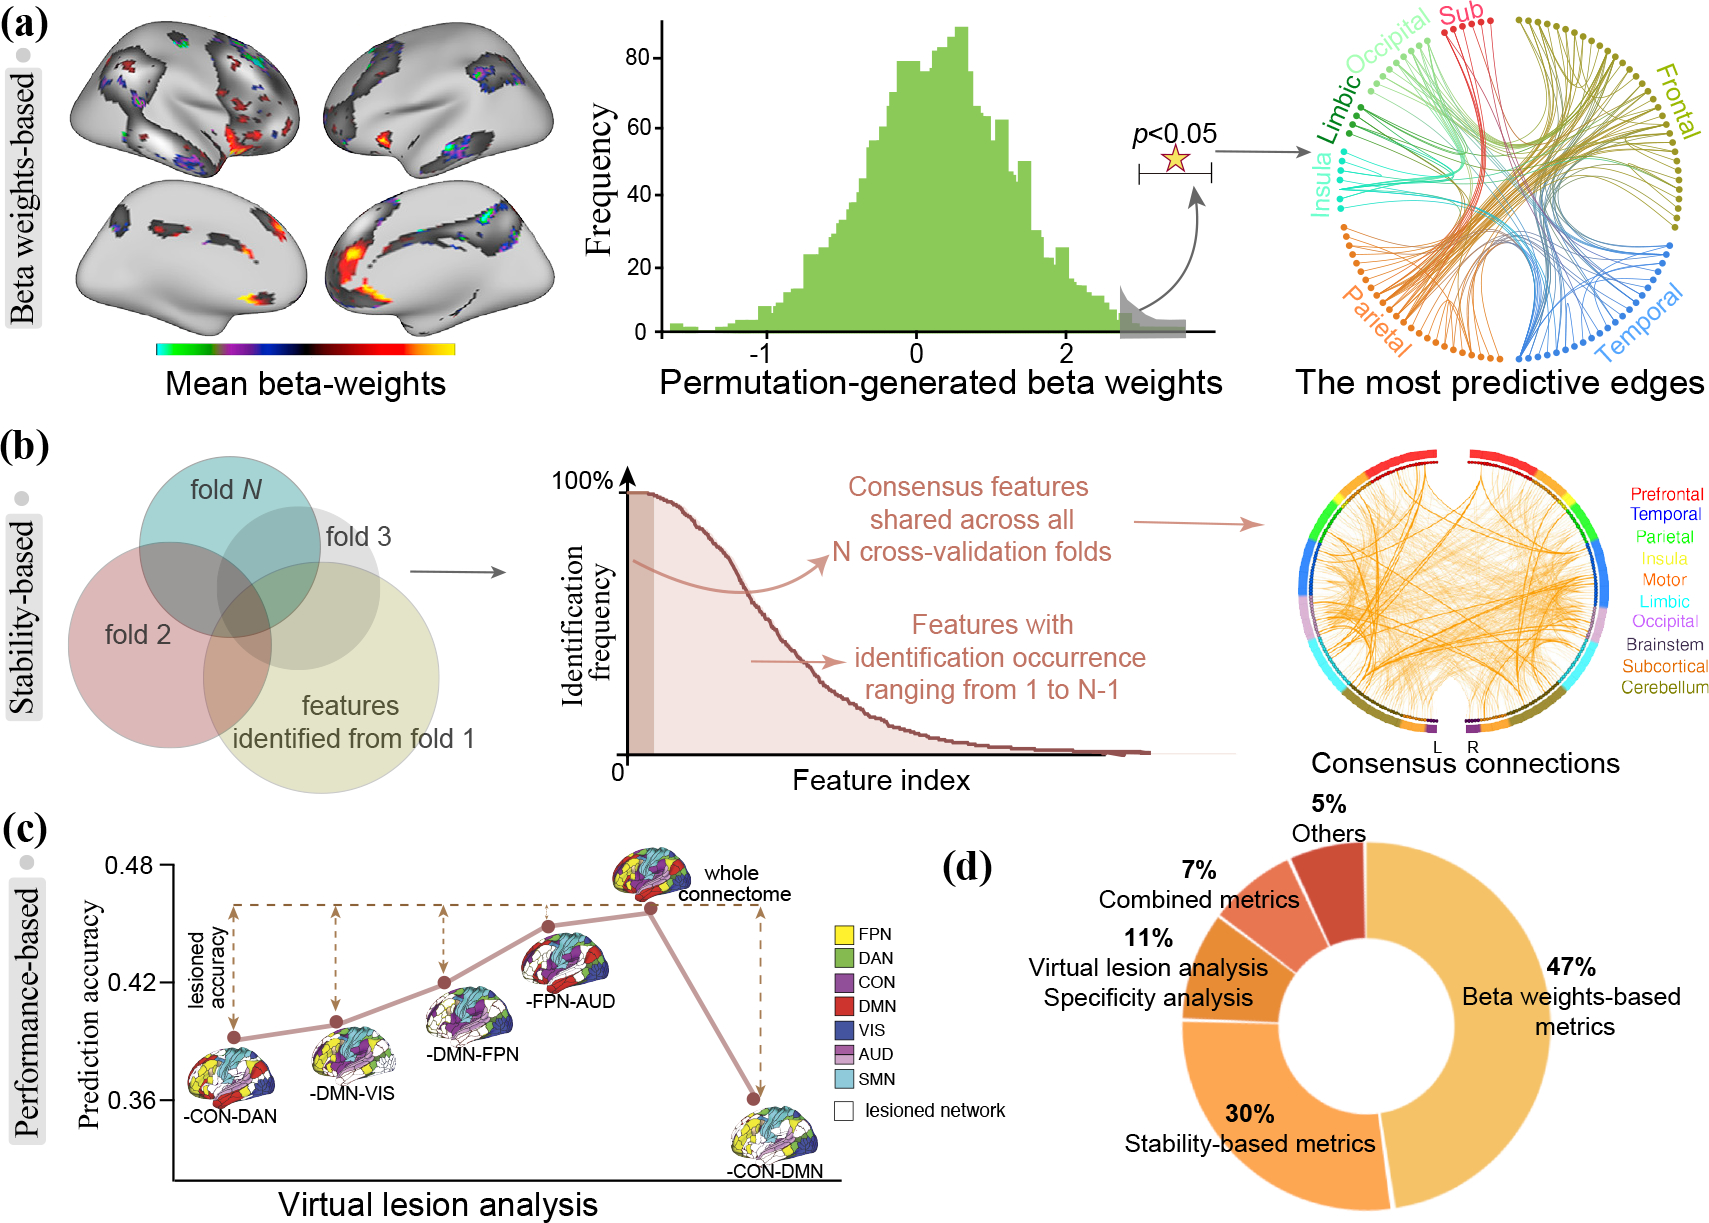
(a) Left: Cui et al. summarized the feature contribution by averaging beta weights from all repeated cross-validation models. Right: Jiang et al. adopted permutation test to assess the statistical significance of beta-weight for each feature. The most strongly predictive features were defined as those whose true β value significantly differs from the permutation-derived βperm. (b) In predicting attention performance, Rosenberg et al. counted the number of occurrences each feature was selected across N cross-validation loops, and finally identified 757 consensus features with an occurrence rate of 100%. (c) Using virtual lesion analysis, Dubois et al. iteratively removed features from between any two functional networks from the whole-brain connectome and reran the predictive framework to isolate each network-pair’s contribution to prediction. (d) The proportion of each interpretation strategy accounts for among all reviewed articles. (Adapted and modified from [4, 34, 42, 59])
Although this approach is widely used, overreliance on beta weights can suffer from serious limitations. On one hand, equating large weights with greater importance may fail for nonlinear models [10]. On the other hand, this quantification strategy is only applicable in situations where there exists no strong correlation among predictors. However, neuroimaging features can be highly inter-correlated, resulting in a statistical phenomenon called multicollinearity [35]. In this case, beta weights are heavily influenced by covariance among predictors, and the squared coefficients do not naturally decompose overall prediction R2 (variance explained). Importantly, in the context of multivariate classifiers, Haufe et al. implied that interpreting model weights (filters) as activation patterns (truth) can lead to erroneous conclusions, unless the individual features were uncorrelated [10]. This study proposed a framework for interpreting linear multivariate models by considering covariance structure and demonstrated its effectiveness in both simulation and real fMRI and electroencephalography data.
Multicollinearity may yield unstable regression coefficients, and sometimes even a minor change in covariance structure would dramatically change the beta weights, complicating the feature interpretation [36]. Fortunately, four different kinds of approaches can be adopted to alleviate this problem. The first one is employing prediction methods having good resilience to multicollinearity data, such as LASSO and ridge regression. These methods still work well when the data have much more features than instances. Specifically, ridge regression deals with multicollinearity by assigning similar coefficients to correlated features but may come at the cost of increased model complexity [37]. LASSO arbitrarily retains a representative predictor from a group of correlated ones and drops the others to avoid multicollinearity [38]. A prominent problem is that it can lead to the exclusion of some important features. Practically, researchers often incorporate both model-selected features and their tightly correlated ones to make interpretations [39, 40].
The second approach is to project neuroimaging features into a small set of separable (i.e., orthogonal or independent) latent components using dimensionality reduction techniques, and then feed them into a prediction model. Since the predictors are uncorrelated, variable importance can be determined by directly inspecting the derived beta weights. A classic example is the recently proposed prediction model ‘Brain Basis Set’ (BBS) [41], which transforms high-dimensional functional connections into a small suite of latent components using principal component analysis (PCA), and then fits a multiple linear regression model to predict neurocognitive scores using expression scores of these components. Accordingly, feature importance is determined by multiplying feature component map with their respective beta coefficients from the prediction model. This method is strongly recommended when there is a need to visualize the contribution of all features that are highly correlated. A potential problem is that the optimal number of latent components needs to be determined by additional experiments.
The third approach does not use the original beta weight values, but instead performs permutation tests to assess the statistical significance [42, 43]. For example, in a recent fMRI study using partial least square regression to predict reading comprehension abilities [42], after extracting the regression coefficients β, permutation test was employed to create a null weight distribution βperm for each feature. The most strongly predictive features were then determined as those whose β value significantly differs from the empirical distribution βperm obtained from 10,000 permutations (Figure 3a). A prominent strength of this approach is that it provides the statistical significance of individual features. However, it is computationally intensive, since a massive number of permutation tests need to be performed.
The fourth approach, named relative importance analysis, is capable of decomposing overall R2 into non-negative contributions [44]. This post-hoc approach has the advantage of not changing any of the feature selection or model building process but applying mathematical techniques to control for multicollinearity. This means that the quantification of feature importance is independent of model construction, and consequently we can separately achieve model interpretation and model building. Importantly, this approach suits for multicollinear data. In a recent study based on UK biobank data, [45], the CAR (correlation-adjusted marginal correlation) score was adopted to assist interpretation, which used Mahalanobis-decorrelation to adjust the multicollinearity among explanatory variables [46]. Detailed implementations of such relative importance metrics can be found in a series of R packages like relaimpo, hier.part and care [36, 46, 47].
Stability-based quantification metrics
Stability-based quantification metrics count the number of occurrences for a given predictor over multiple different prediction models built on cross-validation or resampling data, regardless of the magnitude of regression coefficients. A significant strength of this approach is the reduced sensitivity to multicollinearity and applicability even to nonlinear models. For example, Liu et al. predicted the fluid intelligence and cognitive flexibility scores based on functional connectivity for a sample of 105 healthy participants within a leave-one-out cross-validation framework [48]. To quantify feature contribution, this study counted the number of times each functional connectivity was selected across all 105 folds. Another study leveraged bootstrapping strategy to build a total of 100 predictive models based on resampled data, and features exceeding a frequency percentage of 70% were determined as the most predictive ones [49]. The stability-based quantification metrics are often adopted by predictive frameworks that incorporates a built-in (e.g., LASSO) or separate feature selection step to achieve dimension reduction and are not applicable to frameworks that include all available features into the final models.
One limitation is that it may lead to the inclusion of a large number of candidate features, and thereby requiring additional thresholding to select the most predictive ones. A conservative solution is to only use consensus features for interpretation, which are defined as those with an identification rate of 100%, i.e., they are shared across every iteration of cross-validation [50, 51] (Figure 3b). Features in the consensus set are considered to have equal contributions to prediction and should be interpreted as a whole. This compact set of features have the highest stability and a reduced susceptibility to potential confounds [27]. Establishing models using these parsimonious set of features has been demonstrated to afford a robust generalizability across multiple independent datasets [4, 29, 52]. Therefore, this interpretation approach is best used when there is a need to characterize a complex behavioral trait with a condensed set of brain signatures, and more importantly use them to establish reliable and generalizable predictive models. This is especially helpful for neuroimaging data that only include a small number of subjects, because quantifying feature importance using the consensus features is attached to a high reliability and generalizability. However, when prediction models significantly differ across distinct cross-validation loops, there may be little overlap among the identified features, resulting in few and even no consensus features [53]. Another limitation is that reducing any complex behavioral trait to a handful of brain features risks oversimplification [4, 54], and thus may miss information crucial for understanding the underlying mechanisms, rendering the biological interpretability difficult. As shown in Figure 2b, a total of 6063 distinct voxels appeared in all predictive models with identification occurrence ranging from 1 to 1000. The consensus features only comprised 614 voxels, representing approximately 1.0% of the brain’s total voxels. These 614 features were assumed to have the greatest contribution to prediction because they were repeatedly identified by all 1000 distinct models. However, such complex and multifactorial phenotype (working memory) is unlikely to be driven by this small set of voxels, therefore interpreting using only consensus features may risk oversimplification.
Another genre of studies builds an overall predictive model on all subjects with the algorithm parameters determined through cross-validation [55, 56], and then extracts all features from the fitted model for further interpretation and visualization. Despite reduced computational cost, this method is inherently explanatory and should only be used for preliminary interpretation due to an increased likelihood of overfitting [56]. However, when the validity of these identified brain signatures is verified by multiple external datasets, interpreting predictive models using this approach is highly recommended.
Moreover, beta weights-based and stability-based quantification metrics can be combined together to obtain better interpretation, especially when the employed predictive framework retains all features in the final model but there is a need to only demonstrate a small number of the most predictive ones. Particularly, to extract the most predictive functional connections of brain maturity, Dosenbach et al. selected a constant number of 200 highest ranked features from each cross-validation fold according to their magnitude of beta weights, and then identified 156 shared connections as consensus features [50].
Prediction performance-based quantification metrics
Prediction performance-based quantification metrics emphasize less on the constructed models and the participated predictors. Instead, they evaluate feature importance by examining whether certain brain regions or networks individually carry more predictive information than others [33, 57, 58], or to what extent excluding certain features degrades overall performance [4, 24, 51, 59].
For connectome-based predictive neuroimaging, virtual lesion analysis and specificity analysis are two representative methods that are developed on the basis of prediction performance. Specifically, virtual lesion analysis works by iteratively removing connections in a certain network from the whole-brain connectome to isolate its contribution to prediction [60]. Putatively, the magnitude of change in prediction accuracy upon removal of a specific network reflects its unique contribution. One study predicted the general intelligence using whole-brain connectome with an accuracy or r=0.457 [59], and then employed virtual lesion analysis to elucidate the predictive power of connections from between any two networks. Results demonstrated that removing the connections between cingulo-opercular and default model networks yielded the lowest prediction accuracy (r=0.37), indicating the great contribution of these two networks in intelligence prediction (Figure 3c). Specificity analysis restricts model building to only brain connectivity from one single functional network, and attributes greater contribution power to networks that achieve higher prediction accuracy [24]. For example, in predicting the symptom severity for patients with obsessive-compulsive disorder, Reggente et al. divided whole-brain regions into eight functional networks and built eight prediction models using connections from each network [58]. Results showed that only the default model and visual networks achieved significant accuracies, while no other network reached statistical significance.
Compared with other types of quantification metrics, a prominent strength of prediction performance-based measures is that they provide a straightforward way to directly pinpoint brain regions with the highest contribution and require no additional technique to summarize those low-level features (e.g., edges) to high-level representations (e.g., networks) for better interpretation and visualization. Although only accounting for 11% of all reviewed papers, this interpretation strategy is usually combined with other approaches, serving as a validation or complementary analysis to confirm the identified brain signatures [4]. Moreover, they can also be used in nonlinear models, since the feature importance does not rely on the model-learned feature weights. Nevertheless, an insidious problem comes from the fact that the network size may influence the prediction accuracy more than the network identity. As an example, Nielsen et al. grouped whole-brain nodes into thirteen functional systems and used within-connections from each of these networks to predict individual brain maturity [61]. Results demonstrated that all networks can predict age, however, prediction accuracies varied as a function of network size. Additional analyses suggested that none of these networks achieved better predictions than models built on a matched number of randomly selected connections. This study highlighted the necessity of testing against null models before concluding the unique contribution of any single network [31, 61]. Another limitation is increased computational load. For a parcellation scheme of m networks, at least different models need to be constructed to examine the predictive power for any between-network and within-network connections in a virtual lesion or specificity analysis. Moreover, this approach requires a priori specification of how the whole brain nodes are divided into different functional systems, based on which virtual lesion analysis or specificity analysis can be performed to characterize each system’s unique contribution. In this respect, neurobiological insight can only be acquired from the level of predefined functional systems, not allowing for more fine-grained representations. For example, in our experimental analysis, we grouped whole-brain voxels into 7 canonical networks, and couldn’t make any further interpretations beyond these functional networks (Figure 2c).
Future considerations for building interpretable neuroimaging biomarkers
Recommendations for interpreting predictive neuroimaging results
The above-mentioned interpretation approaches vary in multiple aspects, and sometimes may provide different answers to a problem. In this sense, selection of an appropriate approach can be a thorny issue, since there is no optimal solution that applies to all conditions, and different approaches may have their own strengths and weakness. The selection of the interpretation strategy can depend on the research aims. Specifically, if we aim to determine which specific functional network contributes more to prediction than others, the prediction performance-based approach may be a good choice; if we would like to determine the contribution of whole-brain features quantitatively, the beta weights-based metrics may be more appropriate; if we aim to derive a compact set of features for further validation, the consensus features may be optimal. Nevertheless, what we can do is to follow the best practices to present a better implementation upon the selected one. When interpreting neuroimaging results from a prediction model, we provide the following recommendations:
When extreme multicollinearity exists among predictors, avoid using beta-weights to interpret results.
Stability-based quantification metrics, particularly consensus features, are preferred when there is a need for constructing robust and generalizable prediction models with a compact site of neuroimaging features.
Prediction performance-based quantification metrics are suitable for ascertaining the unique contribution of individual functional networks or brain regions, and can be used as a complement to confirm results from other interpretation strategies.
Try to perform k-fold cross-validation with as many partition repetitions as possible to dilute the influence of random division of data folds and use the averaged beta weights to increase the stability of feature importance.
Report the reliability of beta weights across different cross-validation folds to provide an overall measure of quantification stability.
Utilize multiple interpretation techniques to validate and examine the convergence between each other, instead of being limited to a single one (Figure 4).
When dealing with high-dimensional neuroimaging features, effective feature extraction techniques are preferred to result in a small set of more informative representations (e.g., PCA).
Establish an appropriate null model for examining whether the identified features perform better than chance to unambiguously claim their unique utility [31].
Normalize edges counts or weights sum to account for network size when summarizing individual connections to network representations for visualization in using beta weights- or stability-based quantification metrics [17].
Figure 4. Approaches to validate neuroimaging signatures.
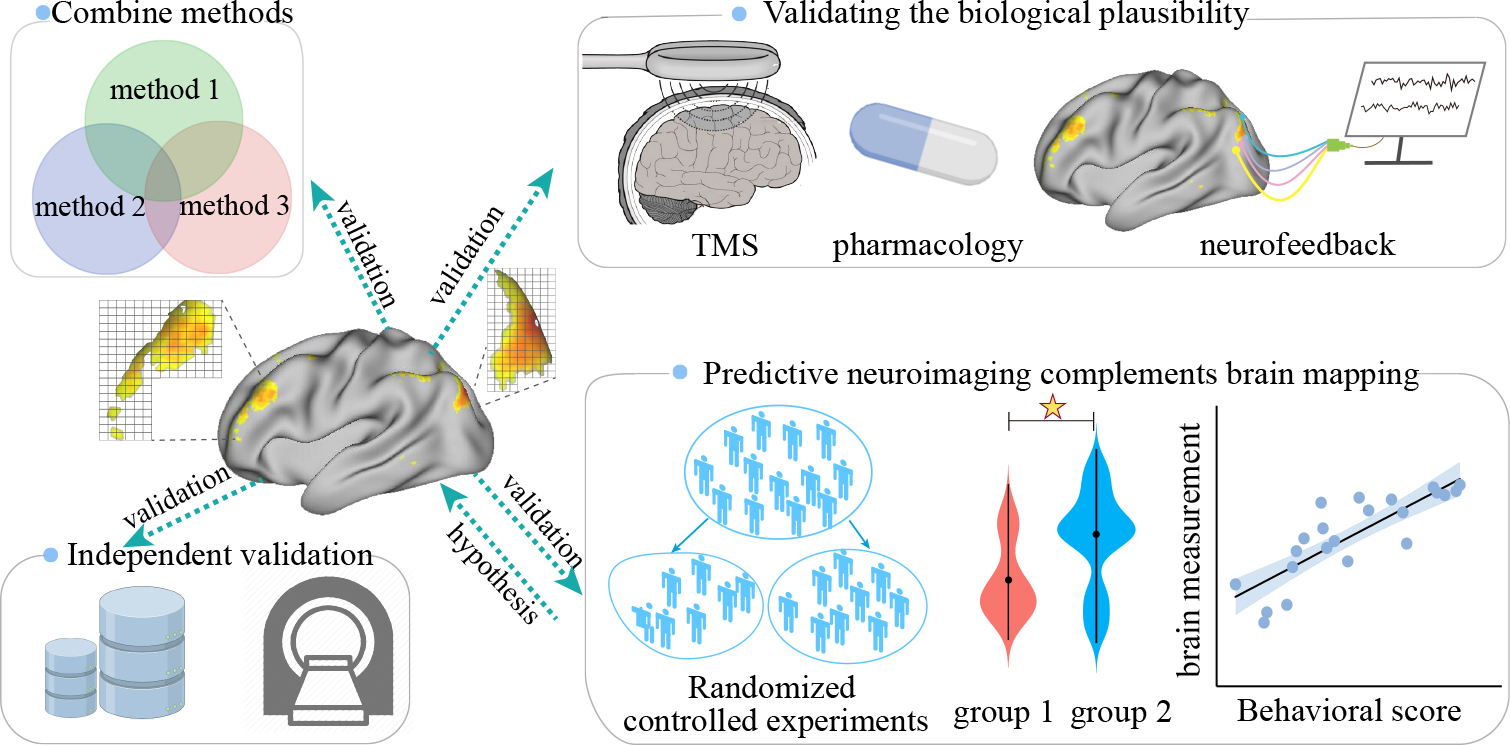
First, to obtain more interpretable biomarkers, researchers can use many techniques to validate and examine the convergence between them. Second, external heterogeneous datasets can be leveraged to test whether and to what extent models based on identified interpretable neuromarkers can generalize. Moreover, noninvasive techniques like real-time neurofeedback and neuropharmacology can be leveraged to validate the biological plausibility of the identified brain signatures. Furthermore, predictive neuroimaging and brain mapping are not mutually exclusive but rather complementary in biomarker discovery.
Validating the biological plausibility of identified brain signatures
Not until a brain signature is validated externally across different contexts, can it become a usable biomarker [62]. However, validating the biological plausibility of brain signatures is exceedingly challenging, given that the underlying substrates for any phenotype is theoretically agnostic as the ‘ground truth’ about which specific set of neuroimaging features define this construct is unknown. As such, it is impossible to explicitly define a specific set of brain voxels or connections that can serve as the benchmark to be tested against. In this regard, validation techniques that can determine the validity of model-identified brain features are in urgent need. On one hand, external heterogeneous datasets can be leveraged to test whether and to what extent models based on identified interpretable neuromarkers can generalize across contexts (scanners, laboratories, populations, and disease characteristics) [7, 20]. On the other hand, real-time noninvasive techniques like neurofeedback and neuropharmacology can be employed on the identified brain signatures in clinical trials to validate their intervention effects (Figure 4) [28]. Imaging biomarkers confirmed by these noninvasive validation effects usually suggest more translational implications.
Following best practices to build robust prediction models
Model interpretability relies heavily on the reliability and efficacy of the prediction model itself, which necessitates a protocol for establishing robust and powerful prediction models. Indeed, predictive biomarkers derived from different quantification approaches are more likely to be consistent with each other when the model is reliable enough to be generalizable across different contexts, where more confidence can be placed. Accordingly, the predictive features derived from the three interpretation approaches in our experimental analysis demonstrate a high overlap between each other, which may be due to the relatively large sample size, and the adoption of repeated cross-validation strategies (Figure 2). In this regard, the optimal practices that have been established in predictive neuroimaging should always be followed and pursued whenever possible. For example, researchers should carefully control for covariates in model building to ensure their models are not influenced by confounds. Other feasible practices involve increasing sample size, reducing model complexity [63], integrating multimodal data [64], extending fMRI scan duration [42], and defining individual-specific functional space [65].
Combining univariate inferences and multivariate predictions
Although predictive neuroimaging and brain mapping differ in multiple aspects when establishing brain-behavior relationships, they are not mutually exclusive but rather complementary [1]. We encourage the combined use of them to gain comprehensive insights into the neurobiological substrates of human cognition and disease pathology. On one hand, candidate brain biomarkers derived from predictive neuroimaging can serve as prior hypothesis or clinical targets, while, well-designed and randomized controlled experiments can be leveraged to confirm their biological plausibility to facilitate interpretability [25]. On the other hand, brain regions surviving rigorous statistical testing can serve as prior knowledge, and machine learning approaches can embark on these low-dimensional features to test their predictability and relate their interpretability to prediction performance. The combination use of these two approaches can prospectively catalyze the biomarker discovery on the path to translational neuroscience.
Beyond neuroimaging
While the current review primarily focuses on neuroimaging applications from connectome-based predictive modeling, the points raised here can be extended to research problems like decoding task activation maps from functional connectivity [21], diagnosing psychiatric diseases using classification [66], and delineating disease biotype using clustering [67]. Going beyond the neuroimaging context, these interpretation strategies can be easily adapted to other research fields using machine learning, because they generally follow similar workflows and a majority of the available machine learning methods are not specifically developed for neuroimaging. Therefore, the interpretation approaches are generalizable and transferable across different areas. Indeed, many of the interpretation methods discussed in this review have be leveraged in other fields. For example, Wei et al. employed a relative importance analysis method (CAR score) to determine the relative contribution of social, economic, and physical variables affecting domestic energy use in London [68]. We encourage the future introduction and adoption of interpretation approaches from other fields to neuroimaging investigations. Further, the neuroimaging community is witnessing increasing interest in interpreting deep learning models. A detailed discussion of interpretability of deep learning is beyond the scope of the current review, and we point the interested readers to a series of recent work [12–15].
Conclusion
The burgeoning field of predictive neuroimaging is evolving rapidly, which aims at quantitatively predicting phenotypic outcomes on a continuum. This review digs into details on how to interrogate contribution of brain features in the context of regression-based predictive neuroimaging. Despite a specific focus on neuroimaging applications from connectome-based predictive modeling, the ideas raised here can also be extended to studies using other imaging modalities, and more broadly to research practices like classification and biotype clustering. Collectively, interpreting neuroimaging results with appropriate approaches can help better unveil the underlying mechanisms of human cognitive ability, disease progress, and even facilitate the clinical intervention, thereby accelerating the pace of biomarker discovery.
Supplementary Material
Acknowledgments
We would like to thank Dr. Vince D. Calhoun for his insightful comments. Because of the SPM policy in not allowing the same individual to co-author more than one paper in this special issue, we have to remove Dr. Vince from the author list. This work is supported in part by the China Natural Science Foundation (No. 82022035, 61773380), and the National Institutes of Health (1R01MH117107, 1R01MH094524).
Biographies
 Rongtao Jiang (rongtao.jiang@yale.edu) received his Ph.D. in Pattern recognition & Intelligence System from the Institute of Automation, Chinese Academy of Sciences, China, in 2020, and his B.S. degree in Software Engineering from Northeastern University in 2015. He is now a postdoctoral research associate at Department of Radiology and Biomedical Imaging, Yale School of Medicine, New Haven, CT, 06520, USA. His research interests include multimodal brain imaging analysis, individualized prediction, connectome-based predictive modeling and the application of machine learning in medical image analysis.
 Choong-Wan Woo (waniwoo@g.skku.edu) is the director of the Cocoan lab, Sungkyunkwan University, Suwon, 16419, South Korea. His research focuses on understanding how the human brain represents, processes, and regulates pain and emotions using machine learning and computational modeling. He received his dual Ph.D. in the Department of Psychology and Neuroscience and the Institute of Cognitive Sciences from the University of Colorado Boulder, and MA in Clinical psychology and BS in Biology from Seoul National University.
 Shile Qi (shile.qi@nuaa.edu.cn) received her Ph.D. in Pattern recognition & Intelligence System from the Institute of Automation, CAS, in 2018, and MD in Applied Mathematics from Fuzhou University, and B.S. in Mathematics from Zhoukou Normal University respectively. She did her postdoctoral researcher at Tri-institutional Center for Translational Research in Neuroimaging and Data Science. She is now a full professor at the College of Computer Science and Technology, Nanjing University of Aeronautics and Astronautics, Nanjing, 211106, China. Her research interests include multimodal fusion methods development and its application in brain diseases.
 Jing Wu (jingwu1209@gmail.com) received her B.S. degree in Clinical Medicine from Shandong First Medical University, China, in 2016, and the MD. degree in Internal Medicine from the Capital Medical University, China, in 2019. She is currently a Ph.D. candidate in department of critical care medicine of liver disease at Capital Medical University, Beijing, 100069, China. Her research focuses on liver diseases, and the clinical and basic research on acute on chronic liver Failure.
 Jing Sui (jsui@bnu.edu.cn) received her B.S. and Ph.D. from Beijing Institute of Technology in 2002 and 2007 respectively. Then she worked at the Mind Research Network, NM, USA as a postdoctor fellow and got promoted to Research Scientist in 2010 and Assistant Professor in 2012. She worked as a full professor at Institute of Automation, CAS from 2013 to 2021. Currently she is a full professor at state key laboratory of cognitive neuroscience and learning, Beijing Normal University, 100875, China. Her research interests include multimodal neuroimaging data fusion and their applications in mental illnesses. She is a Senior Member of IEEE.
REFERENCES
- [1].Rosenberg MD, Casey BJ, and Holmes AJ, “Prediction complements explanation in understanding the developing brain,” Nat Commun, vol. 9, no. 1, pp. 589, 2018. [DOI] [PMC free article] [PubMed] [Google Scholar]
- [2].Bzdok D, and Ioannidis JPA, “Exploration, Inference, and Prediction in Neuroscience and Biomedicine,” Trends Neurosci, vol. 42, no. 4, pp. 251–262, 2019. [DOI] [PubMed] [Google Scholar]
- [3].Dubois J, and Adolphs R, “Building a Science of Individual Differences from fMRI,” Trends Cogn Sci, vol. 20, no. 6, pp. 425–443, 2016. [DOI] [PMC free article] [PubMed] [Google Scholar]
- [4].Rosenberg MD, Finn ES, Scheinost D, et al. , “A neuromarker of sustained attention from whole-brain functional connectivity,” Nat Neurosci, vol. 19, no. 1, pp. 165–71, 2016. [DOI] [PMC free article] [PubMed] [Google Scholar]
- [5].Sui J, Jiang R, Bustillo J, et al. , “Neuroimaging-based Individualized Prediction of Cognition and Behavior for Mental Disorders and Health: Methods and Promises,” Biol Psychiatry, vol. 88, no. 11, pp. 818–828, 2020. [DOI] [PMC free article] [PubMed] [Google Scholar]
- [6].Qi S, Morris R, Turner JA, et al. , “Common and unique multimodal covarying patterns in autism spectrum disorder subtypes,” Mol Autism, vol. 11, no. 1, pp. 90, 2020. [DOI] [PMC free article] [PubMed] [Google Scholar]
- [7].Lee JJ, Kim HJ, Ceko M, et al. , “A neuroimaging biomarker for sustained experimental and clinical pain,” Nat Med, vol. 27, no. 1, pp. 174–182, 2021. [DOI] [PMC free article] [PubMed] [Google Scholar]
- [8].Poldrack RA, Huckins G, and Varoquaux G, “Establishment of Best Practices for Evidence for Prediction: A Review,” JAMA Psychiatry, vol. 77, no. 5, pp. 534–540, 2020. [DOI] [PMC free article] [PubMed] [Google Scholar]
- [9].Kohoutova L, Heo J, Cha S, et al. , “Toward a unified framework for interpreting machine-learning models in neuroimaging,” Nat Protoc, vol. 15, no. 4, pp. 1399–1435, 2020. [DOI] [PMC free article] [PubMed] [Google Scholar]
- [10].Haufe S, Meinecke F, Gorgen K, et al. , “On the interpretation of weight vectors of linear models in multivariate neuroimaging,” Neuroimage, vol. 87, pp. 96–110, 2014. [DOI] [PubMed] [Google Scholar]
- [11].Kriegeskorte N, and Douglas PK, “Interpreting encoding and decoding models,” Current opinion in neurobiology, vol. 55, pp. 167–179 %@ 0959–4388, 2019. [DOI] [PMC free article] [PubMed] [Google Scholar]
- [12].Eitel F, Schulz MA, Seiler M, et al. , “Promises and pitfalls of deep neural networks in neuroimaging-based psychiatric research,” Exp Neurol, vol. 339, pp. 113608, 2021. [DOI] [PubMed] [Google Scholar]
- [13].Thomas AW, Heekeren HR, Müller K-R, et al. , “Analyzing neuroimaging data through recurrent deep learning models,” Frontiers in neuroscience, vol. 13, pp. 1321, 2019. [DOI] [PMC free article] [PubMed] [Google Scholar]
- [14].Böhle M, Eitel F, Weygandt M, et al. , “Layer-wise relevance propagation for explaining deep neural network decisions in MRI-based Alzheimer’s disease classification,” Frontiers in aging neuroscience, vol. 11, pp. 194, 2019. [DOI] [PMC free article] [PubMed] [Google Scholar]
- [15].Vieira S, Pinaya WHL, and Mechelli A, “Using deep learning to investigate the neuroimaging correlates of psychiatric and neurological disorders: Methods and applications,” Neuroscience & Biobehavioral Reviews, vol. 74, pp. 58–75, 2017. [DOI] [PubMed] [Google Scholar]
- [16].Thomas AW, Ré C, and Poldrack RA, “Challenges for cognitive decoding using deep learning methods,” arXiv preprint arXiv:2108.06896, 2021. [Google Scholar]
- [17].Greene AS, Gao S, Scheinost D, et al. , “Task-induced brain state manipulation improves prediction of individual traits,” Nat Commun, vol. 9, no. 1, pp. 2807, 2018. [DOI] [PMC free article] [PubMed] [Google Scholar]
- [18].Finn ES, Shen X, Scheinost D, et al. , “Functional connectome fingerprinting: identifying individuals using patterns of brain connectivity,” Nat Neurosci, vol. 18, no. 11, pp. 1664–71, 2015. [DOI] [PMC free article] [PubMed] [Google Scholar]
- [19].Wu D, Li X, and Jiang T, “Reconstruction of behavior-relevant individual brain activity: an individualized fMRI study,” Sci China Life Sci, vol. 63, no. 3, pp. 410–418, 2020. [DOI] [PubMed] [Google Scholar]
- [20].Woo CW, Chang LJ, Lindquist MA, et al. , “Building better biomarkers: brain models in translational neuroimaging,” Nat Neurosci, vol. 20, no. 3, pp. 365–377, 2017. [DOI] [PMC free article] [PubMed] [Google Scholar]
- [21].Tavor I, Parker Jones O, Mars RB, et al. , “Task-free MRI predicts individual differences in brain activity during task performance,” Science, vol. 352, no. 6282, pp. 216–20, 2016. [DOI] [PMC free article] [PubMed] [Google Scholar]
- [22].Luo N, Sui J, Abrol A, et al. , “Structural Brain Architectures Match Intrinsic Functional Networks and Vary across Domains: A Study from 15 000+ Individuals,” Cereb Cortex, vol. 30, no. 10, pp. 5460–5470, 2020. [DOI] [PMC free article] [PubMed] [Google Scholar]
- [23].Whelan R, and Garavan H, “When optimism hurts: inflated predictions in psychiatric neuroimaging,” Biol Psychiatry, vol. 75, no. 9, pp. 746–8, 2014. [DOI] [PubMed] [Google Scholar]
- [24].Yip SW, Kiluk B, and Scheinost D, “Toward Addiction Prediction: An Overview of Cross-Validated Predictive Modeling Findings and Considerations for Future Neuroimaging Research,” Biol Psychiatry Cogn Neurosci Neuroimaging, vol. 5, no. 8, pp. 748–758, 2020. [DOI] [PMC free article] [PubMed] [Google Scholar]
- [25].Yarkoni T, and Westfall J, “Choosing Prediction Over Explanation in Psychology: Lessons From Machine Learning,” Perspect Psychol Sci, vol. 12, no. 6, pp. 1100–1122, 2017. [DOI] [PMC free article] [PubMed] [Google Scholar]
- [26].Krapohl E, Patel H, Newhouse S, et al. , “Multi-polygenic score approach to trait prediction,” Mol Psychiatry, vol. 23, no. 5, pp. 1368–1374, 2018. [DOI] [PMC free article] [PubMed] [Google Scholar]
- [27].Shen X, Finn ES, Scheinost D, et al. , “Using connectome-based predictive modeling to predict individual behavior from brain connectivity,” Nat Protoc, vol. 12, no. 3, pp. 506–518, 2017. [DOI] [PMC free article] [PubMed] [Google Scholar]
- [28].Kragel PA, Koban L, Barrett LF, et al. , “Representation, Pattern Information, and Brain Signatures: From Neurons to Neuroimaging,” Neuron, vol. 99, no. 2, pp. 257–273, 2018. [DOI] [PMC free article] [PubMed] [Google Scholar]
- [29].Rosenberg MD, Scheinost D, Greene AS, et al. , “Functional connectivity predicts changes in attention observed across minutes, days, and months,” Proc Natl Acad Sci U S A, vol. 117, no. 7, pp. 3797–3807, 2020. [DOI] [PMC free article] [PubMed] [Google Scholar]
- [30].Jiang R, Abbott CC, Jiang T, et al. , “SMRI Biomarkers Predict Electroconvulsive Treatment Outcomes: Accuracy with Independent Data Sets,” Neuropsychopharmacology, vol. 43, no. 5, pp. 1078–1087, 2018. [DOI] [PMC free article] [PubMed] [Google Scholar]
- [31].Nielsen AN, Barch DM, Petersen SE, et al. , “Machine Learning With Neuroimaging: Evaluating Its Applications in Psychiatry,” Biol Psychiatry Cogn Neurosci Neuroimaging, vol. 5, no. 8, pp. 791–798, 2020. [DOI] [PMC free article] [PubMed] [Google Scholar]
- [32].Nimon KF, and Oswald FL, “Understanding the Results of Multiple Linear Regression,” Organizational Research Methods, vol. 16, no. 4, pp. 650–674, 2013. [Google Scholar]
- [33].Siegel JS, Ramsey LE, Snyder AZ, et al. , “Disruptions of network connectivity predict impairment in multiple behavioral domains after stroke,” Proc Natl Acad Sci U S A, vol. 113, no. 30, pp. E4367–76, 2016. [DOI] [PMC free article] [PubMed] [Google Scholar]
- [34].Cui Z, Li H, Xia CH, et al. , “Individual Variation in Functional Topography of Association Networks in Youth,” Neuron, vol. 106, no. 2, pp. 340–353 e8, 2020. [DOI] [PMC free article] [PubMed] [Google Scholar]
- [35].Kraha A, Turner H, Nimon K, et al. , “Tools to support interpreting multiple regression in the face of multicollinearity,” Front Psychol, vol. 3, pp. 44, 2012. [DOI] [PMC free article] [PubMed] [Google Scholar]
- [36].Gromping U, “Relative importance for linear regression in R: The package relaimpo,” Journal of Statistical Software, vol. 17, no. 1, pp. 27, 2006. [Google Scholar]
- [37].Hoerl AE, and Kennard RW, “Ridge regression: Biased estimation for nonorthogonal problems,” Technometrics, vol. 12, no. 1, pp. 55–67, 1970. [Google Scholar]
- [38].Tibshirani R, “Regression shrinkage and selection via the Lasso,” Journal of the Royal Statistical Society Series B-Methodological, vol. 58, no. 1, pp. 267–288, 1996. [Google Scholar]
- [39].Cui Z, Su M, Li L, et al. , “Individualized Prediction of Reading Comprehension Ability Using Gray Matter Volume,” Cereb Cortex, vol. 28, no. 5, pp. 1656–1672, 2018. [DOI] [PMC free article] [PubMed] [Google Scholar]
- [40].Feng C, Zhu Z, Cui Z, et al. , “Prediction of trust propensity from intrinsic brain morphology and functional connectome,” Hum Brain Mapp, vol. 42, no. 1, pp. 175–191, 2021. [DOI] [PMC free article] [PubMed] [Google Scholar]
- [41].Sripada C, Rutherford S, Angstadt M, et al. , “Prediction of neurocognition in youth from resting state fMRI,” Mol Psychiatry, vol. 25, no. 12, pp. 3413–3421, 2020. [DOI] [PMC free article] [PubMed] [Google Scholar]
- [42].Jiang R, Zuo N, Ford JM, et al. , “Task-induced brain connectivity promotes the detection of individual differences in brain-behavior relationships,” Neuroimage, vol. 207, pp. 116370, 2020. [DOI] [PMC free article] [PubMed] [Google Scholar]
- [43].Yoo K, Rosenberg MD, Hsu WT, et al. , “Connectome-based predictive modeling of attention: Comparing different functional connectivity features and prediction methods across datasets,” Neuroimage, vol. 167, pp. 11–22, 2018. [DOI] [PMC free article] [PubMed] [Google Scholar]
- [44].Grömping U, “Variable importance in regression models,” Wiley Interdisciplinary Reviews: Computational Statistics, vol. 7, no. 2, pp. 137–152, 2015. [Google Scholar]
- [45].Maglanoc LA, Kaufmann T, van der Meer D, et al. , “Brain Connectome Mapping of Complex Human Traits and Their Polygenic Architecture Using Machine Learning,” Biol Psychiatry, vol. 87, no. 8, pp. 717–726, 2020. [DOI] [PubMed] [Google Scholar]
- [46].Zuber V, and Strimmer K, “High-Dimensional Regression and Variable Selection Using CAR Scores,” Statistical Applications in Genetics and Molecular Biology, vol. 10, no. 1, 2011. [Google Scholar]
- [47].Walsh C, Mac Nally R, and Walsh MC, “The hier. part package,” Hierarchical Partitioning. R project for statistical computing, 2003. [Google Scholar]
- [48].Liu J, Liao X, Xia M, et al. , “Chronnectome fingerprinting: Identifying individuals and predicting higher cognitive functions using dynamic brain connectivity patterns,” Hum Brain Mapp, vol. 39, no. 2, pp. 902–915, 2018. [DOI] [PMC free article] [PubMed] [Google Scholar]
- [49].Wei L, Jing B, and Li H, “Bootstrapping promotes the RSFC-behavior associations: An application of individual cognitive traits prediction,” Hum Brain Mapp, vol. 41, no. 9, pp. 2302–2316, 2020. [DOI] [PMC free article] [PubMed] [Google Scholar]
- [50].Dosenbach NU, Nardos B, Cohen AL, et al. , “Prediction of individual brain maturity using fMRI,” Science, vol. 329, no. 5997, pp. 1358–1361, 2010. [DOI] [PMC free article] [PubMed] [Google Scholar]
- [51].Lichenstein SD, Scheinost D, Potenza MN, et al. , “Dissociable neural substrates of opioid and cocaine use identified via connectome-based modelling,” Molecular psychiatry, pp. 1–11, 2019. [DOI] [PMC free article] [PubMed] [Google Scholar]
- [52].Rosenberg MD, Zhang S, Hsu WT, et al. , “Methylphenidate Modulates Functional Network Connectivity to Enhance Attention,” J Neurosci, vol. 36, no. 37, pp. 9547–57, 2016. [DOI] [PMC free article] [PubMed] [Google Scholar]
- [53].Yu J, Rawtaer I, Fam J, et al. , “The individualized prediction of cognitive test scores in mild cognitive impairment using structural and functional connectivity features,” Neuroimage, vol. 223, pp. 117310, 2020. [DOI] [PubMed] [Google Scholar]
- [54].Gao S, Greene AS, Constable RT, et al. , “Combining multiple connectomes improves predictive modeling of phenotypic measures,” Neuroimage, vol. 201, pp. 116038, 2019. [DOI] [PMC free article] [PubMed] [Google Scholar]
- [55].Feng C, Cui Z, Cheng D, et al. , “Individualized prediction of dispositional worry using white matter connectivity,” Psychol Med, vol. 49, no. 12, pp. 1999–2008, 2019. [DOI] [PubMed] [Google Scholar]
- [56].Beaty RE, Kenett YN, Christensen AP, et al. , “Robust prediction of individual creative ability from brain functional connectivity,” Proc Natl Acad Sci U S A, vol. 115, no. 5, pp. 1087–1092, 2018. [DOI] [PMC free article] [PubMed] [Google Scholar]
- [57].Jiang R, Calhoun VD, Cui Y, et al. , “Multimodal data revealed different neurobiological correlates of intelligence between males and females,” Brain Imaging Behav, vol. 14, no. 5, pp. 1979–1993, 2020. [DOI] [PMC free article] [PubMed] [Google Scholar]
- [58].Reggente N, Moody TD, Morfini F, et al. , “Multivariate resting-state functional connectivity predicts response to cognitive behavioral therapy in obsessive-compulsive disorder,” Proc Natl Acad Sci U S A, vol. 115, no. 9, pp. 2222–2227, 2018. [DOI] [PMC free article] [PubMed] [Google Scholar]
- [59].Dubois J, Galdi P, Paul LK, et al. , “A distributed brain network predicts general intelligence from resting-state human neuroimaging data,” Philos Trans R Soc Lond B Biol Sci, vol. 373, no. 1756, 2018. [DOI] [PMC free article] [PubMed] [Google Scholar]
- [60].Rutherford HJV, Potenza MN, Mayes LC, et al. , “The Application of Connectome-Based Predictive Modeling to the Maternal Brain: Implications for Mother-Infant Bonding,” Cereb Cortex, vol. 30, no. 3, pp. 1538–1547, 2020. [DOI] [PMC free article] [PubMed] [Google Scholar]
- [61].Nielsen AN, Greene DJ, Gratton C, et al. , “Evaluating the Prediction of Brain Maturity From Functional Connectivity After Motion Artifact Denoising,” Cereb Cortex, vol. 29, no. 6, pp. 2455–2469, 2019. [DOI] [PMC free article] [PubMed] [Google Scholar]
- [62].Abi-Dargham A, and Horga G, “The search for imaging biomarkers in psychiatric disorders,” Nat Med, vol. 22, no. 11, pp. 1248–1255, 2016. [DOI] [PubMed] [Google Scholar]
- [63].Jiang R, Calhoun VD, Fan L, et al. , “Gender Differences in Connectome-based Predictions of Individualized Intelligence Quotient and Sub-domain Scores,” Cereb Cortex, vol. 30, no. 3, pp. 888–900, 2020. [DOI] [PMC free article] [PubMed] [Google Scholar]
- [64].Sui J, Qi S, van Erp TGM, et al. , “Multimodal neuromarkers in schizophrenia via cognition-guided MRI fusion,” Nat Commun, vol. 9, no. 1, pp. 3028, 2018. [DOI] [PMC free article] [PubMed] [Google Scholar]
- [65].Wang D, Li M, Wang M, et al. , “Individual-specific functional connectivity markers track dimensional and categorical features of psychotic illness,” Mol Psychiatry, vol. 25, no. 9, pp. 2119–2129, 2020. [DOI] [PMC free article] [PubMed] [Google Scholar]
- [66].Arbabshirani MR, Plis S, Sui J, et al. , “Single subject prediction of brain disorders in neuroimaging: Promises and pitfalls,” Neuroimage, vol. 145, no. Pt B, pp. 137–165, 2017. [DOI] [PMC free article] [PubMed] [Google Scholar]
- [67].Drysdale AT, Grosenick L, Downar J, et al. , “Resting-state connectivity biomarkers define neurophysiological subtypes of depression,” Nat Med, vol. 23, no. 1, pp. 28–38, 2017. [DOI] [PMC free article] [PubMed] [Google Scholar]
- [68].Tian W, Liu Y, Heo Y, et al. , “Relative importance of factors influencing building energy in urban environment,” Energy, vol. 111, pp. 237–250, 2016. [Google Scholar]
- [69].Cui Z, Stiso J, Baum GL, et al. , “Optimization of energy state transition trajectory supports the development of executive function during youth,” Elife, vol. 9, 2020. [DOI] [PMC free article] [PubMed] [Google Scholar]
- [70].Ju Y, Horien C, Chen W, et al. , “Connectome-based models can predict early symptom improvement in major depressive disorder,” J Affect Disord, vol. 273, pp. 442–452, 2020. [DOI] [PubMed] [Google Scholar]
Associated Data
This section collects any data citations, data availability statements, or supplementary materials included in this article.