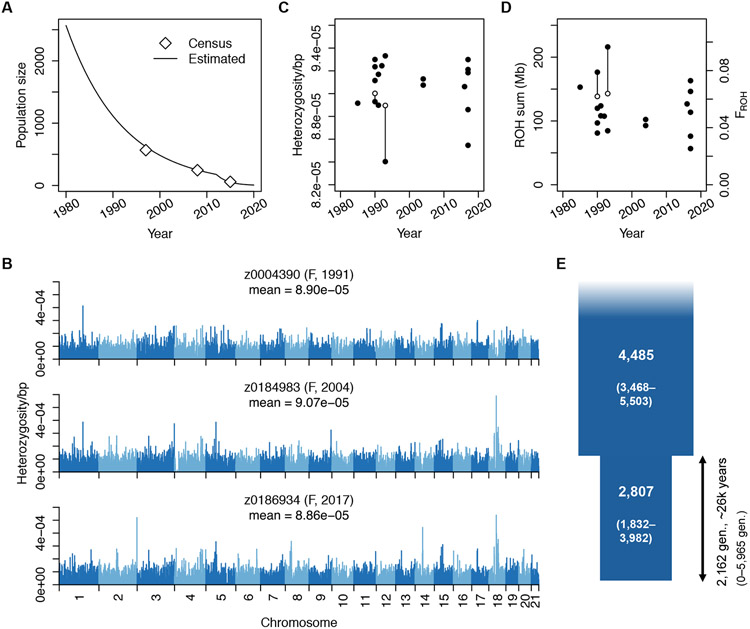
Fig. 1. Vaquita genome-wide diversity and demographic history.
(A) Model of vaquita census population size based on previous surveys (5) shows a dramatic recent decline. (B) Bar plots of per-site heterozygosity in 1-Mb genomic windows in three individuals (one from each sampling period; see fig. S1 for all) show little variability within or between individuals. (C, D) Genome-wide heterozygosity and ROH burden are consistent between sampling periods. Lines connect mother-fetus pairs; open symbols indicate offspring. (E) Two-epoch demographic model inferred with ∂a∂i. Parameter 95% confidence intervals indicated in parentheses.

