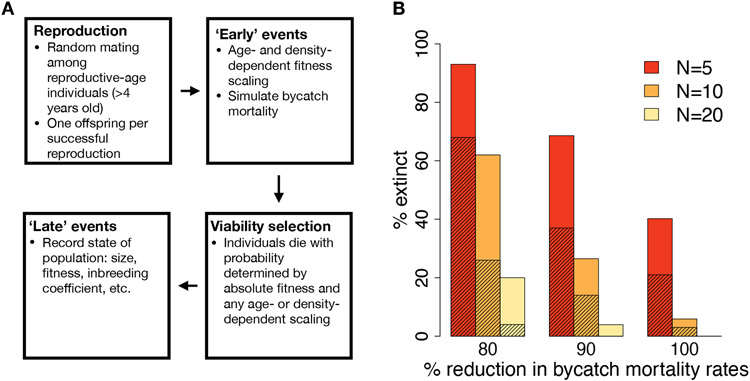
Fig. 3. Model schematic and extinction rates under various simulation parameters.
(A) Diagram of events that occur during one year in our SLiM simulation model. (B) Percent of replicates going extinct over the next 50 years under varying recovery parameters. Shading indicates extinction rates when only neutral mutations are simulated, and “N” represents the threshold population size.

