Abstract
Background: High methionine-diet (HMD) causes Alzheimer's disease (AD)-like symptoms. Previous studies have shown that Dendrobium nobile Lindle. alkaloids (DNLA) have potential benefits for AD
Object: The objective of this study has been to explore whether DNLA can improve AD-like symptoms induced by HMD.
Methods: Mice were fed with 2% HMD diet for 11 weeks; the DNLA20 control group (20 mg/kg), DNLA10 group (10 mg/kg), and DNLA20 group (20 mg/kg) were administered DNLA for 3 months. Morris water maze test was used to detect learning and memory ability. Neuron damage was evaluated by HE and Nissl staining. Levels of homocysteine (Hcy), beta-amyloid 1-42 (Aβ1-42), S-adenosine methionine (SAM) and S-adenosine homocysteine (SAH) were detected by ELISA. Immunofluorescence and western blotting (WB) were used to determine the expression of proteins. CPG island methylation levels were accessed by Methylation-specific PCR (MSP) and MethylTarget methylation detection.
Results: Morris water maze test revealed that DNLA improved learning and memory dysfunction. HE, Nissl, and immunofluorescence staining showed that DNLA alleviated neuron damage and reduced the 5-methylcytosine (5-mC), Aβ1-40 and Aβ1-42 levels. DNLA also decreased the levels of Hcy and Aβ1-42 in the serum, along with decreasing SAM/SAH level in the liver tissue. WB results showed that DNLA down-regulated the expression of amyloid-precursor protein (APP), presenilin-1 (PS1), beta-secretase-1 (BACE1), DNA methyltransferase1 (DNMT1), Aβ1-40 and Aβ1-42 proteins. DNLA also up-regulated the proteins expression of insulin-degrading enzyme (IDE), neprilysin (NEP), DNMT3a and DNMT3b. Meanwhile, DNLA increased CPG island methylation levels of APP and BACE1 genes.
Conclusion: DNLA alleviated AD-like symptoms induced by HMD via the DNA methylation pathway.
Keywords: High methionine diet, Alzheimer's disease-like symptoms, DNA methylation, Dendrobium nobile Lindl. alkaloid, 2021beta-amyloid, CPG
1. INTRODUCTION
Alzheimer's disease (AD) is a degenerative disease of nervous system with progressive memory loss and cognitive dysfunction [1]. The accumulation of amyloid plaques, neurofibrillary tangles, neuronal apoptosis, and decreased number of synapses are the main pathological features of the brain [2, 3]. Although there are many theories related to the pathogenesis of AD [4, 5], none of them can fully explain the pathogenesis of AD.
Methionine (Met) is one of the sulfur-containing essential amino acids [6] that the body cannot synthesize by itself and must be obtained from the outside. Importantly, studies have shown that a long-term high-methionine diet (HMD) can cause AD-like symptoms, i.e., the hyperphosphorylation of tau protein, increased levels of beta amyloid (Aβ)-peptide, increased levels of inflammation, increased oxidative stress, decreased synaptic protein level, and the dysfunction of the Wnt signaling pathway [7, 8]. Methionine supplies active methyl to the body changing the gene expression by directly participating in DNA methylation reactions; it can also be transformed into S-adenosylmethionine (SAM) [9]. In addition, SAM is the main methyl supply in the body and SAM/ Homocysteine (Hcy) circulation disorders can lead to DNA methylation abnormalities that exacerbate the occurrence of AD [10]. Hcy is an important intermediate product that Met can produce during the metabolism of the body. Hcy is not only a risk factor for diseases, such as vascular dementia (VD) and AD [11, 12], but also a biomarker of AD in serum and plasma [13]. Moreover, elevating Hcy levels caused by homocysteinemia (HHcy) is related to AD-like symptoms induced by an HMD [14, 15]. Met is the most important methyl donor in the body and methylation is also extremely important in modifying and processing proteins and nucleic acids [16]. Therefore, Met can be used as an important nutrient to carry out epigenetic modification of animals.
Epigenetics is a branch of genetics that studies the heritable changes in gene expression when the nucleotide sequence of a gene does not change [17], and its main mechanisms include DNA methylation [18], histone modification [19], and non-coding RNA regulation [20]. DNA methylation is an important part of epigenetics and one of the earliest discovered modification pathways. DNA methylation refers to the transfer of the methyl group on the SAM to the 5th carbon atom of cytosine under the catalysis of DNA methyltransferase (DNMTs) to form 5-methylcytosine (5-mC), which is a sign of DNA methylation level [21]. The region rich in CG base sequences is called CpG island, which is the main site of DNA methylation, but some studies have found that it may occur in other sequences [22]. Abnormal DNA methylation levels are closely related to many diseases [23, 24], especially AD [25]. The study of Zhiguang Huo [26] showed that DNA methylation dysregulation could affect AD neuropathology. Also, late-onset AD is related to DNA methylation and it has been confirmed that there is a significant difference in the level of extensive and specific DNA methylation [27]. Double Immunofluorescence staining (immunofluorescence) found that 5-mC expression level declined in astrocytes and microglia of AD patients, while expression in neurons was elevated [28].
Dendrobium nobile Lindl (DNL), a plant of the orchid family Dendrobium, is a species included in the pharmacopeia [29]. Dendrobium nobil Lindl. alkaloids (DNLA) as its main ingredient can reduce liver damage [30, 31], lower blood sugar [32, 33], and improve AD symptoms [34]. Our previous studies have shown that DNLA treatment reduced the nerve cell damage caused by Aβ25-35 and reduced lactate dehydrogenase (LDH) leakage. In addition, DNLA also up-regulated the level of PSD-95m RNA and the protein expression of SYP and PSD-95, having a protective effect on the synaptic integrity of cultured neurons [35]. In vivo study, DNLA not only reduced the abnormal phosphorylation of tau protein in the hippocampus neurons of AD model rats [36] but also regulated the levels of α- and β-secretase in the hippocampus neurons of SD rats [37], and activated the autophagy process to prevent axon degeneration induced by Aβ25-35 [29]. In an in vivo study, DNLA effectively improved the cognitive deficits of aged SAMP8 mice [38].
This study used HMD to induce AD-like symptoms to initially explore whether DNLA can reduce AD-like symptoms induced by HMD. Observing the effect of DNLA to further clarify the relationship between DNLA improved AD-like symptoms induced by HMD and DNA methylation, the pharmacological experimental basis for the development and application of DNLA has been provided.
2. MATERIALS AND METHODS
2.1. Animals and Drugs
Male C57/BL6 mice (8-week-old, 20-25 g) were purchased from Changsha Tianqin Biotechnology (Grade: specific pathogen-free [SPF], Certificate no: SCXK (Xiang) 2014-0011SCXK). Mice were kept in in single cages and raised in SPF-grade animal facilities, with free access to food and water and a 12 h light/dark cycle (21-25 ºC, 8:00 am-8:00 pm). All animal procedures performed have been approved by the animal experimental ethical committee of Zunyi Medical University. DNLA was isolated from the stem parts of DNL by our laboratory, which accounted for 78.97% (20170320), as determined by LC-MS/ MS. Our recent publications have shown the chemical structures and the chromatograms of DNLA [33, 37].
2.2. Experimental Designs
After 2 weeks of adaptive feeding, C57BL/6J mice were randomly divided into five groups (n = 15: control group, DNLA20 control group, HMD group, DNLA10 group, and DNLA20 group). The control group and the DNLA20 control group were given normal diet, and the other groups were given HMD (2%). After 11 weeks of the administration of diet, the DNLA20 control group (20 mg/kg), DNLA10 group (10 mg/kg) and DNLA20 group (20 mg/kg) were gavaged DNLA once a day separately for 3 months. DNLA was dissolved in 1% Tween 80. The equal volume of solvent was used in control and HMD groups. The treatment lasted for 3 months. Morris water maze test was performed to examine learning memory behavior of the animals. Afterwards, the mice were euthanized and sacrificed.
2.3. Morris Water Maze Test
Morris water maze test is used to detect the ability of spatial learning and memory [39]. A white circular pool (1200 cm in diameter and 40 cm deep) was filled with water (22 - 25 °C and 20 cm deep) 1 cm higher than the hidden circular platform (10 cm in diameter surface). The platform was located in one of the four equal quadrants with a computer system (equipped with a video camera) to automatically capture the data of each mouse. During the experiment, mice were trained once a day for four consecutive days. Mice were individually placed into the water facing the wall and were allowed 60 s to find the hidden platform. If the mouse stayed for more than 3 s after finding the platform within the 60 s, the experiment was terminated and the time for the mouse to find the platform was recorded, which was considered as the escape latency (s). Otherwise, if the animal failed to find the hidden platform within 60 s, the mice were placed back onto the platform for 20 s, and the escape latency was recorded as 60 s. The mean escape latency value of the three quadrants was used to estimate the performance of the mouse on a specific day. The platform was removed on the fifth day to conduct space exploration experiments. The first quadrant was selected as the water entry point, the number of times mouse crossed the platform position within the 60 s was recorded, and finally, statistical analysis was conducted. After the MWM test, mice were euthanized, and blood samples from the retro-orbital plexus were collected; one part of the brain tissues was rapidly dissected to separate the prefrontal cortex and hippocampus on ice and stored at - 80 °C. Another part of brain tissues was then fixed in 4% paraformaldehyde solution and waxed.
2.4. Morphometric Analysis
2.4.1. Haematoxylin Eosin (HE) Staining
Briefly, brain sections (5.0 μm thick) were dewaxed twice in xylene (10 min each) and rehydrated with graded alcohol (5 min each). Sections were stained with hematoxylin solution (20 min) followed by 1 min rinsing in distilled water and then differentiation with 1% hydrochloric acid ethanol (30 s). Then the sections were stained with eosin solution (2 min) followed by dehydration with graded alcohol. HE staining was performed to observe the hippocampus dentate gyrus (DG) regions and cortex histomorphology.
2.4.2. Nissl Staining
Brain sections (5.0 μm thick) were dewaxed twice in xylene (10 min each) and dehydrated with different concentrations of ethanol (5 min each). These were stained with toluidine blue (15 min) at 60 °C, followed by rinsing (5 min) in distilled water and dehydrating with different concentrations of ethanol. Thereafter, sections were cleared in xylene and mounted with neutral balsam. The number of Nissl bodies of the hippocampus DG regions and cortex has been analyzed by Image J.
2.4.3. Immunofluorescence Staining
The brain sections (5.0 μm) were in turn cleared in xylene and dewaxed with graded alcohol, and then the sections were washed two times with PBS (5 min each) and citrated for antigen retrieval three times (6 min each), dipped in 0.1% Triton-X- 100 (10 min) and then blocked in goat serum (30 min) at 37 °C. After washing again with PBS, slices were treated with the appropriate primary antibodies diluted in the blocking solution at 4 °C overnight. The antibodies used were as follows: rabbit Aβ1-40 (1: 500), anti- Aβ1-42 (1:200), and anti-5-mC (1:1000). The slices were then incubated with goat anti-rabbit IgG (H+L) 488 (1:500) at 37 °C (30 min) followed by washing twice with PBS; DAPI staining (5 min) and washing with PBS were subsequently performed. The slices were enclosed with anti-fluorescent mounting tablets. Images were acquired using a fluorescence microscope (Olympus). The average fluorescence optical density of the hippocampus DG regions and cortex was analyzed by Image J.
2.5. ELISA
After Morris water maze test was conducted, mice were sacrificed, and serum was collected to analyze Hcy and Aβ1-42 levels by ELISA kit. The liver tissue was collected to detect SAM and SAH levels. Optical absorbance of each well was measured according to the manufacturer’s instructions.
2.6. Western Blotting (WB) Analysis
Hippocampus and cortical tissues were collected and homogenized in RIPA lysis buffer with freshly added proteinase inhibitors. After centrifugation (12000 rpm, 15 min), the protein concentration was determined with BCA protein quantitative kit. Electrophoretic was used to separate 30 μg of protein in 8% and 10% SDS –PAGE followed by transferring onto PVDF membrane. The membrane was blocked with 5% non-fat milk at room temperature for 4 h. The membranes were then incubated with the primary antibodies (Aβ1-40 1:1000, Aβ1-42 1:500, APP 1:5000, PS1 1:8000, BACE1 1:7500, DNMT1 1:1000, DNMT3a 1:2000, DNMT3b 1:500, NEP 1:1000, IDE 1:15000, GAPDH 1: 50000, β-actin 1:10000) at 4 ºC overnight. After washing with TBST. the membranes were incubated with HRP-conjugated affinipure goat anti-rabbit IgG (1:5000) or HRP-conjugated affinipure goat anti-mouse IgG (1:5000) for 1 h at room temperature. The visualization of blots was conducted in Gel Imaging using a chemiluminescence detection kit.
2.7. Methylation-specific PCR (MSP)
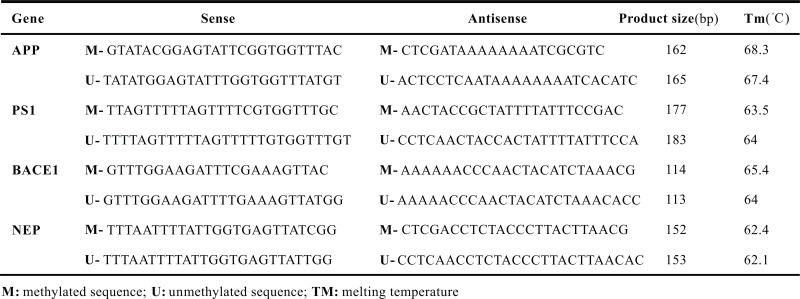
DNA extraction was performed using the Tissue Genomic DNA Extraction Kit. To evaluate methylation status, we performed a sodium bisulfite modification of genomic DNA followed by a PCR reaction. Finally, agarose gel (2%) electrophoresis was used to detect the experimental results. Specific primers were designed with the assistance of the Methprimer software (Table 1).
Table 1.
Primers sequences (5’-3’) used on MSP.
2.8. MethylTarget Methylation Detection
DNA methylation level was quantified by the MethylTarget™ target region methylation sequencing technique, which was developed by Genesky BioTech (Shanghai, China). Multiple PCR primer panel optimization and bisulfite treatment were performed after quality detection of genomic. After the multiple PCR reaction of the target fragment of the sample, the sample was mixed and gelled, and recovered. Library quantification and computer sequencing analysis were conducted to calculate the methylation level of CpG sites.
2.9. Statistical Analysis
All data have been presented as mean ± standard error. Data were analyzed by SPSS 22.0 statistics software. The Morris water maze assay was analyzed with repeated measures analysis of variance ANOVA, followed by Bonferroni multiple comparison tests; one-way ANOVA was used to analyze the other experiments, and the statistical significance of the difference between two groups was determined using LSD method if equal variance or Dunnett’s T3 method if missing variance. p < 0.05 was considered as statistically significant.
3. RESULTS
3.1. Protective Effects of DNLA on Learning and Memory
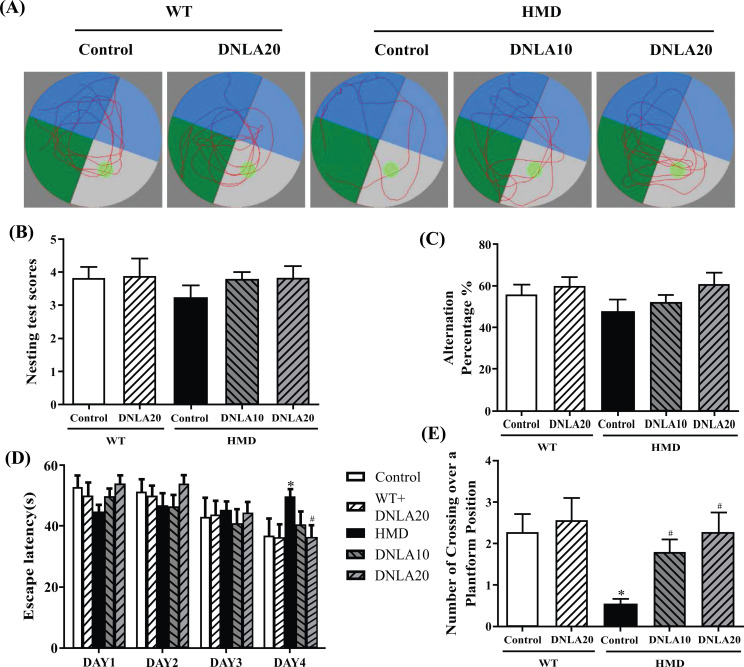
The learning and memory function was evaluated by the Morris water maze test (Fig. 1). The results showed that the escape latency got shorter, and there was a significant difference found between the control group and the HMD group on the fourth day in the training period (p < 0.05, Fig. 1B). Moreover, the number of crossings over the platform position within 60 s showed a significant reduction in the probe test when compared with the control group (p < 0.05, Fig. 1C), and DNLA treatment decreased the escape latency (p < 0.05, Fig. 1B) and increased the number of crossings over the platform position in the time period of 60 s (p < 0.05, Fig. 1C). The data showed that the treatment of DNLA improved learning and memory deficits.
Fig. (1).
Effect of DNLA on the learning, and memory capacity by behavioral test. (A) Representative tracing of Morris water maze test. (B) The escape latency. (C) The number of crossing over a platform position within 60 s. Note: data are mean ± SEM, n = 15, *p < 0.05 vs Control group; #p < 0.05 vs HMD group.
3.2. Morphological Changes in Cortex and Hippocampus
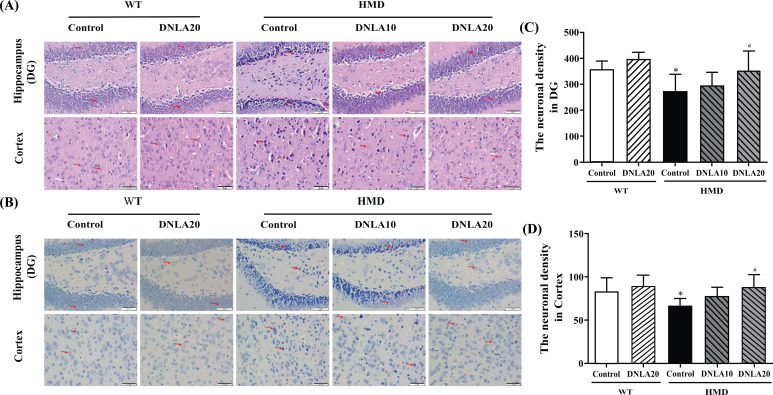
HE and Nissl staining is used to observe the morphological changes in the hippocampus and cortex; an abnormal cell damage induced by HMD in hippocampal DG and cortex regions was observed. It was found that the staining of neurons was abnormal, cortical vertebral body layer structure was disordered and nuclear shrinkage was present (Fig. 2); the neuronal density of hippocampal DG and cortex regions was found to be significantly decreased as compared to the control group (p < 0.05, Figs. 2C, D). After DNLA20 treatment, the damage was found to be improved. The neuronal density in hippocampal DG and cortex regions was found to be increased significantly (p < 0.05, Figs. 2C, D) compared to the HMD group. All these data demonstrate that DNLA treatment improved damage of the brain in the HMD group.
Fig. (2).
Effects of DNLA on morphological alterations in the hippocampus and cortex. Sections of the hippocampal DG region and cortex were obtained and stained with HE and Nissl (magnification, 400×). (A) Representative HE staining cyto-architecture. (B) Representative Nissl staining cytoarchitecture. (C) Statistics of viable neurons in the hippocampal DG region. (D) Statistics of viable neurons in the cortex region. Note: data are mean ± SEM, n = 6, *p < 0.05 vs Control group; #p < 0.05 vs HMD group.
3.3. Effect of DNLA on SAM, SAH, SAM/SAH, and Hcy Levels
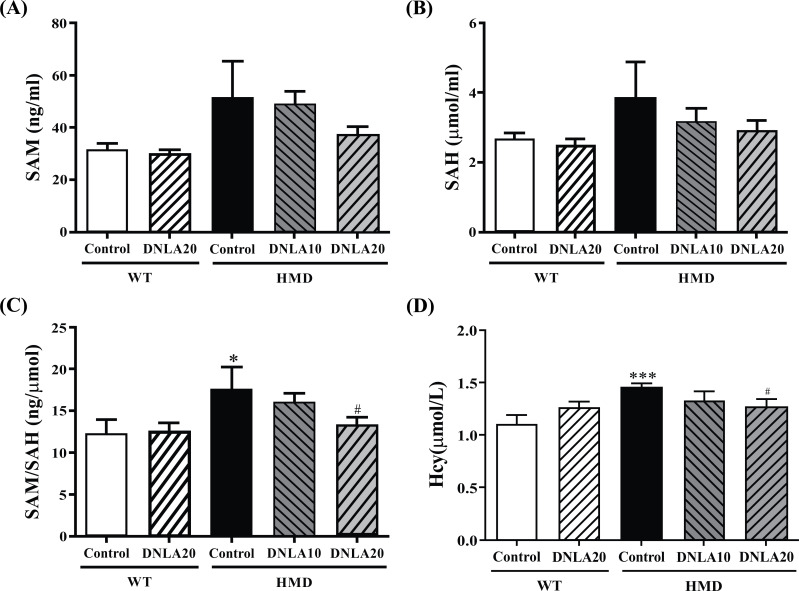
Compared with the control group, the SAM and SAH levels of the HMD group did not significantly increase upon DNLA20 treatment (p > 0.05, Figs. 3A, B), while DNLA treatment resulted in a significant decrease in SAM/SAH levels (p < 0.05, Fig. 3C).
Fig. (3).
Effect of DNLA on SAM, SAH, SAM/SAH, and Hcy levels. (A) The SAM level in the liver. (B) The SAH level in the liver. (C) The SAM/SAH level in the liver. (D) The Hcy level in serum. Note: data are mean ±SEM, n = 14, *p < 0.05, ***p < 0.001 vs. Control group; #p < 0.05 vs HMD group.
Compared with the control group, the Hcy (p < 0.05, Fig. 3D) levels of the HMD group were found to be significantly increased; the DNLA20 treatment decreased the level of Hcy (p < 0.05, Fig. 3D), as well as the DNLA treatment caused a decrease in Hcy and Aβ1-42 levels in serum.
3.4. Effect of DNLA on DNMTs
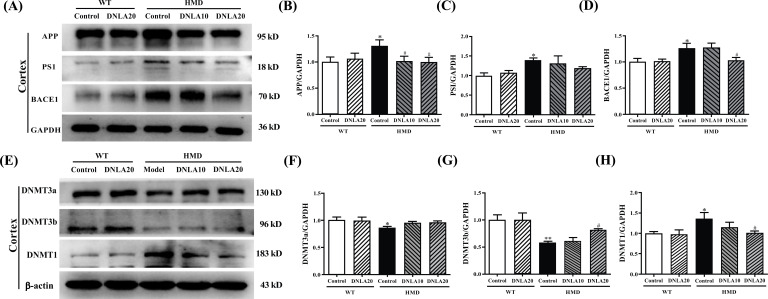
The expression of DNMT3a and DNMT3b proteins in the cortex of the HMD group (Fig. 4A) was significantly down-regulated (p < 0.05, Figs. 4B, C), and the expression of DNMT1 protein was found to be up-regulated when compared with the control group (p < 0.05, Fig. 4D). DNLA20 treatment up-regulated the expression of DNMT3b protein in the cortex (p < 0.05, Figs. 4B, C), while there was no significant change found in the expression of DNMT3a. The expression of DNMT1 protein in the cortex was found to be down-regulated after treating with DNLA20 (p < 0.05, Fig. 4D). These results showed that DNLA treatment up-regulated the DNMT3b proteins expression and down-regulated the DNMT1 proteins expression in the cortex.
Fig. (4).
Effect of DNLA on the expression of DNMTs. (A) Representative western blot images of DNMTs in the cortex. (B) The expression level of DNMT3a protein in the cortex. (C) The expression level of DNMT3b protein in the cortex. (D) The expression level of DNMT1 protein in the cortex. (E) Representative western blot images of DNMTs in the hippocampus. (F) The expression level of DNMT3a protein in the hippocampus. (G) The expression level of DNMT3b protein in the hippocampus. (H) The expression level of DNMT1 protein in the hippocampus. Note: data are mean ±SEM, n = 4, *p < 0.05, **p < 0.01 vs. Control group; #p < 0.05 vs HMD group.
The expression of DNMT3a and DNMT3b proteins in the hippocampus of the HMD group was found to be significantly down-regulated (p < 0.05, Figs. 4F, G), and the expression of DNMT1 protein up-regulated when compared with the control group (p < 0.05, Fig. 4H). DNLA20 treatment up-regulated the expression of DNMT3a protein in the hippocampus (p < 0.05, Fig. 4F), while the DNMT1 protein expression in the hippocampus was down-regulated (p < 0.05, Fig. 4H); however, there was no change observed in the DNMT3b protein expression (p > 0.05, Fig. 4G). These results showed that DNLA treatment up-regulated the expression of DNMT3a protein and down-regulated the expression of DNMT1 protein in the hippocampus.
3.5. Effect of DNLA on 5-mC in Hippocampus and Cortex Tissues
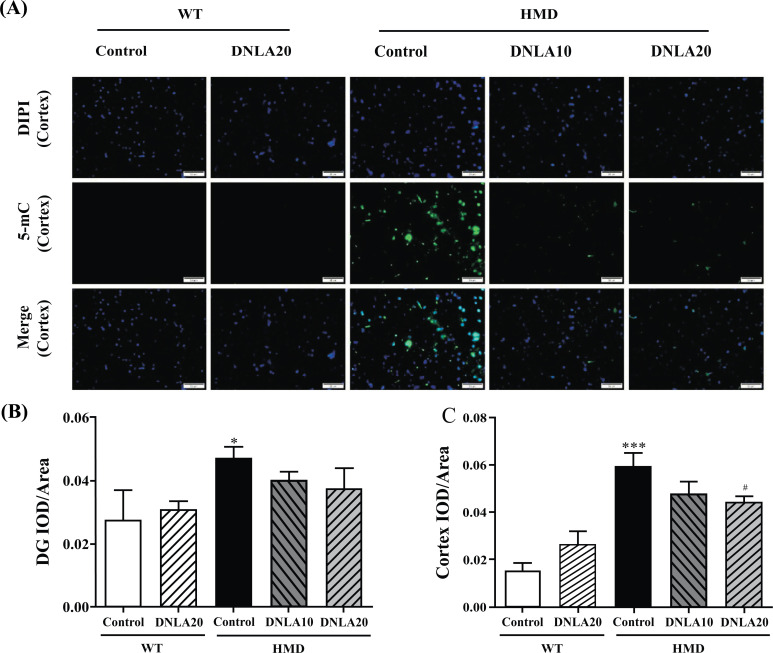
The 5-mC content in the hippocampus DG and cortex regions in HMD group (Fig. 5) was found to be significantly increased as compared to the control group (p < 0.05, Figs. 5B, C). DNLA20 treatment decreased the 5-mC content in the cortex region (p < 0.05, Fig. 5C). The content of 5-mC in DG region also decreased, but the difference was not found to be significant (p > 0.05, Fig. 5B). These results showed that DNLA treatment decreased the 5-mC content in the hippocampus and cortex.
Fig. (5).
Effect of DNLA on 5-mC immunofluorescence staining in hippocampus and cortex tissue. Sections of the hippocampal DG region and cortex were obtained and stained with 5-mC (magnification, 400×). (A) Representative photomicrographs in cortex region. (B) IOD/Area of 5-mC in hippocampal DG region. (C) IOD/Area of 5-mC in the cortex region. Note: data are mean ±SEM, n = 6, *p < 0.05, ***p < 0.001 vs Control group; #p < 0.05 vs. HMD group.
3.6. Effect of DNLA on Aβ1-40 and Aβ1-42 Levels
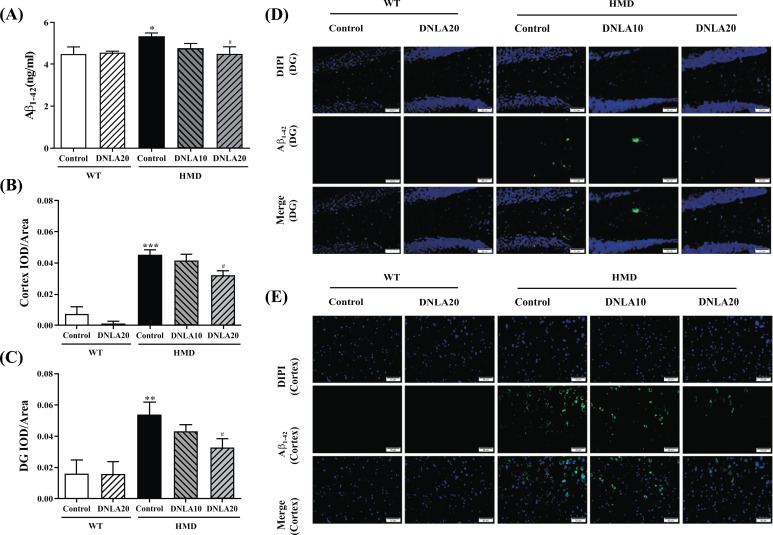
Compared with the control group, the Aβ1-42 (p < 0.05, Fig. 6A) level of the HMD group was found to be significantly increased, while DNLA20 treatment decreased the level of Aβ1-42 (p < 0.05, Fig. 6A). The results indicated that DNLA treatment decreased Aβ1-42 levels in serum.
Fig. (6).
Effect of DNLA on Aβ1-42 levels in hippocampal tissue, cortex tissue and serum. Sections of the hippocampus and cortex were obtained and stained with Aβ1-42 (magnification, 400×). (A) The Aβ1-42 level in serum. (B) IOD/Area of Aβ1-42 in the hippocampal DG region. (C) IOD/Area of Aβ1-42 in the cortex region. (D) Representative photomicrographs in the hippocampal DG region. (E) Representative photomicrographs in the cortex region. Note: data are mean ±SEM, n = 6 or 8, *p < 0.05, **p < 0.01, ***p < 0.001 vs. Control group; #p < 0.05 vs. HMD group.
The Aβ1-42 content in the hippocampal DG and cortex regions of the HMD group was found to be significantly increased when compared with the control group (p < 0.05, Figs. 6B, C). Importantly, DNLA20 treatment significantly decreased the Aβ1-42 content in the hippocampal DG and cortex regions (p < 0.05, Figs. 6B, C). The results indicated that DNLA treatment decreased the Aβ1-42 deposition in the hippocampal DG and cortex regions, thereby reducing the brain damage (Figs. 6D, E)..
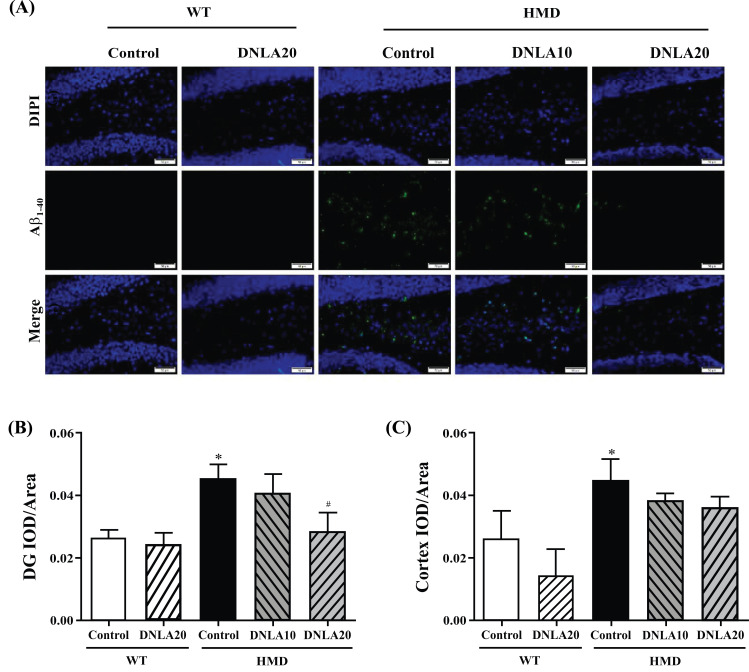
The Aβ1-40 content in the hippocampal DG and cortex regions of the HMD group (Fig. 7) was found to be significantly increased when compared with the control group (p < 0.05, Figs. 7B, C), while DNLA20 treatment decreased the Aβ1-40 content in the hippocampal DG region (p < 0.05, Fig. 7B), as well as the cortex region but this difference was not significant (p > 0.05, Fig. 7C). The results indicated that DNLA treatment decreased the Aβ1-40 deposition in the hippocampal DG and cortex regions, thereby reducing brain damage.
Fig. (7).
Effect of DNLA on Aβ1-40 immunofluorescence staining in hippocampus and cortex tissues. Sections of the hippocampus and cortex were obtained and stained with Aβ1-40 immunofluorescence staining (magnification, 400×). (A) Representative photomicrographs in the hippocampal DG region. (B) IOD/Area of Aβ1-40 in the hippocampal DG region. (C) IOD/Area of Aβ1-40 in the cortex region. Note: data are mean ±SEM, n = 6, *p < 0.05 vs. Control group; #p < 0.05 vs. HMD group.
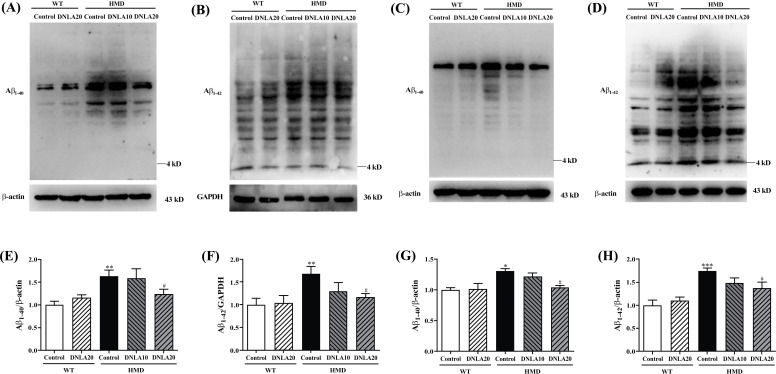
The Aβ1-40 and Aβ1-42 levels in the cortex and hippocampus of the HMD group were found to be significantly increased (p < 0.05, Figs. 8A, B, C, D) when compared with the control group, and DNLA20 treatment decreased the Aβ1-40 and Aβ1-42 levels in the cortex and hippocampus significantly (p < 0.05, Fig. 8E, F, G, H). These data indicated that DNLA treatment decreased the Aβ1-42 and Aβ1-42 levels in the cortex and hippocampus.
Fig. (8).
Effect of DNLA on Aβ1-40 and Aβ1-42 level in the cortex and hippocampus tissue. (A) Representative western blot images of Aβ1-40 level in cortex. (B) Representative western blot images of Aβ1-42 level in cortex. (C) Representative western blot images of Aβ1-40 level in the hippocampus. (D) Representative western blot images of Aβ1-42 level in the hippocampus. (E) The Aβ1-40 level in the cortex. (F) The Aβ1-42 level in the cortex. (G) The Aβ1-40 level in the hippocampus. (H) The Aβ1-42 level in the hippocampus. Note: data are mean ±SEM, n = 4, *p < 0.05 **p < 0.01, ***p < 0.001 vs. Control group; #p < 0.05 vs. HMD group.
3.7. Effect of DNLA on Aβ Generation Pathway
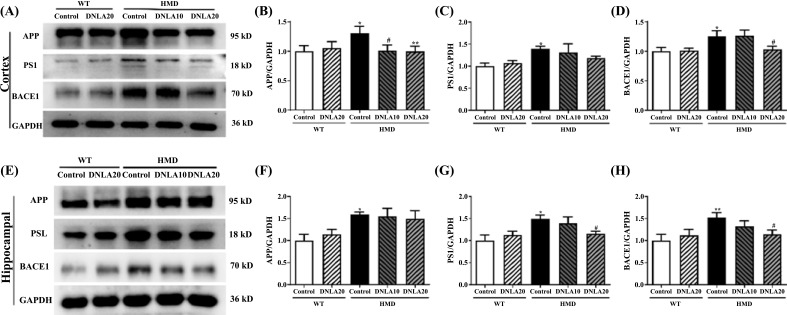
The expression of APP, PS1 and BACE1 proteins in the cortex of the HMD group was found to be significantly up-regulated when compared with the control group Fig. (9) (p < 0.05, Figs. 9B, D), while DNLA treatment significantly down-regulated the expression of APP and BACE1 proteins in the cortex (p < 0.05, Figs. 9B, D); the expression of PS1 protein in the cortex also tended to down-regulate (p > 0.05, Fig. 9C). These data suggest that DNLA treatment down-regulated the expression of APP, PS1, and BACE1 proteins in the cortex.
Fig. (9).
Effect of DNLA on the expression of Aβ generation pathway-related proteins. (A) Representative western blot images of Aβ generation pathway-related proteins in the cortex. (B) The APP protein expression level in the cortex. (C) The PS1protein expression level in the cortex. (D) The BACE1 protein expression level in the cortex. (E) Representative western blot images of Aβ generation pathway-related proteins in the hippocampus. (F) The APP protein expression level in the hippocampus. (G) The PS1 protein expression level in the hippocampus. (H) The BACE1 protein expression level in the hippocampus. Note: data are mean ±SEM, n = 4, *p < 0.05, **p < 0.01, vs. Control group; #p < 0.05 vs. HMD group.
The expression of APP, PS1 and BACE1 proteins in the hippocampus of the HMD group was found to be significantly up-regulated when compared with the control group (p < 0.05, Figs. 9F, G, H); DNLA20 treatment down-regulated the expression of PS1 and BACE1 proteins in the hippocampus (p < 0.05, Figs. 9G, H), while the expression of APP proteins did not exhibit any change. These data indicated that DNLA treatment down-regulated the PS1 and BACE1 proteins expression in the hippocampus.
3.8. Effect of DNLA on Aβ Metabolism Pathway
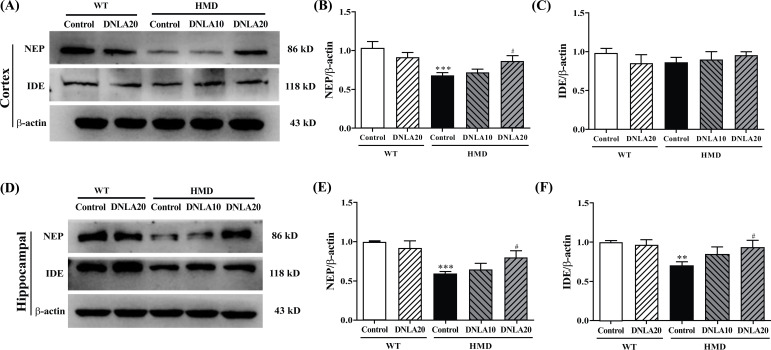
The expression of NEP protein (Fig. 10) in the cortex of the HMD group was found to be significantly down-regulated (p < 0.05, Fig. 10B) while the IDE protein expression in the cortex did not exhibit any change when compared with the control group. DNLA20 treatment up-regulated the NEP protein expression in the cortex (p < 0.05, Fig. 10B). However, the protein NEP expression showed no change in the cortex upon treatment with DNLA. These results showed that DNLA treatment up-regulated the NEP protein expression in the cortex.
Fig. (10).
Effect of DNLA on the expression of Aβ metabolism pathway-related proteins. (A) Representative western blot images of Aβ metabolism pathway-related proteins in the cortex. (B) The NEP protein expression level in the cortex. (C) The IDE protein expression level in the cortex. (D) Representative western blot images of Aβ metabolism pathway-related proteins in each group in the hippocampus. (E) The NEP protein expression level in the hippocampus. (F) The IDE protein expression level in the hippocampus. Note: data are mean ±SEM, n = 4, **p < 0.01, ***p < 0.001 vs Control group; #p < 0.05 vs. HMD group.
The expression of IDE and NEP proteins in the hippocampus of the HMD group was found to be significantly down-regulated (p < 0.05, Figs. 10E, F) when compared with the control group; DNLA20 treatment up-regulated the NEP protein and the IDE protein expression in the hippocampus (p < 0.05, Figs. 10E, F). These results indicated that DNLA treatment up-regulated the NEP proteins and the IDE protein expression in the hippocampus.
3.9. Effect of DNLA on Aβ Generation and Metabolism Related Gene Methylation Level
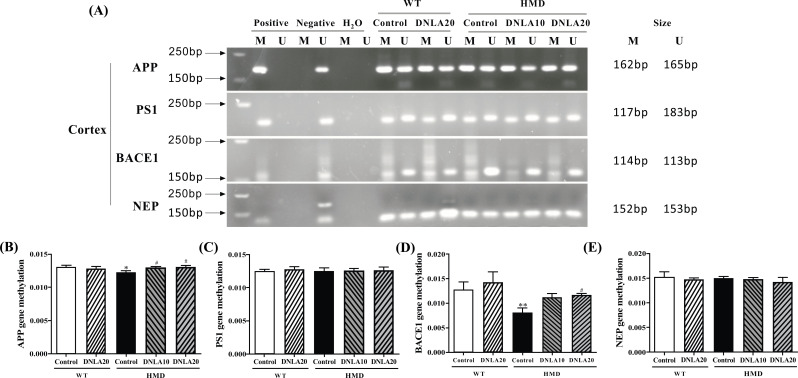
MSP was used to detect whether the gene CPG island is methylated in the cortex (Fig. 11). The results showed methylation of Aβ generation and metabolism related gene CPG island in each group (Fig. 11A). MethylTarget methylation detection was used to detect methylation level of Aβ generation and metabolism related gene CPG island in the cortex. The methylation levels of APP and BACE1 genes CPG island in the cortex of the HMD group were found to be significantly decreased (p < 0.05, Figs. 11B, D). However, no change has been observed in CPG island methylation levels in PS1 and NEP genes. DNLA treatment significantly increased CPG island methylation levels of APP and BACE1 genes in the HMD group (p < 0.05, Figs. 11B, D), while the CPG island methylation levels of PS1 and NEP genes did not change after the DNLA treatment (Figs. 11C, E).
Fig. (11).
Methylation status of Aβ generation and metabolism related genes in cortex. (A) Primer sets used for amplification are designated as unmethylated (U), methylated (M). The electrophoretogram for the PCR products of the cortex CpG islands of Aβ generation and metabolism related genes were amplified by MSP. (B) MethylTarget methylation detection of the APP gene methylation level in the cortex. (C) MethylTarget methylation detection of the PS1 gene methylation level in the cortex. (D) MethylTarget methylation detection of the BACE1 gene methylation level in the cortex. (E) MethylTarget methylation detection of the NEP gene methylation level in the cortex. Note: data are mean ±SEM, n = 7, *p < 0.05 vs. Control group; #p < 0.05 vs HMD group.
4. DISCUSSION
This study showed that HMD induced cognitive dysfunction and caused neuron damage, increasing the overall methylation level. HMD also down-regulated the expression of Aβ metabolism-related proteins, decreased the CPG methylation levels of Aβ production-related genes, and up-regulated the expression of Aβ production-related proteins, finally causing AD-like symptoms. It is worth noticing that the symptoms have been relieved after DNLA treatment.
Researches have shown that HMD causes cognitive decline and neurotoxicity in the body, leading to AD-like neurodegeneration [40, 41]. We confirmed that 3 months of DNLA treatment significantly improved learning and memory deficits of mouse with AD-like symptoms in water maze test, which was found to be consistent with our previous results in AD animal models, such as APP/PS1 mouse [33], Aβ25-35 injection mouse [42], LPS induction model [35] and SAMP8 mouse [37, 43].
Cognitive dysfunction is one of the most important clinical manifestations of AD that is closely related to the hippocampus DG and cortex regions, leading to cognitive impairment and neuron damage. The hippocampus and cortex are basic areas for cognitive function in the brain, as well as the key structures for learning and memory [44]. In patients with AD, the hippocampus DG and cortex regions are characterized by atrophy and neuronal density reduction [45]. HMD can cause impaired learning and memory by damaging hippocampus and cortex neurons [7], being consistent with other models [46, 47]. In our study, these pathological changes were found to be improved in mice with AD-like symptoms induced by HMD after 3 months of DNLA treatment, which was in accordance with the results of DNLA in improving hippocampus and cortical neuron damage in previous studies [33-36]. However, DNLA could improve the damage of hippocampus CA1 and CA3 regions, while there are no reports related to DG region [33, 37, 48]. The results of this experiment showed that the damage of the AD-like symptom model induced by HMD mainly occurred in the hippocampal DG region, and the DNLA treatment significantly improved this damage. All these data prove DNLA to have beneficial effects on AD-related neuronal degeneration.
Methionine can be metabolized into S-adenosine methionine (SAM) under the action of methio-nine adenosyltransferase (MAT). SAM is one of the major methyl donors that can be converted to S-adenosine homocysteine (SAH), a methyl group that will be added to the 5-position carbon atom of cytosine to form 5mC, which is involved in epigenetic modifications under the action of methyltransferase [13]. SAM/SAH is an important indicator of the methylation potential in vivo. The liver is the largest metabolic organ, and the level of SAM/SAH in the liver can reflect the overall methylation level [10]. 5-mC is also used to evaluate the overall methylation level [49]. The general increase of 5-mC in AD is significantly negatively correlated with the hippocampal Aβ burden in AD patients [50]. In our study, we confirmed that HMD increased SAM/SAH and 5-mC levels. After DNLA treatment, SAM/SAH and 5-mC levels were found to significantly decrease. These results indicated that DNLA may regulate SAM/SAH levels by regulating the metabolism of the methyl in the body, thus affecting the methylation process of DNA and resulting in a decrease in 5-mC levels.
We further detected some molecular markers related to methylation to clarify the mechanism of DNLA in reducing brain damage. DNMT3a and DNMT3b participate in early embryonic development and cell differentiation. In the AD model, the levels of DNMT3A and DNMT3B were found to be significantly decreased [25]. Further studies have found that the inhibitory effect of DNMTs can also increase the protein levels of the APP, β- and γ-secretase, and overexpression of DNMT3b inhibits these levels in vitro [51]. In the present study, WB results indicated that HMD might cause AD-like symptoms by inhibiting the expression of DNMT3A and DNMT3B proteins, and 3-month DNLA treatment exerted a protective effect by up-regulating the expression of DNMT3A and DNMT3B proteins. DNMT1 participates in the maintenance of the methylation process by adding methyl groups based on already methylation gene sequence, and the down-regulation of its expression may cause AD [52, 53]. However, WB results of this experiment showed that HMD increased the level of DNMT1 in the brain, and 3 months of DNLA treatment decreased the level of DNMT1 protein. This might be related to the level of Hcy in the body, as some studies have shown that increased Hcy level leads to an increase in cytotoxicity by increasing the expression of DNMT1 [54]. These results indicate that DNLA could reduce overall methylation level, thereby exerting a protective effect.
Hcy is an intermediate product of Met metabolism, and HMD increases the level of Hcy in the serum [13]. The levels of Hcy and Aβ1-42 serve as the serum biomarkers of AD [55, 56], which not only increase the risk of AD but also further aggravate the symptoms of AD. Our study showed that HMD led to increased levels of Hcy and Aβ1-42 in serum, while 3 months of DNLA treatment significantly reduced their serum levels. Every 5 μmol/L increase in blood homocysteine is linearly associated with a 15% increase in relative risk of AD-type dementia [57]. Studies involving AD mouse models have linked high Hcy with memory impairment, amyloidosis, tau pathology, synaptic dysfunction, and neuroinflammation [58]. Therefore, DNLA might reduce the occurrence of AD and delay the progression of AD symptoms by reducing Hcy and Aβ1-42 levels.
Aβ deposition is the main pathological feature of AD [59]. Abnormal deposition of Aβ can trigger neurotoxic effects [60], including synaptic damage [61] and neuron death [62], ultimately leading to AD. The most common subtypes of Aβ are Aβ1-40 and Aβ1-42. Compared with Aβ1-40, Aβ1-42 is more likely to accumulate and form plaques in the brain parenchyma, and Aβ1-40 tends to reach the cerebral blood vessels and cause amyloid angiopathy [63]. The results of WB and immunofluorescence confirmed that DNLA reduced Aβ1-40 and Aβ1-42 levels in the brain. Aβ is mainly produced by the hydrolysis of APP by β-secretase and γ secretase, while BACE1 and PS1 are the main β-secretase and γ secretase [64, 65]. In addition, the degradation of Aβ mainly depends on the participation of IDE and NEP [66, 67]. Abnormal expression of Aβ production and metabolism related-enzymes causes the abnormal aggregation of Aβ and eventually leads to AD. Met is a trigger factor for increased levels of Aβ-peptides, including the formation of Aβ oligomers [7]. The results of immunofluorescence and WB showed that HMD increased the levels of Aβ1-40 and Aβ1-42 in the brain by up-regulating Aβ production-related proteins APP, PS1 and BACE1 and down-regulating the expression of Aβ metabolism-related proteins IDE and NEP. DNLA treatment reduced the levels of Aβ1-40 and Aβ1-42 by down-regulating Aβ production-related proteins APP, PS1 and BACE1 and up-regulating the expression of Aβ metabolism-related proteins IDE and NEP; this is consistent with the results of the previous SD rat neuron and SAMP8 mice researches [36, 43]. All these results indicated that DNLA improved AD-like symptoms induced by HMD by reducing brain Aβ levels.
However, whether DNA methylation changes affect the expression of Aβ production and metabolism-related proteins to reduce Aβ deposition needs further study. The methylation levels of AD-related genes change when the disease occurs, such as APP [68], PS1 [69], and BACE1 [70]. SAM/SAH and 5-mC reflect the overall methylation level of the genome. The methylation level of specific genes is different from the overall methylation level of the genome, so further detection of Aβ production and metabolism related gene methylation level is still needed. CpG islands are the main areas where methylation occurs. The qualitative analysis of the methylation level of CPG islands related to Aβ production and metabolism by MSP showed that the CPG islands of APP, PS1, BACE1, and NEP genes in each group were all methylated. Mutations in the APP gene can lead to familial AD. DNA in the promoter region of this gene is completely demethylated in the cerebral cortex of AD patients [71]. Aβ can cause an overall decrease in the level of BACE1 gene methylation [72]. The DNA methylation studies of other disease-causing genes and susceptibility genes of AD such as PS1, NEP, Tau and APOE have not found significant differences in methylation in the tissues [73]. Further results of MethylTarget methylation detection showed that HMD decreased the methylation level in APP and BACE1 gene CPG islands, leading to AD-like symptoms, and APP and BACE1 gene CPG islands methylation levels increased after 3 months of DNLA treatment, thereby inhibiting gene transcription by reducing APP and BACE1 protein expression and improving AD-like symptoms. However, no significant differences in methylation levels were found in the CPG islands of PS1 and NEP genes, indicating that HMD and DNLA may regulate the expression of PS1 and NEP-related genes and the methylation levels of non-CPG island gene loci to affect AD development in other ways [74]. The above results showed that DNLA improved HMD-induced AD-like symptoms through increasing DNA methylation levels of APP and BACE1 genes.
This study found that DNLA may improve AD-like symptoms caused by HMD through Aβ production and metabolism. Moreover, studies have shown that the pathogenesis of AD involves not only Aβ deposition but also tau protein phosphorylation [7]. However, whether DNLA can affect the level of methylation of genes related to tau protein phosphorylation through the methylation pathway, thereby exerting a brain-protective effect in AD, has not yet been reported; this aspect still needs to be studied. Only APP and BACE1 genes were found to be altered after DNLA treatment in the MethylTarget methylation detection of CPG island methylation related genes associated with Aβ production and metabolism. The WB results showed that the levels of Aβ production and metabolism-related proteins changed; however, the whole genome bisulfite sequencing (WGBS) can be used to detect the methylation level of specific regions in the next step to find differentially methylated region (DMR).
CONCLUSION
DNLA can reduce the level of Aβ and the overall methylation level of the brain by regulating the expression levels, including Aβ production-related protein, Aβ metabolism-related protein, and DNAMTs proteins, and up-regulating the methylation level of APP and BACE1 gene CPG islands, thereby alleviating HMD induced AD-like symptoms. In summary, DNLA exerts a brain protective effect via the DNA methylation pathway.
ACKNOWLEDGEMENTS
Tingting Pi conceived and designed the experiments, performed the main experiments, analyzed the data, contributed reagents/materials/analysis tools, wrote the paper, prepared figures and/or tables. Guangping Lang and Bo Liu reviewed drafts of the paper. Jing-Shan Shi conceived and designed the experiments, and reviewed drafts of the paper.
LIST OF ABBREVIATIONS
- 5-mC
5-methylcytosine
- AD
Alzheimer's disease
- APP
Amyloid precursor protein
- Aβ
Beta-amyloid
- Aβ1-40
Beta-amyloid 1-40
- Aβ1-42
Beta-amyloid 1-42
- BACE1
Beta-secretase 1
- CPG
Cytosine-phosphate-Guanine
- DG
Dentate gyrus
- DMR
Differentially methylated region
- DNL
Dendrobium nobile Lindl
- DNLA
Dendrobium nobile Lindle. Alkaloids
- DNMT1
DNA methyltransferase1
- DNMT3a
DNA methyltransferase3a
- DNMT3b
DNA methyltransferase3b
- DNMTs
DNA methyltransferase
- Hcy
Homocysteine
- HE
Haematoxylin eosin
- HHcy
Hyperhomocysteinemia
- HMD
High methionine diet
- IDE
Insulin-degrading enzyme
- immunofluorescence
Immunofluorescence staining
- LDH
Lactate dehydrogenase
- Met
Methionine
- MSP
Methylation-specific PCR
- NEP
Neprilysin
- PS1
Presenilin-1
- SAH
S-adenosine homocysteine
- SAM
S-adenosine methionine
- VD
Vascular dementia
- WB
Western blot
- WGBS
Whole genome bisulfite sequencing
ETHICS APPROVAL AND CONSENT TO PARTICIPATE
All animal procedures performed have been approved by the animal experimental ethical committee of Zunyi Medical University.
HUMAN AND ANIMAL RIGHTS
No humans were used for studies that are the basis of this research. The animal experimental ethical committee of Zunyi Medical University approved all animal procedures.
CONSENT FOR PUBLICATION
Not applicable.
AVAILABILITY OF DATA AND MATERIALS
Not applicable.
FUNDING
This work was supported by the National Natural Science Foundation of China [U1812403] and Funds for the Construction of National First Class Pharmacy Discipline [GESR (2017-006)].
CONFLICT OF INTEREST
The authors declare no conflict of interest, financial or otherwise.
REFERENCES
- 1.Lane C.A., Hardy J., Schott J.M. Alzheimer’s disease. Eur. J. Neurol. 2018;25(1):59–70. doi: 10.1111/ene.13439. [DOI] [PubMed] [Google Scholar]
- 2.Zhou Y., Shi J., Chu D., Hu W., Guan Z., Gong C.X., Iqbal K., Liu F. Relevance of phosphorylation and truncation of tau to the etiopathogenesis of Alzheimer’s disease. Front. Aging Neurosci. 2018;10:27. doi: 10.3389/fnagi.2018.00027. [DOI] [PMC free article] [PubMed] [Google Scholar]
- 3.Theofilas P., Ehrenberg A.J., Nguy A., Thackrey J.M., Dunlop S., Mejia M.B., Alho A.T., Paraizo Leite R.E., Rodriguez R.D., Suemoto C.K., Nascimento C.F., Chin M., Medina-Cleghorn D., Cuervo A.M., Arkin M., Seeley W.W., Miller B.L., Nitrini R., Pasqualucci C.A., Filho W.J., Rueb U., Neuhaus J., Heinsen H., Grinberg L.T. Probing the correlation of neuronal loss, neurofibrillary tangles, and cell death markers across the Alzheimer’s disease Braak stages: a quantitative study in humans. Neurobiol. Aging. 2018;61:1–12. doi: 10.1016/j.neurobiolaging.2017.09.007. [DOI] [PMC free article] [PubMed] [Google Scholar]
- 4.El Khoury J., Toft M., Hickman S.E., Means T.K., Terada K., Geula C., Luster A.D. Ccr2 deficiency impairs microglial accumulation and accelerates progression of Alzheimer-like disease. Nat. Med. 2007;13(4):432–438. doi: 10.1038/nm1555. [DOI] [PubMed] [Google Scholar]
- 5.Heneka M.T., Kummer M.P., Stutz A., Delekate A., Schwartz S., Vieira-Saecker A., Griep A., Axt D., Remus A., Tzeng T.C., Gelpi E., Halle A., Korte M., Latz E., Golenbock D.T. NLRP3 is activated in Alzheimer’s disease and contributes to pathology in APP/PS1 mice. Nature. 2013;493(7434):674–678. doi: 10.1038/nature11729. [DOI] [PMC free article] [PubMed] [Google Scholar]
- 6.Zhou H.Y., Wu W.J., Xu Y.Y., Zhou B., Niu K., Liu Z.Q., Zheng Y.G. Calcium carbonate addition improves l-methionine biosynthesis by metabolically engineered Escherichia coli W3110-BL. Front. Bioeng. Biotechnol. 2020;8:300. doi: 10.3389/fbioe.2020.00300. [DOI] [PMC free article] [PubMed] [Google Scholar]
- 7.Tapia-Rojas C., Lindsay C.B., Montecinos-Oliva C., Arrazola M.S., Retamales R.M., Bunout D., Hirsch S., Inestrosa N.C. Is L-methionine a trigger factor for Alzheimer’s-like neurodegeneration?: Changes in Aβ oligomers, tau phosphorylation, synaptic proteins, Wnt signaling and behavioral impairment in wild-type mice. Mol. Neurodegener. 2015;10:62. doi: 10.1186/s13024-015-0057-0. [DOI] [PMC free article] [PubMed] [Google Scholar]
- 8.Cuello A.C., Hall H., Do Carmo S. Experimental pharmacology in transgenic rodent models of Alzheimer’s disease. Front. Pharmacol. 2019;10:189. doi: 10.3389/fphar.2019.00189. [DOI] [PMC free article] [PubMed] [Google Scholar]
- 9.Zhang N. Role of methionine on epigenetic modification of DNA methylation and gene expression in animals. Anim. Nutr. 2018;4(1):11–16. doi: 10.1016/j.aninu.2017.08.009. [DOI] [PMC free article] [PubMed] [Google Scholar]
- 10.Li W., Liu H., Yu M., Zhang X., Zhang M., Wilson J.X., Huang G. Folic acid administration inhibits amyloid β-peptide accumulation in APP/PS1 transgenic mice. J. Nutr. Biochem. 2015;26(8):883–891. doi: 10.1016/j.jnutbio.2015.03.009. [DOI] [PubMed] [Google Scholar]
- 11.Smith A.D., Refsum H. Homocysteine, B vitamins, and cognitive impairment. Annu. Rev. Nutr. 2016;36:211–239. doi: 10.1146/annurev-nutr-071715-050947. [DOI] [PubMed] [Google Scholar]
- 12.Moretti R., Caruso P., Dal Ben M., Conti C., Gazzin S., Tiribelli C., Vitamin D. Vitamin D, homocysteine, and folate in subcortical vascular dementia and Alzheimer dementia. Front. Aging Neurosci. 2017;9:169. doi: 10.3389/fnagi.2017.00169. [DOI] [PMC free article] [PubMed] [Google Scholar]
- 13.Pi T., Liu B., Shi J. Abnormal homocysteine metabolism: an insight of Alzheimer’s disease from DNA methylation. Behav. Neurol. 2020;2020:8438602. doi: 10.1155/2020/8438602. [DOI] [PMC free article] [PubMed] [Google Scholar]
- 14.Shirafuji N., Hamano T., Yen S.H., Kanaan N.M., Yoshida H., Hayashi K., Ikawa M., Yamamura O., Kuriyama M., Nakamoto Y. Homocysteine increases tau phosphorylation, truncation and oligomerization. Int. J. Mol. Sci. 2018;19(3):891. doi: 10.3390/ijms19030891. [DOI] [PMC free article] [PubMed] [Google Scholar]
- 15.Zhuo J.M., Praticò D. Severe in vivo hyper-homocysteinemia is not associatedwith elevation of amyloid-beta peptides in the Tg2576 mice. J. Alzheimers Dis. 2010;21(1):133–140. doi: 10.3233/JAD-2010-100171. [DOI] [PMC free article] [PubMed] [Google Scholar]
- 16.Shen W., Gao C., Cueto R., Liu L., Fu H., Shao Y., Yang W.Y., Fang P., Choi E.T., Wu Q., Yang X., Wang H. Homocysteine-methionine cycle is a metabolic sensor system controlling methylation-regulated pathological signaling. Redox Biol. 2020;28:101322. doi: 10.1016/j.redox.2019.101322. [DOI] [PMC free article] [PubMed] [Google Scholar]
- 17.Reik W., Kelsey G. Epigenetics: Cellular memory erased in human embryos. Nature. 2014;511(7511):540–541. doi: 10.1038/nature13648. [DOI] [PubMed] [Google Scholar]
- 18.Luo C., Hajkova P., Ecker J.R. Dynamic DNA methylation: In the right place at the right time. Science. 2018;361(6409):1336–1340. doi: 10.1126/science.aat6806. [DOI] [PMC free article] [PubMed] [Google Scholar]
- 19.Christopher M.A., Kyle S.M., Katz D.J. Neuroepigenetic mechanisms in disease. Epigenetics Chromatin. 2017;10(1):47. doi: 10.1186/s13072-017-0150-4. [DOI] [PMC free article] [PubMed] [Google Scholar]
- 20.Frye M., Harada B.T., Behm M., He C. RNA modifications modulate gene expression during development. Science. 2018;361(6409):1346–1349. doi: 10.1126/science.aau1646. [DOI] [PMC free article] [PubMed] [Google Scholar]
- 21.Yang L., Rau R., Goodell M.A. DNMT3A in haematological malignancies. Nat. Rev. Cancer. 2015;15(3):152–165. doi: 10.1038/nrc3895. [DOI] [PMC free article] [PubMed] [Google Scholar]
- 22.Kinde B., Gabel H.W., Gilbert C.S., Griffith E.C., Greenberg M.E. Reading the unique DNA methylation landscape of the brain: Non-CpG methylation, hydroxymethylation, and MeCP2. Proc. Natl. Acad. Sci. USA. 2015;112(22):6800–6806. doi: 10.1073/pnas.1411269112. [DOI] [PMC free article] [PubMed] [Google Scholar]
- 23.Du J., Johnson L.M., Jacobsen S.E., Patel D.J. DNA methylation pathways and their crosstalk with histone methylation. Nat. Rev. Mol. Cell Biol. 2015;16(9):519–532. doi: 10.1038/nrm4043. [DOI] [PMC free article] [PubMed] [Google Scholar]
- 24.Yao L., Ye Y., Mao H., Lu F., He X., Lu G., Zhang S. MicroRNA-124 regulates the expression of MEKK3 in the inflammatory pathogenesis of Parkinson’s disease. J. Neuroinflammation. 2018;15(1):13. doi: 10.1186/s12974-018-1053-4. [DOI] [PMC free article] [PubMed] [Google Scholar]
- 25.Lai G., Guo Y., Chen D., Tang X., Shuai O., Yong T., Wang D., Xiao C., Zhou G., Xie Y., Yang B.B., Wu Q. Alcohol extracts from Ganoderma lucidum delay the progress of Alzheimer’s disease by regulating DNA methylation in rodents. Front. Pharmacol. 2019;10:272. doi: 10.3389/fphar.2019.00272. [DOI] [PMC free article] [PubMed] [Google Scholar]
- 26.Huo Z., Zhu Y., Yu L., Yang J., De Jager P., Bennett D.A., Zhao J. DNA methylation variability in Alzheimer’s disease. Neurobiol. Aging. 2019;76:35–44. doi: 10.1016/j.neurobiolaging.2018.12.003. [DOI] [PMC free article] [PubMed] [Google Scholar]
- 27.Semick S.A., Bharadwaj R.A., Collado-Torres L., Tao R., Shin J.H., Deep-Soboslay A., Weiss J.R., Weinberger D.R., Hyde T.M., Kleinman J.E., Jaffe A.E., Mattay V.S. Integrated DNA methylation and gene expression profiling across multiple brain regions implicate novel genes in Alzheimer’s disease. Acta Neuropathol. 2019;137(4):557–569. doi: 10.1007/s00401-019-01966-5. [DOI] [PubMed] [Google Scholar]
- 28.Coppieters N., Dieriks B.V., Lill C., Faull R.L., Curtis M.A., Dragunow M. Global changes in DNA methylation and hydroxymethylation in Alzheimer’s disease human brain. Neurobiol. Aging. 2014;35(6):1334–1344. doi: 10.1016/j.neurobiolaging.2013.11.031. [DOI] [PubMed] [Google Scholar]
- 29.Li S., Zhou J., Xu S., Li J., Liu J., Lu Y., Shi J., Zhou S., Wu Q. Induction of Nrf2 pathway by Dendrobium nobile Lindl. alkaloids protects against carbon tetrachloride induced acute liver injury. Biomed. Pharmacother. 2019;117:109073. doi: 10.1016/j.biopha.2019.109073. [DOI] [PubMed] [Google Scholar]
- 30.Huang S., Wu Q., Liu H., Ling H., He Y., Wang C., Wang Z., Lu Y., Lu Y. Alkaloids of dendrobium nobile lindl. Altered hepatic lipid homeostasis via regulation of bile acids. J. Ethnopharmacol. 2019;241:111976. doi: 10.1016/j.jep.2019.111976. [DOI] [PubMed] [Google Scholar]
- 31.Huang Q., Liao X., Wu Q., Shi J.S. Effects of total alkaloids of Dendrobium nobile Lindl. on GLUT4 expression in skeletal muscle of diabetic rats. Zhongguo Xin Yao Zazhi. 2019;28(13):1625–1628. [Google Scholar]
- 32.Xu Y.Y., Xu Y.S., Wang Y., Wu Q., Lu Y.F., Liu J., Shi J.S. Dendrobium nobile Lindl. alkaloids regulate metabolism gene expression in livers of mice. J. Pharm. Pharmacol. 2017;69(10):1409–1417. doi: 10.1111/jphp.12778. [DOI] [PubMed] [Google Scholar]
- 33.Nie J., Jiang L.S., Zhang Y., Tian Y., Li L.S., Lu Y.L., Yang W.J., Shi J.S. Dendrobium nobile Lindl. Alkaloids decreases the level of intracellular β-Amyloid by improving impaired autolysosomal proteolysis in APP/PS1 mice. Front. Pharmacol. 2018;9:1479. doi: 10.3389/fphar.2018.01479. [DOI] [PMC free article] [PubMed] [Google Scholar]
- 34.Zhang W., Wu Q., Lu Y.L., Gong Q.H., Zhang F., Shi J.S. Protective effects of Dendrobium nobile Lindl. alkaloids on amyloid beta (25-35)-induced neuronal injury. Neural Regen. Res. 2017;12(7):1131–1136. doi: 10.4103/1673-5374.211193. [DOI] [PMC free article] [PubMed] [Google Scholar]
- 35.Yang S., Gong Q., Wu Q., Li F., Lu Y., Shi J. Alkaloids enriched extract from Dendrobium nobile Lindl. attenuates tau protein hyperphosphorylation and apoptosis induced by lipopolysaccharide in rat brain. Phytomedicine. 2014;21(5):712–716. doi: 10.1016/j.phymed.2013.10.026. [DOI] [PubMed] [Google Scholar]
- 36.Huang J., Huang N., Zhang M., Nie J., Xu Y., Wu Q., Shi J. Dendrobium alkaloids decrease Aβ by regulating α- and β-secretases in hippocampal neurons of SD rats. PeerJ. 2019;7:e7627. doi: 10.7717/peerj.7627. [DOI] [PMC free article] [PubMed] [Google Scholar]
- 37.Liu B., Huang B., Liu J., Shi J.S. Dendrobium nobile Lindl alkaloid and metformin ameliorate cognitive dysfunction in senescence-accelerated mice via suppression of endoplasmic reticulum stress. Brain Res. 2020;1741:146871. doi: 10.1016/j.brainres.2020.146871. [DOI] [PubMed] [Google Scholar]
- 38.Mehla J., Lacoursiere S.G., Lapointe V., McNaughton B.L., Sutherland R.J., McDonald R.J., Mohajerani M.H. Age-dependent behavioral and biochemical characterization of single APP knock-in mouse (APPNL-G-F/NL-G-F) model of Alzheimer’s disease. Neurobiol. Aging. 2019;75:25–37. doi: 10.1016/j.neurobiolaging.2018.10.026. [DOI] [PubMed] [Google Scholar]
- 39.Vorhees C.V., Williams M.T. Morris water maze: procedures for assessing spatial and related forms of learning and memory. Nat. Protoc. 2006;1(2):848–858. doi: 10.1038/nprot.2006.116. [DOI] [PMC free article] [PubMed] [Google Scholar]
- 40.Velazquez R., Ferreira E., Knowles S., Fux C., Rodin A., Winslow W., Oddo S. Lifelong choline supplementation ameliorates Alzheimer’s disease pathology and associated cognitive deficits by attenuating microglia activation. Aging Cell. 2019;18(6):e13037. doi: 10.1111/acel.13037. [DOI] [PMC free article] [PubMed] [Google Scholar]
- 41.Nuru M., Muradashvili N., Kalani A., Lominadze D., Tyagi N. High methionine, low folate and low vitamin B6/B12 (HM-LF-LV) diet causes neurodegeneration and subsequent short-term memory loss. Metab. Brain Dis. 2018;33(6):1923–1934. doi: 10.1007/s11011-018-0298-z. [DOI] [PMC free article] [PubMed] [Google Scholar]
- 42.Li Y., Li F., Gong Q., Wu Q., Shi J. Inhibitory effects of Dendrobium alkaloids on memory impairment induced by lipopolysaccharide in rats. Planta Med. 2011;77(2):117–121. doi: 10.1055/s-0030-1250235. [DOI] [PubMed] [Google Scholar]
- 43.Lv L.L., Liu B., Liu J., Li L.S., Jin F., Xu Y.Y., Wu Q., Liu J., Shi J.S. Dendrobium nobile Lindl. Alkaloids ameliorate cognitive dysfunction in senescence accelerated SAMP8 mice by decreasing Amyloid-β aggregation and enhancing autophagy activity. J. Alzheimers Dis. 2020;76(2):657–669. doi: 10.3233/JAD-200308. [DOI] [PubMed] [Google Scholar]
- 44.Hollands C., Tobin M.K., Hsu M., Musaraca K., Yu T.S., Mishra R., Kernie S.G., Lazarov O. Depletion of adult neurogenesis exacerbates cognitive deficits in Alzheimer’s disease by compromising hippocampal inhibition. Mol. Neurodegener. 2017;12(1):64. doi: 10.1186/s13024-017-0207-7. [DOI] [PMC free article] [PubMed] [Google Scholar]
- 45.Hadipour M., Meftahi G.H., Afarinesh M.R., Jahromi G.P., Hatef B. Crocin attenuates the granular cells damages on the dentate gyrus and pyramidal neurons in the CA3 regions of the hippocampus and frontal cortex in the rat model of Alzheimer’s disease. J. Chem. Neuroanat. 2021;113:101837. doi: 10.1016/j.jchemneu.2020.101837. [DOI] [PubMed] [Google Scholar]
- 46.Pang J., Hou J., Zhou Z., Ren M., Mo Y., Yang G., Qu Z., Hu Y. Safflower yellow improves synaptic plasticity in APP/PS1 mice by regulating microglia activation phenotypes and BDNF/TrkB/ERK signaling pathway. Neuromolecular Med. 2020;22(3):341–358. doi: 10.1007/s12017-020-08591-6. [DOI] [PubMed] [Google Scholar]
- 47.Wang Y., Wang M., Fan K., Li T., Yan T., Wu B., Bi K., Jia Y. Protective effects of Alpinae Oxyphyllae Fructus extracts on lipopolysaccharide-induced animal model of Alzheimer’s disease. J. Ethnopharmacol. 2018;217:98–106. doi: 10.1016/j.jep.2018.02.015. [DOI] [PubMed] [Google Scholar]
- 48.Nie J., Tian Y., Zhang Y., Lu Y.L., Li L.S., Shi J.S. Dendrobium alkaloids prevent Aβ25-35-induced neuronal and synaptic loss via promoting neurotrophic factors expression in mice. PeerJ. 2016;4:e2739. doi: 10.7717/peerj.2739. [DOI] [PMC free article] [PubMed] [Google Scholar]
- 49.Kitsera N., Allgayer J., Parsa E., Geier N., Rossa M., Carell T., Khobta A. Functional impacts of 5-hydroxymethylcytosine, 5-formylcytosine, and 5-carboxycytosine at a single hemi-modified CpG dinucleotide in a gene promoter. Nucleic Acids Res. 2017;45(19):11033–11042. doi: 10.1093/nar/gkx718. [DOI] [PMC free article] [PubMed] [Google Scholar]
- 50.Chouliaras L., Mastroeni D., Delvaux E., Grover A., Kenis G., Hof P.R., Steinbusch H.W., Coleman P.D., Rutten B.P., van den Hove D.L. Consistent decrease in global DNA methylation and hydroxymethylation in the hippocampus of Alzheimer’s disease patients. Neurobiol. Aging. 2013;34(9):2091–2099. doi: 10.1016/j.neurobiolaging.2013.02.021. [DOI] [PMC free article] [PubMed] [Google Scholar]
- 51.Liu H., Qiu H., Yang J., Ni J., Le W. Chronic hypoxia facilitates Alzheimer’s disease through demethylation of γ-secretase by downregulating DNA methyltransferase 3b. Alzheimers Dement. 2016;12(2):130–143. doi: 10.1016/j.jalz.2015.05.019. [DOI] [PubMed] [Google Scholar]
- 52.Bihaqi S.W., Zawia N.H. Alzheimer’s disease biomarkers and epigenetic intermediates following exposure to Pb in vitro. Curr. Alzheimer Res. 2012;9(5):555–562. doi: 10.2174/156720512800617964. [DOI] [PubMed] [Google Scholar]
- 53.Mata-Balaguer T., Cuchillo-Ibañez I., Calero M., Ferrer I., Sáez-Valero J. Decreased generation of C-terminal fragments of ApoER2 and increased reelin expression in Alzheimer’s disease. FASEB J. 2018;32(7):3536–3546. doi: 10.1096/fj.201700736RR. [DOI] [PubMed] [Google Scholar]
- 54.Kamat P.K., Kalani A., Tyagi S.C., Tyagi N. Hydrogen sulfide epigenetically attenuates homocysteine-induced mitochondrial toxicity mediated through NMDA receptor in mouse brain endothelial (bEnd3) cells. J. Cell. Physiol. 2015;230(2):378–394. doi: 10.1002/jcp.24722. [DOI] [PMC free article] [PubMed] [Google Scholar]
- 55.Farina N., Jernerén F., Turner C., Hart K., Tabet N. Homocysteine concentrations in the cognitive progression of Alzheimer’s disease. Exp. Gerontol. 2017;99:146–150. doi: 10.1016/j.exger.2017.10.008. [DOI] [PubMed] [Google Scholar]
- 56.Obersby D., Chappell D.C., Dunnett A., Tsiami A.A. Plasma total homocysteine status of vegetarians compared with omnivores: a systematic review and meta-analysis. Br. J. Nutr. 2013;109(5):785–794. doi: 10.1017/S000711451200520X. [DOI] [PubMed] [Google Scholar]
- 57.Zhou F., Chen S. Hyperhomocysteinemia and risk of incident cognitive outcomes: An updated dose-response meta-analysis of prospective cohort studies. Ageing Res. Rev. 2019;51:55–66. doi: 10.1016/j.arr.2019.02.006. [DOI] [PubMed] [Google Scholar]
- 58.Di Meco A., Li J.G., Praticò D. Dissecting the role of 5-Lipoxygenase in the homocysteine-induced Alzheimer’s disease pathology. J. Alzheimers Dis. 2018;62(3):1337–1344. doi: 10.3233/JAD-170700. [DOI] [PMC free article] [PubMed] [Google Scholar]
- 59.Yu L., Petyuk V.A., Tasaki S., Boyle P.A., Gaiteri C., Schneider J.A., De Jager P.L., Bennett D.A. Association of cortical β-Amyloid protein in the absence of insoluble deposits with alzheimer disease. JAMA Neurol. 2019;76(7):818–826. doi: 10.1001/jamaneurol.2019.0834. [DOI] [PMC free article] [PubMed] [Google Scholar]
- 60.Sevigny J., Chiao P., Bussière T., Weinreb P.H., Williams L., Maier M., Dunstan R., Salloway S., Chen T., Ling Y., O’Gorman J., Qian F., Arastu M., Li M., Chollate S., Brennan M.S., Quintero-Monzon O., Scannevin R.H., Arnold H.M., Engber T., Rhodes K., Ferrero J., Hang Y., Mikulskis A., Grimm J., Hock C., Nitsch R.M., Sandrock A. The antibody aducanumab reduces Aβ plaques in Alzheimer’s disease. Nature. 2016;537(7618):50–56. doi: 10.1038/nature19323. [DOI] [PubMed] [Google Scholar]
- 61.Cai Q., Tammineni P. Mitochondrial aspects of synaptic dysfunction in Alzheimer’s disease. J. Alzheimers Dis. 2017;57(4):1087–1103. doi: 10.3233/JAD-160726. [DOI] [PMC free article] [PubMed] [Google Scholar]
- 62.Sagare A.P., Bell R.D., Zhao Z., Ma Q., Winkler E.A., Ramanathan A., Zlokovic B.V. Pericyte loss influences Alzheimer-like neurodegeneration in mice. Nat. Commun. 2013;4:2932. doi: 10.1038/ncomms3932. [DOI] [PMC free article] [PubMed] [Google Scholar] [Retracted]
- 63.Michno W., Nyström S., Wehrli P., Lashley T., Brinkmalm G., Guerard L., Syvänen S., Sehlin D., Kaya I., Brinet D., Nilsson K.P.R., Hammarström P., Blennow K., Zetterberg H., Hanrieder J. Pyroglutamation of amyloid-βx-42 (Aβx-42) followed by Aβ1-40 deposition underlies plaque polymorphism in progressing Alzheimer’s disease pathology. J. Biol. Chem. 2019;294(17):6719–6732. doi: 10.1074/jbc.RA118.006604. [DOI] [PMC free article] [PubMed] [Google Scholar]
- 64.Nigam S.M., Xu S., Kritikou J.S., Marosi K., Brodin L., Mattson M.P. Exercise and BDNF reduce Aβ production by enhancing α-secretase processing of APP. J. Neurochem. 2017;142(2):286–296. doi: 10.1111/jnc.14034. [DOI] [PMC free article] [PubMed] [Google Scholar]
- 65.Sun L., Zhou R., Yang G., Shi Y. Analysis of 138 pathogenic mutations in presenilin-1 on the in vitro production of Aβ42 and Aβ40 peptides by γ-secretase. Proc. Natl. Acad. Sci. USA. 2017;114(4):E476–E485. doi: 10.1073/pnas.1618657114. [DOI] [PMC free article] [PubMed] [Google Scholar]
- 66.Bossak-Ahmad K., Mital M., Płonka D., Drew S.C., Bal W. Oligopeptides generated by neprilysin degradation of β-Amyloid have the highest Cu(II) affinity in the whole Aβ family. Inorg. Chem. 2019;58(1):932–943. doi: 10.1021/acs.inorgchem.8b03051. [DOI] [PubMed] [Google Scholar]
- 67.Kurochkin I.V., Guarnera E., Berezovsky I.N. Insulin-degrading enzyme in the fight against Alzheimer’s disease. Trends Pharmacol. Sci. 2018;39(1):49–58. doi: 10.1016/j.tips.2017.10.008. [DOI] [PubMed] [Google Scholar]
- 68.Iwata A., Nagata K., Hatsuta H., Takuma H., Bundo M., Iwamoto K., Tamaoka A., Murayama S., Saido T., Tsuji S. Altered CpG methylation in sporadic Alzheimer’s disease is associated with APP and MAPT dysregulation. Hum. Mol. Genet. 2014;23(3):648–656. doi: 10.1093/hmg/ddt451. [DOI] [PubMed] [Google Scholar]
- 69.Schupf N., Zigman W.B., Tang M.X., Pang D., Mayeux R., Mehta P., Silverman W. Change in plasma Aß peptides and onset of dementia in adults with Down syndrome. Neurology. 2010;75(18):1639–1644. doi: 10.1212/WNL.0b013e3181fb448b. [DOI] [PMC free article] [PubMed] [Google Scholar]
- 70.Kim Y.E., Cho H., Kim H.J., Na D.L., Seo S.W., Ki C.S. PSEN1 variants in Korean patients with clinically suspicious early-onset familial Alzheimer’s disease. Sci. Rep. 2020;10(1):3480. doi: 10.1038/s41598-020-59829-z. [DOI] [PMC free article] [PubMed] [Google Scholar]
- 71.West R.L., Lee J.M., Maroun L.E. Hypomethylation of the amyloid precursor protein gene in the brain of an Alzheimer’s disease patient. J. Mol. Neurosci. 1995;6(2):141–146. doi: 10.1007/BF02736773. [DOI] [PubMed] [Google Scholar]
- 72.Huang P., Sun J., Wang F., Luo X., Zhu H., Gu Q., Sun X., Liu T., Sun X. DNMT1 and Sp1 competitively regulate the expression of BACE1 in A2E-mediated photo-oxidative damage in RPE cells. Neurochem. Int. 2018;121:59–68. doi: 10.1016/j.neuint.2018.09.001. [DOI] [PubMed] [Google Scholar]
- 73.Wang S.C., Oelze B., Schumacher A. Age-specific epigenetic drift in late-onset Alzheimer’s disease. PLoS One. 2008;3(7):e2698. doi: 10.1371/journal.pone.0002698. [DOI] [PMC free article] [PubMed] [Google Scholar]
- 74.Bourke L.M., Del Monte-Nieto G., Outhwaite J.E., Bharti V., Pollock P.M., Simmons D.G., Adam A., Hur S.S., Maghzal G.J., Whitelaw E., Stocker R., Suter C.M., Harvey R.P., Harten S.K. Loss of Rearranged L-Myc Fusion (RLF) results in defects in heart development in the mouse. Differentiation. 2017;94:8–20. doi: 10.1016/j.diff.2016.11.004. [DOI] [PubMed] [Google Scholar]
Associated Data
This section collects any data citations, data availability statements, or supplementary materials included in this article.
Data Availability Statement
Not applicable.


