

Abstract
Microcantilevers are widely employed as mass sensors for biological samples, from single molecules to single cells. However, the accurate mass quantification of living adherent cells is impaired by the microcantilever’s mass sensitivity and cell migration, both of which can lead to detect masses mismatching by ≫50%. Here, we design photothermally actuated microcantilevers to optimize the accuracy of cell mass measurements. By reducing the inertial mass of the microcantilever using a focused ion beam, we considerably increase its mass sensitivity, which is validated by finite element analysis and experimentally by gelatin microbeads. The improved microcantilevers allow us to instantly monitor at much improved accuracy the mass of both living HeLa cells and mouse fibroblasts adhering to different substrates. Finally, we show that the improved cantilever design favorably restricts cell migration and thus reduces the large measurement errors associated with this effect.
Keywords: Nanobiotechnology, biosensors, microcantilevers, live-cell sensing, single-cell, mass sensing, mass resolution, focused ion beam
Investigating the regulatory
processes of cell volume and growth is essential to understand the
development and homeostasis of multicellular organisms.1,2 However, the accurate quantification of some basic physical observables
in cell biology and physiology such as cell mass is currently limited
by a lack of suitable measuring tools. For instance, optical microscopy-based
approaches3,4 report the dry mass of single cells, while
suspended microchannel resonators5,6 are not suitable
to measure the mass of cells in the adherent state. Alongside these
techniques, microcantilevers are widely employed microelectromechanical
systems for biological sensing7−9 and imaging,10 with one of their emerging application being mass spectroscopy.11−13 The common working principle of microcantilever-based mass sensing
relies on the detection of a shift in the natural resonance frequency  of the microcantilever that occurs upon
attaching an analyte to the microcantilever.14 Thereby, the oscillating microcantilever can be actuated acoustically,15 electromagnetically,16 or photothermally.17 This shift of the
cantilever resonance frequency is converted into the attached mass
of the microcantilever that occurs upon
attaching an analyte to the microcantilever.14 Thereby, the oscillating microcantilever can be actuated acoustically,15 electromagnetically,16 or photothermally.17 This shift of the
cantilever resonance frequency is converted into the attached mass  of the analyte via the following equation:
| 1 |
where  is the spring constant of the microcantilever
and
is the spring constant of the microcantilever
and  the natural resonance frequency of the
microcantilever. The mass sensitivity of a microcantilever sensor
is defined as the change in resonance frequency due to each unit of
mass load:18,19
the natural resonance frequency of the
microcantilever. The mass sensitivity of a microcantilever sensor
is defined as the change in resonance frequency due to each unit of
mass load:18,19
| 2 |
where  is the mass of the microcantilever. With
this principle, tipless microcantilevers have proved successful for
the detection of antigens,20 single proteins,21 bacteria,22 yeast,23,24 and mammalian cells.5,25 The sensitivity of the technique
varies from tens of kilodaltons, useful for antibody detection,21 up to a mass detection in the picogram range
of small cells, such as yeast.23 However,
the accurate mass quantification of larger cells such as mammalian
cells requires a higher detection sensitivity for samples in the nanogram
range. This is technically challenging since the size of the oscillating
microcantilever needs to be upscaled to accommodate the much larger
adherent cell. In addition, the cantilever mass has to be much larger
than the attached mass to apply eq 1.26,27 However, by increasing the mass
of the oscillating microcantilever, its sensitivity reduces according
to eq 2. It was reported
that conventional microelectromechanical system (MEMS)-based mass
sensors measure only ≈75% of the mass expected for single adherent
cells.28 In addition, much larger oscillators
might require higher energy to be actuated around their resonance
frequency and to measure masses at a sufficient accuracy. In the case
of photothermal actuation, one must thus apply higher laser power,
which could result in phototoxicity or other interferences with the
cell measurements.29 For these reasons,
the sensitivity of microresonators for single-cell mass sensing must
be optimized.
is the mass of the microcantilever. With
this principle, tipless microcantilevers have proved successful for
the detection of antigens,20 single proteins,21 bacteria,22 yeast,23,24 and mammalian cells.5,25 The sensitivity of the technique
varies from tens of kilodaltons, useful for antibody detection,21 up to a mass detection in the picogram range
of small cells, such as yeast.23 However,
the accurate mass quantification of larger cells such as mammalian
cells requires a higher detection sensitivity for samples in the nanogram
range. This is technically challenging since the size of the oscillating
microcantilever needs to be upscaled to accommodate the much larger
adherent cell. In addition, the cantilever mass has to be much larger
than the attached mass to apply eq 1.26,27 However, by increasing the mass
of the oscillating microcantilever, its sensitivity reduces according
to eq 2. It was reported
that conventional microelectromechanical system (MEMS)-based mass
sensors measure only ≈75% of the mass expected for single adherent
cells.28 In addition, much larger oscillators
might require higher energy to be actuated around their resonance
frequency and to measure masses at a sufficient accuracy. In the case
of photothermal actuation, one must thus apply higher laser power,
which could result in phototoxicity or other interferences with the
cell measurements.29 For these reasons,
the sensitivity of microresonators for single-cell mass sensing must
be optimized.
Another important factor to consider when designing microresonators for mass sensing is their mass resolution, which is the minimum detectable mass that can be found via the minimum detectable frequency shift:
| 3 |
where  is the Boltzmann constant,
  is the absolute temperature,
  is the detection bandwidth,
  is the quality factor, and
  is amplitude of the cantilever. Equation 3 shows that the detectable
frequency shift depends on the amplitude. Thus, to optimize the system
resolution, the actuation mechanism has to be considered as main aspect.
Most established atomic force microscopy (AFM)-based techniques for
mass sensing rely on acoustically actuated microcantilevers, whereby
a vibrating piezoelectric crystal induces cantilever oscillations.30,31 This acoustic actuation presents major drawbacks when operated in
fluid, as the indirect energy transfer via the surrounding environment
actuates multiple additional resonances, which lead to noisy cantilever
responses and reduced resolution.32 However,
photothermal actuation is much better suited for microcantilevers
due to the much reduced thermal noise.33 Among photothermal actuation-based AFM technologies,17,34,35 a picobalance was recently introduced
to directly measure the fast changes in the inertial mass of single
mammalian cells.36 While optically observing
the cell morphology and state, the oscillating microcantilever of
the picobalance allows us to measure the mass of adherent cells at
millisecond time resolution over the time course of several days and
at picogram mass sensitivity. This picobalance consists of a silicon
microcantilever which is mounted on an inverted optical microscope
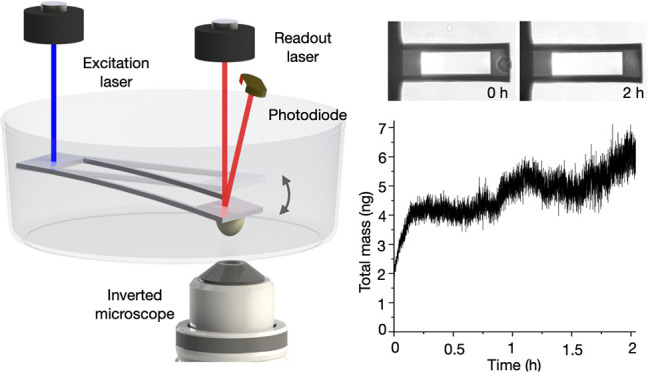
and operates under cell culture conditions (Figure 1a). The microcantilever is photothermally
actuated by a low-power intensity-modulated blue laser (405 nm, ≤50
μW), which is focused at the base of the cantilever to generate
very small oscillation amplitudes of ≈1–15 Å. The
shift in natural resonance frequency, which occurs upon cell attachment,
is tracked via an infrared laser (852 nm) that is reflected from the
free oscillating end of the microcantilever onto a photodiode, through
either a phase-locked loop (PLL) as feedback system or continuous
frequency sweeps of the cantilever.
is amplitude of the cantilever. Equation 3 shows that the detectable
frequency shift depends on the amplitude. Thus, to optimize the system
resolution, the actuation mechanism has to be considered as main aspect.
Most established atomic force microscopy (AFM)-based techniques for
mass sensing rely on acoustically actuated microcantilevers, whereby
a vibrating piezoelectric crystal induces cantilever oscillations.30,31 This acoustic actuation presents major drawbacks when operated in
fluid, as the indirect energy transfer via the surrounding environment
actuates multiple additional resonances, which lead to noisy cantilever
responses and reduced resolution.32 However,
photothermal actuation is much better suited for microcantilevers
due to the much reduced thermal noise.33 Among photothermal actuation-based AFM technologies,17,34,35 a picobalance was recently introduced
to directly measure the fast changes in the inertial mass of single
mammalian cells.36 While optically observing
the cell morphology and state, the oscillating microcantilever of
the picobalance allows us to measure the mass of adherent cells at
millisecond time resolution over the time course of several days and
at picogram mass sensitivity. This picobalance consists of a silicon
microcantilever which is mounted on an inverted optical microscope
and operates under cell culture conditions (Figure 1a). The microcantilever is photothermally
actuated by a low-power intensity-modulated blue laser (405 nm, ≤50
μW), which is focused at the base of the cantilever to generate
very small oscillation amplitudes of ≈1–15 Å. The
shift in natural resonance frequency, which occurs upon cell attachment,
is tracked via an infrared laser (852 nm) that is reflected from the
free oscillating end of the microcantilever onto a photodiode, through
either a phase-locked loop (PLL) as feedback system or continuous
frequency sweeps of the cantilever.
Figure 1.

Sculpting microcantilevers for improved
mass sensitivity. (a) The
AFM-based cell balance (picobalance) uses a resonating microcantilever.
A blue laser photothermally actuates the microcantilever at its fixed
end. The infrared laser, which is reflected from the free end of the
microcantilever onto a photodiode, measures the cantilever deflection
and resonance frequency. (b) Top view SEM images of rectangular (LC)
and FIB-modified (HC) cantilevers. Scale bars, 50 μm. (c) Since
HC cantilevers have a lower inertial mass, the shift of their resonance
frequency upon cell attachment is higher compared to standard rectangular
LC cantilevers ( ), yielding to a better mass sensitivity.
(d) Power spectral density (PSD) of thermal noise-induced cantilever
deflection in liquid as a function of the oscillation frequency shows
a lower resonance peak for HC cantilevers. (e) Comparison of the signal-to-noise-ratio
(SNR) for the two different cantilever designs. All measurements were
carried out in cell culture medium at 37 °C.
), yielding to a better mass sensitivity.
(d) Power spectral density (PSD) of thermal noise-induced cantilever
deflection in liquid as a function of the oscillation frequency shows
a lower resonance peak for HC cantilevers. (e) Comparison of the signal-to-noise-ratio
(SNR) for the two different cantilever designs. All measurements were
carried out in cell culture medium at 37 °C.
In summary, live cell mass measurements using microcantilevers are associated with several drawbacks. To characterize the mass of larger cells such as mammalian cells, the cantilever size needs to be upscaled, which goes at the cost of the mass sensitivity of the measurement. In addition, cells that do not adhere at sufficient strength to the microcantilever cannot be detected properly.28 Also, most mass sensors assume that the measured analyte (here a cell) can be approximated by a point mass positioned at the free end of the cantilever,12,37 which does not influence the mode shape and the velocity of the cantilever oscillation.38 However, because the center of mass of adherent three-dimensional cells is rather difficult to approximate from two-dimensional optical microscopy images, the movement and migration of a cell, which goes hand in hand with cell shape changes, can lead to largely incorrect estimations of the center of mass and thus of the total mass of the cell.23 Here, we address the cell mass sensitivity and cell migration problem of employing photothermally actuated microcantilevers to measure the mass of mammalian adherent cells.
The performance of microcantilever-based mass sensors may be increased by changing the actuation approach, from piezoelectric to photothermal.39 Other than the actuation, additional factors can be considered when optimizing the sensitivity of AFM-based tools, such as the geometry and material selection of the cantilever.40 To increase the mass sensitivity of photothermally actuated microcantilevers, we aimed at decreasing their inertial mass according to eq 2. To this end, we modified commonly used rectangular-shaped microcantilevers (hereafter called LC cantilevers)36 with dimension of ≈120 × 45 × 2 (L × W × T) μm3, by cutting out a rectangular section of the cantilever beam using focused ion beam (FIB) lithography (hereafter called HC cantilevers; Figure 1b). Although this modification is very similar to that introduced recently to improve cantilevers for single-molecule force spectroscopy,41,42 it here targets very different aims. The cutout section had the dimensions of ≈80 × 30 × 2 μm3 (Figure S1), which resulted in a theoretical mass reduction of the cantilever by ≈45%. In principle, the reduced mass of the cantilever should result in a higher resonance frequency shift upon cell attachment, thus providing the measurement with higher mass sensitivity (Figure 1c). The power spectral density (PSD) of the two cantilever designs identifies the peak of the first flexural mode of oscillation driven by thermal noise only (Figure 1d). The resonance peak is found at ≈70 kHz and ≈55 kHz for LC and for HC cantilevers, respectively. Since the area under the PSD curve directly correlates with the mean square deflection of each flexural mode,43 the smaller peak height of the HC cantilever design indicates that this geometry shows lower cantilever deflections due to thermal noise. Finally, we find that the signal-to-noise ratio (SNR) of HC cantilevers increases by >70% across the frequency range encompassing both resonance frequency peaks (Figure 1e). This finding is consistent with a similar cantilever design that was previously evaluated for piezoresistive sensors and found to increase the SNR by >22% compared to unmodified cantilevers.44
Next, we determined the cantilever specifications
in cell culture
medium at 37 °C using the picobalance setup (Figure 1a) and measured the cantilever
amplitudes over a ±19.5 kHz frequency range with respect to their
resonance frequency. Due to the photothermal actuation, the amplitude
signals were extremely sharp for both LC and HC cantilevers (Figure 2a,b). Whereas on
average LC cantilevers had a maximum amplitude of 0.18 ± 0.11
nm (mean ± sd), HC cantilevers had a much higher maximum amplitude
of 0.57 ± 0.16 nm (Figure 2c). The average resonance frequency of the HC cantilevers
(56.56 ± 8.56 kHz) was lower compared to the average resonance
frequency of LC cantilevers (77.13 ± 4.54 kHz; Figure 2d). The quality factor (Q factor) of the microcantilevers followed a similar trend
as the resonance frequency and dropped from 5.86 ± 0.29 to 3.07
± 0.2 (Figure 2e). Accordingly, the spring constant of the HC cantilevers 3.36 ±
0.91 N m–1 was much lower compared to the spring
constant of 14.99 ± 4.56 N m–1 for LC cantilevers
(Figure 2f). Given
the relation between resonance frequency and spring constant of harmonic
oscillators,45 we can estimate the effective
mass  of the cantilever as
| 4 |
Figure 2.

Comparison of cantilever specifications in liquid. (a, b) Individual (left) and average (right) amplitude curves for LC and HC cantilevers. Amplitudes are centered around their resonance frequency value and recorded for a frequency range of ±19.50 kHz. Average curves are presented as mean (black line) and sd (gray area). (c) Comparing the maximum amplitude between LC and HC cantilevers shows significantly higher amplitudes for HC cantilevers. (d–f) The resonance frequency, Q factor, and spring constant of HC are significantly lower compared than the respective values for LC cantilevers. Data in (c)–(f) are presented as the mean ± sd, and n indicates the number of independent measurements performed. A new cantilever was taken for each independent measurement. Statistical differences were evaluated applying the Mann–Whitney test. All measurements were carried out in cell culture medium at 37 °C.
From these measurements, we estimated the effective mass of LC cantilevers in liquid to be 64.20 ± 20.62 ng and for HC cantilevers 30.78 ± 16.15 ng, which leads us to estimate their sensitivities (eq 2) of 0.60 kHz ng–1 and 0.92 kHz ng–1, respectively.
To experimentally validate the higher sensitivity of the HC cantilevers, we attached 5% gelatin microbeads to the cantilevers and compared the resulting resonance frequency shifts for the two different cantilever designs (Figure 3a). As expected, attaching gelatin beads with diameters between 14 and 20 μm to the cantilever resulted in a higher frequency shift on the HC cantilevers compared to LC cantilevers. The finite element simulations of the frequency shifts obtained for different bead diameters (methods in Supporting Information) are in good agreement with the recorded data. We then estimated the expected mass of the measured gelatin beads by assuming a spherical bead volume derived by the diameter values estimated via optical microscopy images and multiplying the volume by the theoretical density46 of 1.050 g cm–3. In the ideal case, the slope of the linear fit derived by comparing the optically derived expected masses with the masses measured via microcantilevers would be 1, thus indicating a 1:1 relationship. However, Figure 3b shows that the linear fit for the HC cantilever has a slope of 0.73 while the LC cantilevers has a much lower slope of 0.15. The difference between the measured slope and the ideal slope for HC cantilevers might be due to errors introduced by approximating the mass of beads from optical microscopy images. Nevertheless, the higher slope of the HC cantilevers indicates that the inertial masses of the gelatin microbeads measured with this cantilever geometry were much closer to their expected mass. On the other hand, the significantly lower slope of the LC cantilevers indicates that their sensitivity is not sufficient to detect the mass of the gelatin beads.
Figure 3.

Validation of cantilever sensitivity with gelatin microbeads. (a) Frequency shifts recorded for 5% gelatin microbeads of different diameters for both LC and HC cantilevers. The bead diameters were estimated via optical microscopy. Finite element simulations of the frequency shift obtained for different bead diameters are shown alongside the recorded data. (b) Inertial mass of gelatin beads extracted via the picobalance (measured mass) plotted against the theoretical inertial mass (expected mass). A linear fit of the data is shown (solid lines) with the fitting parameters given. Data are presented as mean ± sd, and each data point is collected using a different bead and cantilever to avoid bias. All measurements were carried out in cell culture medium at 37 °C.
To compare the performance of the LC and HC cantilevers for live cells measurements, we quantified the mass of single HeLa cells attached to cantilevers coated with collagen I (Col I) or concanavalin A (ConA) and of mouse fibroblasts attached to cantilevers coated with fibronectin (Figure 4a). The different coatings influenced the cantilever resonance frequency by less than 2% (Figure S3), hence the mass values measured with the cantilevers are comparable. As a reference, we first calculated an expected mass of the cell lines by measuring their diameter in bulk via a Coulter counter device and multiplying the cell volume estimations with reported density values of 1.06 g mL–1 for HeLa cells and 1.13 g mL–1 for mouse fibroblasts (Figure 4b,c).36 Next, we attached a single HeLa cell or fibroblast to the free end of the cantilever by lowering the substrate-coated cantilever until it gently compressed the rounded cell by ≈1 μm for 20 s, after which time we subsequently retracted the cantilever and attached cell. By optical microscopy, we monitored the morphology of the cell and ensured that the pickup process did not harm the cell. We allowed the cell to establish firm adhesion to the cantilever for 2 min before measuring its mass using the sweep mode (methods in Supporting Information). The results show that masses of single HeLa cells measured with Col I- or ConA-coated HC cantilevers (2.86 ± 0.86 ng for Col I and 2.10 ± 1.03 ng for ConA) are in good agreement with the cell mass distribution estimated from bulk measurements. In contrast, the LC cantilevers significantly underestimated the mass of HeLa cells (0.53 ± 0.31 ng on Col I and 0.93 ± 0.43 ng on ConA). Additionally, we quantified the mass of engineered fibroblasts that express distinct sets of fibronectin-specific adhesion receptors (pKO-αV/β1 and pKO-αV) as well as their parental wild-type fibroblast cell line.47 In agreement with previous reports,48 the bulk experiments showed that pKO-αV fibroblasts have a lower diameter compared to pKO-αV/β1 and wild-type fibroblasts, which translate to an expected mass of 1.44 ng for single pKO-αV cells and of 1.83 ng and 1.75 ng for pKO-αV/β1 and wild-type fibroblasts, respectively (Figure 4c). Similar to HeLa cells, HC cantilevers measured masses of single fibroblasts that matched the bulk measurement (1.74 ± 0.82 ng for wild-type, 1.79 ± 0.67 ng for pKO-αV/β1, and 1.34 ± 0.62 ng for pKO-αV fibroblasts), while the LC cantilevers considerably underestimated the mass of all fibroblast lines (0.84 ± 0.43 ng for wild-type, 0.74 ± 0.41 ng for pKO-αV/β1, and 0.42 ± 0.19 ng for pKO-αV fibroblasts).
Figure 4.

Cell mass measurements. (a) Optical microscopy of LC and HC cantilevers with a round wild-type fibroblast cell attached at the free end. Scale bar, 20 μm. (b) Coulter counter measurements of suspended HeLa cells (left) compared to single cell cantilever measurements (right). The mass displayed in the Coulter counter distribution is obtained by multiplying the estimated volume of suspended cells by an average density value found in literature. Both LC and HC cantilever designs were covered with Col I or ConA. (c) Wild-type, pKO-αV/β1, and pKO-αV fibroblasts Coulter counter measurements compared to cantilever mass measurements on fibronectin (FN) for both different cantilever designs. Data are presented as mean ± sd, and n indicates the number of independent measurements performed. For each Coulter counter measurement, a new cell flask was taken. For each independent single cell measurement, a new cantilever and a new cell was taken. Each data point represents a single cell measurement. Statistical differences were evaluated applying the Mann–Whitney test. All mass measurements were carried out in cell culture medium at 37 °C.
The shift in resonance frequency also depends on
the position of
the cell along the longitudinal axis of the cantilever beam, as the
mass sensitivity is maximized at the free end of the cantilever.49 The correct mass readout thus requires a correction
factor,24,36 which substitutes the cell position  into the mode shape amplitude equation
for rectangular cantilevers beams:
into the mode shape amplitude equation
for rectangular cantilevers beams:
| 5 |
where  is a normalizing constant such that
  and
and  is the length of the cantilever (Figure 5a). The parameter ξ, which depends on the cantilever length, can be
determined by solving the equation 1 = – cos (ξL)cosh(ξL). The total effective
mass is then calculated as
is the length of the cantilever (Figure 5a). The parameter ξ, which depends on the cantilever length, can be
determined by solving the equation 1 = – cos (ξL)cosh(ξL). The total effective
mass is then calculated as  where
where  ξ is the apparent mass of the cell
calculated from the resonance frequency shift (eq 1).36 From the correction
factor, we evaluated the apparent mass change for two different cells
with their respective center of mass initially located at 5 and 20
μm from the free end and moving toward either end of the cantilever. Figure 5b shows that the
correction factor can influence the apparent mass readout by >60%
as observed for distances >20 μm. To understand how wild-type
fibroblasts behave on each of the two different cantilever designs,
we evaluated their average migration distance and spreading area over
the time course of a 2 h long mass measurement (Figure 5c). The position of the cell on the cantilever
was estimated by the geometrical center of the cellular outline imaged
by optical microscopy. Whereas fibroblasts on HC cantilevers remained
within 10–12 μm from the free end of the cantilever,
fibroblasts on LC cantilevers freely migrated along the cantilever
beam by up to 25 μm from the free end. Given the upward trend
of the migration curve of fibroblasts on LC cantilevers, one may expect
that the migrated distance would increase further for longer time
measurements. Considering the large migration distance of fibroblasts
on LC cantilevers of up to 25 μm, the rather large correction
factor of the cell mass (Figure 5a,b) would introduce an apparent cell mass change of
>60% and thus also introduce a large error. On the other hand,
the
apparent cell mass change introduced by the correction factor is <30%
for HC cantilevers. At the same time, there is no significant difference
in the spreading area of fibroblasts grown on either LC or HC cantilevers
for 2 h (Figure 5d),
thus suggesting that the HC cantilever geometry does not impair cell
spreading over the time frames tested.
ξ is the apparent mass of the cell
calculated from the resonance frequency shift (eq 1).36 From the correction
factor, we evaluated the apparent mass change for two different cells
with their respective center of mass initially located at 5 and 20
μm from the free end and moving toward either end of the cantilever. Figure 5b shows that the
correction factor can influence the apparent mass readout by >60%
as observed for distances >20 μm. To understand how wild-type
fibroblasts behave on each of the two different cantilever designs,
we evaluated their average migration distance and spreading area over
the time course of a 2 h long mass measurement (Figure 5c). The position of the cell on the cantilever
was estimated by the geometrical center of the cellular outline imaged
by optical microscopy. Whereas fibroblasts on HC cantilevers remained
within 10–12 μm from the free end of the cantilever,
fibroblasts on LC cantilevers freely migrated along the cantilever
beam by up to 25 μm from the free end. Given the upward trend
of the migration curve of fibroblasts on LC cantilevers, one may expect
that the migrated distance would increase further for longer time
measurements. Considering the large migration distance of fibroblasts
on LC cantilevers of up to 25 μm, the rather large correction
factor of the cell mass (Figure 5a,b) would introduce an apparent cell mass change of
>60% and thus also introduce a large error. On the other hand,
the
apparent cell mass change introduced by the correction factor is <30%
for HC cantilevers. At the same time, there is no significant difference
in the spreading area of fibroblasts grown on either LC or HC cantilevers
for 2 h (Figure 5d),
thus suggesting that the HC cantilever geometry does not impair cell
spreading over the time frames tested.
Figure 5.

Dependency of the center of mass position of an adherent cell on the cell mass measurement. (a) Correction factor of the cell mass plotted against the position of the center of mass (c.o.m.) of a cell as measured from the free end of a 120 μm long microcantilever beam. The dependency of the two positions indicated at 5 and 20 μm on the apparent mass change of the cell are given in (b). (b) Apparent mass changes for a cell having its center of mass at 5 or 20 μm distance from the free cantilever end. The apparent mass changes are relative to the cell mass experimentally measured by the resonating microcantilever. Experimental results showing the effect of the correction factor of the apparent cell mass are shown in Figure S4. (c) Average migration distance from the free end of wild-type fibroblasts on LC and HC cantilevers over the time course of 2 h. (d) Average spreading area of wild-type fibroblasts growing on LC and HC cantilevers for 2 h. Data are presented as mean ± sd, and n indicates the number of independent experimental measurements performed, with each measurement taking a new cell and cantilever. Statistical differences were evaluated applying the Mann–Whitney test.
In conclusion, we have optimized the design of photothermally actuated microcantilevers to measure the inertial mass of adherent cells. By removing a rectangular section from the center of the microcantilever, we reduced its total inertial mass. This modification considerably reduced the thermal noise and increased the SNR compared to rectangular cantilever beams, such as commonly used in mass sensing. By analyzing the performance of the newly designed HC cantilevers and rectangular LC cantilevers in cell culture medium, we find that HC cantilevers show significantly higher amplitudes at the same actuation laser power. This means that compared to LC cantilevers, the laser power needed to actuate HC cantilevers can be kept much lower such as needed to avoid phototoxicity for the cells and to avoid compromising the quality of the mass measurement. Because of the reduced resonance frequency and spring constant of HC cantilevers, their mass sensitivity is ≈50% higher compared to standard rectangular LC cantilevers. After validating the mass sensitivity via finite element simulations and by measuring the mass of gelatin microbeads having different diameters, we tested the new cantilever HC design with live cell measurements. We measured both HeLa cells and mouse fibroblasts on cantilevers coated with different substrates and consistently measured higher cell masses with HC cantilevers. The cell masses measured with HC cantilevers were consistent with cell masses derived via Coulter counter measurements.
Finally, we investigated the effect of cell migration on the cell mass measurements, as cell movement along the cantilever length could greatly impair the outcome of cell mass measurements. The HC cantilever design restricted the cell migration, and thus the correction factor to calculate the total cell mass was always <30%. In contrast, with normal cantilevers this correction factor could change the measured cell mass by up to 60% and thus introduce very large errors. Advantageously, the spatial restriction of the cell by the HC cantilever design kept the cell far away from the blue actuation laser, thus reducing potential phototoxicity effects. Additionally, the HC cantilever design did not affect the spreading area of cells, which shows that the cantilever did not affect cell growth dynamics over 2 h time frames. Overall, the new cantilever design proved useful for monitoring the mass dynamics of single adherent cells in cell culture conditions. These advancements open up the possibility to evaluate the cell growth in response to different cantilever coatings and/or chemical stimulation at improved mass sensitivity and reduced experimental error. In the future, our results might be used as benchmark for the establishment of higher cantilever modes for mass measurements of living cells in liquid. Currently, applying such higher modes for mass measurements is limited by the poor time resolution needed to record these modes and by the phototoxicity caused by the higher laser power required to oscillate the microcantilevers. Moreover, the new cantilever design may also prove useful for many other AFM-based applications using photothermally actuated microcantilevers and thus opens a wide area of potential applications.
Acknowledgments
We thank R. Fässler (Max Planck Institute of Biochemistry) for providing the fibroblast cell lines and A. A. Hyman (Max Planck Institute of Molecular Cell Biology and Genetics) for providing the HeLa cells used in this study; D. Mathys (Nano Imaging Lab, Swiss Nanoscience Institute, University of Basel) for assisting with scanning electron microscopy and focused ion beam lithography; and Nanosurf AG for technical support and for the custom-made mechanical and electronic components.
Glossary
Abbreviations
- MEMS
microelectromechanical system
- AFM
atomic force microscopy
- PLL
phase-locked loop
- PSD
power spectral density
- FIB
focused ion beam
- SNR
signal-to-noise ratio
- Col I
collagen I
- ConA
concanavalin A
- FN
fibronectin
- pKO
pan-knockout
- c.o.m.
center of mass.
Supporting Information Available
The Supporting Information is available free of charge at https://pubs.acs.org/doi/10.1021/acs.nanolett.2c04198.
Cell culture, microcantilever preparation, picobalance setup, amplitude measurements, cell mass measurements, cell volume measurements and expected mass calculation, gelatin bead fabrication and measurements, finite element simulations, data analysis, microcantilever geometry by SEM, comparison of LC and HC cantilever specifications in air, cantilever coatings influence on resonance frequency, effect of cell migration on the correction of the cell mass measurements, fibronectin coating fluorescence controls, and COMSOL simulations setup (PDF)
Author Contributions
Conceptualization: I.I., D.J.M. Methodology: all authors. Investigation: I.I., S.H., G.F., E.T. Formal analysis, validation, and data curation: I.I., S.H. Visualization: I.I., G.F. Resources: N.S., D.J.M. Outline and writing of original draft: I.I., D.J.M. Review and editing of manuscript: all authors. Supervision: D.J.M.
This work was supported by the NCCR Molecular Systems Engineering of the Swiss National Science Foundation (SNFS, Grant 51NF40-205608), the SNSF (Grant 182587), and the Swiss Innovation Agency (Innosuisse Grant 56599.1 IP-LS).
The authors declare the following competing financial interest(s): D.J.M. has filed two patents related to the technology of the cell picobalance and its applications (US20170052211A1 and WO/2015/120,991). G.F. and D.J.M. have filed a patent related to the environmental chamber (US10545169B2). G.F. has joined Nanosurf AG, which commercializes the picobalance. I.I., S.H., N.S., and E.T. declare no competing interests.
Supplementary Material
References
- Lloyd A. C. The regulation of cell size. Cell 2013, 154 (6), 1194–1205. 10.1016/j.cell.2013.08.053. [DOI] [PubMed] [Google Scholar]
- Guertin D. A.; Sabatini D. M.. Cell Growth. In The Molecular Basis of Cancer; Elsevier, 2015; pp 179–190. [Google Scholar]
- Park Y.; Depeursinge C.; Popescu G. Quantitative phase imaging in biomedicine. Nat. Photonics 2018, 12 (10), 578–589. 10.1038/s41566-018-0253-x. [DOI] [Google Scholar]
- Zlotek-Zlotkiewicz E.; Monnier S.; Cappello G.; Le Berre M.; Piel M. Optical volume and mass measurements show that mammalian cells swell during mitosis. J. Cell Biol. 2015, 211 (4), 765–774. 10.1083/jcb.201505056. [DOI] [PMC free article] [PubMed] [Google Scholar]
- Cermak N.; Olcum S.; Delgado F. F.; Wasserman S. C.; Payer K. R.; A Murakami M.; Knudsen S. M.; Kimmerling R. J.; Stevens M. M.; Kikuchi Y.; et al. High-throughput measurement of single-cell growth rates using serial microfluidic mass sensor arrays. Nat. Biotechnol. 2016, 34 (10), 1052–1059. 10.1038/nbt.3666. [DOI] [PMC free article] [PubMed] [Google Scholar]
- Bryan A. K.; Hecht V. C.; Shen W.; Payer K.; Grover W. H.; Manalis S. R. Measuring single cell mass, volume, and density with dual suspended microchannel resonators. Lab Chip 2014, 14 (3), 569–576. 10.1039/C3LC51022K. [DOI] [PMC free article] [PubMed] [Google Scholar]
- Basu A. K.; Basu A.; Bhattacharya S. Micro/Nano fabricated cantilever based biosensor platform: A review and recent progress. Enzyme Microb. Technol. 2020, 139, 109558. 10.1016/j.enzmictec.2020.109558. [DOI] [PubMed] [Google Scholar]
- Efremov Y. M.; Okajima T.; Raman A. Measuring viscoelasticity of soft biological samples using atomic force microscopy. Soft Matter 2020, 16 (1), 64–81. 10.1039/C9SM01020C. [DOI] [PubMed] [Google Scholar]
- Gil-Santos E.; Ruz J. J.; Malvar O.; Favero I.; Lemaitre A.; Kosaka P. M.; Garcia-Lopez S.; Calleja M.; Tamayo J. Optomechanical detection of vibration modes of a single bacterium. Nat. Nanotechnol. 2020, 15 (6), 469–474. 10.1038/s41565-020-0672-y. [DOI] [PubMed] [Google Scholar]
- Muller D. J.; Dumitru A. C.; Lo Giudice C.; Gaub H. E.; Hinterdorfer P.; Hummer G.; De Yoreo J. J.; Dufrene Y. F.; Alsteens D. Atomic Force Microscopy-Based Force Spectroscopy and Multiparametric Imaging of Biomolecular and Cellular Systems. Chem. Rev. 2021, 121 (19), 11701–11725. 10.1021/acs.chemrev.0c00617. [DOI] [PubMed] [Google Scholar]
- Mouro J.; Pinto R.; Paoletti P.; Tiribilli B. Microcantilever: Dynamical Response for Mass Sensing and Fluid Characterization. Sensors 2021, 21 (1), 115. 10.3390/s21010115. [DOI] [PMC free article] [PubMed] [Google Scholar]
- Chien C.-C.; Jiang J.; Gong B.; Li T.; Gaitas A. AFM microfluidic cantilevers as weight sensors for live single cell mass measurements. Meas. Sci. Technol. 2022, 33 (9), 095009. 10.1088/1361-6501/ac7280. [DOI] [PMC free article] [PubMed] [Google Scholar]
- Popescu G.; Park K.; Mir M.; Bashir R. New technologies for measuring single cell mass. Lab Chip 2014, 14 (4), 646–652. 10.1039/C3LC51033F. [DOI] [PubMed] [Google Scholar]
- Lang H. P.; Gerber C.. Microcantilever Sensors. In STM and AFM Studies on (Bio)molecular Systems: Unravelling the Nanoworld; Topics in Current Chemistry; Springer, 2008; pp 1–27. [DOI] [PubMed] [Google Scholar]
- Kumar V.; Boley J. W.; Yang Y.; Ekowaluyo H.; Miller J. K.; Chiu G. T. C.; Rhoads J. F. Bifurcation-based mass sensing using piezoelectrically-actuated microcantilevers. Appl. Phys. Lett. 2011, 98 (15), 153510–153510-3. 10.1063/1.3574920. [DOI] [Google Scholar]
- Kopiec D.; Pałetko P.; Majstrzyk W.; Kunicki P.; Sierakowski A.; Gotszalk T. Electromagnetically Actuated Microcantilever for Chemical and Biochemical Sensing in Static Mode. Procedia Eng. 2014, 87, 955–958. 10.1016/j.proeng.2014.11.315. [DOI] [Google Scholar]
- Lavrik N. V.; Datskos P. G. Femtogram mass detection using photothermally actuated nanomechanical resonators. Appl. Phys. Lett. 2003, 82 (16), 2697–2699. 10.1063/1.1569050. [DOI] [Google Scholar]
- Ghatkesar M. K.; Barwich V.; Braun T.; Ramseyer J.-P.; Gerber C.; Hegner M.; Lang H. P.; Drechsler U.; Despont M. Higher modes of vibration increase mass sensitivity in nanomechanical microcantilevers. Nanotechnology 2007, 18 (44), 445502. 10.1088/0957-4484/18/44/445502. [DOI] [Google Scholar]
- Shen Z.; Shih W. Y.; Shih W.-H. Mass detection sensitivity of piezoelectric cantilevers with a nonpiezoelectric extension. Rev. Sci. Instrum. 2006, 77 (6), 065101. 10.1063/1.2202913. [DOI] [Google Scholar]
- Lee J. H.; Hwang K. S.; Park J.; Yoon K. H.; Yoon D. S.; Kim T. S. Immunoassay of prostate-specific antigen (PSA) using resonant frequency shift of piezoelectric nanomechanical microcantilever. Biosens. Bioelectron. 2005, 20 (10), 2157–2162. 10.1016/j.bios.2004.09.024. [DOI] [PubMed] [Google Scholar]
- Hanay M. S.; Kelber S.; Naik A. K.; Chi D.; Hentz S.; Bullard E. C.; Colinet E.; Duraffourg L.; Roukes M. L. Single-protein nanomechanical mass spectrometry in real time. Nat. Nanotechnol. 2012, 7 (9), 602–608. 10.1038/nnano.2012.119. [DOI] [PMC free article] [PubMed] [Google Scholar]
- Malvar O.; Ruz J. J.; Kosaka P. M.; Dominguez C. M.; Gil-Santos E.; Calleja M.; Tamayo J. Mass and stiffness spectrometry of nanoparticles and whole intact bacteria by multimode nanomechanical resonators. Nat. Commun. 2016, 7, 13452. 10.1038/ncomms13452. [DOI] [PMC free article] [PubMed] [Google Scholar]
- Labedz B.; Wanczyk A.; Rajfur Z. Precise mass determination of single cell with cantilever-based microbiosensor system. PLoS One 2017, 12 (11), e0188388 10.1371/journal.pone.0188388. [DOI] [PMC free article] [PubMed] [Google Scholar]
- Cuny A. P.; Tanuj Sapra K.; Martinez-Martin D.; Flaschner G.; Adams J. D.; Martin S.; Gerber C.; Rudolf F.; Muller D. J. High-resolution mass measurements of single budding yeast reveal linear growth segments. Nat. Commun. 2022, 13 (1), 3483. 10.1038/s41467-022-30781-y. [DOI] [PMC free article] [PubMed] [Google Scholar]
- Stevens M. M.; Maire C. L.; Chou N.; Murakami M. A.; Knoff D. S.; Kikuchi Y.; Kimmerling R. J.; Liu H.; Haidar S.; Calistri N. L.; et al. Drug sensitivity of single cancer cells is predicted by changes in mass accumulation rate. Nat. Biotechnol. 2016, 34 (11), 1161–1167. 10.1038/nbt.3697. [DOI] [PMC free article] [PubMed] [Google Scholar]
- Gürgöze M. On the representation of a cantilevered beam carrying a tip mass by an equivalent spring–mass system. J. Sound and Vib. 2005, 282 (1–2), 538–542. 10.1016/j.jsv.2004.04.006. [DOI] [Google Scholar]
- Sader J. E.; Hanay M. S.; Neumann A. P.; Roukes M. L. Mass Spectrometry Using Nanomechanical Systems: Beyond the Point-Mass Approximation. Nano Lett. 2018, 18 (3), 1608–1614. 10.1021/acs.nanolett.7b04301. [DOI] [PubMed] [Google Scholar]
- Park K.; Millet L. J.; Kim N.; Li H.; Jin X.; Popescu G.; Aluru N. R.; Hsia K. J.; Bashir R. Measurement of adherent cell mass and growth. Proc. Natl. Acad. Sci. U. S. A. 2010, 107 (48), 20691–20696. 10.1073/pnas.1011365107. [DOI] [PMC free article] [PubMed] [Google Scholar]
- Oplander C.; Hidding S.; Werners F. B.; Born M.; Pallua N.; Suschek C. V. Effects of blue light irradiation on human dermal fibroblasts. J. Photochem. Photobiol. B 2011, 103 (2), 118–125. 10.1016/j.jphotobiol.2011.02.018. [DOI] [PubMed] [Google Scholar]
- Lee Y.; Lim G.; Moon W. A piezoelectric micro-cantilever bio-sensor using the mass-micro-balancing technique with self-excitation. Microsyst. Technol. 2007, 13 (5–6), 563–567. 10.1007/s00542-006-0216-x. [DOI] [Google Scholar]
- Su M.; Li S.; Dravid V. P. Microcantilever resonance-based DNA detection with nanoparticle probes. Appl. Phys. Lett. 2003, 82 (20), 3562–3564. 10.1063/1.1576915. [DOI] [Google Scholar]
- Bircher B. A.; Duempelmann L.; Lang H. P.; Gerber C.; Braun T. Photothermal excitation of microcantilevers in liquid: effect of the excitation laser position on temperature and vibrational amplitude. Micro Nano Lett. 2013, 8 (11), 770–774. 10.1049/mnl.2013.0352. [DOI] [Google Scholar]
- Ramos D.; Tamayo J.; Mertens J.; Calleja M. Photothermal excitation of microcantilevers in liquids. J. Appl. Phys. 2006, 99 (12), 124904. 10.1063/1.2205409. [DOI] [Google Scholar]
- Prashanthi K.; Phani A.; Thundat T. Photothermal Electrical Resonance Spectroscopy of Physisorbed Molecules on a Nanowire Resonator. Nano Lett. 2015, 15 (8), 5658–5663. 10.1021/acs.nanolett.5b02557. [DOI] [PubMed] [Google Scholar]
- Bircher B. A.; Duempelmann L.; Renggli K.; Lang H. P.; Gerber C.; Bruns N.; Braun T. Real-time viscosity and mass density sensors requiring microliter sample volume based on nanomechanical resonators. Anal. Chem. 2013, 85 (18), 8676–8683. 10.1021/ac4014918. [DOI] [PubMed] [Google Scholar]
- Martínez-Martín D.; Fläschner G.; Gaub B.; Martin S.; Newton R.; Beerli C.; Mercer J.; Gerber C.; Müller D. J. Inertial picobalance reveals fast mass fluctuations in mammalian cells. Nature 2017, 550 (7677), 500–505. 10.1038/nature24288. [DOI] [PubMed] [Google Scholar]
- Teva J.; Abadal G.; Torres F.; Verd J.; Perez-Murano F.; Barniol N. A femtogram resolution mass sensor platform based on SOI electrostatically driven resonant cantilever. Part II: sensor calibration and glycerine evaporation rate measurement. Ultramicroscopy 2006, 106 (8–9), 808–814. 10.1016/j.ultramic.2005.12.017. [DOI] [PubMed] [Google Scholar]
- Dohn S.; Svendsen W.; Boisen A.; Hansen O. Mass and position determination of attached particles on cantilever based mass sensors. Rev. Sci. Instrum. 2007, 78 (10), 103303. 10.1063/1.2804074. [DOI] [PubMed] [Google Scholar]
- Labuda A.; Kobayashi K.; Miyahara Y.; Grutter P. Retrofitting an atomic force microscope with photothermal excitation for a clean cantilever response in low Q environments. Rev. Sci. Instrum. 2012, 83 (5), 053703. 10.1063/1.4712286. [DOI] [PubMed] [Google Scholar]
- Mutyala M. S. K.; Bandhanadham D.; Pan L.; Pendyala V. R.; Ji H.-F. Mechanical and electronic approaches to improve the sensitivity of microcantilever sensors. Acta Mech. Sin. 2009, 25 (1), 1–12. 10.1007/s10409-008-0222-6. [DOI] [PMC free article] [PubMed] [Google Scholar]
- Bull M. S.; Sullan R. M. A.; Li H.; Perkins T. T. Improved Single Molecule Force Spectroscopy Using Micromachined Cantilevers. ACS Nano 2014, 8 (5), 4984–4995. 10.1021/nn5010588. [DOI] [PubMed] [Google Scholar]
- Edwards D. T.; Faulk J. K.; LeBlanc M. A.; Perkins T. T. Force Spectroscopy with 9-mus Resolution and Sub-pN Stability by Tailoring AFM Cantilever Geometry. Biophys. J. 2017, 113 (12), 2595–2600. 10.1016/j.bpj.2017.10.023. [DOI] [PMC free article] [PubMed] [Google Scholar]
- Geitner M.; Aguilar Sandoval F.; Bertin E.; Bellon L. Low thermal fluctuations in a system heated out of equilibrium. Phys. Rev. E 2017, 95 (3–1), 032138. 10.1103/PhysRevE.95.032138. [DOI] [PubMed] [Google Scholar]
- Ansari M. Z.; Cho C. High S/N ratio slotted step piezoresistive microcantilever designs for biosensors. Sensors (Basel) 2013, 13 (4), 4088–4101. 10.3390/s130404088. [DOI] [PMC free article] [PubMed] [Google Scholar]
- Meirovitch L.; Parker R. Fundamentals of Vibrations. Appl. Mech. Rev. 2001, 54 (6), 98–101. 10.1115/1.1421112. [DOI] [Google Scholar]
- Mitchell B.; Yokoyama Y.; Nassiri A.; Tagawa Y.; Korkolis Y. P.; Kinsey B. L. An investigation of Hertzian contact in soft materials using photoelastic tomography. J. Mech. Phys. Solids 2023, 171, 105164. 10.1016/j.jmps.2022.105164. [DOI] [Google Scholar]
- Schiller H. B.; Hermann M. R.; Polleux J.; Vignaud T.; Zanivan S.; Friedel C. C.; Sun Z.; Raducanu A.; Gottschalk K. E.; Thery M.; et al. beta1- and alphav-class integrins cooperate to regulate myosin II during rigidity sensing of fibronectin-based microenvironments. Nat. Cell Biol. 2013, 15 (6), 625–636. 10.1038/ncb2747. [DOI] [PubMed] [Google Scholar]
- Strohmeyer N.; Bharadwaj M.; Costell M.; Fassler R.; Muller D. J. Fibronectin-bound alpha5beta1 integrins sense load and signal to reinforce adhesion in less than a second. Nat. Mater. 2017, 16 (12), 1262–1270. 10.1038/nmat5023. [DOI] [PubMed] [Google Scholar]
- Xie H.; Vitard J.; Haliyo S.; Régnier S. High-sensitivity mass and position detection of micro-objects adhered to microcantilevers. J. Micro-Nano Mechatronics 2008, 4 (1–2), 17–25. 10.1007/s12213-008-0005-y. [DOI] [Google Scholar]
Associated Data
This section collects any data citations, data availability statements, or supplementary materials included in this article.