

Summary
Mass-spectrometry-based absolute protein quantification uses labeled quantification concatamer (QconCAT) as internal standards (ISs). To calculate the amount of protein(s), the ion intensity ratio between the analyte and its cognate IS is compared in each biological sample. The present protocol describes a systematic workflow to design, produce, and purify QconCATs and to quantify soluble proteins in Pseudomonas putida KT2440. Our methodology enables the quantification of detectable peptide and serves as a versatile platform to produce ISs for different biological systems.
Subject areas: Biotechnology and Bioengineering, Mass Spectrometry, Microbiology, Protein Biochemistry, Protein Expression and Purification, Systems Biology
Graphical abstract
Highlights
-
•
The workflow includes the expression and purification of peptide concatamers (QconCATs)
-
•
Systematic protocol for the selection of unique peptides
-
•
Mass spectrometry was used for quantitative sample analysis
-
•
Absolute quantification of proteins using a customized Python script
Publisher’s note: Undertaking any experimental protocol requires adherence to local institutional guidelines for laboratory safety and ethics.
Mass-spectrometry-based absolute protein quantification uses labeled quantification concatamer (QconCAT) as internal standards (ISs). To calculate the amount of protein(s), the ion intensity ratio between the analyte and its cognate IS is compared in each biological sample. The present protocol describes a systematic workflow to design, produce, and purify QconCATs and to quantify soluble proteins in Pseudomonas putida KT2440. Our methodology enables the quantification of detectable peptide and serves as a versatile platform to produce ISs for different biological systems.
Before you begin
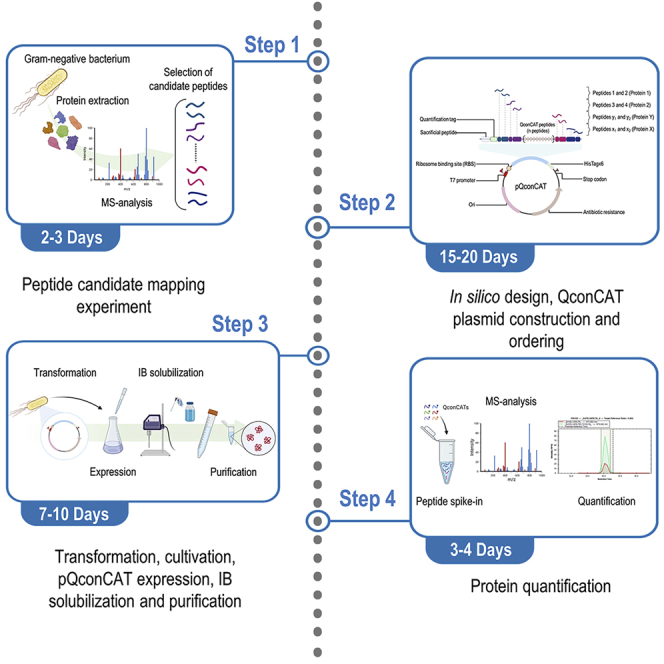
The protocol below describes the steps needed to conduct an integral, quantitative proteomics analysis of the model soil bacterium Pseudomonas putida KT2440.1,2,3,4 This workflow (Figure 1) can be likewise applied to different Gram-negative bacteria to quantify the protein content in the bacterial biomass. Regardless of the microbial host selected, an effective method for protein extraction is required to isolate the greatest number of proteins possible5,6—subjected to the specific experimental conditions employed.7,8 In the last two decades, most of the studies developed to this end have applied qualitative strategies to explore the total bacterial proteome under different conditions (often, through direct comparison to a reference sample) by calculating relative ratios or fold changes in protein content.9,10,11 This methodology, however, could potentially lead to biases due to the fact that relative quantification cannot explicitly provide the actual polypeptide concentrations, given that proteins are present at contents that vary in orders of magnitude (e.g., femto-, pico-, nano- or micromoles of protein per gram/number of cells).12 To address this challenge, the asymmetrical distribution of protein concentrations in the cell could be quantified by targeted proteomics methods, capable of accurately determining the amount of specific proteins.13 Here, quantification can be accomplished by incorporating labeled proteotryptic peptides—adopted as internal standards—in the samples, allowing the user to calculate the absolute concentration of a selected set of proteins.
Figure 1.

Workflow for the selection of candidate peptides
The scheme represents a detailed step-by-step procedure to obtain peptide candidates used in the design of the pQconCAT plasmid.
Reagent preparation
Timing: 6–8 h
Note: This protocol has been used to express and purify unique peptides (i.e., peptides that are present in only one protein of a proteome of interest) from Pseudomonas putida (in this protocol, strain KT2440)14,15 in Escherichia coli BL21(DE3) ΔlysA ΔargH. This strain is an L-lysine and L-arginine auxotroph derivative of E. coli BL21(DE3), commonly used for protein production,16 and will only grow in a minimal medium when the corresponding amino acids are supplemented to the cultures.
The day before the “peptide candidate mapping experiment”:
-
1.
Prepare the following media: 2×YT and LB agar plates (with and without antibiotics as needed).
-
2.
Make antibiotic and IPTG stock solutions.
-
3.
Prepare lysis buffer, ammonium bicarbonate solution, resuspension buffer, Ni-resin equilibration buffer, elution buffer, phosphate buffer, SDS-PAGE buffer and [Glu1]-fibrinopeptide B solution.
Key resources table
| REAGENT or RESOURCE | SOURCE | IDENTIFIER |
|---|---|---|
| Critical commercial assays | ||
| Bicinchoninic acid (BCA) assay kit | VWR | Cat#89167-792 |
| Bacteria strains | ||
| Escherichia coli BL21 DE3 ΔlysA ΔargH | Denmark Technical University, The Novo Nordisk Foundation Center for Biosustainability | This work |
| Pseudomonas putida KT2440 | ATCC | Cat#47054 |
| Chemicals, peptides, and recombinant proteins | ||
| Yeast extract | Sigma-Aldrich | CAS# 8013-01-2 |
| Bacto yeast extract | Thermo Fisher | Cat#212750 |
| Tryptone | Sigma-Aldrich | CAS# 91079-40-2 |
| Bacto tryptone | Thermo Fisher | Cat#211705 |
| NaCl | Sigma-Aldrich | CAS# 7647-14-5 |
| Calcium chloride dihydrate (CaCl2·H2O) | Sigma-Aldrich | CAS# 10043-52-4 |
| Magnesium sulfate heptahydrate (MgSO4·7H2O) | Sigma-Aldrich | CAS# 10034-99-8 |
| Pyridoxine hydrochloride | Sigma-Aldrich | CAS# 58-56-0 |
| Thiamine hydrochloride | Sigma-Aldrich | CAS# 67-03-8 |
| Riboflavin | Sigma-Aldrich | CAS# 83-88-5 |
| Nicotinic acid | Sigma-Aldrich | CAS# 59-67-6 |
| Calcium D-(+)-pantothenate | Sigma-Aldrich | CAS# 137-08-6 |
| p-Aminobenzoic acid | Sigma-Aldrich | CAS# 150-13-0 |
| Thioctic acid | Sigma-Aldrich | CAS# 1077-28-7 |
| Biotin | Sigma-Aldrich | CAS# 58-85-5 |
| Folic acid | Sigma-Aldrich | CAS# 59-30-3 |
| Vitamin B12 | Sigma-Aldrich | CAS# 68-19-9 |
| Disodium EDTA | Sigma-Aldrich | CAS# 6381-92-6 |
| Zinc sulfate heptahydrate (ZnSO4·7H2O) | Sigma-Aldrich | CAS# 7446-20-0 |
| Manganese chloride tetrahydrate (MnCl2·4H2O) | Sigma-Aldrich | CAS# 13446-34-9 |
| Cobalt(II) chloride hexahydrate (CoCl2·6H2O) | Sigma-Aldrich | CAS# 7791-13-1 |
| Copper(II) chloride dehydrate (CuCl2·2H2O) | Sigma-Aldrich | CAS# 10125-13-0 |
| Disodium molybdate dehydrate (Na2MoO4·2H2O) | Sigma-Aldrich | CAS# 10102-40-6 |
| Iron sulfate heptahydrate (FeSO4·7H2O) | Sigma-Aldrich | CAS# 7782-63-0 |
| Boric acid (H3BO3) | Sigma-Aldrich | CAS# 10043-35-3 |
| Potassium iodide (KI) | Sigma-Aldrich | CAS# 7681-11-0 |
| Disodium hydrogen phosphate (Na2HPO4) | Sigma-Aldrich | CAS# 7558-79-4 |
| Potassium phosphate, monobasic (KH2PO4) | Sigma-Aldrich | CAS# 7778-77-0 |
| Ammonium chloride (NH4Cl) | Sigma-Aldrich | CAS# 12125-02-9 |
| Agar | Sigma-Aldrich | CAS# 9002-18-0 |
| Kanamycin monosulfate | Sigma-Aldrich | CAS# 25389-94-0 |
| Guanidinium hydrochloride (GuHCl) | Sigma-Aldrich | CAS# 50-01-1 |
| Tris(2-carboxyethyl)phosphine hydrochloride (TCEP) | Sigma-Aldrich | CAS# 51805-45-9 |
| 2-Chloroacetamide (CAA) | Sigma-Aldrich | CAS# 79-07-2 |
| Tris(hydroxymethyl)aminomethane hydrochloride (Tris·HCl) | Sigma-Aldrich | CAS# 1185-53-1 |
| Ammonium bicarbonate (NH4HCO3) | Sigma-Aldrich | CAS# 1066-33-7 |
| Trifluoroacetic acid (TFA) | Sigma-Aldrich | CAS# 76-05-1 |
| Isopropyl β-D-1-thiogalactopyranoside (IPTG) | Sigma-Aldrich | CAS# 367-93-1 |
| Ethylenediaminetetraacetic acid (EDTA) | Sigma-Aldrich | CAS# 60-00-4 |
| D,L-Dithiothreitol (DTT) | Sigma-Aldrich | CAS# 3483-12-3 |
| Urea | Sigma-Aldrich | CAS# 57-13-6 |
| Sodium phosphate dibasic heptahydrate (Na2HPO4.7H2O) | Sigma-Aldrich | CAS# 7782-85-6 |
| Sodium dihydrogen phosphate monohydrate (NaH2PO4.H2O) | Sigma-Aldrich | CAS# 10049-21-5 |
| Imidazole | Sigma-Aldrich | CAS# 288-32-4 |
| Trypsin and LysC digestion mix | Thermo Fischer | Cat#A40007 |
| Pierce™ Universal Nuclease for Cell Lysis | Thermo Fischer | Cat#88700 |
| 4× Laemmli sample buffer | Bio-Rad | Cat#1610747 |
| 4× 2-Mercaptoethanol | Sigma-Aldrich | CAS# 60-24-2 |
| 2-Amino-2-(hydroxymethyl)-1,3-propanediol (Tris base) | Sigma-Aldrich | CAS# 77-86-1 |
| Glycine | Sigma-Aldrich | CAS# 56-40-6 |
| Sodium dodecyl sulfate (SDS) | Sigma-Aldrich | CAS# 151-21-3 |
| Page Ruler Plus Prestained Protein Ladder, 10–250 kDa | Thermo Fischer | Cat#26619 |
| Instant Blue staining | Abcam | ab119211 |
| [Glu1]-Fibrinopeptide B | Sigma-Aldrich | CAS# 103213-49-6 |
| Water for chromatography (LC-MS Grade) LiChrosolv® | Sigma-Aldrich | CAS# 7732-18-5 |
| Deposited data | ||
| Pseudomonas putida KT2440 soluble protein quantification | This paper | https://github.com/biosustain/QconCATquantSTAR |
| Recombinant DNA | ||
| pQconCAT plasmid | This paper | N/A |
| Software and algorithms | ||
| Proteome Discoverer | Thermo Fisher | https://www.thermofisher.com/us/en/home/industrial/mass-spectrometry/liquid-chromatography-mass-spectrometry-lc-ms/lc-ms-software/multi-omics-data-analysis/proteome-discoverer-software.html v2.4 |
| Python version 3.10.5 | Python Software Foundation | https://www.python.org |
| Other | ||
| 3 mm zirconium oxide beads | Glen Mills | Cat#7361-003000 |
| 2 mm solid-glass beads | Sigma-Aldrich | SKU 1040140500 |
| Mixer Mill | Retsch | MM400 |
| ThermoMixer | Eppendorf | Cat#5382000023 |
| C18 resin | Empore | Cat#13-110-018 |
| Dionex UltiMate 3000 | Thermo Fisher | Cat#IQLAAAGABHFAPBMBFD |
| Orbitrap Exploris 480 | Thermo Fisher | Cat#BRE725533 |
| Thermal Mixer with 24 × 2 mL microtube block Eppendorf shaker | Thermo Fisher | Cat#13687717 |
| 250 mL Nalgene™ plastic bottle | Sigma-Aldrich | SKU B1033-4EA |
| Vibra-Cell sonicator | Sonic & Material Instrument | Model VCX 130 |
| Waving shaker | VWR | Cat#10811-240 |
| HisPur™ Ni-NTA Resin | Thermo Fisher | Cat#88222 |
| Pierce™ Disposable Columns, 10 mL | Thermo Fisher | Cat#29924 |
| Amicon Ultra centrifugal filters (50 mL) | Millipore | Cat#UFC901096 |
| NanoDrop 2000 spectrophotometer | Thermo Fisher | Cat#ND-2000 |
| PCR tube | Thermo Fisher | Cat#14-230-210 |
| Spin microcentrifuge | VWR | Cat#521-2844 |
| Mini-PROTEAN TGX 4%–20% resolving gel | Bio-Rad | Cat#4561096 |
| Mini-PROTEAN tetra cell vertical gel electrophoresis system | Bio-Rad | Cat#1658004 |
| Spatula or Knife Gel | Thermo Fisher | Cat#EI9010 |
Materials and equipment
LB agar plates containing kanamycin (or any other selected antibiotic)
| Reagent | Final concentration | Amount |
|---|---|---|
| Yeast extract | 5 g/L | 5 g |
| Tryptone | 10 g/L | 10 g |
| NaCl | 10 g/L | 10 g |
| Agar | 15 g/L | 15 g |
| Kanamycin (1,000×) | 50 μg/mL (1×) | 1 mL |
| Deionized water | Not applicable (N/A) | Up to 1 L |
| Total | N/A | 1 L |
Note: Autoclave LB agar medium at 15 psi, 121°C–124°C for 20 min and cool down to 45°C–50°C before adding kanamycin or the selected antibiotic. These can be stored at 4°C for ∼1 month.
2×YT broth
| Reagent | Final concentration | Amount |
|---|---|---|
| Yeast extract | 10 g/L | 10 g |
| Tryptone | 16 g/L | 16 g |
| NaCl | 5 g/L | 5 g |
| Deionized water | N/A | Up to 1 L |
| Total | N/A | 1 L |
Note: This medium can be autoclaved (at 15 psi, 121°C–124°C for 20 min) and stored at 23°C for ∼6 months.
M9 medium glucose
| Reagent | Final concentration | Amount |
|---|---|---|
| Calcium chloride (CaCl2) solution | 0.1 mM | 0.1 mL |
| Magnesium sulfate (MgSO4) solution | 2 mM | 1 mL |
| Wolfe’s vitamin solution (1,000×) | 1× | 1 mL |
| Trace element solution (2,000×) | 1× | 0.5 mL |
| M9 medium salts (10×) | 1× | 100 mL |
| Glucose monohydrate | 40 mM | 7.2 g |
| Double deionized water | N/A | Up to 1 L |
| Total | N/A | 1 L |
Note: This medium can be stored at 23°C for ∼6 months.
Calcium chloride solution
| Reagent | Final concentration | Amount |
|---|---|---|
| Calcium chloride (CaCl2) dihydrate | 1 M | 147.01 g |
| Double deionized water | N/A | Up to 1 L |
| Total | N/A | 1 L |
Note: This medium can be stored at 23°C for ∼12 months.
Magnesium sulfate solution
| Reagent | Final concentration | Amount |
|---|---|---|
| Magnesium sulfate (MgSO4) heptahydrate | 2 M | 240.73 g |
| Double deionized water | N/A | Up to 1 L |
| Total | N/A | 1 L |
Note: This medium can be stored at 23°C for ∼12 months.
Wolfe’s vitamin solution (1,000×)
| Reagent | Final concentration | Amount |
|---|---|---|
| Pyridoxine hydrochloride | 10.0 mg/L | 10.0 |
| Thiamine hydrochloride | 5.0 mg/L | 5.0 |
| Riboflavin | 5.0 mg/L | 5.0 |
| Nicotinic acid | 5.0 mg/L | 5.0 |
| Calcium D-(+)-pantothenate | 5.0 mg/L | 5.0 |
| p-Aminobenzoic acid | 5.0 mg/L | 5.0 |
| Thioctic (α-lipoic) acid | 5.0 mg/L | 5.0 |
| Biotin | 2.0 mg/L | 2.0 |
| Folic Acid | 2.0 mg/L | 2.0 |
| Vitamin B12 | 1.0 mg/L | 1.0 |
| Double deionized water | N/A | Up to 1 L |
| Total | N/A | 1 L |
Note: First, dissolve all compounds in 500 mL MQ water. Add double deionized water to a final volume of 1 L. Filter sterilize. Store the sterile solution at 4°C in the dark for ∼12 months.
Trace element solution (2,000×)
| Reagent | Final concentration | Amount |
|---|---|---|
| Disodium EDTA | 15 g/L | 15 |
| Zinc sulfate (ZnSO4) heptahydrate | 4.5 g/L | 4.5 |
| Manganese chloride (MnSO4) tetrahydrate | 0.7 g/L | 0.7 |
| Cobalt(II) chloride (CoCl2) hexadrate | 0.3 g/L | 0.3 |
| Copper(II) chloride (CuCl2) dihydrate | 0.2 g/L | 0.2 |
| Disodium molybdate (Na2MoO4) dihydrate | 0.4 g/L | 0.4 |
| Calcium chloride (CaCl2) dihydrate | 4.5 g/L | 4.5 |
| Iron(II) sulfate (FeSO4) heptahydrate | 3.0 g/L | 3.0 |
| Boric acid (H3BO3) | 1.0 g/L | 1.0 |
| Potassium iodide (KI) | 0.1 g/L | 0.1 |
| Double deionized water | N/A | Up to 1 L |
| Total | N/A | 1 L |
Note: First, dissolve EDTA and ZnSO4·7H2O in 0.75 L of double deionized water and set the pH to 6.0 with 1 M NaOH. Whilst maintaining the pH at 6.0, dissolve in the other compounds one by one. When ready, set the pH to 4.0 with 1 M HCl and adjust the volume to 1.0 L. Sterilize by autoclaving (15 psi, 121°C–124°C for 20 min). Store the sterile solution at 4°C in the dark for ∼12 months.
M9 medium salts (10×)
| Reagent | Final concentration | Amount |
|---|---|---|
| Disodium hydrogen phosphate (Na2HPO4) | 68 g/L | 10 g |
| Potassium phosphate monobasic (KH2PO4) | 30 g/L | 16 g |
| Sodium chloride (NaCl) | 5 g/L | 5 g |
| Ammonium chloride (NH4Cl) | 10 g/L | 10 g |
| Double deionized water | N/A | Up to 1 L |
| Total | N/A | 1 L |
Note: This medium can be stored at 23°C for ∼12 months.
Buffer A – Inclusion bodies solubilization
| Reagent | Final concentration | Amount |
|---|---|---|
| Tris·HCl (pH = 8.0) | 20 mM | 242.3 mg |
| EDTA | 1 mM | 29.2 mg |
| DTT | 5 mM | 77.1 mg |
| Double deionized water | N/A | Up to 100 mL |
| Total | N/A | 100 mL |
CRITICAL: D,L-Dithiothreitol (DTT) is a reducing agent that can cause skin, eye and respiratory irritation. It is highly recommended to wear appropriate protective equipment and work under the chemical hood.
Note: Buffer A can be stored at 4°C for ∼12 months.
Buffer B – Inclusion bodies solubilization
| Reagent | Final concentration | Amount |
|---|---|---|
| Tris·HCl (pH = 8.0) | 20 mM | 242.3 mg |
| EDTA | 1 mM | 29.2 mg |
| DTT | 5 mM | 77.1 mg |
| Urea | 8 M | 48.05 g |
| Double deionized water | N/A | Up to 100 mL |
| Total | N/A | 100 mL |
Note: Buffer B can be stored at 4°C for ∼12 months.
Phosphate buffer (pH = 7.4)
| Reagent | Final concentration | Amount |
|---|---|---|
| Sodium phosphate dibasic heptahydrate (Na2HPO4·7H2O) | 1 M | 20.21 g |
| Sodium dihydrogen phosphate monohydrate (NaH2PO4·H2O) | 1 M | 3.39 g |
| Double deionized water | N/A | Up to 100 mL |
| Total | N/A | 100 mL |
Note: Phosphate buffer can be stored for at least 2 years at 23°C.
Resuspension buffer
| Reagent | Final concentration | Amount |
|---|---|---|
| 1 M phosphate buffer (pH = 7.4) | 20 mM | 2 mL |
| NaCl | 300 mM | 1.75 g |
| Imidazole | 20 mM | 0.136 g |
| Double deionized water | N/A | Up to 100 mL |
| Total | N/A | 100 mL |
Note: Resuspension buffer can be stored for at least 2 years at 4°C protected from light.
Equilibration buffer Ni-resin
| Reagent | Final concentration | Amount |
|---|---|---|
| 1 M phosphate buffer (pH = 7.4) | 20 mM | 2 mL |
| NaCl | 300 mM | 1.75 g |
| Imidazole | 20 mM | 0.136 g |
| Urea | 8 M | 48.05 g |
| Double deionized water | N/A | Up to 100 mL |
| Total | N/A | 100 mL |
Note: Equilibration buffer Ni-resin can be stored for at least 2 years at 4°C protected from light.
Elution buffer Ni-resin
| Reagent | Final concentration | Amount |
|---|---|---|
| 1 M phosphate buffer (pH = 7.4) | 20 mM | 1 mL |
| NaCl | 300 mM | 0.825 g |
| Imidazole | 500 mM | 1.7 g |
| Urea | 8 M | 24.02 g |
| Double deionized water | N/A | Up to 50 mL |
| Total | N/A | 50 mL |
Note: Elution buffer Ni-resin can be stored for at least 2 years at 4°C protected from light.
Sample exchange buffer
| Reagent | Final concentration | Amount |
|---|---|---|
| 1 M phosphate buffer (pH = 7.4) | 20 mM | 2 mL |
| Double deionized water | N/A | Up to 1 L |
| Total | N/A | 1 L |
Note: Sample exchange buffer can be stored for at least 2 years at 23°C.
SDS-PAGE buffer 10×
| Reagent | Final concentration | Amount |
|---|---|---|
| Tris base | 30.3 g/L | 30.3 g |
| Glycine | 144.4 g/L | 144.4 g |
| SDS | 10 g/L | 10 g |
| Double deionized water | N/A | Up to 1 L |
| Total | N/A | 1 L |
Note: SDS is a detergent, do not shake the mixture to avoid formation of foam.
Note: This medium can be stored at 23°C for ∼12 months.
[Glu1]-Fibrinopeptide B solution
| Reagent | Final concentration | Amount |
|---|---|---|
| [Glu1]-Fibrinopeptide (EGVNDNEEGFFSAR) | 0.1 μg/μL | 100 μg |
| LC-MS grade water | N/A | Up to 1 mL |
| Total | N/A | 1 mL |
Note: [Glu1]-Fibrinopeptide B solution must be stored at –20°C. Storage time ∼2 years.
Ammonium bicarbonate solution
| Reagent | Final concentration | Amount |
|---|---|---|
| Ammonium bicarbonate (NH4HCO3) | 50 mM | 198 mg |
| LC-MS grade water | N/A | Up to 50 mL |
| Total | N/A | 50 mL |
Note: The ammonium bicarbonate solution can be stored for at least 2 years at 23°C.
Tris·HCl buffer (pH = 8.5)
| Reagent | Final concentration | Amount |
|---|---|---|
| Tris·HCl | 1 M | 7.88 g |
| LC-MS grade water | N/A | Up to 50 mL |
| Total | N/A | 50 mL |
Note: Adjust the pH of the solution to 8.5 with 5 M NaOH. The solution can be stored at 23°C for at least 2 years.
Lysis buffer
| Reagent | Final concentration | Amount |
|---|---|---|
| Gu·HCl | 6 M | 28.66 g |
| TCEP | 5 mM | 71.7 mg |
| CAA | 10 mM | 46.7 mg |
| Tris·HCl (pH = 8.5) | 100 mM | 5 mL |
| LC-MS grade water | N/A | Up to 50 mL |
| Total | N/A | 50 mL |
Note: This medium can be stored at 4°C for ∼6 months.
Alternatives: Chemical compounds produced by manufacturers other than the ones specified in the key resources table are adequate substitutes, where and whenever are of highest purity, sequence grade, and LC-MS grade. The enzymes used in this protocol (Trypsin/LysC digestion mix and Pierce™ Universal Nuclease for Cell Lysis) should be purchased using the same vendor to ensure workflow reproducibility.
HPLC-MS and data analysis settings
For sample analysis, utilize a Dionex UltiMate 3000 coupled to an Orbitrap Exploris 480. Capture the sample on a pre-column (μ-precolumn C18 PepMap 100, 5 μm, 100 Å) at a flow rate of 10 μL/min. Separate the peptides on a 15 cm C18 easy spray column (PepMap RSLC C18 2 μm, 100 Å, 150 μm × 15 cm) at a flow rate of 1.2 μL/min, with an applied gradient from 4% (v/v) acetonitrile in water with 0.1%–76% (v/v) formic acid over a total of 60 min. Operate the instrument in data-dependent mode using the following settings: MS-level scans performed with resolution set to 120,000; AGC target of 3.0×10⁶; maximum injection time of 50 ms; intensity threshold of 5.0×10³; and dynamic exclusion at 25 s. Perform data-dependent MS2 selection in Top 20 Speed mode with HCD collision energy set to 28% (AGC target 1.0×10⁴; maximum injection time of 22 ms; and isolation window 1.2 m/z with a resolution of 30,000).
For analysis of the .RAW files, run Proteome Discoverer v2.4 (Thermo Fisher Scientific, Waltham, MA, USA) with the following settings. Dynamic modifications: carbamidomethyl of cysteine residues and oxidation of methionine residues; label 13C(6) in arginine and lysine residues; precursor mass tolerance set to 10 ppm; fragment mass tolerance at 0.02 Da; trypsin (full) as digestion enzyme, allowing for a maximum of two missed cleavages; minimum peptide length of 6; maximum peptide length of 144; and the false-discovery rate (FDR) set at 0.1%.
Step-by-step method details
The first part of the protocol involves the selection of several unique peptides used in the design of the quantification concatamers (QconCATs) for absolute protein determination. QconCATs are implemented to precisely quantify the content of desired proteins not only in bacteria but also in any biological system by slightly adjusting the protein extraction procedure. The presented protocol includes all the necessary steps—from the in silico design to the calculation of the in vivo protein concentrations—to carry out an end-to-end workflow in Gram-negative bacteria (e.g., P. putida or E. coli).
Peptide candidate mapping experiment
-
1.
Grow the pre-culture of the selected Gram-negative bacterial strain for ∼16 h at its optimal growth condition in a 50-mL Falcon tube containing 10 mL of 2×YT medium. Use colonies from a freshly-inoculated LB agar plate.
Note:E. coli should be grown at 37°C and P. putida cultures are incubated at 30°C.
-
2.
Re-inoculate a 250-mL Erlenmeyer flask containing 50 mL of 2×YT medium by diluting the pre-culture 100× (500 μL).
-
3.
When the culture reaches mid-exponential phase (roughly equal to 0.5×OD600max, i.e., half the maximum optical density measured at 600 nm) or ∼0.4–0.5 mg of total cell dry weight.
-
4.
Harvest 1 mL of the suspension by centrifugation at 10,000 g for 10 min at 4°C.
-
5.
Remove the supernatant and freeze the cell pellets at –80°C until sample preparation.
-
6.
Thaw the cell pellets on ice. Add two 3-mm zirconium oxide beads to each sample, and 100 μL of lysis buffer (6 M Gu·HCl [guanidinium hydrochloride], 5 mM TCEP [tris(2-carboxyethyl)phosphine], 10 mM CAA [2-chloroacetamide] and 100 mM Tris·HCl, pH = 8.5) to the samples.
-
7.
Disrupt the cell suspension in a Mixer Mill set at 25 Hz for 5 min at ∼20°C. Heat the sample for 10 min in a ThermoMixer at 99°C and 1,800 rpm.
-
8.
Remove the cell debris by centrifugation at 15,000 g for 10 min at 23°C and collect 50 μL of supernatant into a new Eppendorf tube. Dilute the cell extract with 50 μL of 50 mM (NH4)HCO3 (ammonium bicarbonate).
-
9.
Quantify protein concentration via the bicinchoninic acid (BCA) assay4,17 and take 20 μg of protein for tryptic digestion into a new Eppendorf tube.
-
10.
Dilute the tryptic digestion to reach a total volume of 100 μL by using the appropriate amount of 50 mM (NH4)HCO3 solution.
Note: The expected protein concentration might vary according to the organism under study, carbon source and culture conditions. For a typical bacterial culture at OD600 = 1.0, the estimated protein concentration is ∼2 μg/μL.
-
11.
Add 20 μL of 0.1 μg/μL trypsin and LysC digestion mix (ratio 1:1). Initiate the tryptic digestion at constant shaking (400 rpm) for 8 h and 37°C.
Note: Ensure at least a 4× dilution to avoid interferences between the Gu·HCl present in the lysis buffer and the digestion enzymes.
-
12.
Add 10 μL of 10% (w/v) trifluoroacetic acid (TFA) to stop the tryptic digestion. Vortex and centrifuge the samples at 15,000 g for 15 min at 23°C (See problem 3 in troubleshooting).
-
13.
Perform StageTipping, using C18 resin (solid phase extraction disk) to desalt the samples prior to HPLC-MS analysis. For a detailed explanation on StegeTipping desalting process, please refer to Rappsilber et al.18 for further details.
-
14.
HPLC-MS analysis of the samples is performed using a Dionex UltiMate 3000 coupled to an Orbitrap Exploris 480 operated using data-dependent acquisition. The data analysis of the .RAW files is executed using Proteome Discoverer. Further details on HPLC-MS and data analysis can be found in the materials and equipment section; please also refer to Wirth et al.19 and Kozaeva et al.20 for details.
The experimental workflow to build the peptide list is shown in Figure 2.
Note: Only consider unique peptides for quantification. Assign the detected peptides to their functions using a protein database consisting of the reference Gram-negative bacteria proteome. If necessary, supplement heterologously expressed proteins by adding those proteins and sequences to the FASTA file obtained from the database.
-
15.From the peptide candidate list obtained, select the peptides using the following criteria:
-
a.Mass peptide: select peptides ranging 350–5,000 Da in mass.
-
a.
Figure 2.

Standard design of the inducible pQconCAT plasmid to produce labeled peptides for absolute protein quantification
(A and B) The plasmid encompasses different parts that allow the production of the desired protein: (A) concatenated peptides (n peptides) selected in “peptide candidate mapping experiment” and (B) a T7 RNA polymerase promoter region, ribosome binding site (RBS), quantification tag (e.g., [Glu1]-fibrinopeptide B), sacrificial peptide, hexahistidine purification tag (HisTag×6), stop codon, antibiotic resistance determinant and origin of vegetative replication (oriV). This design allows for the production of an equimolar (1:1) amount of QconCAT peptides, which can be added in known quantities to the sample. Then, the amount of each represented peptide standard can be calculated based on the [Glu1]-fibrinopeptide B, serving as a reference to accurately quantify proteins.
Avoid proline (P) residues on the carboxyl side of the cleavage site (RP or KP) as well as acidic residues—aspartate (D) and glutamate (E)—on either side of the cleavage site due to the lower rate of hydrolysis.
-
16.
Pick two or more proteotyptic peptides per protein with the highest fragment intensity. Please refer to Calderón-Celis et al.21 for details.
In silico QconCAT plasmid design (pQconCAT)
-
17.In silico design of pQconCAT vectors.
-
a.The plasmid design should contain the following structure:
-
i.T7 RNA polymerase promoter region;
-
ii.Ribosome binding site;
-
iii.Quantification tag (e.g., [Glu1]-fibrinopeptide B);
-
iv.Sacrificial peptide;
-
v.Concatenated peptides (n peptides) selected in “peptide candidate mapping experiment”;
-
vi.Hexahistidine purification tag (HisTag×6);
-
vii.STOP codon;
-
viii.Antibiotic resistance determinant;
-
ix.Origin of vegetative replication (oriV).The general structure of plasmid pQconCAT is depicted in Figure 2.Note: Optimize (optional) the QconCAT gene for codon usage in E. coli to facilitate production of the concatamers.
-
i.
-
b.Order the plasmid previously designed (typical synthesis time: 15 days).
-
a.
QconCAT transformation and expression
-
18.Competent cells for pQconCAT transformation.
-
a.Grow for ∼16 h a pre-culture of E. coli BL21(DE3) ΔlysA ΔargH in 5 mL of LB medium at 37°C in a shaker at 250 rpm.
-
b.Inoculate 50 mL of fresh LB medium, placed in a 250-mL Erlenmeyer flask, with 0.5 mL of the pre-culture to yield an OD600 ∼0.05.
-
c.Grow cells at 37°C in a shaker at 250 rpm until the culture reaches OD600 ∼0.5 (∼2–3 h).
-
d.Place the Erlenmeyer flask to ice to prevent further bacterial growth.Note: From now on, steps e-k should be performed at 4°C, maintaining cells on an ice bath and using chilled tubes.
-
e.Transfer the cells to a pre-chilled 50-mL Falcon conical tube.
-
f.Harvest the cells in a pre-cooled centrifuge at 4°C for 10 min and 4,500 g. Discard the supernatant.
-
g.Resuspend the pellet in 1-mL chilled, filter-sterile 10% (v/v) glycerol solution and transfer to a chilled 1.5-mL Eppendorf tube.
-
h.Centrifuge for 1 min at 11,000 g and 4°C. Discard supernatant.
-
i.Repeat steps g and h at least twice.Note: The pellet will become softer with every wash round. Be careful when removing the supernatant.
-
j.Resuspend the cell pellet in 10% (v/v) glycerol to 1:100 volume of initial culture (i.e., 500 μL). Culture volumes can be scaled down accordingly if only a few transformations will be performed.
-
k.Transfer 30–50 μL aliquots to chilled 1.5-mL Eppendorf tubes.Note: Cells can be flash-frozen and maintained at –80°C until transformation or used directly for electroporation.
-
a.
-
19.pQconCAT transformation.
-
a.Take competent cells E. coli BL21(DE3) ΔlysA ΔargH from –80°C and place them on ice.
-
b.Prepare the plasmid suspension by diluting it in the tube to a concentration of 100 ng/μL using MQ water.
-
c.Add ∼25–50 ng of the plasmid into the cell tubes and vortex quickly one time.
-
d.Put the cells and the plasmid on ice for 30 min.
-
e.Place the tube into the water bath at 42°C for 60 s. After that, place them back on ice for 2 min.
-
f.Add 1 mL of LB medium (without antibiotics), transfer the cells into a 2-mL Eppendorf tube and incubate the bacterial suspension for 1 h at 37°C in a Thermal Mixer with a 24 × 2 mL microtube block Eppendorf shaker at 800 rpm.
-
g.Plate 50 μL of the cell suspension on LB agar plates (with the corresponding antibiotic) using pre-sterilized 2-mm glass beads.Note: The antibiotic to be added to the plates depends on the selection marker in the plasmid used for the protein expression. Prepare a 1,000× antibiotic stock solution and dilute to 1×.
-
h.Centrifuge the tube containing the remaining cells at 10,000 g for 5 min and discard most of the medium (∼900 μL). Resuspend the cells in the remainder liquid.
-
i.Plate the cell suspension on LB agar plates (with the corresponding antibiotic) using 2-mm glass beads and incubate the plates for ∼16 h in an incubator at 37°C.
-
j.Pick the colonies, confirm presence of the plasmid by mini-prep and sequencing, and prepare glycerol stocks of the selected clones.
-
a.
-
20.QconCAT expression.
-
a.Inoculate pre-cultures in 50-mL Falcon tubes containing 10 mL of M9 minimal medium with 40 mM glucose, 0.1 mg/mL U13C-L-lysine, 0.1 mg/mL U13C-L-arginine + the selected antibiotic (1× final concentration, see above) at 37°C at 200 rpm for ∼16 h (see problem 1 in troubleshooting).
-
b.Dilute the pre-culture 1:100 in 100 mL of the same medium described in 3.a. placed in 500-mL Erlenmeyer flask, and incubate the culture at 37°C.
-
c.When the culture reaches OD600 ∼ 0.5–0.6, cool down the flask (in ice or cold room) until it reaches approximately ∼23°C.
-
d.Induce the expression of the construct borne by plasmid pQconCAT by adding IPTG to a final concentration of 1 mM and incubate for 24 h at 30°C and 200 rpm (see problem 2 in troubleshooting).Note: The concatamer polypeptide tends to form inclusion bodies (IBs) when using this IPTG concentration to induce the expression of the construct. It is possible to optimize the IPTG concentration for different polypeptides if needed. In case that no information is available, a low IPTG concentration (e.g., 0.2 mM) is a good starting point. Please refer to Lozano Terol et al.22 for further information.
-
e.Centrifuge the culture at 3,000 g and 4°C for 20 min in a 250-mL Nalgene™ plastic bottle.
-
f.Freeze the bacterial pellets at –20°C for 1 h to weaken the cell membrane.
 Pause point: It is possible to store the pellets at –20°C gor ∼16 h and continue with the rest of the procedure the next day.
-
a.
-
21.Cell disruption, inclusion bodies solubilization and pQconCAT purification.
-
a.Cell disruption:
-
i.Thaw the frozen pellets and resuspend the biomass in 25 mL of resuspension buffer by vortexing. Pour the suspended pellet solution in a 50-mL Falcon tube.
-
ii.Sonicate the samples using a Vibra-Cell sonicator at 65% intensity for 10 min with ON-OFF cycles of 30 s.Note: The samples should be maintained at 4°C during the sonication.
-
iii.Incubate the lysate with 2 μL of Pierce™ Universal Nuclease for Cell Lysis for at least 30 min at 23°C to digest DNA and reduce the viscosity of the sample.
-
iv.Centrifuge lysates for 20 min at 16,000 g in a cooled centrifuge (4°C).CRITICAL: At this point, the soluble proteins should be present in the supernatant. However, because of the nature of the polypeptide, the QconCAT will be typically recovered from IBs. These IBs will be present in the pellet (insoluble fraction) of the sample, with a negligible amount of QconCATs in the supernatant.
-
v.Recover the pellet and use it in the next step for IB solubilization.Note: The supernatant should be stored at 4°C in case that no protein is detected in the IB fraction (pellet); if this is the case, filter the supernatant using a 0.45 μm and then a 0.22 μm membrane. Continue to step 5.a. if the protein of interest is in the soluble fraction.Pause point: The pellet can be stored at –20°C in case you need to pause the process.CRITICAL: The solubilization buffers A and B must be prepared immediately before this step.
-
i.
-
b.IBs solubilization:
-
i.Resuspend the pellet in 2 mL of buffer A by pipetting up and down until the protein pellet is completely dissolved. Place the dissolved protein in a new 2-mL Eppendorf tube.
-
ii.Centrifuge for 60 min at 4°C and 15,000 g. Remove the supernatant and proceed with pellet solubilization.
-
iii.Solubilize the protein by adding 5–10 mL of buffer B.Note: Do not add the whole volume of buffer B directly to the pellet; rather add 1-mL aliquots at a time to gradually dissolve the materials. Repeat this procedure until dissolving the whole insoluble fraction. Do not use more than 10 mL of the solubilization solution. Place the solution in a 15-mL Falcon tube.
-
iv.Stir gently for 1 h at 4°C in a waving shaker with an inclination of 30°C.Note: In case the pellet is not completely dissolved, it is recommended to leave the sample for ∼16 h at the conditions mentioned above to complete the solubilization of the polypeptide.
-
v.Centrifuge for 15 min at 4°C and 15,000 g to eliminate insoluble debris. Store the supernatant containing the solubilized protein. Continue to the purification step.
-
i.
-
c.QconCAT purification:
-
i.Assemble the purification Pierce™ Disposable Column by placing a filter disc in the bottom, cap the column tip and add 2 mL of HisPur™ Ni-NTA resin.Note: Mix the resin vigorously to form a homogenous solution before adding it to the column.
-
ii.Allow the resin to drain without becoming completely dry by removing the cap. Once the resin is drained, recap the column.Note: To drain buffers/solution, remove the cap and recap once the column is drained. Place several 50-mL Falcon tubes under the column during the different intermediate steps in order to collect the fractions.
-
iii.To wash and equilibrate the column, add 2 mL of equilibration buffer (no need to be gentle with the resin) and let the resin drain. Place the cap on the tip.
-
iv.Load the solution containing the QconCATs on top of the resin. Collect the flow-through and repeat this step twice to increase protein recovery.Note: It is important to keep the fraction containing the QconCATs at 4°C.
-
v.Wash the resin twice with 10 mL of equilibration buffer Ni-resin.
-
vi.Elute twice with 2 mL of elution buffer.
-
vii.Load the eluent in a 50-mL Amicon Ultra centrifugal filters (with a cut-off of at least 10 kDa below the size of the polypeptide of interest) and proceed to exchange the buffer.
-
viii.Centrifuge at 4,000–7,000 g for 10 min at 4°C and refill the column with 4 mL of sample exchange buffer (see problem 4 in troubleshooting).
-
ix.Repeat the step above 3–4 times to properly exchange the buffer. Then, recover the purified proteins in a final volume of 1 mL of the buffer by pipetting up and down. Centrifuge the sample again in case that more than 1 mL is obtained.
-
x.Measure the protein concentration by using NanoDrop 2000 spectrophotometer. Absorbance ratio at 260 nm over 280 nm (A260/A280) should be around 0.6.
-
i.
-
a.
-
22.SDS-PAGE of purified proteins.
-
a.Prepare your protein samples in a 0.2-mL PCR tube by mixing the components listed in Table 1:Note: Load ∼0.2–1 μg of the purified protein in the polyacrylamide gel to get clear bands. Bigger protein amounts can lead to streaked bands, while lower a mass below 0.2 μg can result in the absence of noticeable bands in the gel.CRITICAL: 4× 2-Mercaptoethanol is a 600 mM solution (in water); work in the chemical fume hood when preparing and handling this solution.
-
b.Incubate the samples at 95°C for 5 min and spin them down in a spin microcentrifuge.
-
c.Take a Mini-PROTEAN TGX 4%–20% resolving gel and remove the comb carefully to avoid damaging the wells. Remove the green tape at the bottom of the gel and insert it in a Mini-PROTEAN tetra cell vertical gel electrophoresis system.
-
d.Place the cell in the suitable position of the tank buffer. Use the 1× SDS-PAGE buffer to fill the cell volume completely and the rest of the buffer tank up to the appropriate level mark.
-
e.Load 10 μL of the suspension sample. Include at least one well with 2–3 μL of Page Ruler Plus Prestained Protein Ladder, 10–250 kDa.
-
f.Run the SDS-PAGE at 200 V for approximately 25 min.Note: Recycle the buffer outside the electrophoresis cell as long as the dye inside the precast cell has not escaped through the bottom of the gel.
-
g.Open the precast gel using a spatula or gel knife, wash it with distilled water and incubate it in ∼15–20 mL of Instant Blue staining (enough volume to cover the gel) with gently shaking at 23°C. Bands will be visible after 15 min and completely stained after 1 h.
-
h.Wash the gel to remove the dye by washing it with 30 mL of distilled water for 5 min. Repeat this step three times.
-
a.
Figure 3.

Cultivation procedures and expression of pQconCAT and inclusion bodies (IB) solubilization
The workflow lists the most important steps to obtain the final protein before the purification.
Figure 4.

QconCAT purification using HisPur™ Ni-NTA Resin
Systematic procedure for QconCAT purification based on the HisTag technology.
Table 1.
Composition of protein samples for SDS-PAGE analysis
| Component | Volume [μL] |
|---|---|
| Protein sample | Up to 6 |
| 4× Laemmli sample buffer | 3 |
| 4× 2-Mercaptoethanol | 3 |
| Water | As needed |
| Final volume | 12 |
Quantification of the QconCAT
-
23.
For each purified QconCAT from step 21.c.x, add 10 μL to a new Eppendorf tube. Next, add 60 μL of 0.1 μg/μL quantification tag peptide [Glu1]-fibrinopeptide B as internal standard.
-
24.
Perform tryptic digestion, StageTipping, HPLC-MS and data analysis as described in steps 6–14 of Section “peptide candidate mapping experiment”.
-
25.
Using the sequence of the quantification tag peptide and the Proteome Discoverer results file containing the “Peptide Groups”, the abundance of the spiked-in quantification tag (light peptide) and the abundance of the 13C-labeled quantification tag from the QconCAT (heavy peptide) can be determined. Next, the concentration of each QconCAT is calculated as shown in Equation 1:
| (Equation 1) |
where is the concentration of the QconCAT, is the concentration of the quantification tag peptide solution (i.e., 0.1 μg/μL in this example), is the abundance of the spiked-in quantification tag (light peptide), is the abundance of the 13C-labeled quantification tag from the QconCAT (heavy peptide), is the molecular weight of the QconCAT protein, and is the molecular weight of the spiked-in quantification tag, assuming equimolar concentrations of the 13C-labeled quantification tag (heavy peptide) and the QconCAT protein (see problem 5 in troubleshooting).
Quantification of samples and expected results
-
26.
A biological sample from any experimental condition can be used for protein quantification using the QconCAT standards. Ensure that the samples (cell pellets, as described in step 1 of Section “peptide candidate mapping experiment”) correspond to a total OD600 ranging from 1 to 2.
-
27.
Perform cell lysis and total protein quantification following steps 6–9 of Section “peptide candidate mapping experiment”.
-
28.
Add an amount of each QconCAT protein to the samples that corresponds to approximately the mass of the endogenous proteins per 20 μg of total protein. These are the spiked-in concentrations of the QconCATs, which are required for quantification.
Note: The endogenous protein quantity can be estimated from previous studies.23 Usually, 200 fmol/μg total protein is a reasonable start point; this means that if 20 μg of protein are taken for the digestion, 4,000 fmol will be present in the sample. Hence, the QconCAT amount to spike-in would be around 4,000 fmol.
-
29.
Perform tryptic digestion, StageTipping, HPLC-MS and data analysis as described in steps 6–8 of Section “peptide candidate mapping experiment”.
-
30.
Using the Proteome Discoverer results file containing the “Peptide Groups”, the abundance of each QconCAT peptide (heavy peptide) and of each corresponding endogenous peptide (light peptide) can be determined. The concentration of the endogenous peptides, for which a QconCAT protein was constructed, are calculated as shown in Equation 2:
| (Equation 2) |
where is the concentration of the endogenous peptide, is the abundance of the endogenous peptide (light peptide), is the abundance of the 13C-labeled QconCAT peptide (heavy peptide), is the concentration of the QconCAT peptide, is the concentration of the corresponding endogenous protein, and is the number of endogenous peptides for which a 13C-labeled QconCAT peptide was constructed, for a particular endogenous protein. The concentration of the endogenous peptide will have the same unit as the concentration of the QconCAT peptide, e.g., fmol/μg total protein. The concentration of the endogenous protein is either the same as the molar concentration of the corresponding endogenous peptide (due to equimolar concentrations of peptide and protein), or an average of the endogenous peptide concentrations when multiple peptides per endogenous protein where present in the QconCAT protein standard.
Please refer to the following repository https://github.com/biosustain/QconCATquantSTAR to calculate the peptide concentrations. Use the Python script (QconCATquantSTAR.py) to calculate those concentrations in the samples. See the Pseudomonas putida dataset example in the repository for a detailed outcome.
Expected outcomes
This protocol enables the production of labeled peptide concatamers to be used as internal standard. Following this protocol, it is possible to obtain pure QconCATs for absolute quantification of proteins in Gram-negative bacteria. Refer to Figure 5 to see the expected outcomes of the SDS-PAGE analysis of purified QconCATs.
Figure 5.
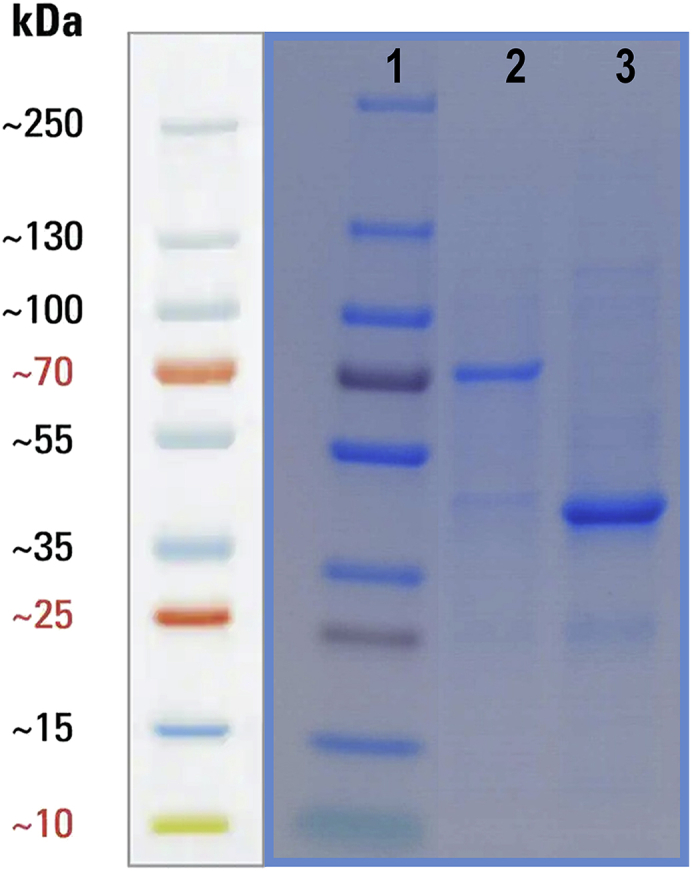
SDS-PAGE analysis of QconCATs
Line 1 corresponds to the Page Ruler Plus Prestained Protein Ladder, 10–250 kDa. Line 2 and 3 shows two examples of purified QconCAT proteins produced by applying this protocol.
Limitations
The main limitation is the unknown nature of the QconCAT produced in a biological (bacterial) system. As it is a construction of several peptides (chimeric protein), it is almost impossible to predict if the protein of interest will be produced in the form of soluble or insoluble protein (Inclusion body). Another limitation is that it is sometimes impossible to select two or three unique or signature peptides for each protein of interest.
Troubleshooting
Problem 1
Slow growth of the strain in minimal medium containing the labeled amino acids after 24 h (step 3.d).
Potential solution
Leave the culture for another 24 h and track the changes in OD600 of the culture; it should reach maximum OD600 after 48 h.
Problem 2
Poor expression of the QconCAT plasmid. This problem can be caused by (i) protein instability and/or (ii) protein toxicity.
Potential solution
In the case of (i), vary expression conditions such as temperature, aeration and induction time. For protein toxicity issues (ii), test different E. coli strains [e.g., BL21(DE3) pLysS or BL21(DE3) pLysE].24
Problem 3
Incomplete QconCAT digestion.
Potential solution
Increase amount of trypsin and modify digestion conditions in order to ensure complete proteolysis.
Problem 4
Filter blocked due to insoluble debris (step 21.c.viii.).
Potential solution
Resuspend the solution inside the filter and transfer it to a 15-mL Falcon tube. Centrifuge at 5,000 g for 10 min and repeat the buffer exchange from step 21.c.vii.
Problem 5
GluFib (or other tag) are not detected or identified in the analysis.
Potential solution
Repeat the analysis adding more QconCAT in the sample.
Resource availability
Lead contact
Further information and requests for resources and reagents should be directed to and will be fulfilled by the lead contact, Pablo Iván Nikel (pabnik@biosustain.dtu.dk).
Materials availability
Further information and requests for resources and reagents should be directed to and will be fulfilled by the lead contact, Pablo Iván Nikel (pabnik@biosustain.dtu.dk).
Acknowledgments
The financial support from the Novo Nordisk Foundation through grants NNF14OC0009473, NNF20CC0035580, LiFe (NNF18OC0034818), and TARGET (NNF21OC0067996), the Danish Council for Independent Research (SWEET, DFF-Research Project 8021-00039B), the European Union’s Horizon 2020 Research and Innovation Programme under grant agreement No. 814418 (SinFonia), and the Cystic Fibrosis Trust, Strategic Research Centre Award–2019–SRC017 to P.I.N. is gratefully acknowledged. L.K.N. is supported by the Novo Nordisk Foundation (grants NNF14OC0009473 and NNF20CC0035580) and the Australian Research Council (grant IC160100027).
Author contributions
N.G. developed, executed, optimized the protocol, and drafted the manuscript. S.K.T.P. performed sample preparation and data analysis and drafted the manuscript. M.F. executed and optimized the methodology. T.W. performed data analysis and optimized the protocol. L.K.N. and P.I.N. provided supervision and funding and contextualized and finalized the manuscript.
Declaration of interests
The authors declare no competing interests.
Data and code availability
The published article includes figures, code and datasets generated with this protocol. The code and datasets are available on GitHub (https://github.com/biosustain/QconCATquantSTAR) and also on Zenodo (https://doi.org/10.5281/zenodo.7330244).
References
- 1.Weimer A., Kohlstedt M., Volke D.C., Nikel P.I., Wittmann C. Industrial biotechnology of Pseudomonas putida: advances and prospects. Appl. Microbiol. Biotechnol. 2020;104:7745–7766. doi: 10.1007/s00253-020-10811-9. [DOI] [PMC free article] [PubMed] [Google Scholar]
- 2.Nikel P.I., de Lorenzo V. Pseudomonas putida as a functional chassis for industrial biocatalysis: from native biochemistry to trans-metabolism. Metab. Eng. 2018;50:142–155. doi: 10.1016/j.ymben.2018.05.005. [DOI] [PubMed] [Google Scholar]
- 3.Nikel P.I., Martínez-García E., de Lorenzo V. Biotechnological domestication of pseudomonads using synthetic biology. Nat. Rev. Microbiol. 2014;12:368–379. doi: 10.1038/nrmicro3253. [DOI] [PubMed] [Google Scholar]
- 4.Nikel P.I., Pérez-Pantoja D., de Lorenzo V. Pyridine nucleotide transhydrogenases enable redox balance of Pseudomonas putida during biodegradation of aromatic compounds. Environ. Microbiol. 2016;18:3565–3582. doi: 10.1111/1462-2920.13434. [DOI] [PubMed] [Google Scholar]
- 5.Maaß S., Becher D. Methods and applications of absolute protein quantification in microbial systems. J. Proteomics. 2016;136:222–233. doi: 10.1016/j.jprot.2016.01.015. [DOI] [PubMed] [Google Scholar]
- 6.Wiśniewski J.R., Rakus D. Multi-enzyme digestion FASP and the ‘Total Protein Approach’-based absolute quantification of the Escherichia coli proteome. J. Proteomics. 2014;109:322–331. doi: 10.1016/j.jprot.2014.07.012. [DOI] [PubMed] [Google Scholar]
- 7.Grabski A.C. Advances in preparation of biological extracts for protein purification. Methods Enzymol. 2009;463:285–303. doi: 10.1016/S0076-6879(09)63018-4. [DOI] [PubMed] [Google Scholar]
- 8.Ishihama Y., Schmidt T., Rappsilber J., Mann M., Hartl F.U., Kerner M.J., Frishman D. Protein abundance profiling of the Escherichia coli cytosol. BMC Genom. 2008;9:102. doi: 10.1186/1471-2164-9-102. [DOI] [PMC free article] [PubMed] [Google Scholar]
- 9.Messana I., Cabras T., Iavarone F., Vincenzoni F., Urbani A., Castagnola M. Unraveling the different proteomic platforms. J. Sep. Sci. 2013;36:128–139. doi: 10.1002/jssc.201200830. [DOI] [PubMed] [Google Scholar]
- 10.Hui S., Silverman J.M., Chen S.S., Erickson D.W., Basan M., Wang J., Hwa T., Williamson J.R. Quantitative proteomic analysis reveals a simple strategy of global resource allocation in bacteria. Mol. Syst. Biol. 2015;11:784. doi: 10.15252/msb.20145697. [DOI] [PMC free article] [PubMed] [Google Scholar]
- 11.Mori M., Zhang Z., Banaei-Esfahani A., Lalanne J.B., Okano H., Collins B.C., Schmidt A., Schubert O.T., Lee D.S., Li G.W., et al. From coarse to fine: the absolute Escherichia coli proteome under diverse growth conditions. Mol. Syst. Biol. 2021;17:e9536. doi: 10.15252/msb.20209536. [DOI] [PMC free article] [PubMed] [Google Scholar]
- 12.Schmidt A., Kochanowski K., Vedelaar S., Ahrné E., Volkmer B., Callipo L., Knoops K., Bauer M., Aebersold R., Heinemann M. The quantitative and condition-dependent Escherichia coli proteome. Nat. Biotechnol. 2016;34:104–110. doi: 10.1038/nbt.3418. [DOI] [PMC free article] [PubMed] [Google Scholar]
- 13.Ong S.E., Mann M. Mass spectrometry–based proteomics turns quantitative. Nat. Chem. Biol. 2005;1:252–262. doi: 10.1038/nchembio736. [DOI] [PubMed] [Google Scholar]
- 14.Belda E., van Heck R.G.A., José Lopez-Sanchez M., Cruveiller S., Barbe V., Fraser C., Klenk H.P., Petersen J., Morgat A., Nikel P.I., et al. The revisited genome of Pseudomonas putida KT2440 enlightens its value as a robust metabolic chassis. Environ. Microbiol. 2016;18:3403–3424. doi: 10.1111/1462-2920.13230. [DOI] [PubMed] [Google Scholar]
- 15.Volke D.C., Calero P., Nikel P.I. Pseudomonas putida. Trends Microbiol. 2020;28:512–513. doi: 10.1016/j.tim.2020.02.015. [DOI] [PubMed] [Google Scholar]
- 16.Jeong H., Kim H.J., Lee S.J. Complete genome sequence of Escherichia coli strain BL21. Genome Announc. 2015;3:e00134-15. doi: 10.1128/genomeA.00134-15. [DOI] [PMC free article] [PubMed] [Google Scholar]
- 17.Volke D.C., Turlin J., Mol V., Nikel P.I. Physical decoupling of XylS/Pm regulatory elements and conditional proteolysis enable precise control of gene expression in Pseudomonas putida. Microb. Biotechnol. 2020;13:222–232. doi: 10.1111/1751-7915.13383. [DOI] [PMC free article] [PubMed] [Google Scholar]
- 18.Rappsilber J., Mann M., Ishihama Y. Protocol for micro-purification, enrichment, pre-fractionation and storage of peptides for proteomics using StageTips. Nat. Protoc. 2007;2:1896–1906. doi: 10.1038/nprot.2007.261. [DOI] [PubMed] [Google Scholar]
- 19.Wirth N.T., Gurdo N., Krink N., Vidal-Verdú À., Donati S., Férnandez-Cabezón L., Wulff T., Nikel P.I. A synthetic C2 auxotroph of Pseudomonas putida for evolutionary engineering of alternative sugar catabolic routes. Metab. Eng. 2022;74:83–97. doi: 10.1016/j.ymben.2022.09.004. [DOI] [PubMed] [Google Scholar]
- 20.Kozaeva E., Volkova S., Matos M.R.A., Mezzina M.P., Wulff T., Volke D.C., Nielsen L.K., Nikel P.I. Model-guided dynamic control of essential metabolic nodes boosts acetyl-coenzyme A–dependent bioproduction in rewired Pseudomonas putida. Metab. Eng. 2021;67:373–386. doi: 10.1016/j.ymben.2021.07.014. [DOI] [PubMed] [Google Scholar]
- 21.Calderón-Celis F., Encinar J.R., Sanz-Medel A. Standardization approaches in absolute quantitative proteomics with mass spectrometry. Mass Spectrom. Rev. 2018;37:715–737. doi: 10.1002/mas.21542. [DOI] [PubMed] [Google Scholar]
- 22.Lozano Terol G., Gallego-Jara J., Sola Martínez R.A., Martínez Vivancos A., Cánovas Díaz M., de Diego Puente T. Impact of the expression system on recombinant protein production in Escherichia coli BL21. Front. Microbiol. 2021;12:682001. doi: 10.3389/fmicb.2021.682001. [DOI] [PMC free article] [PubMed] [Google Scholar]
- 23.Gao Y., Fillmore T.L., Munoz N., Bentley G.J., Johnson C.W., Kim J., Meadows J.A., Zucker J.D., Burnet M.C., Lipton A.K., et al. High-throughput large-scale targeted proteomics assays for quantifying pathway proteins in Pseudomonas putida KT2440. Front. Bioeng. Biotechnol. 2020;8:603488. doi: 10.3389/fbioe.2020.603488. [DOI] [PMC free article] [PubMed] [Google Scholar]
- 24.Volke D.C., Friis L., Wirth N.T., Turlin J., Nikel P.I. Synthetic control of plasmid replication enables target- and self-curing of vectors and expedites genome engineering of Pseudomonas putida. Metab. Eng. Commun. 2020;10:e00126. doi: 10.1016/j.mec.2020.e00126. [DOI] [PMC free article] [PubMed] [Google Scholar]
Associated Data
This section collects any data citations, data availability statements, or supplementary materials included in this article.
Data Availability Statement
The published article includes figures, code and datasets generated with this protocol. The code and datasets are available on GitHub (https://github.com/biosustain/QconCATquantSTAR) and also on Zenodo (https://doi.org/10.5281/zenodo.7330244).