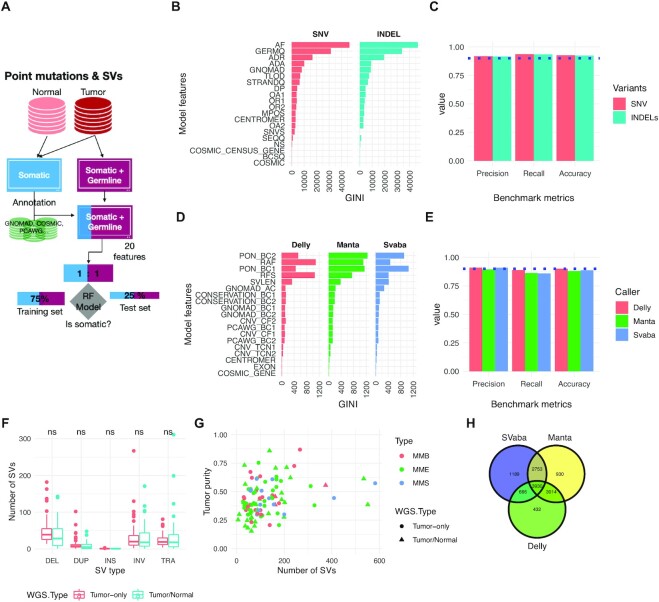
Figure 5:
Performance of somatic point mutation and structural variant calling from tumor-only samples. (A) Schematic of the benchmarking procedure. (B) Random forest (RF) model features and their ranking for predicting somatic single-nucleotide variant (SNV) and indels. (C) Performance metrics (precision, recall, accuracy) for classifying somatic point mutations with the best-performing RF models. (D) Structural variant (SV) random forest model features and their ranking for predicting somatic SVs. (E) Performance metrics for classifying somatic SVs. (F) Number of SVs as function of WGS type. Mean comparison between WGS types was performed using a t-test with no significant (ns) result found. (G) Number of SVs as a function of tumor purity. A linear model (number_sv ∼Purity*WGS_type*SubType) was built to predict the number of SVs, and no significant coefficients (P < 0.05) were found. (H) Venn diagram of the final consensus MESOMIC SV set.

