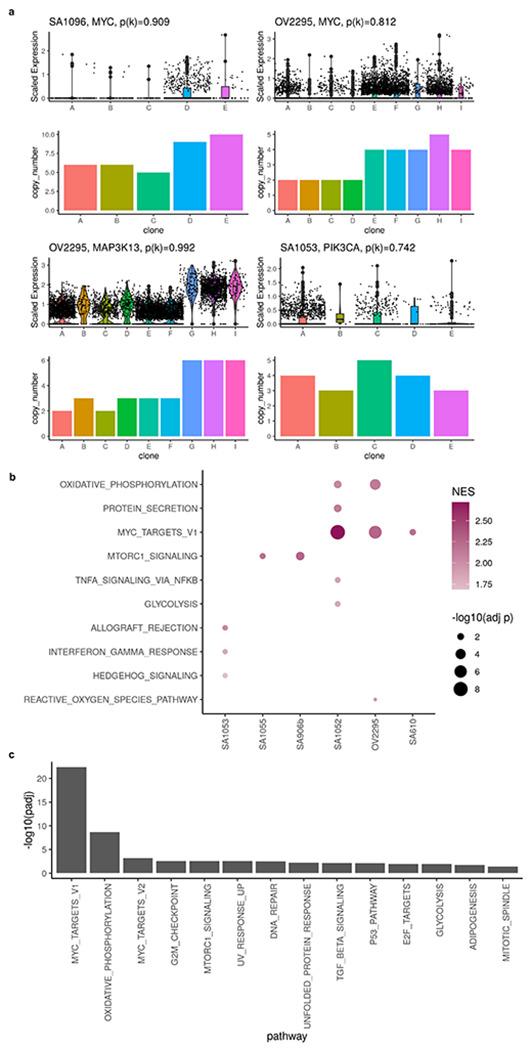
Extended Data Fig. 9: Gene set enrichment analysis of low p(k) genes.

c, Example of genes with high level amplifications and high CN dosage effects. b, Dot plot showing significantly enriched pathways in low p(k) genes. b, Significantly enriched pathways in low p(k) genes from all primary tumors and cell lines. p(k) from all samples were combined before performing gene set enrichment analysis.
