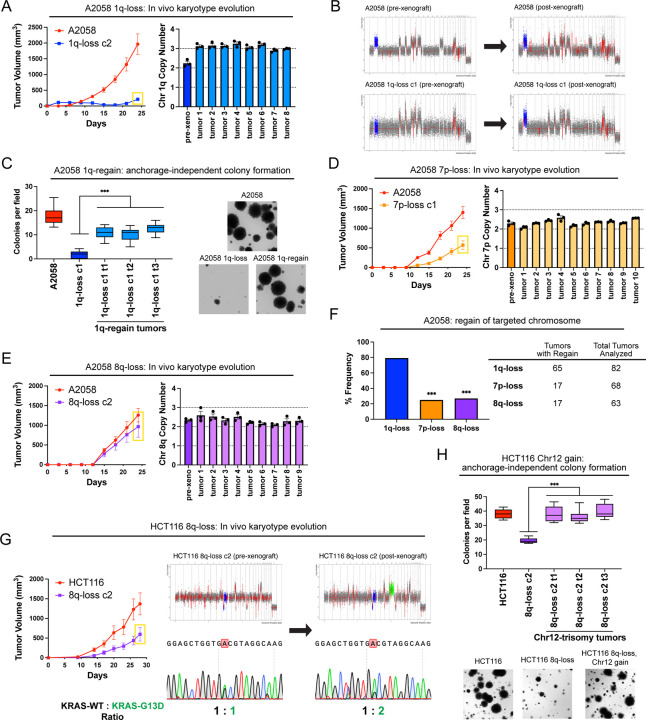
Figure 4. Cancers rapidly recover chromosome 1q aneuploidy.
(A) A2058 1q-disomic cells frequently evolve to recover a third copy of chromosome 1q during xenograft growth.
(B) Representative SMASH karyotypes of A2058 wildtype and 1q-disomic tumors. The initial karyotypes for these lines prior to the xenograft assay are shown on the left, and karyotypes of tumors following the xenograft assay are shown on the right. Chromosome 1q is highlighted in blue.
(C) 1q-disomic clones that have evolved to regain 1q-trisomy following xenograft growth exhibit increased anchorage-independent growth relative to the pre-xenograft 1q-disomic parental cells.
(D) Variable evolution of 7p-disomic cells to recover a third copy of chromosome 7p during xenograft growth.
(E) Variable evolution of 8q-disomic cells to recover a third copy of chromosome 8q during xenograft growth.
(F) Regain of trisomy 1q occurs more frequently than regain of trisomy 7p or trisomy 8q. Tumors were classified as exhibiting regain if the mean copy number of the targeted chromosome was ≥ 2.5, as determined through TaqMan copy number assays. n = 213 tumors, chi-squared test.
(G) HCT116 8q-disomic clones evolve to gain a copy of chromosome 12 during xenograft assays, resulting in the acquisition of an extra copy of the KRASG13D allele. Cell lines were rederived from tumors harvested at the endpoint of xenograft assays, and subjected to SMASH karyotyping and Sanger sequencing of KRAS. The xenograft growth curve is shown on the left, and representative SMASH karyotype profiles and Sanger sequencing chromatograms pre- and post-xenograft are shown on the right. Chromosome 8q is highlighted in blue and chromosome 12 is highlighted in green.
(H) 8q-disomic clones that have evolved to acquire trisomy of chromosome 12 following xenograft growth exhibit increased anchorage-independent growth relative to the pre-xenograft 8q-disomic parental cells.
For copy number profiling in A, D, and E, cell lines were rederived from tumors at the endpoint of the xenograft assays, and chromosome copy number was determined through TaqMan copy number assays. Mean ± SEM, n = 3 probes on targeted chromosome, data from representative trials are shown. The corresponding xenograft assays are shown on the left.
For the anchorage-independent growth assays in C and H, the boxes represent the 25th, 50th, and 75th percentiles of colonies per field, while the whiskers represent the 10th and 90th percentiles. Unpaired t-test, n = 15 fields of view, data from representative trial. Representative images are shown on the right.
***p < 0.0005

