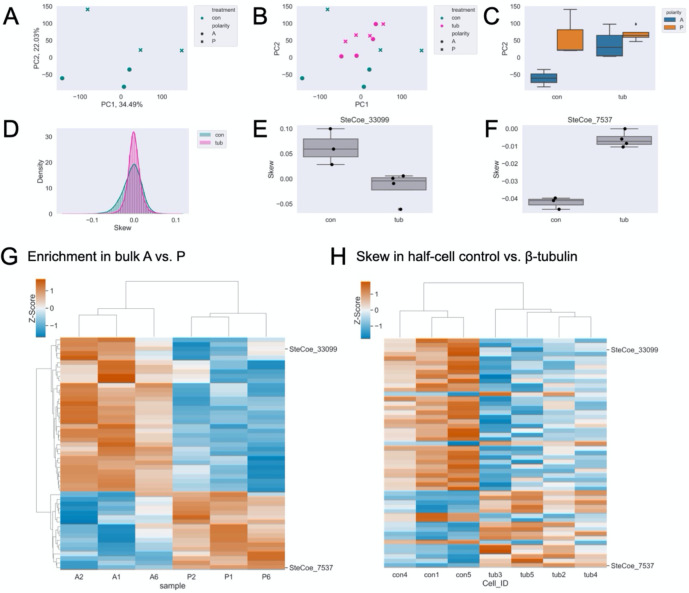
Figure 3. β-tubulin knockdown results in loss of typical cell morphology and mRNA regionalization.
(A) PCA on control half-cell RNA data showing a clear separation of anterior (circles) and posterior (x’s) on PC2. (B) Projection of β-tubulin (pink) knockdown half-cells onto the control (green) PC space. (C) Boxplot of PC2 scores for control (left) and β-tubulin (right) data group by anterior (blue) or posterior (orange). (D) Distribution of individual gene skew values in control (green) and β-tubulin RNAi (pink). (E) Representative example, SteCoe_33099, with anterior skew that becomes more posterior upon β-tubulin knockdown. (F) Representative example, SteCoe_7537, with posterior skew that becomes more anterior upon β-tubulin knockdown. (G) Heatmap of relative abundance (z-scores) where rows correspond to individual genes and columns are both differentially enriched in bulk sequencing and differentially skewed upon on β-tubulin knockdown. Red indicates higher enrichment and blue indicates lower enrichment. (H) Heatmap of skew (z-scores) in control and β-tubulin RNAi maintaining the same gene order as (G). Red indicates positive skew corresponding to relative enrichment in anterior, blue indicates negative skew corresponding to relative enrichment in the posterior. The four columns on the right cluster the four β-tubulin RNAi cell datasets, and it can be seen that for many genes the skew is now opposite in sign from that seen in controls.

