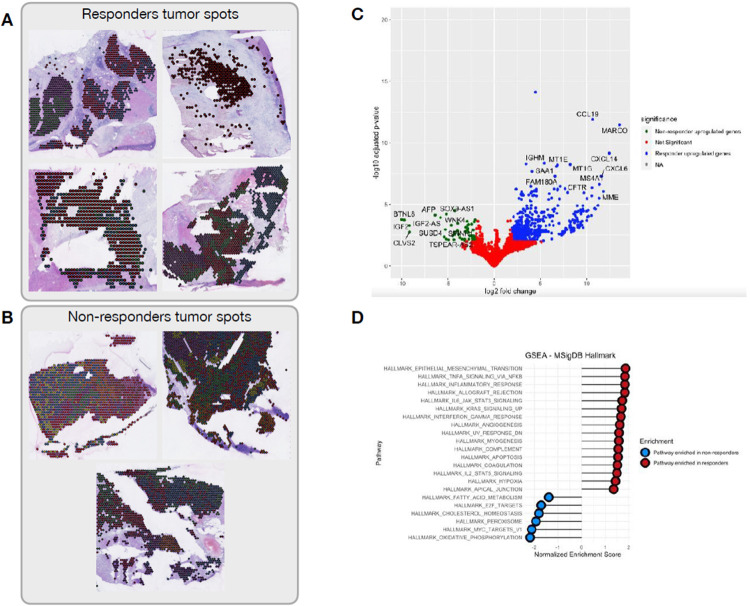
FIGURE 2.
Differential expression analysis of (A) tumor clusters from responders versus (B) tumor clusters from non-responders across all patients. C. Volcano plot of the differential expression analysis showing the most differentially expressed genes in responders (blue dots) and non-responders (green dots), showing up-regulation of immune genes in responders relative to the up-regulation of hepatocellular markers among non-responders. D. Pathway enrichment analysis between responders (red dots) and non-responders (blue dots) reveal activation of immune related pathways in responders tumors, while non-responders tumors have activation of proliferation and metabolic pathways.

