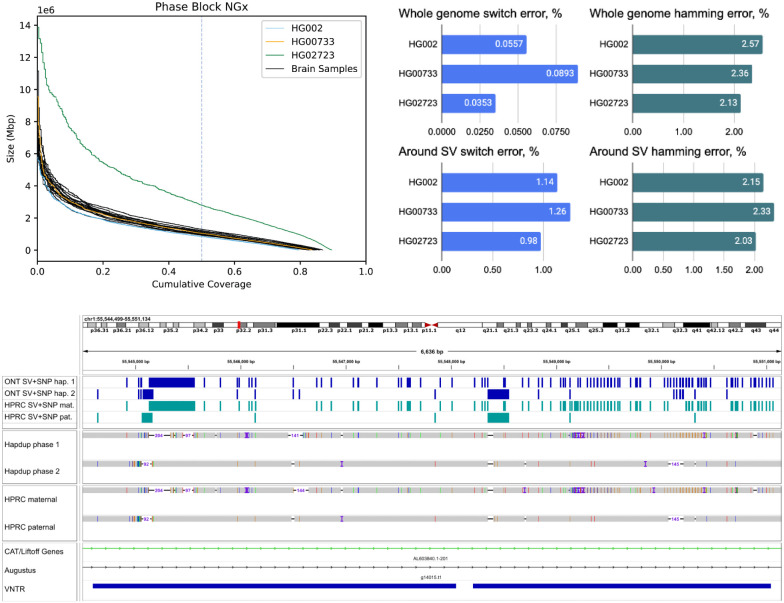
Figure 5. Combined, phased small and structural variants improve the profiling of complex genomic regions.
(Top) Variant phasing evaluation. Left plot shows the phased block NGx, reported by Margin. HG02723 has an increased phase block length due to higher heterozygosity. Right plots show SNP hamming and switch error computed against the small variants in HiFi-based assemblies. Evaluations are also shown for a subset of SNPs that are within 100 bp of structural variants (Bottom) An example of a Hapdup and hifiasm representations of complex clusters with small and structural variants at chr1:55,544,500- 55,551,000 (in CHM13 reference), visualized using IGV. Top tracks show phased SNPs and SVs produced by our pipeline and derived from HPRC assemblies (using dipcall). A few inconsistencies between SNP positions are explained by ambiguities between read and contig alignments around SV sites.

