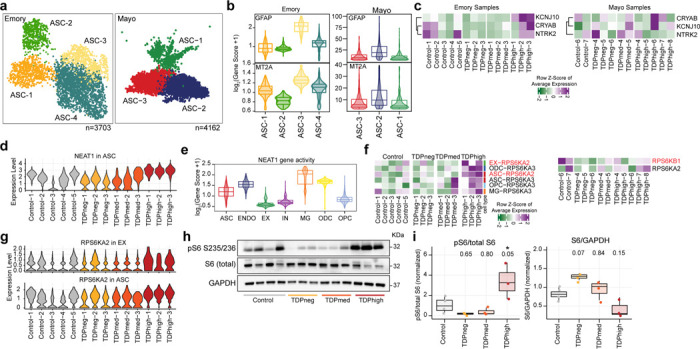
Fig. 5. Changes of gene expression in astrocytes are more pronounced in pTDPhigh samples.

(a) UMAP plots of astrocyte (ASC) clusters for Emory (left) and Mayo (right) cohorts. (b) Astrocyte clusters exhibit differential levels of GFAP and MT2A in both cohorts. (c) Changes in gene expression of astrocyte reactivity marker genes. (d) NEAT1 expression in astrocytes for all samples in the Emory cohort. (e) Cell type specificity of NEAT1 gene activity. (f) Changes of RPS6KA2 and RPS6KA3 gene expression are more significant in pTDPhigh samples. (g) RPS6KA2 is upregulated both in astrocytes and excitatory neurons. (h) Western immunoblot images of phosphorylated ribosomal protein S6, total ribosomal protein S6, and GAPDH (i) Quantification of the ratio of phosphorylated ribosomal protein S6 to total protein (left) and total ribosomal protein S6 to GAPDH. 1-way ANOVA with Tukey’s post hoc test, adjusted p-values are shown, and *P < 0.05).
