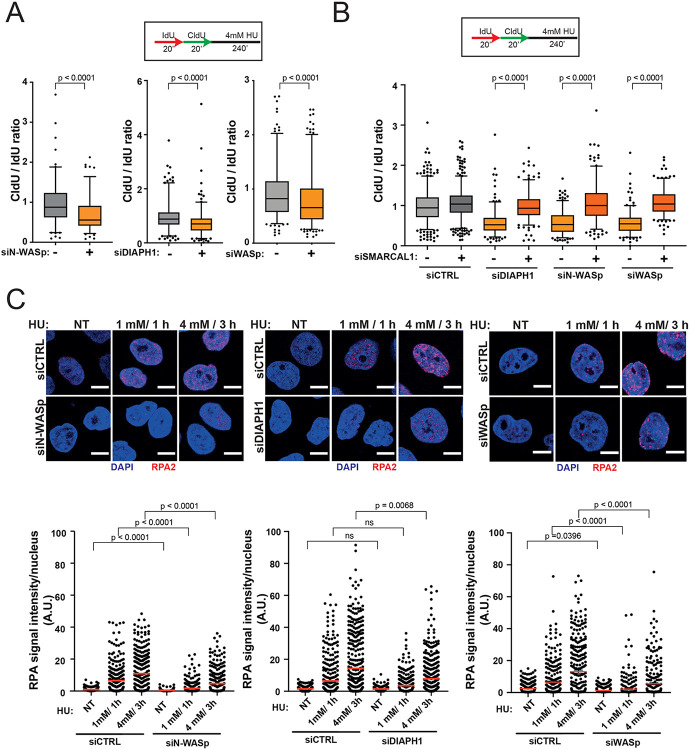
Figure 4. Depletion of WASp, N-WASp or DIAPH1 leads to increased degradation of nascent DNA and defects in RPA recruitment to perturbed replication forks.
A. Box plots of CldU/IdU tract ratios from HeLa cells treated with control siRNA(−) or siRNA targeting N-WASp, DIAPH1 or WASp (+). CldU/IdU pulse labelling was followed by treatment with 4mM HU for 4h. Whiskers indicate 5-95 percentile. Box plots represent data pooled from four (siWASp), or two (siN-WASp, siDIAPH1) independent experiments. Statistical significance was determined using the Mann-Whitney test.
B. Box plots of CldU/IdU tract ratios from HeLa cells treated with control siRNA or siRNA targeting N-WASp, DIAPH1 or WASp and SMARCAL1. CldU/IdU pulse labelling was followed by treatment with 4mM HU for 4h. Whiskers indicate 5-95 percentile. Box plots represent data pooled from two independent experiments. Statistical significance was determined using the Mann-Whitney test.
C. Representative images and dot plots of RPA signal intensity per nucleus of Hela cells treated with control siRNA or siRNA targeting N-WASp, DIAPH1 or DIAPH1 upon HU treatment as indicated (red lines indicate mean values). Dot plots represent data pooled from three (siN-WASp and siWASp) or three (siDIAPH1) independent experiments. Statistical significance was determined using the Mann-Whitney test.

