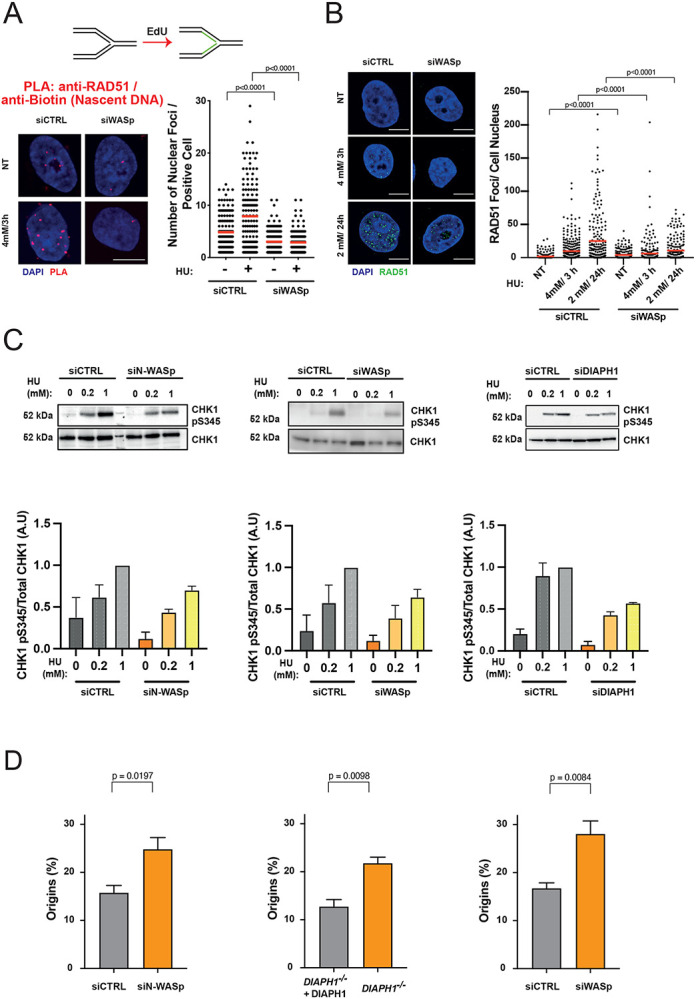
Figure 5. Depletion of WASp, N-WASp or DIAPH1 leads to defects in ATR signalling activation.

A. Dot plots of number of RAD51/Biotin (Nascent DNA) PLA foci per nucleus in HeLa cells treated with control siRNA or siRNA against WASp upon treatment with 4 mM HU for 3 hours. Dot plots represent data pooled from two independent experiments (red lines indicate mean values). Statistical significance was determined using the Mann-Whitney test.
B. Representative images and dot plots of the number of RAD51 foci per nucleus in HeLa cells treated with control siRNA or siRNA targeting WASp upon HU treatment. Dot plots represent data pooled from two independent experiments. Statistical significance was determined using the Mann-Whitney test.
B. WB showing CHK1 phosphorylation in HeLa cells with or without indicated HU treatment for 1 h, treated with control siRNA (siCTRL) or siRNA targeting N-WASp or WASp as well as the same analysis in DIAPH1-deficient patient-derived cells and the corresponding control cells. Bar charts represent mean +/− SEM of three experiments and statistical significance was determined using t test.
C. Quantification of the frequency of origin firing in HeLa cells treated with control siRNA or siRNA against N-WASp, WASp or DIAPH1. Bar charts represent mean +/− SEM of four (siN-WASp and siWASp) or three (DIAPH1) independent experiments. Statistical significance was determined using t test.
