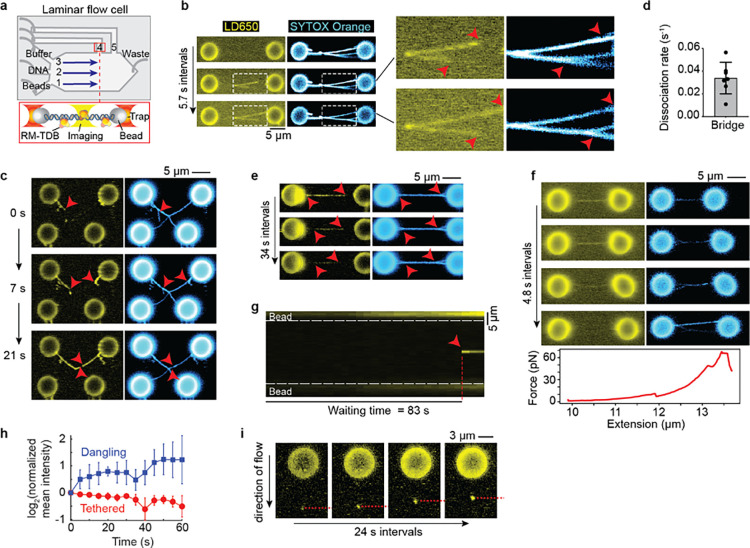
Fig. 5: Single-molecule fluorescence imaging of interactions of the RM-TDB domain with DNA.
(a) Schematic of experimental setup (not to scale). Streptavidin-coated beads, biotinylated λ-DNA and PBS buffer were separated by laminar flow in channel 1–3, respectively. After tether formation, beads were moved to channels 4 or 5 for protein loading and imaging. The RM-TDB protein concentration in all C-trap experiments was 20 nM. (b) Bridging of multiple tethered DNA duplexes by the RM-TDB domain. Arrows in insets indicate where separate DNA molecules branch apart, coinciding with the ends of RM-TDB tracks. See also Supplemental Movie 1. (c) Dangling DNA bundled together with stretched tethers. Arrows indicate dangling λ-DNA molecules (i.e., attached to only one bead) that are initially stretched out by flow but become progressively coaligned with segments from the tethers connecting the top pair of beads. Bundling of the dangling DNA with the tethers is coincident with extension of tracks of RM-TDB binding. Note that the single DNA tether that connects the lower pair of beads did not acquire any coating by the RM-TDB. See also Supplemental Movie 2. (d,e) Quantification of protein dissociation rates (panel d) and representative example (panel e) of disassembly of protein-DNA bridges moved into a protein-free channel. Red arrows in panel e indicate locations where the DNA molecules became separated. See also Supplemental Movie 3. Each point in panel d is a measurement from a single bridge (N=7; example in Fig. s9b); error bars indicate SD. (f) Force-promoted reversal of the RM-TDB bridge assembly. As beads connected by bridged tethers were pulled apart with increasing force, LD650 fluorescent signal decreased over time, indicating that RM-TDB was undergoing net dissociation despite free protein remaining available in the channel. Segments of the coaligned DNA tethers became separated coincident with loss of protein binding. The corresponding force-extension curve is plotted below. (g) Example kymograph of sudden focal binding of the RM-TDB domain (red arrow) to a stretched tether. The waiting time is the interval between introduction of the beads to the protein channel and first appearance of the focus. The white dashed lines indicate bead boundaries. See also Supplemental Movie 4. (h) Average change in protein fluorescence intensity over time for focal binding events on stretched tethers (red, N = 4) or on dangling DNA (blue, N = 9). The fluorescence signal at each time point was normalized to the signal in the first frame where binding of RM-TDB was detected (see Methods). Error bars indicate SD. (i) Accumulation of RM-TDB pulls dangling DNA against flow. A representative example is shown of RM-TDB binding to the tip of a dangling λ-DNA molecule bound to a single bead and stretched by flow. Over time, the protein-bound tip of the dangling DNA retracted upward toward the bead as indicated by the dashed red dashed line. See also Supplemental Movie 5.

