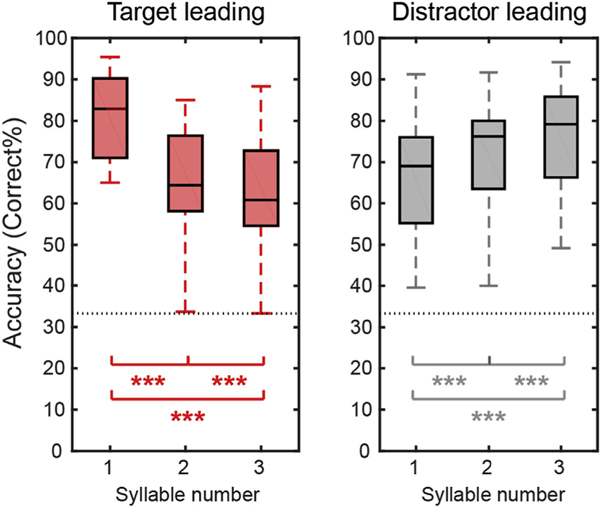
Fig. 2.
Behavioral performance averaged across subjects for the target leading (left panel) and distractor leading (right panel) conditions. Within each panel, we show boxplots of percent correct responses (central black line shows the across-subject mean; boxes show the 25th – 75th percentile ranges; error bars show the range from minimum to maximum) for each syllable position within the target stream. The horizontal gray dashed line shows chance performance (33%). Asterisks indicate percentages that differ significantly from one another based on post hoc tests (*p < 0.05; **p < 0.01; ***p < 0.001).

