

Abstract
Purpose
Disparities in breast cancer survival have been observed within marginalized racial/ethnic groups and within the rural–urban continuum for decades. We examined whether there were differences among the intersectionality of race/ethnicity and rural residence on breast cancer outcomes.
Methods
We performed a retrospective analysis among 739,448 breast cancer patients using Surveillance Epidemiology and End Results (SEER) 18 registries years 2000 through 2016. We conducted multilevel logistic-regression and Cox proportional hazards models to estimate adjusted odds ratios (AORs) and hazard ratios (AHRs), respectively, for breast cancer outcomes including surgical treatment, radiation therapy, chemotherapy, late-stage disease, and risk of breast cancer death. Rural was defined as 2013 Rural–Urban Continuum Codes (RUCC) of 4 or greater.
Results
Compared with non-Hispanic white–urban (NH-white–U) women, NH-black–U, NH-black–rural (R), Hispanic–U, and Hispanic–R women, respectively, were at increased odds of no receipt of surgical treatment (NH-black–U, AOR = 1.98, 95% CI 1.91–2.05; NH-black–R, AOR = 1.72, 95% CI 1.52–1.94; Hispanic–U, AOR = 1.58, 95% CI 1.52–1.65; and Hispanic–R, AOR = 1.40, 95% CI 1.18–1.67), late-stage diagnosis (NH-black–U, AOR = 1.32, 95% CI 1.29–1.34; NH-black–R, AOR = 1.29, 95% CI 1.22–1.36; Hispanic–U, AOR = 1.25, 95% CI 1.23–1.27; and Hispanic–R, AOR = 1.17, 95% CI 1.08–1.27), and increased risks for breast cancer death (NH-black–U, AHR = 1.46, 95% CI 1.43–1.50; NH-black–R, AHR = 1.42, 95% CI 1.32–1.53; and Hispanic–U, AHR = 1.10, 95% CI 1.07–1.13).
Conclusion
Regardless of rurality, NH-black and Hispanic women had significantly increased odds of late-stage diagnosis, no receipt of treatment, and risk of breast cancer death.
Supplementary Information
The online version contains supplementary material available at 10.1007/s10549-022-06830-x.
Keywords: Cancer, Breast cancer, Rural/urban, Race, Disparities
Introduction
Decades of research shed light to the inequitable access to healthcare across geographic locations. Rural populations have a greater prevalence rate of chronic diseases, higher incidence of late-stage cancers, and higher mortality rate than urban populations [1–3]. Nationally, incidence and mortality rates of lung, colorectal, and particularly breast cancer have decreased in recent years, although this progress has not equally affected rural, lower socioeconomic, or racial/ethnic minority populations [4–10]. In 2021, Non-Hispanic white (NH-white) women had a highest incidence of breast cancer (131.8 per 100,000), followed by Non-Hispanic black (NH-black) women (124.7 per 100,000), Asian/Pacific Islander (API) women (105.1 per 100,000), and Hispanic women (100.3 per 100,000) [11]. Despite this, NH-black women have disproportionately higher breast cancer mortality rates compared to other race-ethnicities, particularly NH-white women (27.1 deaths per 100,000 for NH-black women vs 19.4 deaths per 100,000 for NH-white women) [11].
These disparities are partly explained by social determinants of health, including socioeconomic inequalities [12, 13], differential access to high-quality screening and healthcare resources [14, 15], factors that influence stage at diagnosis and receipt of guideline-adherent treatment [16], and therefore survival [17]. Moreover, molecular subtypes of breast cancer have been shown to have varying prevalence by race. Particularly, premenopausal Hispanic and NH-black women are more likely to be diagnosed with triple-negative breast cancer compared to women of other race/ethnicities [18, 19].
Understanding the influence geographic location has on accessibility to healthcare can bridge gaps in rural–urban disparities. Those living in rural communities often experience additional barriers to appropriate care across the cancer continuum, including inadequate screening [20–22], prolonged follow-up after abnormal screening tests [23, 24], and excess travel time and distance for treatment of diagnosed cancers [16, 25, 26]. A recent study by Mobley et al. (2021) reported that counties in the United States (U.S.) with persistent “hot spots” for breast cancer late-stage diagnosis were located within deprived areas characterized by lower socioeconomic status SES, lower levels of health insurance, decreased access to mammography screening, and more isolated minority (racially segregated) neighborhoods [27]. Moreover, another study using the Georgia cancer registry observed a 53% increased risk of breast cancer death among NH-black rural women, when compared to NH-white rural women [28]. Similarly, Singh et al. (2011) observed that there was a 6.2% increase in breast cancer mortality for every unit increase in rural–urban continuum (i.e., more rural counties) among all women, a 7.9 unit increase among NH-white women, and a 1.3% unit increase among NH-black women, though non-significant [29]. In this study, we sought to examine whether there were differences on the intersectionality of race/ethnicity and rurality with breast cancer outcomes.
Methods
Data source
We utilized data from the Surveillance Epidemiology and End Results (SEER) 18 registries custom data (with additional treatment fields) (http://seer.cancer.gov), November 2018 submission (1975–2016 varying) linked with county-level attributes. Since 1973, the SEER program provides information regarding cancer statistics in effort to reduce the cancer burden among the U.S. population and the data are collected and curated by the National Cancer Institute Division of Cancer Control and Population Sciences. Specifically, SEER 18 registries cover approximately 27.8% of the U.S. population (based on the 2010 Census) including cancer patient data from 18 geographic areas and cancer registries [30].
Ethical statement
This study was considered exempt by the Institutional Review Boards of Augusta University and Washington University School of Medicine because we utilized pre-existing secondary data that are publicly available and deidentified.
Study population
We performed the “case listing” function through SEER*Stat software (version 8.3.6) to export potential cases, a total of 1,187,514 breast cancer patients diagnosed between 1975 and 2016, for analysis from the SEER 18 database. Women were excluded if they were diagnosed prior to 2000 (n = 348,245); had unknown rural or urban designation (n = 1148); were missing follow-up time (n = 4282); were missing information breast cancer stage at diagnosis (n = 67,471); had unknown age (n = 33); had other or unknown race/ethnicity (n = 6428), and breast cancer was not first primary cancer diagnosis (n = 20,459). Corresponding, our analytic sample consisted of 739,448 female breast cancer women for analysis.
Exposure(s) of interest and potential confounders
Our primary exposures of interest were race/ethnicity and rural–urban designation for each patient. SEER coded race and ethnicity data were obtained through electronic medical records, provider notes, photographs, and any other sources used to determine race [31]. Race/ethnicity categories included non-Hispanic white, non-Hispanic black, non-Hispanic Asian/Pacific Islander, and Hispanic. To classify the urban or rural women, we utilized the 2013 Rural–Urban Continuum Codes (RUCC) [32]. The 2013 RUCCs classify metropolitan counties by population size and non-metropolitan counties by the degree of urbanization and their proximity to a metropolitan area. Consistent with previous urban–rural thresholds [33–35], we classified women in counties with codes 1–3 as urban, while counties coded 4–9 were categorized as rural. We subsequently categorized women based on their race/ethnicity and rural–urban status into eight mutually exclusive groups: (1) NH-white/urban, (2) NH-black/urban, (3) API/urban, (4) Hispanic/urban, (5) NH-white/rural, (6) NH-black/rural, (7) API/rural, and (8) Hispanic/rural. Potential confounders that were known risk factors for breast cancer survival included patient-level characteristics (e.g., age, marital status), and tumor characteristics (e.g., breast cancer subtype, laterality). The classification of cancer status is based on SEER variables relating to the hormone receptor status of tumors recorded by the SEER program [36]. SEER provided estrogen receptor (ER) and progesterone receptor (PR) status of breast tumors since 1990, but not for human epidermal growth factor receptor (HER2) until data collected 2010 and later. Thus, we only reported ER/PR status for breast cancer status for consistency over study period.
We included county-level attributes [37] pertaining to socioeconomic/demographic (SES) and health care access (HCA). SEER investigators linked each patient (case-listing) with county-level attributes obtained from the Census’ American Community Survey (ACS) 5-year summary files based on the county of their residence at cancer diagnosis. We selected 2013–2017 ACS county attributes for this analysis to provide the area-level measures that were consistent with the latest observed period of incident cases. SES county attributes that were included are percentage of county population with less than 9th grade education, percentage of families living with household income below the federal poverty level, and the percentage of county population ages 16 and older who are unemployed. HCA county attributes that were included are percentage of women aged 40 and older with a mammography screening with prior 2 years small-area estimation from 2008 to 2010, ratio of population to primary care physicians (adapted from the 2017 Area Health Resource File/American Medical Association via the 2020 County Health Ranking’s file), and percentage of county population uninsured (adapted from the 2017 Small Area Health Insurance Estimates via the 2020 County Health Ranking’s file) [38].
Outcome(s) of interest
There were five outcome variables of interest in this study: (1) stage at diagnosis based on the SEER summary stage variable and categorized as late stage (if regional or distant) or early stage (if in situ and localized); (2) surgical treatment given or not, regardless of reason; (3) radiation treatment given or not, regardless of reason; (4) chemotherapy treatment given or not, regardless of reason; and (5) breast cancer-specific death and time to death [39].
Statistical analysis
We compared the distribution of the SEER sample characteristics between groups of race/ethnicity and rural–urban status using Chi-square tests for categorical variables. We presented these descriptive statistics as the count and relative frequencies (percentages) for each categorical variable. We conducted consecutive multilevel logistic-regression (generalized linear mixed models) models for the binary outcomes of (1) late-stage diagnosis, (2) no surgical treatment, (3) no radiation therapy, and (4) no chemotherapy. The estimates derived from these multilevel logistic-regression models are interpreted as adjusted odds ratios (AORs) and 95% confidence intervals (CIs). We examined the proportional hazards assumption for breast cancer-specific mortality by Schoenfeld residuals, and by graphically assessing the log–log plots of survival. After confirming the proportionality of hazards assumption, we estimated the hazard/risk of breast cancer death by each group of race/ethnicity and rural–urban status (referent group was NH-white/urban women) and fit Cox proportional hazards models with time-to-breast cancer-related death as the outcome and censored women at the time of death, or the end of follow-up (December 31, 2016). The mean follow-up time was 6.67 years (standard deviation = 4.69). We estimated the mean survival times using the product-limit method of the Kaplan–Meier survival estimator. We examined the survival function of cancer mortality by rural/urban status overall, and then stratified by race/ethnicity using the Kaplan–Meier method. The estimates derived from the Cox proportional hazards models are interpreted as adjusted hazard ratios (AHRs) and associated 95% CIs. We performed four adjusted models to understand the effect of the intersectionality of race/ethnicity with rurality on breast cancer outcomes by accounting for known potential confounders considering the social determinants of health (SES and HCA): (1) the first adjusted for age, SEER registry, and ER/PR status; (2) SES adjusted model which included age, SEER registry, and county SES attributes of county population with less than 9th grade education, percentage of families living with household income below the federal poverty level, and the percentage of county population aged 16 and older who are unemployed; (3) HCA adjusted model which included age, SEER registry, and county HCA attributes of percentage of women aged 40 and older with a mammography screening with prior 2 years small-area estimation from 2008 to 2010, ratio of population to primary care physicians, and percentage of county population uninsured; and (4) a fully adjusted model accounting for age, SEER registry, HR status, and both county SES and HCA attributes, late-stage diagnosis, surgery, radiation, and chemotherapy treatment. In secondary analyses, we performed fully adjusted models and stratified by breast cancer estrogen receptor (ER)/ progesterone receptor (PR) status. We used SAS version 9.4 for all statistical analyses. We considered p values ≤ 0.05 and confidence intervals excluding the null value (odds ratio = 1.00) as statistically significant.
Results
Sociodemographic of SEER women 2000—2016
Table 1 displays demographics of SEER participants (n = 739,448) diagnosed with breast cancer between 2000 and 2016. The average age of participants was 60.2 years, and 56% of SEER participants were married or had a domestic partner. Among the breast cancer patients, NH-black–rural (40.9%), urban (40.2%) and Hispanic–urban (39.2%), and rural (36.3%) women were more likely to be diagnosed with late-stage breast cancer compared to their NH-white counterparts (p value < 0.001). NH-black women in urban (44.2%) and rural (43.6%) locations are more likely to be diagnosed with a grade III tumor, when all other women were more likely to be diagnosed with a grade II tumor (NH-white 41.6% urban vs 40.3% rural; API 41.5% urban vs 45.9% rural; Hispanic 39.0% urban vs 38.4% rural). NH-black urban (27.6%), rural (27.2%) and Hispanic–urban (18.9%) and rural women (17.4%) were more likely to be diagnosed with ER-/PR- tumor status compared to their NH-white counterparts (p value < 0.001). NH-black urban (6.7%), rural (6.0%), and Hispanic–rural women (6.1%) are more likely to not undergo surgical treatment, compared to NH-white women (p value < 0.001). NH-white–urban women were more likely to have undergone radiation (53.0%), when all other participants were more likely to not receive radiation treatment. However, Hispanic–urban women, NH-black–urban women, and NH-black–rural women were more likely to undergo chemotherapy, 48.5%, 50.8%, and 50.4% respectively.
Table 1.
Summary of population characteristics of 739,448 participants by race/ethnicity and rural residence, among Surveillance Epidemiology and End Results (SEER) women diagnosed between 2000 and 2016
| Urban (column %) | Rural (column %) | ||||||||
|---|---|---|---|---|---|---|---|---|---|
| NH–white (n = 463,627) |
NH–black (n = 70,282) |
API (n = 57,191) |
Hispanic (n = 74,345) |
NH–white (n = 64,012) |
NH–black (n = 5,645) |
API (n = 1,650) |
Hispanic (n = 2,696) |
Overall (739,448) |
|
| Characteristics | |||||||||
| Age | |||||||||
| < 40 | 20,382 (4.4) | 5694 (8.1) | 4564 (8.0) | 7447 (10.0) | 2404 (3.8) | 386 (6.8) | 118 (7.2) | 241 (8.9) | 41,236 |
| 40–49 | 76,365 (16.5) | 15,060 (21.4) | 14,061 (24.6) | 19,038 (25.6) | 8882 (13.9) | 1130 (20.0) | 277 (16.8) | 560 (20.8) | 135,373 |
| 50–59 | 113,789 (24.5) | 19,155 (27.3) | 15,533 (27.2) | 19,726 (26.5) | 14,855 (23.2) | 1493 (26.5) | 406 (24.6) | 677 (25.1) | 185,634 |
| 60–69 | 116,224 (25.1) | 15,804 (22.5) | 12,776 (22.3) | 15,331 (20.6) | 17,247 (26.9) | 1303 (23.1) | 450 (27.3) | 658 (24.4) | 179,793 |
| 70 + | 136,867 (29.5) | 14,569 (20.7) | 10,257 (17.9) | 12,803 (17.2) | 20,624 (32.2) | 1333 (23.6) | 399 (24.2) | 560 (20.8) | 197,412 |
| Marital status at diagnosis | |||||||||
| Single | 52,401 (11.3) | 20,218 (28.8) | 7138 (12.5) | 13,420 (18.1) | 4667 (7.3) | 1348 (23.9) | 204 (12.4) | 354 (13.1) | 99,750 |
| Married/domestic partner | 268,885 (58.0) | 24,970 (35.5) | 37,862 (66.2) | 41,084 (55.3) | 38,005 (59.4) | 2069 (36.7) | 983 (59.6) | 1435 (53.2) | 415,293 |
| Divorced/separated/widow | 123,030 (26.5) | 21,744 (30.9) | 10,236 (17.9) | 16,364 (22.0) | 18,148 (28.4) | 1882 (33.3) | 361 (21.9) | 583 (21.6) | 192,348 |
| Unknown | 19,311 (4.2) | 3350 (4.8) | 1955 (3.4) | 3477 (4.7) | 3192 (5.0) | 346 (6.1) | 102 (6.2) | 324 (12.0) | 32,057 |
| Late-stage diagnosisa | |||||||||
| No | 317,963 (68.6) | 42,023 (59.8) | 38,401 (67.2) | 45,201 (60.8) | 43,790 (68.4) | 3336 (59.1) | 1164 (70.6) | 1718 (63.7) | 493,596 |
| Yes | 145,664 (31.4) | 28,259 (40.2) | 18,790 (32.8) | 29,144 (39.2) | 20,222 (31.6) | 2309 (40.9) | 486 (29.5) | 978 (36.3) | 245,852 |
| Tumor stage | |||||||||
| Localized | 317,963 (68.6) | 42,023 (59.8) | 38,401 (67.2) | 45,201 (60.8) | 43,790 (68.4) | 3336 (59.1) | 1164 (70.6) | 1718 (63.7) | 493,596 |
| Regionalized | 143,933 (31.0) | 27,813 (39.6) | 18,534 (32.4) | 28,779 (38.7) | 19,954 (31.2) | 2275 (40.3) | 483 (29.3) | 968 (35.9) | 242,739 |
| Distant | 1731 (0.4) | 446 (0.6) | 256 (0.5) | 365 (0.5) | 268 (0.4) | 34 (0.6) | 3 (0.2) | 10 (0.4) | 3113 |
| Tumor grade | |||||||||
| Grade I | 107,030 (23.1) | 9361 (13.3) | 10,743 (18.8) | 12,812 (17.2) | 14,041 (21.9) | 796 (14.1) |
311 (18.9 ) |
533 (19.8) | 155,627 |
| Grade II | 192,723 (41.6) | 9361 (13.3) | 23,741 (41.5) | 29,014 (39.0) | 25,820 (40.3) | 1810 (32.1) | 757 (45.9) | 1036 (38.4) | 298,957 |
| Grade III | 131,581 (28.4) | 31,042 (44.2) | 18,881 (33.0) | 27,066 (36.4) | 18,993 (29.7) | 2459 (43.6) | 496 (30.1) | 903 (33.5) | 231,421 |
| Grade IV | 3713 (0.8) | 778 (1.1) | 598 (1.1) | 912 (1.2) | 761 (1.2) | 87 (1.5) | 25 (1.5) | 28 (1.0) | 6902 |
| Unknown | 28,580 (6.2) | 5045 (7.2) | 3228 (5.6) | 4541 (6.1) | 4397 (6.9) | 493 (8.7) | 61 (3.7) | 196 (7.3) | 46,541 |
| Surgery | |||||||||
| Yes | 446,936 (96.4) | 65,586 (93.3) | 54,911 (96.0) | 70,537 (94.9) | 61,716 (96.4) | 5,304 (94.0) | 1612 (97.7) | 2531 (93.9) | 709,135 |
| No/unknown | 16,689 (3.6) | 4696 (6.7) | 2280 (4.0) | 3808 (5.1) | 2296 (3.6) | 341 (6.0) | 38 (2.3) | 165 (6.1) | 30,313 |
| Radiation | |||||||||
| Yes | 245,705 (53.0) | 34,835 (49.6) | 27,813 (48.6) | 34,511 (46.4) | 29,964 (46.8) | 2493 (44.2) | 745 (45.2) | 1,207 (44.8) | 377,273 |
| No/unknown | 217,922 (47.0) | 35,447 (50.4) | 29,378 (51.4) | 39,834 (53.6) | 34,048 (53.2) | 3152 (55.8) | 905 (54.8) | 1,489 (55.2) | 362,175 |
| Chemotherapy | |||||||||
| Yes | 173,021 (37.3) | 35,729 (50.8) | 25,321 (44.3) | 36,051 (48.5) | 24,468 (38.2) | 2845 (50.4) | 653 (39.6) | 1270 (47.1) | 299,358 |
| No/unknown | 290,606 (62.7) | 34,553 (49.2) | 31,870 (55.7) | 38,294 (51.5) | 39,544 (61.8) | 2800 (49.6) | 997 (60.4) | 1426 (52.9) | 440,090 |
| Status | |||||||||
| ER+/PR+ | 305,786 (65.9) | 35,427 (50.4) | 37,362 (65.3) | 44,960 (60.5) | 40,817 (63.8) | 2702 (47.9) | 1104 (66.9) | 1629 (60.4) | 469,787 |
| ER+/PR– or ER–/PR+ | 60,511 (13.1) | 10,326 (14.7) | 7440 (13.0) | 9831 (13.2) | 7746 (12.1) | 764 (13.5) | 206 (12.5) | 311 (11.5) | 97,135 |
| ER-/PR- | 66,478 (14.3) | 19,396 (27.6) | 9273 (16.2) | 14,080 (18.9) | 10,140 (15.8) | 1537 (27.2) | 249 (15.1) | 468 (17.4) | 121,621 |
| Unknown | 30,852 (6.7) | 5,133 (7.3) | 3116 (5,5) | 5474 (7.4) | 5,309 (8.3) | 642 (11.4) | 91 (5.5) | 288 (10.7) | 50,905 |
| Breast cancer laterality | |||||||||
| Right | 229,163 (49.4) | 34,329 (48.8) | 28,202 (49.3) | 36,304 (48.8) | 31,533 (49.3) | 2720 (48.2) | 834 (50.6) | 1300 (48.2) | 364,385 |
| Left | 234,085 (50.5) | 35,884 (51.1) | 28,954 (50.6) | 37,985 (51.1) | 32,430 (50.7) | 2916 (51.7) | 816 (49.5) | 1,394 (51.7) | 374,464 |
| Bilateral | 30 (0.01) | 13 (0.02) | 4 (0.01) | 7 (0.01) | 6 (0.01) | 0 (0.0) | 0 (0.0) | 0 (0.0) | 60 |
| Unknown | 349 (0.08) | 56 (0.08) | 31 (0.05) | 49 (0.07) | 43 (0.07) | 9 (0.1) | 0 (0.0) | 2 (0.1) | 539 |
aYes = Distant and Regionalized
Odds for no surgical treatment
We performed several multivariable models to assess the possible influence of specific confounders on the relationship between race/ethnicity and rurality on breast cancer outcomes (Table 2). When adjusted for ER/PR status alone, NH-black–urban women (AOR: 1.97, 95% CI 1.90–2.04), NH-black–rural women (AOR: 1.75, 95% CI 1.55–1.96), Hispanic–urban women (AOR: 1.58, 95% CI 1.52–1.64), Hispanic–rural women (AOR: 1.39, 95% CI 1.18–1.65), and API–urban women (AOR: 1.36, 95% CI 1.30–1.43) had an increased odds of no surgical treatment, when compared to NH-white–urban women. However, when only accounting for county-level SES NH-black–urban women (AOR: 2.07, 95% CI: 2.00 – 2.15), NH-black–rural women (AOR: 1.86, 95% CI 1.65–2.09), Hispanic–urban women (AOR: 1.59, 95% CI: 1.53 – 1.66), Hispanic–rural women (AOR: 1.43, 95% CI 1.21–1.69), API–urban women (AOR: 1.36, 95% CI 1.29–1.42), and NH-white–rural women (AOR: 1.08, 95% CI 1.03–1.14) had an increased odds of no surgical treatment, when compared to NH-white–urban women. Results in fully adjusted models reflected similar trends as ER/PR only adjusted models.
Table 2.
Multivariable Adjusted Odds Ratios for No Surgical Treatment, No Chemotherapy, and No Radiation Therapy for SEER Breast Cancer women diagnosed between 2000 and 2016
| ER/PR status AOR (95% CI)a |
SES AOR (95% CI)b |
HCA AOR (95% CI)c |
Fully adjusted AOR (95% CI)d |
|
|---|---|---|---|---|
| Odds for no surgical treatment | ||||
| Race/Ethnicity-rurality | ||||
| NH-white–Urban (Referent) | 1.00 | 1.00 | 1.00 | 1.00 |
| NH-black–Urban | 1.97 (1.90–2.04) | 2.07 (2.00–2.15) | 2.04 (1.97–2.12) | 1.98 (1.91–2.05) |
| API–Urban | 1.36 (1.30–1.43) | 1.36 (1.29–1.42) | 1.35 (1.29–1.42) | 1.36 (1.29–1.42) |
| Hispanic–Urban | 1.58 (1.52–1.64) | 1.59 (1.53–1.66) | 1.59 (1.53–1.65) | 1.58 (1.52–1.65) |
| NH-white–Rural | 1.03 (0.98–1.09) | 1.08 (1.03–1.14) | 1.11 (1.06–1.17) | 1.05 (1.00–1.11) |
| NH-black–Rural | 1.75 (1.55–1.96) | 1.86 (1.65–2.09) | 1.92 (1.71–2.16) | 1.72 (1.52–1.94) |
| API–Rural | 0.90 (0.64–1.25) | 0.95 (0.68–1.32) | 1.02 (0.73–1.43) | 0.96 (0.68–1.34) |
| Hispanic–Rural | 1.39 (1.18–1.65) | 1.43 (1.21–1.69) | 1.47(1.24–1.75) | 1.40 (1.18–1.67) |
| Odds for no radiation therapy | ||||
| Race/Ethnicity-rurality | ||||
| NH-white–Urban (Referent) | 1.00 | 1.00 | 1.00 | 1.00 |
| NH-black–Urban | 1.16 (1.14–1.18) | 1.18 (1.16–1.20) | 1.19 (1.17–1.21) | 1.14 (1.12–1.16) |
| API–Urban | 1.33 (1.30–1.36) | 1.32 (1.20–1.35) | 1.33 (1.30–1.35) | 1.33 (1.30–1.35) |
| Hispanic–Urban | 1.21 (1.19–1.23) | 1.20 (1.18–1.22) | 1.21 (1.19–1.23) | 1.19 (1.17–1.21) |
| NH-white–Rural | 1.27 (1.24–1.29) | 1.24 (1.21–1.26) | 1.25 (1.23–1.28) | 1.21 (1.19–1.23) |
| NH-black–Rural | 1.31 (1.24–1.38) | 1.25 (1.18–1.32) | 1.33 (1.26–1.41) | 1.18 (1.12–1.25) |
| API–Rural | 2.16 (1.94–2.39) | 2.09 (1.89–2.32) | 2.14 (1.93–2.37) | 2.08 (1.87–2.31) |
| Hispanic–Rural | 1.31 (1.21–1.41) | 1.27 (1.17–1.38) | 1.29 (1.19–1.40) | 1.25 (1.15–1.35) |
| Odds for no chemotherapy | ||||
| Race/Ethnicity-rurality | ||||
| NH-white–Urban (Referent) | 1.00 | 1.00 | 1.00 | 1.00 |
| NH-black–Urban | 0.82 (0.81–0.84) | 0.70 (0.69–0.72) | 0.69 (0.68–0.70) | 0.83 (0.81–0.85) |
| API–Urban | 0.95 (0.93–0.97) | 0.93 (0.91–0.95) | 0.93 (0.91–0.94) | 0.95 (0.93–0.97) |
| Hispanic–Urban | 0.83 (0.81–0.85) | 0.81 (0.79–0.82) | 0.80 (0.78–0.81) | 0.84 (0.82–0.86) |
| NH-white–Rural | 0.93 (0.92–0.95) | 0.97 (0.95–0.99) | 0.97 (0.95–0.99) | 0.97 (0.95–0.99) |
| NH-black–Rural | 0.82 (0.77–0.87) | 0.75 (0.71–0.80) | 0.72 (0.68–0.77) | 0.86 (0.81–0.92) |
| API–Rural | 0.98 (0.87–1.10) | 1.00 (0.89–1.12) | 1.04 (0.92–1.16) | 1.02 (0.91–1.15) |
| Hispanic–Rural | 0.78 (0.71–0.85) | 0.79 (0.72–0.82) | 0.80 (0.73–0.87) | 0.81 (0.74–0.89) |
aAdjusted for age, SEER registry, and ER/PR status
bAdjusted for age, SEER registry, and county-level SES
cAdjusted for age, SEER registry, and county-level HCA
dAdjusted for age, SEER registry, ER/PR status, county-level SES, and county-level HCA
AOR Adjusted Odds Ratios
Bold indicates significance p value ≤ 0.05
Odds for no radiation therapy
When adjusted for ER/PR status alone (Table 2), API–rural women (AOR: 2.16, 95% CI 1.94–2.39), API–urban women (AOR: 1.33, 95% CI 1.30–1.36), Hispanic–rural women (AOR: 1.33, 95% CI 1.21–1.41), Hispanic–urban women (AOR: 1.21, 95% CI 1.19–1.23), NH-black–rural women (AOR: 1.31, 95% CI 1.24–1.38), NH-black–urban women (AOR: 1.16, 95% CI 1.14–1.18), and NH-white–rural women (AOR: 1.27, 95% CI 1.24–1.29) had an increased odds of no radiation treatment, when compared to NH-white–urban women. However, when only accounting for county-level SES, API–rural women (AOR: 2.09, 95% CI 1.89–2.32), API–urban women (AOR: 1.32, 95% CI 1.20–1.35), Hispanic–rural women (AOR: 1.27, 95% CI 1.17–1.38), Hispanic–urban women (AOR: 1.20, 95% CI 1.18–1.22), NH-black–rural women (AOR: 1.25, 95% CI 1.18–1.32), NH-black–urban women (AOR: 1.32, 95% CI 1.20–1.35), and NH-white–rural women (AOR: 1.24, 95% CI 1.21–1.26) had an increased odds of no radiation treatment, when compared to NH-white–urban women. Results in fully adjusted models reflected similar trends as ER/PR only adjusted model.
Odds for no chemotherapy
When adjusted for ER/PR status alone (Table 2), Hispanic–rural women (AOR: 0.78, 95% CI 0.71–0.85), Hispanic–urban women (AOR: 0.83, 95% CI 0.81–0.85), NH-black–rural women (AOR: 0.82, 95% CI 0.77–0.87), NH-black–urban women (AOR: 0.82, 95% CI 0.81–0.84), NH-white–rural women (AOR: 0.93, 95% CI 0.92–0.95), API–urban women (AOR: 0.95, 95% CI 0.93–0.97), and API–rural women (AOR: 0.98, 95% CI 0.87–1.10) had an reduced odds of not receiving chemotherapy, when compared to NH-white–urban women. However, when only accounting for county-level SES, Hispanic–rural women (AOR: 0.79, 95% CI 0.72–0.82), Hispanic–urban women (AOR: 0.81, 95% CI 0.79–0.82), NH-black–rural women (AOR: 0.75, 95% CI 0.71–0.80), NH-black–urban women (AOR: 0.70, 95% CI 0.69–0.72), NH-white–rural women (AOR: 0.97, 95% CI 0.95–0.99), and API–urban women (AOR: 0.93, 95% CI 0.91–0.95) had reduced odds of not receiving chemotherapy, when compared to NH-white–urban women. Results in fully adjusted models reflected similar trends as ER/PR only adjusted model.
Odds for late-stage diagnosis
When adjusted for ER/PR status alone (Table 3), NH-black–rural women (AOR: 1.37, 95% CI 1.30–1.45), NH-black–urban women (AOR: 1.33, 95% CI 1.31– 1.35), Hispanic–urban women (AOR: 1.26, 95% CI 1.24–1.29), Hispanic–rural women (AOR 1.21, 95% CI 1.11–1.31), and NH-white–rural women (AOR 1.04, 95% CI 1.02–1.06) had an increased odds of late-stage diagnosis, when compared to NH-white–urban women. However, when only accounting for county-level SES, NH-black–rural women (AOR 1.33, 95% CI 1.26–1.41), NH-black–urban women (AOR 1.35, 95% CI 1.33–1.37), Hispanic–urban women (AOR 1.26, 95% CI 1.24–1.28), and Hispanic–rural women (AOR 1.18, 95% CI 1.09–1.28) had an increased odds of late-stage diagnosis, when compared to NH-white–urban women. Results in fully adjusted models reflected similar trends as ER/PR only adjusted model.
Table 3.
Multivariable Adjusted Odds Ratios (AOR) for Late-Stage Diagnosis and Multivariable Hazard Ratios (AHR) for Breast Cancer Mortality, SEER women diagnosed between 2000 and 2016
| ER/PR status (95% CI)a | SES (95% CI)b | HCA (95% CI)c | Fully adjusted (95% CI)d,e | ||
|---|---|---|---|---|---|
| Odds for late-stage diagnosis | |||||
| Race/Ethnicity-Rurality | |||||
| NH-white–Urban (Referent) | 1.00 | 1.00 | 1.00 | 1.00 | |
| NH-black–Urban | 1.33 (1.31–1.35) | 1.35 (1.33–1.37) | 1.37 (1.34 -1.39) | 1.32 (1.29–1.34) | |
| API–Urban | 1.01 (0.99–1.03) | 1.01 (0.99–1.03) | 1.02 (1.00–1.04) | 1.01 (0.99–1.03) | |
| Hispanic–Urban | 1.26 (1.24–1.29) | 1.26 (1.24–1.28) | 1.27 (1.24–1.29) | 1.25 (1.23–1.27) | |
| NH-white–Rural | 1.04 (1.02–1.06) | 1.02 (0.99–1.04) | 1.01 (0.99–1.03) | 1.00 (0.98–1.02) | |
| NH-black–Rural | 1.37 (1.30–1.45) | 1.33 (1.26–1.41) | 1.36 (1.28–1.44) | 1.29 (1.22–1.36) | |
| API–Rural | 1.02 (0.91–1.14) | 0.99 (0.88–1.10) | 0.97 (0.87–1.09) | 0.97 (0.86–1.08) | |
| Hispanic–Rural | 1.21 (1.11–1.31) | 1.18 (1.09–1.28) | 1.18 (1.09–1.28) | 1.17 (1.08–1.27) | |
| Risk of breast cancer death | |||||
| Race/Ethnicity-Rurality | No. breast cancer deaths (%)f | ||||
| NH-white–Urban (Referent) | 37,006 (8.0) | 1.00 | 1.00 | 1.00 | 1.00 |
| NH-black–Urban | 9587 (13.6) | 1.75 (1.71–1.79) | 1.91 (1.87–1.96) | 1.99 (1.94–2.03) | 1.46 (1.43–1.50) |
| API–Urban | 3573 (6.3) | 0.89 (0.86–0.92) | 0.90 (0.87–0.94) | 0.91 (0.88–0.94) | 0.87 (0.84–0.91) |
| Hispanic–Urban | 6437 (8.7) | 1.26 (1.23–1.30) | 1.27 (1.23–1.30) | 1.30 (1.27–1.33) | 1.10 (1.07–1.13) |
| NH-white–Rural | 5880 (9.2) | 1.15 (1.12–1.18) | 1.08 (1.05–1.12) | 1.09 (1.06–1.12) | 1.03 (1.00–1.07) |
| NH-black–Rural | 849 (15.0) | 1.98 (1.85–2.11) | 1.89 (1.76–2.03) | 1.99 (1.86–2.14) | 1.42 (1.32–1.53) |
| API–Rural | 104 (6.3) | 0.84 (0.70–1.02) | 0.83 (0.68–1.00) | 0.79 (0.65–0.96) | 0.81 (0.67- 0.98) |
| Hispanic–Rural | 252 (9.4) | 1.31 (1.16–1.48) | 1.21 (1.07–1.37) | 1.18 (1.04–1.34) | 1.00 (0.88–1.14) |
aAdjusted for age, SEER registry, and ER/PR status
bAdjusted for age, SEER registry, and county-level SES
cAdjusted for age, SEER registry, and county-level HCA
dOdds of late-stage diagnosis adjusted for age, SEER registry, ER/PR status, county-level SES, and county-level HCA
eRisk of breast cancer models adjusted for age, SEER registry, ER/PR status, county-level SES, county-level HCA, surgical treatment, radiation therapy, chemotherapy, and late-stage diagnosis
fPercentage represents the relative frequency of breast cancer death given race/ethnicity-rurality strata
AOR Adjusted Odds Ratios
AHR Adjusted Hazard Ratios
Bold indicates significance p value ≤ 0.05
Risk for breast cancer death
NH-black–rural, NH-black–urban, Hispanic–rural, and Hispanic–urban women had the largest relative frequency of breast cancer death (Table 3 Fig. 1). When adjusted for ER/PR status alone, NH-black–rural women (AOR 1.98, 95% CI 1.85–2.11), NH-black–urban women (AOR 1.75, 95% CI 1.71– 1.79), Hispanic–rural women (AOR 1.31, 95% CI 1.16–1.48), Hispanic–urban women (AOR 1.26, 95% CI 1.23–1.30), and NH-white–rural women (AOR 1.15, 95% CI 1.12–1.18) had an increased risk of breast cancer death, when compared to NH-white–urban women. However, when only accounting for county-level SES, NH-black–rural women (AOR 1.89, 95% CI 1.76–2.03), NH-black–urban women (AOR 1.91, 95% CI 1.87– 1.96), Hispanic–rural women (AOR 1.21, 95% CI 1.07–1.37), Hispanic–urban women (AOR 1.27, 95% CI 1.23–1.30), and NH-white–rural women (AOR 1.08, 95% CI 1.05–1.12) had an increased risk of breast cancer death, when compared to NH-white–urban women. Results in fully adjusted models, accounting for ER/PR status, county-level SES, and county-level HCA revealed NH-black–rural women (AOR 1.42, 95% CI 1.32–1.53), NH-black–urban women (AOR 1.46, 95% CI 1.43–1.50), Hispanic–urban women (AOR 1.10, 95% CI 1.07–1.13), and NH-white–rural women (AOR 1.03, 95% CI 1.00–1.07) had an increased risk of breast cancer death, when compared to NH-white–urban women. We further performed analyses examining the interaction between race and rurality on breast cancer outcomes stratified by ER/PR status (Supplemental Tables 1, 2) and observed similar trends. Additionally, we assessed the multiplicative and additive interaction between race/ethnicity and rurality (Supplemental Tables 3, 4).
Fig. 1.
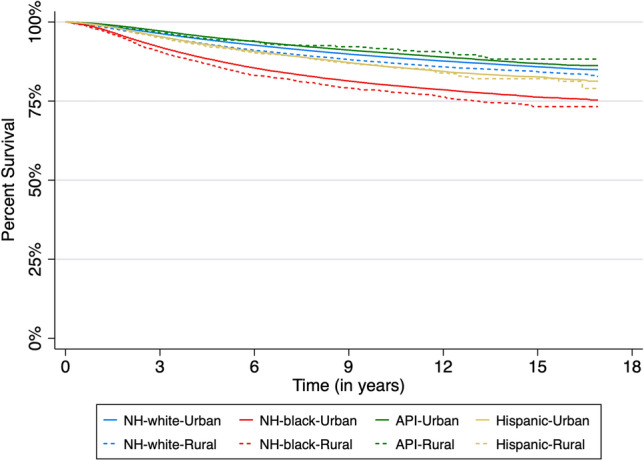
Kaplan–Meier survival plots for time-to-breast cancer death by race/ethnicity and rurality
Discussion
The study sought to examine the intersectionality of rurality and race/ethnicity on breast cancer outcomes. Overall, we observed increased odds for late-stage breast cancer diagnosis, odds of no receipt of breast cancer treatments (surgical, radiation therapy, and chemotherapy), and increased risk of breast cancer death among NH-black and Hispanic women, regardless of rurality, when compared with NH-white–urban women. Rural and urban API women generally had better breast cancer outcomes, with a 10–20% reduced risk of breast cancer death when compared with NH-white–urban women. NH-black and Hispanic women were less likely to receive treatment, and in turn, were at higher risks for later stage disease and breast cancer mortality. Further, when examining possible confounders, results in fully adjusted models mirrored trends in ER/PR only adjusted models for late-stage disease, odds of no chemotherapy, radiation, or surgical treatment.
Prior studies have observed associations between race/ethnicity or rural/urban status with both breast cancer outcomes and mortality [28, 29, 40]. Some studies have explored the rural–urban differences in breast cancer incidence [41], survival [42], mortality [28, 29, 43], and focused on specific regions, while the results of our current study aimed to illuminate a nationally representative relationship between race and rurality with several breast cancer outcomes. For instance, Moore et al. (2018) observed that specifically for NH-black and Hispanic women, geographic areas of high breast cancer mortality or ‘hot spots’ were prevalent throughout the southeastern U.S. for NH-black women, and among Hispanic women within the southwest region of the U.S. [40]. Further, these hot spot areas were characterized by having poorer social determinants of health factors including lower educational attainment and lower household income; however, NH-black and Hispanic breast cancer mortality hot spots were not characterized by greater rurality [40]. This finding is concordant with our current study as we observed that regardless of NH-black and Hispanic women living in rural or urban communities, they had poorer breast cancer outcomes. In contrast to the study design of Moore et al. (2018) which analyzed mortality data aggregated to the county level, our current study provides more contextual evidence on the possible association between race and place with breast cancer outcomes while using patient-level data with more granular information regarding breast cancer status, treatments, and survival.
Odds of no treatment surgery, chemotherapy, radiation
NH-black–urban and NH-black–rural women were nearly twice as likely to not receive surgical treatment when compared to NH-white–urban women. Most racial/ethnic minority women of rural and urban communities were more likely to receive chemotherapy; however, these racial minorities had increased odds of not receiving radiation therapy or surgical treatment. Chemotherapy treatment is more common among women with late-stage diagnosis compared with women with early-stage diagnosis, 68% vs. 27% respectively. NH-black and Hispanic women are 30% more likely to be diagnosed with late-stage breast cancer compared to NH-white women, therefore they are more likely to receive chemotherapy. Other studies suggest that black women are more likely to have delays in their follow-up care for breast cancer when compared with white women. As suggested by Babatunde et al. (2021), black women were more likely to receive surgery 8 days later, chemotherapy 7 days later, radiation therapy 3 days later, and adjuvant hormone therapy 28 days later than their white counterparts [44].
The pattern for odds ratios by ER/PR breast cancer status was similar to that for odds of no surgical treatment, with NH-black–urban and rural women having the highest odds of receiving no surgery across all breast cancer status. The most substantial differences exist for ER+/PR+ status followed by ER+ /PR– or ER–/PR+ status—indicating that lack of surgical treatment may also be a major factor for disparities in risk for breast cancer death. Yet, in fully adjusted models, NH-black–urban women are still twice as likely—with NH-black–rural women close behind—to not receive surgery compared to NH-white–urban women. It is plausible that when even accounting for socioeconomic barriers and health insurance, NH-black and Hispanic women still face additional barriers of racial micro- and macro-aggressions, lack of representation within healthcare systems, and mistrust of health professionals that in turn reduce their likelihood of receiving timely and appropriate cancer care [45–48]. Several themes have emerged as a result of investigation into the cause of racial/ethnic disparities in breast cancer treatment, including persistent medical mistrust by black women [49, 50] and structural and interpersonal biases in cancer care [51]. Studies have also indicated that even when surgery is available to black women, existing comorbidities are major barriers to positive outcomes following surgery [52].
Late-stage diagnosis
Consistent with literature regarding breast cancer disparities [53], NH–black women and Hispanic women had the highest odds for late-stage diagnosis among all racial/ethnic groups in fully adjusted models. Further Warner et al. (2012) observed that black and Hispanic women experienced longer delays and time to diagnoses compared with non-Hispanic white women [54]. Among all groups, NH–black urban and rural women had higher rates of late-stage disease. Our findings are similar to those of Mobley et al. (2021) using United States Cancer Statistic (USCS) data, where they reported persistent hot spots over a 10-year period for late-stage breast cancer among poor, rural, African American, and Hispanic communities, but not in poor, rural, and White communities [27]. Likewise, we also observed NH-black and Hispanic women had from a 17% to 32% increased odds of late-stage breast cancer diagnosis, regardless of rurality, when compared to NH-white women. Additionally, Williams et al. (2016) reported that among a cohort of 29,410 Missouri rural and urban women, black women had a 50% increased odds of late-stage breast cancer diagnosis, compared to white women, and non-metropolitan or rural counties had 11% increased odds of late-stage diagnosis, when compared to their urban counterparts [55]. In the present study, NH-black women were nearly twice as likely as other racial/ethnic groups to be diagnosed with ER-/PR-status. These findings are consistent with existing literature outlining racial/ethnic disparities in breast cancer type and stage [56–61].
Risk of breast cancer death
In fully adjusted models, NH–black–urban/rural women and Hispanic–urban women had the highest risk of breast cancer death—consistent with trends observed for the last 40 years [62]. Although the risk for breast cancer death remains substantially higher for NH-black women compared to NH-white–urban women, the differences in risk breast cancer mortality stratified by HR cancer status may give insight on possible drivers of these disparities. When observing odds for late-stage disease, type of treatment, and risk of breast cancer death by ER/PR status, racial/ethnic and urban–rural differences were the smallest for ER-/PR- status. This may be explained largely by women with triple-negative breast cancer (TNBC) who fall into this category [63, 64]. The lack of available treatments for TNBC means that generally no group—regardless of geographical location or race/ethnicity——can benefit over another from targeted therapies for this subtype [65, 66]. Interestingly, larger disparities were seen among women with ER+ and/or PR+ status, for which targeted therapies are currently available, as odds for risk of breast cancer death for both urban and rural NH-black women compared to other groups were considerably higher.
It is well documented that the large gap in breast cancer survival between black and white women began in the 1980s, following the introduction of adjuvant endocrine therapy for ER+ breast cancer status and continued with subsequent therapies for PR+ and HER2+ subtypes[67]. While much discussion has focused on the prevalence of hormone receptor negative cancers (particularly TNBC) among black women as a major driver of racial/ethnic disparities in breast cancer survival [58, 68], it is evident that there are additional barriers to survival for black women with ER+ or PR+ disease despite availability of targeted therapy. In fact, a cohort study of Chicago women observed a fourfold increased risk of ER+ /PR+ breast cancer among black women, when compared to white women [69]. While it has been suggested that racial differences in survival may be a result of decreased response to treatment due to molecular differences in ER+ /PR+ tumors of black women [69], research has shown that even when available, black women are less likely to adhere to adjuvant endocrine therapy compared to other racial/ethnic groups [70, 71]. Adherence may in part be due to black women reporting greater burden of side effects, differential risk perceptions, and lack of shared treatment decision making [72].
Strengths and limitations
This study should be considered with respect to several strengths and limitations. First, SEER 18 is not a comprehensive cancer surveillance and does not have information regarding every cancer breast cancer diagnosis within the U.S. However, SEER covers approximately 28% of U.S. population among 18 geographic areas and cancer registries; therefore, the results of these data serve as the closest approximation to the U.S. general cancer patient population. Moreover, SEER sampling allows for exploration between race/ethnicity and rurality with breast cancer outcomes with large patient sample. For geographic location, SEER utilizes the county Federal Information Processing Standard (FIPS) code at the time of each patient’s diagnosis, and we are unable to discern variability in a patients’ residence over their life course. With this respect, our use of county-level SES and HCA factors is limited by ecologic or aggregation biases, and thus may not be reflective of both more granular neighborhood measures such as census block or tract level data (these data are not available for linkages with SEER patient data). Further, the built and social environment may not be static, and the interpretations of county-level factors influence on these analyses should be tempered with this respect. Nevertheless, this study was inclusive of eight race/ethnicity and geographic intersectional identities and may provide a more granular understanding on the effects of race and place on breast cancer outcomes.
Conclusion
Of particular interest, we observed consistently higher odds for late-stage breast cancer diagnosis and no receipt of breast cancer surgery, and higher risk for breast cancer death among NH-black–urban, NH-black–rural, Hispanic–urban, and Hispanic–rural women compared to NH-white–urban women in fully adjusted models. Our findings are consistent with a few studies that have observed worse outcomes among rural breast cancer women compared to urban. These studies cite individual- and community-level psychosocial factors as possible drivers of the observed differences [73]. Given the marked disparities in breast cancer outcomes for both NH-black and Hispanic women, regardless of rurality, future studies and public health initiatives should consider strategies and programming that are culturally tailored and inclusive for racial/ethnic minorities. Further, increasing availability of genetic testing, screening resources/services, and reducing economic and interpersonal barriers to follow-up care after first primary diagnosis may help considerably in reducing the given breast cancer health inequities for NH-black and Hispanic women living in both rural and urban communities.
Supplementary Information
Below is the link to the electronic supplementary material.
Abbreviations
- SEER
Surveillance Epidemiology and End Results
- AORs
Adjusted odds ratios
- AHRs
Adjusted hazard ratios
- CIs
95% Confidence intervals
- RUCC
Rural–Urban Continuum Codes
- NH-white
Non-Hispanic white
- NH-black
Non-Hispanic black
- API
Asian/Pacific Islander
- U.S.
United States
- SES
Socioeconomic/demographic
- HCA
Health care access
- ACS
American Community Survey
- ER
Estrogen receptor
- PR
Progesterone receptor
- TNBC
Triple-negative breast cancer
- FIPS
Federal Information Processing Standard
Authors contributions
JXM contributed toward conceptualization, data curation, formal analysis, funding acquisition, investigation, methodology, project administration, resources, software, supervision, visualization, validation, writing—original draft, writing-review and editing. SEA contributed toward formal analysis, visualization, writing—original draft, writing- review and editing. SJ contributed toward visualization, writing—original draft, writing-review and editing. YH contributed toward data curation, writing- review and editing.
Funding
Dr. Moore was supported by the National Institute on Minority Health and Health Disparities of the National Institutes of Health under Award Number K01MD015304. The content is solely the responsibility of the authors and does not necessarily represent the official views of the National Institutes of Health.
Data availability
The datasets generated and/or analyzed during the current study are available in the Surveillance Epidemiology and End Results (SEER) 18 registrations custom data (with additional treatment fields repository, (http://seer.cancer.gov).
Declarations
Conflict of interest
The authors declare no conflicts of interest.
Ethical approval and consent to participate
This study was considered exempt by the Institutional Review Boards of Augusta University and Washington University School of Medicine because we utilized pre-existing secondary data that are publicly available and deidentified.
Consent for publication
Not Applicable.
Footnotes
Publisher's Note
Springer Nature remains neutral with regard to jurisdictional claims in published maps and institutional affiliations.
References
- 1.Zahnd WE, Fogleman AJ, Jenkins WD. Rural-urban disparities in stage of diagnosis among cancers with preventive opportunities. Am J Prev Med. 2018;54(5):688–698. doi: 10.1016/j.amepre.2018.01.021. [DOI] [PubMed] [Google Scholar]
- 2.Dugani SB, Mielke MM, Vella A. Burden and management of type 2 diabetes in rural United States. Diabetes Metab Res Rev. 2021;37(5):e3410. doi: 10.1002/dmrr.3410. [DOI] [PMC free article] [PubMed] [Google Scholar]
- 3.Villapiano N, Iwashyna TJ, Davis MM. Worsening rural-urban gap in hospital mortality. J Am Board Fam Med. 2017;30(6):816–823. doi: 10.3122/jabfm.2017.06.170137. [DOI] [PubMed] [Google Scholar]
- 4.McCarthy AM, Yang J, Armstrong K. Increasing disparities in breast cancer mortality from 1979 to 2010 for US black women aged 20 to 49 years. Am J Public Health. 2015;105(Suppl 3):S446–448. doi: 10.2105/AJPH.2014.302297. [DOI] [PMC free article] [PubMed] [Google Scholar]
- 5.Howlader NA KM, Garshell, J, Miller D, Altekruse SF, Kosary CL, Yu M, Ruhl J, Tatalovich Z, Mariotto A, Lewis DR, Chen HS, Feuer EJ, Cronin KA (eds) (2015) SEER Cancer Statistics Review, 1975–2012. In., vol. based on Nov 2014 SEER data submission. National Cancer Institute, Bethesda
- 6.Aizer AA, Wilhite TJ, Chen MH, Graham PL, Choueiri TK, Hoffman KE, Martin NE, Trinh QD, Hu JC, Nguyen PL. Lack of reduction in racial disparities in cancer-specific mortality over a 20-year period. Cancer. 2014;120(10):1532–1539. doi: 10.1002/cncr.28617. [DOI] [PubMed] [Google Scholar]
- 7.Ellington TD, Miller JW, Henley SJ, Wilson RJ, Wu M, Richardson LC. Trends in breast cancer incidence, by race, ethnicity, and age among women aged >/=20 Years—United States, 1999–2018. MMWR Morb Mortal Wkly Rep. 2022;71(2):43–47. doi: 10.15585/mmwr.mm7102a2. [DOI] [PMC free article] [PubMed] [Google Scholar]
- 8.DeSantis CE, Siegel RL, Sauer AG, Miller KD, Fedewa SA, Alcaraz KI, Jemal A. Cancer statistics for African Americans, 2016 progress and opportunities in reducing racial disparities. CA Cancer J Clin. 2016;66(4):290–308. doi: 10.3322/caac.21340. [DOI] [PubMed] [Google Scholar]
- 9.Blake KD, Moss JL, Gaysynsky A, Srinivasan S, Croyle RT. Making the case for investment in rural cancer control an analysis of rural cancer incidence, mortality, and funding trends. Cancer Epidemiol Biomarkers Prev. 2017;26(7):992–997. doi: 10.1158/1055-9965.EPI-17-0092. [DOI] [PMC free article] [PubMed] [Google Scholar]
- 10.Zahnd WE, Jenkins WD, Mueller-Luckey GS. Cancer mortality in the mississippi delta region descriptive epidemiology and needed future research and interventions. J Health Care Poor Underserved. 2017;28(1):315–328. doi: 10.1353/hpu.2017.0025. [DOI] [PubMed] [Google Scholar]
- 11.Bethesda M (2021) SEER Cancer Stat Facts Female Breast Cancer. National Cancer Institute
- 12.Silber JH, Rosenbaum PR, Ross RN, Reiter JG, Niknam BA, Hill AS, Bongiorno DM, Shah SA, Hochman LL, Even-Shoshan O, et al. Disparities in breast cancer survival by socioeconomic status despite medicare and medicaid insurance. Milbank Q. 2018;96(4):706–754. doi: 10.1111/1468-0009.12355. [DOI] [PMC free article] [PubMed] [Google Scholar]
- 13.Yu XQ. Socioeconomic disparities in breast cancer survival relation to stage at diagnosis, treatment and race. BMC Cancer. 2009;9:364. doi: 10.1186/1471-2407-9-364. [DOI] [PMC free article] [PubMed] [Google Scholar]
- 14.Akinyemiju TF, Soliman AS, Johnson NJ, Altekruse SF, Welch K, Banerjee M, Schwartz K, Merajver S. Individual and neighborhood socioeconomic status and healthcare resources in relation to black-white breast cancer survival disparities. J Cancer Epidemiol. 2013;2013:490472. doi: 10.1155/2013/490472. [DOI] [PMC free article] [PubMed] [Google Scholar]
- 15.Jadav S, Rajan SS, Abughosh S, Sansgiry SS. The role of socioeconomic status and health care access in breast cancer screening compliance among Hispanics. J Public Health Manag Pract. 2015;21(5):467–476. doi: 10.1097/PHH.0000000000000235. [DOI] [PubMed] [Google Scholar]
- 16.Sheppard VB, Oppong BA, Hampton R, Snead F, Horton S, Hirpa F, Brathwaite EJ, Makambi K, Onyewu S, Boisvert M, et al. Disparities in breast cancer surgery delay the lingering effect of race. Ann Surg Oncol. 2015;22(9):2902–2911. doi: 10.1245/s10434-015-4397-3. [DOI] [PubMed] [Google Scholar]
- 17.Akinyemiju TF, Vin-Raviv N, Chavez-Yenter D, Zhao X, Budhwani H. Race/ethnicity and socio-economic differences in breast cancer surgery outcomes. Cancer Epidemiol. 2015;39(5):745–751. doi: 10.1016/j.canep.2015.07.010. [DOI] [PubMed] [Google Scholar]
- 18.Akinyemiju T, Moore JX, Ojesina AI, Waterbor JW, Altekruse SF. Racial disparities in individual breast cancer outcomes by hormone-receptor subtype, area-level socio-economic status and healthcare resources. Breast Cancer Res Treat. 2016;157(3):575–586. doi: 10.1007/s10549-016-3840-x. [DOI] [PMC free article] [PubMed] [Google Scholar]
- 19.Ihemelandu CU, Leffall LD, Jr, Dewitty RL, Naab TJ, Mezghebe HM, Makambi KH, Adams-Campbell L, Frederick WA. Molecular breast cancer subtypes in premenopausal and postmenopausal African-American women age-specific prevalence and survival. J Surg Res. 2007;143(1):109–118. doi: 10.1016/j.jss.2007.03.085. [DOI] [PubMed] [Google Scholar]
- 20.Anderson AE, Henry KA, Samadder NJ, Merrill RM, Kinney AY. Rural vs urban residence affects risk-appropriate colorectal cancer screening. Clin Gastroenterol Hepatol. 2013;11(5):526–533. doi: 10.1016/j.cgh.2012.11.025. [DOI] [PMC free article] [PubMed] [Google Scholar]
- 21.Bennett KJ, Pumkam C, Bellinger JD, Probst JC. Cancer screening delivery in persistent poverty rural counties. J Prim Care Commun Health. 2011;2(4):240–249. doi: 10.1177/2150131911406123. [DOI] [PubMed] [Google Scholar]
- 22.Chandak A, Nayar P, Lin G. Rural-urban disparities in access to breast cancer screening a spatial clustering analysis. J Rural Health. 2019;35(2):229–235. doi: 10.1111/jrh.12308. [DOI] [PubMed] [Google Scholar]
- 23.Bergin RJ, Emery JD, Bollard R, White V. Comparing pathways to diagnosis and treatment for rural and urban patients with colorectal or breast cancer a qualitative study. J Rural Health. 2020;36(4):517–535. doi: 10.1111/jrh.12437. [DOI] [PubMed] [Google Scholar]
- 24.Sprague BL, Ahern TP, Herschorn SD, Sowden M, Weaver DL, Wood ME. Identifying key barriers to effective breast cancer control in rural settings. Prev Med. 2021;152(Pt 2):106741. doi: 10.1016/j.ypmed.2021.106741. [DOI] [PMC free article] [PubMed] [Google Scholar]
- 25.Meilleur A, Subramanian SV, Plascak JJ, Fisher JL, Paskett ED, Lamont EB. Rural residence and cancer outcomes in the United States issues and challenges. Cancer Epidemiol Biomarkers Prev. 2013;22(10):1657–1667. doi: 10.1158/1055-9965.EPI-13-0404. [DOI] [PMC free article] [PubMed] [Google Scholar]
- 26.Longacre CF, Neprash HT, Shippee ND, Tuttle TM, Virnig BA. Travel, treatment choice, and survival among breast cancer patients a population-based analysis. Womens Health Rep (New Rochelle) 2021;2(1):1–10. doi: 10.1089/whr.2020.0094. [DOI] [PMC free article] [PubMed] [Google Scholar]
- 27.Mobley LR, Tangka FKL, Berkowitz Z, Miller J, Hall IJ, Wu M, Sabatino SA. Geographic disparities in late-stage breast cancer diagnosis rates and their persistence over time. J Womens Health (Larchmt) 2021;30(6):807–815. doi: 10.1089/jwh.2020.8728. [DOI] [PMC free article] [PubMed] [Google Scholar]
- 28.Moubadder L, Collin LJ, Nash R, Switchenko JM, Miller-Kleinhenz JM, Gogineni K, Ward KC, McCullough LE. Drivers of racial, regional, and socioeconomic disparities in late-stage breast cancer mortality. Cancer. 2022 doi: 10.1002/cncr.34391. [DOI] [PubMed] [Google Scholar]
- 29.Singh GK, Williams SD, Siahpush M, Mulhollen A. Socioeconomic, rural-urban, and racial inequalities in US cancer mortality part I-all cancers and lung cancer and part II-colorectal, prostate, breast, and cervical cancers. J Cancer Epidemiol. 2011;2011:107497. doi: 10.1155/2011/107497. [DOI] [PMC free article] [PubMed] [Google Scholar]
- 30.National Cancer Institute Survaillance, Epidemiology, and End Results Program https://seer.cancer.gov. Accessed 3 March 2022
- 31.Race and Hispanic Ethnicity Changes for the 1975–2019 SEER Research Data https://seer.cancer.gov/seerstat/variables/seer/race_ethnicity
- 32.Rural Urban Continuum Codes https://www.ers.usda.gov/data-products/rural-urban-continuum-codes. Accessed 3 March 2022
- 33.Lewis-Thames MW, Langston ME, Fuzzell L, Khan S, Moore JX, Han Y. Rural-urban differences e-cigarette ever use, the perception of harm, and e-cigarette information seeking behaviors among US adults in a nationally representative study. Prev Med. 2020;130:105898. doi: 10.1016/j.ypmed.2019.105898. [DOI] [PMC free article] [PubMed] [Google Scholar]
- 34.Burris JL, Andrykowski M. Disparities in mental health between rural and nonrural cancer survivors a preliminary study. Psychooncology. 2010;19(6):637–645. doi: 10.1002/pon.1600. [DOI] [PMC free article] [PubMed] [Google Scholar]
- 35.Unger JM, Moseley A, Symington B, Chavez-MacGregor M, Ramsey SD, Hershman DL. Geographic distribution and survival outcomes for rural patients with cancer treated in clinical trials. JAMA Netw Open. 2018;1(4):e181235. doi: 10.1001/jamanetworkopen.2018.1235. [DOI] [PMC free article] [PubMed] [Google Scholar]
- 36.Breast Subtype (2010+) https://seer.cancer.gov/seerstat/databases/ssf/breast-subtype.html. Accessed 3 March 2022
- 37.Static County Attributes https://seer.cancer.gov/seerstat/variables/countyattribs/static.html#13-17. Accessed 3 March 2022
- 38.County Health Rankings & Roadmaps (2020) [https://www.countyhealthrankings.org/explore-health-rankings/rankings-data-documentation]. Accessed 3 March 2022
- 39.SEER Cause of Death Recode https://seer.cancer.gov/codrecode. Accessed 3 March 2022
- 40.Moore JX, Royston KJ, Langston ME, Griffin R, Hidalgo B, Wang HE, Colditz G, Akinyemiju T. Mapping hot spots of breast cancer mortality in the United States place matters for Blacks and Hispanics. Cancer Causes Control. 2018;29(8):737–750. doi: 10.1007/s10552-018-1051-y. [DOI] [PMC free article] [PubMed] [Google Scholar]
- 41.Lent AB, Mohan P, Derksen D, Cance WG, Barraza L, Jacobs ET, Calhoun EA. The association between breast cancer capacity and resources with incidence and mortality in Arizona's low populous counties. Rural Remote Health. 2021;21(3):6357. doi: 10.22605/RRH6357. [DOI] [PubMed] [Google Scholar]
- 42.Lewis-Thames MW, Langston ME, Khan S, Han Y, Fuzzell L, Xu S, Moore JX. Racial and ethnic differences in rural-urban trends in 5-year survival of patients with lung, prostate, breast, and colorectal cancers 1975–2011 surveillance, epidemiology, and end results (SEER) JAMA Netw Open. 2022;5(5):e2212246. doi: 10.1001/jamanetworkopen.2022.12246. [DOI] [PMC free article] [PubMed] [Google Scholar]
- 43.Obeng-Gyasi S, Timsina L, Bhattacharyya O, Fisher CS, Haggstrom DA. Breast cancer presentation, surgical management and mortality across the rural-urban continuum in the national cancer database. Ann Surg Oncol. 2020;27(6):1805–1815. doi: 10.1245/s10434-020-08376-y. [DOI] [PubMed] [Google Scholar]
- 44.Babatunde OA, Eberth JM, Felder TM, Moran R, Hughes-Halbert C, Truman S, Hebert JR, Heiney S, Adams SA. Racial disparities and diagnosis-to-treatment time among patients diagnosed with breast cancer in South Carolina. J Racial Ethn Health Disparities. 2022;9(1):124–134. doi: 10.1007/s40615-020-00935-z. [DOI] [PMC free article] [PubMed] [Google Scholar]
- 45.Stepanikova I, Oates GR. Perceived discrimination and privilege in health care the role of socioeconomic status and race. Am J Prev Med. 2017;52(1S1):S86–S94. doi: 10.1016/j.amepre.2016.09.024. [DOI] [PMC free article] [PubMed] [Google Scholar]
- 46.Doescher MP, Saver BG, Fiscella K, Franks P. Racial/ethnic inequities in continuity and site of care location, location, location. Health Serv Res. 2001;36(6 Pt 2):78–89. [PMC free article] [PubMed] [Google Scholar]
- 47.Powell W, Richmond J, Mohottige D, Yen I, Joslyn A, Corbie-Smith G. Medical mistrust, racism, and delays in preventive health screening among African-American men. Behav Med. 2019;45(2):102–117. doi: 10.1080/08964289.2019.1585327. [DOI] [PMC free article] [PubMed] [Google Scholar]
- 48.Maly RC, Stein JA, Umezawa Y, Leake B, Anglin MD. Racial/ethnic differences in breast cancer outcomes among older patients effects of physician communication and patient empowerment. Health Psychol. 2008;27(6):728–736. doi: 10.1037/0278-6133.27.6.728. [DOI] [PMC free article] [PubMed] [Google Scholar]
- 49.Barsevick AM, Leader A, Bradley PK, Avery T, Dean LT, DiCarlo M, Hegarty SE. Post-treatment problems of African American breast cancer survivors. Support Care Cancer. 2016;24(12):4979–4986. doi: 10.1007/s00520-016-3359-z. [DOI] [PMC free article] [PubMed] [Google Scholar]
- 50.Yedjou CG, Sims JN, Miele L, Noubissi F, Lowe L, Fonseca DD, Alo RA, Payton M, Tchounwou PB. Health and racial disparity in breast cancer. Adv Exp Med Biol. 2019;1152:31–49. doi: 10.1007/978-3-030-20301-6_3. [DOI] [PMC free article] [PubMed] [Google Scholar]
- 51.Zahnd WE, Murphy C, Knoll M, Benavidez GA, Day KR, Ranganathan R, Luke P, Zgodic A, Shi K, Merrell MA, et al. The intersection of rural residence and minority race/ethnicity in cancer disparities in the United States. Int J Environ Res Public Health. 2021;18(4):1384. doi: 10.3390/ijerph18041384. [DOI] [PMC free article] [PubMed] [Google Scholar]
- 52.Esnaola NF, Ford ME. Racial differences and disparities in cancer care and outcomes where's the rub? Surg Oncol Clin N Am. 2012;21(3):417–437. doi: 10.1016/j.soc.2012.03.012. [DOI] [PMC free article] [PubMed] [Google Scholar]
- 53.Williams F, Thompson E. Disparities in Breast Cancer Stage at Diagnosis Importance of Race, Poverty, and Age. J Health Dispar Res Pract. 2017;10(3):34–45. [PMC free article] [PubMed] [Google Scholar]
- 54.Warner ET, Tamimi RM, Hughes ME, Ottesen RA, Wong YN, Edge SB, Theriault RL, Blayney DW, Niland JC, Winer EP, et al. Time to diagnosis and breast cancer stage by race/ethnicity. Breast Cancer Res Treat. 2012;136(3):813–821. doi: 10.1007/s10549-012-2304-1. [DOI] [PMC free article] [PubMed] [Google Scholar]
- 55.Williams F, Thompson E. Disparity in breast cancer late stage at diagnosis in Missouri does rural versus urban residence matter? J Racial Ethn Health Dispar. 2016;3(2):233–239. doi: 10.1007/s40615-015-0132-9. [DOI] [PMC free article] [PubMed] [Google Scholar]
- 56.Linnenbringer E, Gehlert S, Geronimus AT. Black-White Disparities in breast cancer subtype the intersection of socially patterned stress and genetic expression. AIMS Public Health. 2017;4(5):526–556. doi: 10.3934/publichealth.2017.5.526. [DOI] [PMC free article] [PubMed] [Google Scholar]
- 57.Sineshaw HM, Gaudet M, Ward EM, Flanders WD, Desantis C, Lin CC, Jemal A. Association of race/ethnicity, socioeconomic status, and breast cancer subtypes in the National Cancer Data Base (2010–2011) Breast Cancer Res Treat. 2014;145:753–763. doi: 10.1007/s10549-014-2976-9. [DOI] [PubMed] [Google Scholar]
- 58.Kohler BA, Sherman RL, Howlader N, Jemal A, Ryerson AB, Henry KA, Boscoe FP, Cronin KA, Lake A, Noone AM, et al. Annual report to the nation on the status of cancer, 1975–2011, featuring incidence of breast cancer subtypes by race/ethnicity, poverty, and state. J Natl Cancer Inst. 2015 doi: 10.1093/jnci/djv048. [DOI] [PMC free article] [PubMed] [Google Scholar]
- 59.Chen L, Li CI. Racial disparities in breast cancer diagnosis and treatment by hormone receptor and HER2 status. Cancer Epidemiol Biomark Prev. 2015;24(11):1666–1672. doi: 10.1158/1055-9965.EPI-15-0293. [DOI] [PMC free article] [PubMed] [Google Scholar]
- 60.Kurian AW, Fish K, Shema SJ, Clarke CA. Lifetime risks of specific breast cancer subtypes among women in four racial/ethnic groups. Breast cancer Res BCR. 2010;12(6):R99. doi: 10.1186/bcr2780. [DOI] [PMC free article] [PubMed] [Google Scholar]
- 61.Amirikia KC, Mills P, Bush J, Newman LA. Higher population-based incidence rates of triple-negative breast cancer among young African-American women. Cancer. 2011;117:2747–2753. doi: 10.1002/cncr.25862. [DOI] [PMC free article] [PubMed] [Google Scholar]
- 62.Giaquinto AN, Miller KD, Tossas KY, Winn RA, Jemal A, Siegel RL. Cancer statistics for African American/Black People 2022. CA Cancer J Clin. 2022;72(3):202–229. doi: 10.3322/caac.21718. [DOI] [PubMed] [Google Scholar]
- 63.Baranova A, Krasnoselskyi M, Starikov V, Kartashov S, Zhulkevych I, Vlasenko V, Oleshko K, Bilodid O, Sadchikova M, Vinnyk Y. Triple-negative breast cancer current treatment strategies and factors of negative prognosis. J Med Life. 2022;15(2):153–161. doi: 10.25122/jml-2021-0108. [DOI] [PMC free article] [PubMed] [Google Scholar]
- 64.Bianchini G, Balko JM, Mayer IA, Sanders ME, Gianni L. Triple-negative breast cancer challenges and opportunities of a heterogeneous disease. Nat Rev Clin Oncol. 2016;13(11):674–690. doi: 10.1038/nrclinonc.2016.66. [DOI] [PMC free article] [PubMed] [Google Scholar]
- 65.Garrido-Castro AC, Lin NU, Polyak K. Insights into molecular classifications of triple-negative breast cancer improving patient selection for treatment. Cancer Discov. 2019;9(2):176–198. doi: 10.1158/2159-8290.CD-18-1177. [DOI] [PMC free article] [PubMed] [Google Scholar]
- 66.Yin L, Duan JJ, Bian XW, Yu SC. Triple-negative breast cancer molecular subtyping and treatment progress. Breast Cancer Res. 2020;22(1):61. doi: 10.1186/s13058-020-01296-5. [DOI] [PMC free article] [PubMed] [Google Scholar]
- 67.Newman LA, Kaljee LM. Health disparities and triple-negative breast cancer in african American women a review. JAMA Surg. 2017;152:485–493. doi: 10.1001/jamasurg.2017.0005. [DOI] [PubMed] [Google Scholar]
- 68.Jatoi I, Sung H, Jemal A. The emergence of the racial disparity in US breast-cancer mortality. N Engl J Med. 2022;386(25):2349–2352. doi: 10.1056/NEJMp2200244. [DOI] [PubMed] [Google Scholar]
- 69.Rauscher GH, Silva A, Pauls H, Frasor J, Bonini MG, Hoskins K. Racial disparity in survival from estrogen and progesterone receptor-positive breast cancer implications for reducing breast cancer mortality disparities. Breast Cancer Res Treat. 2017;163(2):321–330. doi: 10.1007/s10549-017-4166-z. [DOI] [PMC free article] [PubMed] [Google Scholar]
- 70.Wheeler SB, Spencer J, Pinheiro LC, Murphy CC, Earp JA, Carey L, Olshan A, Tse CK, Bell ME, Weinberger M, et al. Endocrine therapy nonadherence and discontinuation in black and white women. JNCI J Natl Cancer Inst. 2018;111(5):498–508. doi: 10.1093/jnci/djy136. [DOI] [PMC free article] [PubMed] [Google Scholar]
- 71.Kim SH, Ferrante J, Won BR, Hameed M. Barriers to adequate follow-up during adjuvant therapy may be important factors in the worse outcome for Black women after breast cancer treatment. World J Surg Oncol. 2008;6(1):26. doi: 10.1186/1477-7819-6-26. [DOI] [PMC free article] [PubMed] [Google Scholar]
- 72.Wheeler SB, Spencer J, Pinheiro LC, Murphy CC, Earp JA, Carey L, Olshan A, Tse CK, Bell ME, Weinberger M, et al. Endocrine therapy nonadherence and discontinuation in black and white women. J Natl Cancer Inst. 2019;111(5):498–508. doi: 10.1093/jnci/djy136. [DOI] [PMC free article] [PubMed] [Google Scholar]
- 73.Cahir C, Thomas AA, Dombrowski SU, Bennett K, Sharp L. Urban-rural variations in quality-of-life in breast cancer survivors prescribed endocrine therapy. Int J Environ Res Public Health. 2017;14(4):394. doi: 10.3390/ijerph14040394. [DOI] [PMC free article] [PubMed] [Google Scholar]
Associated Data
This section collects any data citations, data availability statements, or supplementary materials included in this article.
Supplementary Materials
Data Availability Statement
The datasets generated and/or analyzed during the current study are available in the Surveillance Epidemiology and End Results (SEER) 18 registrations custom data (with additional treatment fields repository, (http://seer.cancer.gov).