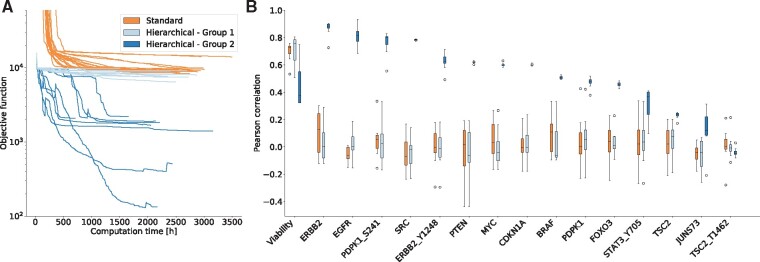
Fig. 4.
Integration of heterogeneous data using hierarchical optimization. (A) Optimizer trajectories for standard and hierarchical optimization with dataset 1 and 2 from Table 1 using Ipopt. The two groups found by the hierarchical optimization are indicated by different shades of blue. (B) Pearson correlations for all observables with at least 55 datapoints for all runs of the standard optimization and for the two groups found by the hierarchical optimization. For all observables, see Supplementary Figure S7. (Color version of this figure is available at Bioinformatics online.)

