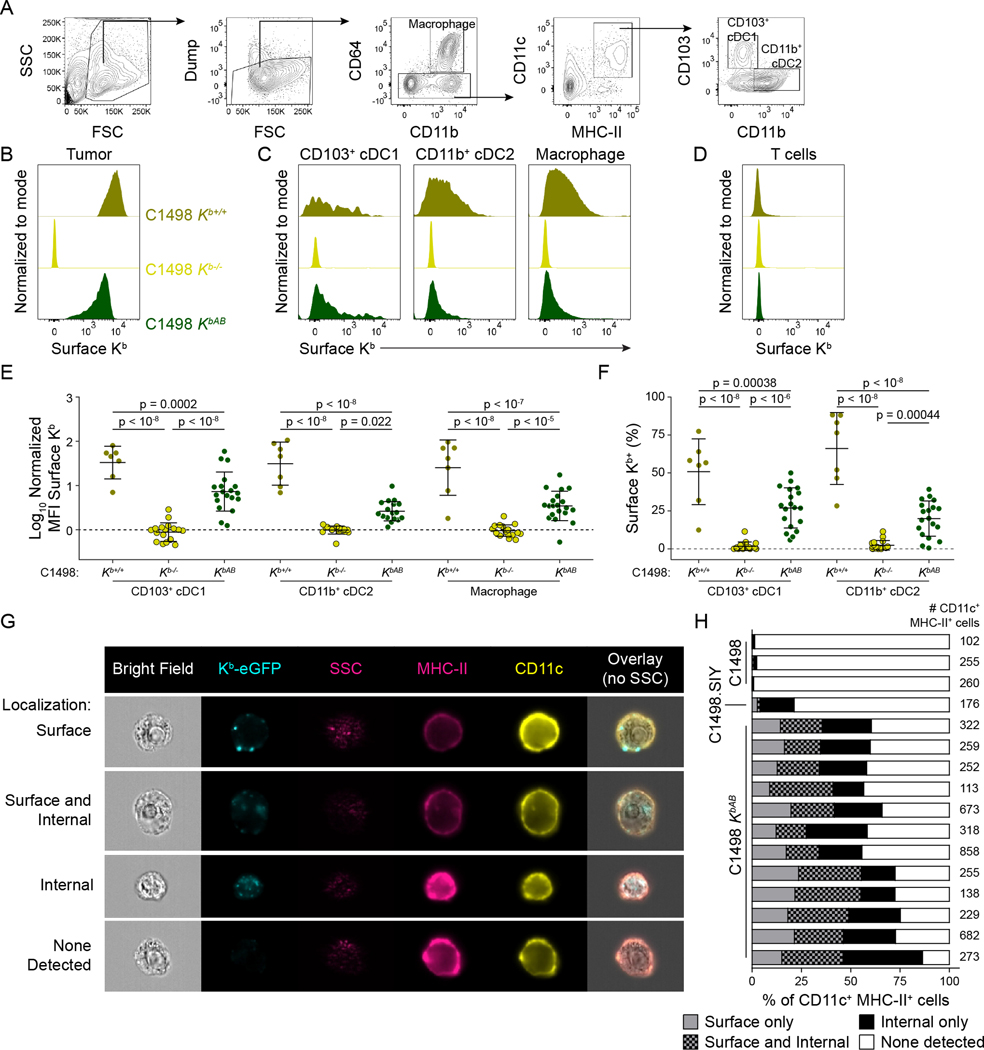
Figure 4: Acquisition of C1498-derived Kb molecules by APC populations in the tumor. A-F).
Kb−/−Db−/− mice were challenged with C1498 Kb+/+ (n = 7), Kb−/− (n = 17) or KbAB (n = 19) cells. Tumors were analyzed at day 6–10 by surface Kb staining and flow cytometry. Gating strategy is depicted in (A). Representative histograms are shown for cancer cells (B), APCs (C), and T cells (D) isolated from the tumor. Data are quantified as MFI (E) or % Kb+ (F). G and H) ImageStream cytometry of CD11c+ MHC-II+ APCs from C1498.SIY (n = 1), C1498 Kb+/+ (n = 3) or KbAB (n = 12) tumors in C57BL/6 hosts at day 6–10. Representative images are shown in (F), and quantification of intracellular versus surface Kb localization is shown in (G), with each bar representing one mouse. Statistical significance for (D) and (E) was determined by two-way ANOVA with post-hoc Tukey’s HSD test. Graphs are depicted as mean ± s.d. Data are pooled from five (A-E) or three (F-G) independent experiments. Also see Supplemental Figures S1–S3.

