Abstract
Background:
During the COVID-19 pandemic, there is a global demand for intelligent health surveillance and diagnosis systems for patients with critical conditions, particularly those with severe heart diseases. Sophisticated measurement tools are used in hospitals worldwide to identify serious heart conditions. However, these tools need the face-to-face involvement of healthcare experts to identify cardiac problems.
Objective:
To design and implement an intelligent health monitoring and diagnosis system for critical cardiac arrhythmia COVID-19 patients.
Methodology:
We use artificial intelligence tools divided into two parts: (i) IoT-based health monitoring; and (ii) fuzzy logic-based medical diagnosis. The intelligent diagnosis of heart conditions and IoT-based health surveillance by doctors is offered to critical COVID-19 patients or isolated in remote locations. Sensors, cloud storage, as well as a global system for mobile texts and emails for communication with doctors in case of emergency are employed in our proposal.
Results:
Our implemented system favors remote areas and isolated critical patients. This system utilizes an intelligent algorithm that employs an ECG signal pre-processed by moving through six digital filters. Then, based on the processed results, features are computed and assessed. The intelligent fuzzy system can make an autonomous diagnosis and has enough information to avoid human intervention. The algorithm is trained using ECG data from the MIT-BIH database and achieves high accuracy. In real-time validation, the fuzzy algorithm obtained almost 100% accuracy for all experiments.
Conclusion:
Our intelligent system can be helpful in many situations, but it is particularly beneficial for isolated COVID-19 patients who have critical heart arrhythmia and must receive intensive care.
Keywords: Artificial intelligence, Defuzzification, Features extraction, Finite impulse response, Fuzzy membership and rules, Global system for mobile communication, Internet of things, MIT-BIH database, QRS peaks, SARS-CoV-2
Graphical abstract
1. Introduction, nomenclature, and objectives
The nomenclature used in the present article is reported in Table 1.
Table 1.
Nomenclature employed in the present article.
| Abbreviation | Description |
|---|---|
| App | Application of a software program |
| CK | Coefficient of kurtosis |
| COVID-19 | Coronavirus disease 2019 |
| CoV-2 | Coronavirus 2 |
| CS | Coefficient of skewness |
| DC | Direct current |
| E | Energy |
| ECG | Electrocardiogram |
| FIR | Finite impulse response |
| GPS | Global positioning system |
| GSM | Global system for mobile communication |
| HM | Harmonic mean |
| Hz | Hertz |
| IoT | Internet of things |
| KF | Kurtosis feature |
| LCD | Liquid crystal display |
| MATLAB | Matrix laboratory software |
| MD | Mean deviation |
| MIT-BIH | Massachusetts Institute of Technology – Beth Israel Hospital |
| NET | Type of internet (wired, that is, |
| local area networks –LAN–, or wireless fidelity –Wi-Fi–) | |
| NodeMCU | Node microcontroller unit |
| QRS | Q, R and S (shear) waves |
| SARS | Severe acute respiratory syndrome |
| SD | Standard deviation |
| SF | Skewness feature |
| WHO | World Health Organization |
Early detection, identification, and treatment of substantial irregular heartbeats are the most critical factors for the patient’s survival. Patients with arrhythmias may succumb quickly due to the dangerous condition of irregular heartbeats [1]. Researchers have extensively studied electrocardiogram (ECG) signals using various methods for the peak recognition of Q, R, and S waves (QRS). These methods correspond to: (i) adaptive matched filter approaches for the QRS detection [2]; (ii) heartbeats variations with blood glucose levels [3]; (iii) hemodialysis influence on heartbeats alteration [4]; (iv) pre-processing approaches to detect the QRS complexity [5]; (v) microprocessing systems for online ECG analysis [6]; (vi) optimum complex pre-detectors with a matched filter approach [7]; (vii) QRS detection employing an algorithm based on multi-frame and multi-scale morphology [8]; (viii) QRS detection based on the wavelet transform [9]; and (ix) complex QRS detection algorithms based on nonlinear transformations [10].
Patients suffering from critical cardiac arrhythmia have a high risk of mortality. Accurate detection of acute arrhythmic disease has been a challenge for researchers, who have worked on numerous time-domain [11], and frequency-domain algorithms [12] to achieve high accuracy.
For classification and analysis of ECG signals, different methods, such as hidden Markov models [13], Hilbert transform [14], Hermite adaptive estimation [15], and wavelet transform [16], have been proposed.
Researchers have focused on diverse artificial intelligence techniques for discriminating and classifying critical cardiac arrhythmia [1], [17], [18]. Mainly, intelligent systems based on fuzzy logic are utilized in many practical and industrial applications, such as aircraft control, airship control, control of electrohydraulic systems, pattern recognition image retrieval, precise control of motors, robot control, and speech recognition [19], [20]. Due to the high accuracy of fuzzy intelligent systems, they are being considered in medical applications as well [21], [22].
The internet-of-things (IoT) has become capable of helping to perform surgery, plan pre-operation, and remove live monitoring of the patients [23]. IoT developments in hospitals have reduced administrative duties, and enhanced clinical outcomes with IoT-enabled equipment [24]. Health parameters can be accessed and monitored from remote locations using IoT platforms with high accuracy [25]. The main advantage of an IoT platform for health monitoring is its capability to measure readings of a large number of sensors connected with Arduino microcontrollers [26]. It is possible to apply intelligent tools for critical arrhythmia detection in patients, providing IoT-based health monitoring. To the best of our knowledge, this type of tool has been no applied to critical arrhythmia detection in patients.
COVID-19 is a severe acute respiratory syndrome (SARS) produced by coronavirus 2 (CoV-2) that was discovered on December 2019 in Wuhan, China, and declared by the World Health Organization (WHO) as a pandemic in March 2020. Different types of SARS-CoV-2 have been identified [27]. Available data on the WHO’s website (COVID19.who.int) report millions of people affected by COVID-19 worldwide, and many have lost their lives due to this pandemic [28], [29]. SARS-CoV-2 has revolutionized the globe, as well as the economy and finance [30], [31], obliging us to a new way of life that will keep its mark on society forever. The spread of COVID-19 was so rapid that almost all countries imposed either partial or complete lockdowns in affected areas to curb its spread [32]. Precautionary measures imposed by different governments direct their masses to follow the standard operating procedure to control its spread [33].
The WHO says that maintaining a social distance and isolating patients can prevent the rising incidence of COVID-19 cases. The WHO has also declared that heart failure, cardiac arrest for unexplained or unrelated causes, and other cardiovascular illnesses are the leading causes of mortality [34], [35]. In [36], COVID-19 viruses were identified in heart tissues of several deaths from this virus. Hence, SARS-CoV-2 can cause cardiac damage. Furthermore, COVID-19 infects heart cells and provokes arrhythmia and heart failure. Researchers have utilized cloud computing as artificial intelligence-based detection of various cardiovascular illnesses [37], [38].
Our critical analysis of the literature on the topic reveals that diverse systems have been developed. Nevertheless, they employ the IoT or fuzzy logic, but not both simultaneously. Table 2 compares functionality for different health monitoring systems. To the best of our knowledge, the development of such hybrid systems that simultaneously combine the IoT and fuzzy logic to make efficient patient monitoring has been no introduced until now. Patients in remote zones, where the doctor’s presence is uncommon, can benefit from this system, particularly COVID-19 patients.
Table 2.
Comparison of functionality for existing health monitoring systems.
Consequently, the primary motivation for the present investigation is to provide timely medical treatment and diagnosis using an intelligent system based on current digital technologies, combining the IoT and fuzzy logic. This system besides makes efficient patient monitoring. Therefore, the main objective of the present investigation is to design and put into practice an IoT-based fuzzy intelligent health monitoring system. This system allows us to analyze and diagnose life-threatening situations when heartbeat irregularity is observed in COVID-19 patients.
The system transfers the patient’s data online to doctors and permits clinical personnel to prescribe drugs to the patients when doctors are not logged into the internet on a webpage, with a minimum cost and good accuracy. The doctor can check the data whenever he/she wants by logging into the web application, which can be accessed from any Internet browser. Also, the intelligent system makes it easier for clinicians to monitor vulnerable patients, mainly if they are isolated or remotely located. It is challenging to train the suggested fuzzy system intelligently while maintaining a low computational cost and obtaining about 100% accuracy for all real-time experimental validations. This enables the detection of critical cardiac conditions in COVID-19 patients by employing locally available low-cost sensors. To obtain the desired accuracy, ECG signals of different critical cardiac arrhythmia patients are collected from the Massachusetts Institute of Technology–Beth Israel Hospital (MIT-BIH) database (physionet.org/content/mitdb/1.0.0). In this study, ECG and heartbeat sensors are interfaced with an Arduino microcontroller and internet module to record the patient’s data and transmit them to a webpage. The doctor can see the data online and provide feedback to the patient, for example, during an emergency for COVID-19 patients.
The rest of this article is organized as follows. The methodology proposed for the present study is introduced in Section 2. The results obtained from this study about the calculation of standard features, the choice of training features, and the accuracy of the proposed intelligent system are stated in Section 3. Finally, Section 4 provides the conclusions of our research.
2. Methodology
In this section, the methodology of our intelligent health system is presented for IoT-based continuous monitoring and diagnosis of critical and isolated cardiac arrhythmia COVID-19 patients. Here, we describe aspects related to IoT gateway and network, ECG signal processing, fuzzy logic, its membership functions, as well as training of the system. The methodology is summarized at the end of this section.
2.1. IoT gateway and network
To record the critical cardiac patient’s data, an ECG sensor is connected to his/her body, and then an ECG signal is delivered to the intelligent diagnostic system for autonomous arrhythmic detection. A NodeMCU ESP8266 microcontroller [45] provides serial communication with our critical arrhythmia diagnostic system. NodeMCU ESP8266 is a low-cost microcontroller that plays an essential role in IoT-based real-time monitoring [41]. In the proposed system, the NodeMCU microcontroller collects data from the sensor, and so the system transmits them to the IoT-Blynk platform via Wi-Fi. This platform displays such data to the doctor for examination. Any cloud data history can be accessed by employing a mobile application connected to the Blynk platform. Hence, doctors can state critical indications or thresholds regarding the patient’s health on the Blynk platform to get emergency alerts via emails or messages on a mobile application. Doctors may also make live communications with the patients for prescriptions and guidance. Fig. 1 displays the proposed cost-effective experimental setup using locally available sensors for remote areas and isolated patients.
Fig. 1.
Hardware setup of the proposed methodology.
When building a monitoring and diagnosis system based on an IoT platform, the first and foremost parts are to design, analyze, and implement a network that can be used for this platform. Next, we provide technical information about a potential network for our system using an IoT gateway. In Table 3, the steps and interactions that occur within a network proposed for our system are reported. In Fig. 1, we can see, among other components, the ECG sensor, the microcontroller, and the local computer. In addition, Fig. 2 shows the network components and their relationships. It is important to mention the client process that runs on the local computer, from where the ECG signal is received, is an HTTP client that sends requirements via Wi-Fi to the IoT-Blynk web platform. This platform receives the client process’s requirements through a web server. The doctor analyzes the ECG signal and connects to this platform through a mobile device. For alert/warning messages, the SMTP protocol is configured. While the doctor may be geographically far away, medical staff are close to the patient, receive alert messages, and care for the patient.
Table 3.
Steps of the proposed network of our system.
| Step | Description |
|---|---|
| 1 | The ECG signal is generated from an ECG sensor connected to the patient. |
| 2 | The microcontroller receives the ECG signal and delivers it to a client process running on a local computer. |
| 3 | The client process starts a timer, transmits the ECG signal to the IoT-Blynk web platform, sends an SMTP message to the patient’s doctor, and moves to a waiting state. |
| 4 | The doctor receives a warning message and connects to the IoT-Blynk web platform to analyze the ECG signal. |
| 5 | The doctor, from a mobile application, generates a diagnosis and sends the alert message to the patient’s medical staff (the client process receives a copy of the message). |
| 6 | If after a predetermined time there is no alert message from the doctor, the client process sends a request to the intelligent system. |
| 7 | The intelligent system, using fuzzy logic, analyzes the ECG signal, generates a diagnosis, and sends the alert message to the patient’s medical staff. |
| 8 | In either case, the patient’s medical staff receives the alert message and takes the necessary medical actions to benefit the patient’s health. |
Fig. 2.
Proposed network for our system using an IoT gateway.
2.2. ECG signal processing
Next, we describe our proposed system from a signal-processing perspective. To train and test the system, the MIT-BIH database is used. From this database, the ECG signal of a healthy patient and three ECG signals of patients with arrhythmia are received. These four signals are standardized to compare them. To standardize a one-dimensional data set, we must carry out two steps. The first step is calculating the mean and standard deviation of the data set. The second step consists of subtracting the mean from each data set and then dividing this subtraction by the standard deviation. This is what we do with the four ECG signals. We call this stage the standardization of the ECG signals.
Each ECG signal in the database is sampled at 128 Hz. Half of this 128 Hz is used to train the fuzzy system, and the other half to evaluate its accuracy (testing). The 64 Hz is divided into six filters of approximately 10 Hz each to train the system. The filtering is done to eliminate high-frequency noise elements. For each filtered output, eight indicators/features are determined, such as mean, SD, median, energy (E), coefficients of skewness (CS; asymmetry) and kurtosis (CK), harmonic mean (HM), and mean deviation (MD).
Table 4 recalls the mathematical formulations of all these indicators computed for both original and filtered output signals of each ECG signal. The computed statistical indicators are used to train the fuzzy system.
Table 4.
Statistical indicators and their mathematical expression for designing the fuzzy rules.
| Indicator | Mathematical expression |
|---|---|
| Mean | |
| Standard deviation | |
| Median | |
| Energy | |
| Coefficient of skewness | |
| Coefficient of kurtosis | |
| Harmonic mean | |
| Mean deviation |
Where represents the sample size corresponding to each one-dimensional array data set, and is observation of each ECG data set (sample), while is the mean value of each data set.
The use of Butterworth filters enhances the pre-processing of signals [46], and the MATLAB software [47] may be used to produce low-pass and bandpass filters. The lowpass filter, which is the standard prototype for all filters, can be utilized to build high-pass, bandpass, and band-stop filters. Therefore, six Butterworth filters are used, the first of which is a lowpass filter, whereas the others are bandpass filters. This filtering is also carried out with the real-time ECG signals of the patients who use the system that we propose to determine if the patient is healthy or has cardiac arrhythmia. The mathematical description of the th order low-pass Butterworth filter is given by
where is the cutoff frequency (about the 3 dB frequency, that is, the cutoff frequency of an electronic amplifier stage at which the output power has dropped to half of its mid-band level); is the order of the filter; and is the DC gain (direct current gain at zero frequency). Then, a Butterworth filter of order is chosen.
ECG signal standardization and filtering are critical in fuzzy system training and testing. The fuzzy sets are built on these first two stages of signal processing. These sets in our proposal have a triangular shape, and standardization and filtering are two fundamental stages of fixing the vertices of the triangles that define the membership functions. Once the fuzzy sets are defined through their membership functions, the fuzzy rules are defined. As mentioned, half of the 128 Hz ECG signals are used for training the fuzzy system and the other half for testing. Fig. 3 shows the stages related to ECG signal processing when they are collected from the MIT-BIH database to test our fuzzy system. These seven stages summarize all the tasks that are carried out during the processing of the ECG signal. The good treatment of ECG signals is the most important part of our proposal. For more details on system training, see Section 2.5. For more details on the processing of ECG signals and their plots, see Section 3.1.
Fig. 3.
Stages in ECG signal processing.
2.3. Fuzzy logic
Fuzzy logic allows us to represent the common knowledge, mainly of the qualitative linguistic type, in a mathematical language through the theory of fuzzy sets and membership functions associated with them [19]. Classical mathematical logic is binary, that is, a statement is either true or false, but the real world does not work in that way. Fuzzy (or non-crisp) logic is a multivalued paraconsistent logic in which the true values of linguistic variables can be transformed into any real number between zero and one through degrees of membership of an element to a set. Therefore, it is employed to handle the concept of partial truth, where the truth value may range between entirely true and completely false. By contrast, in the Boolean (traditional or crisp) logic, the truth values of variables may only be the integer values zero or one. Such logic is better suited to our real world, where our opinions are relative. Fuzzy logic is based on the fact that people make decisions using imprecise and non-numerical information. This logic allows decisions to be made based on intermediate degrees of compliance with a premise.
Example 2.1
Let us present an example illustrating the difference between Boolean and fuzzy logic. If one is asked whether the climate is cold or not, in binary logic, one only has two possible answers: “yes, it is cold” or “no, it is not cold”. However, in fuzzy logic, one has more options with answers such as: “it is a very cold”, or “it is cold, but not that much”, or “it is neither cold nor hot; the temperature is nice”, or “it is very hot”. Note that the answer is subjective because it depends on the person. From what temperature does a person feel cold? The answer is nuanced.
Fuzzy models or sets are mathematical descriptions representing vagueness and imprecise information (from where the term fuzzy originates) using “degrees of membership” as a mathematical model of uncertainty. The fuzzy models can recognize, represent, interpret, and use data and information that are vague and lack certainty. In fuzzy set theory, we can also define the union, intersection, difference, negation, and complement operations, as well as other operations on sets. Each fuzzy set has an associated membership function for its elements, indicating to what extent the element is part of that fuzzy set.
The most typical membership function shapes are triangular, trapezoidal, linear, and curved [19].
Example 2.2
Let us continue with our “climate example”. Suppose we have three fuzzy sets: , , and , where is the set that represents a low temperature (cold), is the medium temperature (warm), and is the high temperature (hot). The temperature is measured in degrees Celsius. For each fuzzy set, we have the corresponding membership function: , , and . When a membership function is evaluated on a temperature value, the degree of membership of that temperature to the corresponding fuzzy set is obtained as a result. Consider the membership functions given by
(1)
(2)
(3) In (1), we can see the membership function for the fuzzy set , in (2) for the fuzzy set , and in (3) for the fuzzy set . Fig. 4 shows the plot of the three membership functions defined above. Note the trapezoidal shape of the membership functions for sets and , and the triangular shape of the membership function for set .
Table 5 shows the degrees of membership for three different values of temperature: 21, 23, and 29 degrees Celsius. Hence, the temperatures of 21, 23, and 29 degrees Celsius should be considered low, medium, and high, respectively. Fig. 5 shows the values of Table 5.
Fig. 4.
Plot of the membership functions of the climate example.
Table 5.
Different temperature values and their corresponding degrees of membership.
| Temperature | |||
|---|---|---|---|
| 21 | 0.8 | 0.2 | 0.0 |
| 23 | 0.4 | 0.6 | 0.0 |
| 29 | 0.0 | 0.2 | 0.8 |
Fig. 5.
Plot of the membership functions of the climate example, highlighting temperature values: 21, 23 and 29 degrees Celsius.
Fuzzy logic is based on heuristic rules of the form IF (antecedent) and THEN (consequent), where the antecedent and consequent are also fuzzy sets: pure or resulting from operating on them. Examples of its heuristic rules are the words: “extremely”, “very”, “moderately”, “slightly”, and “not at all”. The inference methods for this rule base must be simple, versatile, and efficient. These methods result in a final common area, corresponding to a set of overlapping areas, where each area results from an inference rule. To choose a specific output from many diffuse premises, the most used method is the centroid, in which the final output is the center of gravity of the resulting final area. Experts can formulate rules for the inference engine of a fuzzy system. Input data are usually collected by sensors that measure the input variables of a system.
Fuzzy logic is an essential concept in medical decision-making. Such logic may be employed in many aspects of the medical decision-making framework. Since medical and healthcare data can be subjective, applications in this domain have a great potential to benefit by using fuzzy logic-based approaches. The biggest question in this application area is how much helpful information can be derived when employing fuzzy logic. A significant challenge is how to obtain the required data, especially when one has to elicit such data from humans.
In fuzzy logic applications, non-numeric values are often utilized to facilitate the expression of rules and facts. A linguistic variable such as age may accept values such as young and its antonym old. Because natural languages do not always contain enough value terms to express a fuzzy value scale, it is a common practice to modify linguistic values with adjectives or adverbs. For example, we can employ the hedges instead and somewhat to construct the additional values rather old or somewhat young. The most known system uses the following rules: (i) to fuzzify all input values into fuzzy membership functions; (ii) to execute all applicable rules in their base to compute the fuzzy output functions; and (iii) defuzzify the fuzzy output functions to get crisp output values; see Fig. 6.
Fig. 6.
Block diagram of the fuzzy logic.
Fuzzification assigns a numerical input of a system to fuzzy sets with some degree of membership, which may be any value in the interval . Any value between 0 and 1 represents the degree of uncertainty that the value belongs to the set. If it is zero, the value does not belong to the given fuzzy set; if it is one, the value entirely belongs within the fuzzy set. Words typically describe these fuzzy sets, and so by assigning the system input to fuzzy sets, we can reason with it in a linguistically natural manner.
As mentioned, fuzzy sets are often defined as triangularly-shaped curves, as each value has a slope where it is increasing, a peak where it is equal to 1, and a slope where the value is decreasing. These values can be defined using a standard logistic function given by
| (4) |
which has the symmetry property stated as and is obtained from (4). Fuzzy logic works with membership values in a way that mimics Boolean logic. To this end, basic operators like AND, OR, and NOT must be available. There are also other linguistic operators called hedges that can be applied. These are generally adverbs such as “very” or “somewhat”, which modify the meaning of a set using a mathematical formula. Given any two of AND/OR/NOT, it is possible to derive the third. When an output variable occurs in several THEN parts, the values from the respective IF parts are combined using the OR operator.
Defuzzification gets a continuous variable from fuzzy truth values. This would be easy if the output truth values were precisely those obtained from the fuzzification of a given number. However, as all output truth values are computed independently, they do not represent such a set of numbers in most cases. Thus, we can choose a number that best matches the “intention” encoded in the truth value. A standard defuzzification method is described in Algorithm 1.
Since the fuzzy system output is a consensus of all of the inputs and rules, fuzzy logic systems can be well-behaved when input values are not available or are not trustworthy. Weightings can be optionally added to each rule in their base, and they can regulate the degree to which a rule affects the output values. These rule weightings could be based on each rule’s priority, reliability, or consistency. Such weightings may be static or changed dynamically, even based on the output from other rules.
Our intelligent system is designed to classify different critical cardiac arrhythmia conditions of isolated COVID-19 patients. Due to the advantage of fuzzy systems over conventional binary logic systems, they have been adapted for many practical applications. Fuzzy systems are also helpful tools in artificial intelligence and control theory. The main reason behind the vast practical applications of fuzzy logic-based systems is their structure as a powerful, complete, and intelligent tool with simple reasoning functionality.
This owerful tool takes the heuristics from human intelligence in a specific practical field. Hence, the fuzzy logic structure translates all heuristics, taken from human intelligence, into tangible values [19]. The block diagram of the intelligent system to classify critical arrhythmia patients is given in Fig. 7. This system is based on feature extraction and training of rules based on fuzzy logic.
Fig. 7.
Block diagram of the intelligent system.
2.4. Fuzzy membership functions and defuzzification
As mentioned, fuzzy systems utilize linguistic variables to state rules and facts employing degrees of membership (in the range) rather than the yes-or-no range, contrary to typical binary systems. As they work in the range rather than the yes-or-no range, the minimum, and maximum values are set to 0 and 1, respectively. As earlier indicated, triangular membership functions are widely employed in real-time applications of fuzzy systems. The proposed methodology also uses these triangular membership functions, and it provides a mathematical representation of them in the form given by
| (5) |
where is the minimum value, is the median value, and is the maximum value for each triangular membership function, as defined in the expression stated in (5). The fuzzifier component of this intelligent system determines the membership functions for the linguistic variables that it receives as inputs.
The specified membership functions are applied using the true values of the input variables. The truth values are computed in the second phase by applying the fuzzy inference rules. Table 6 defines the fuzzy inference based on the minimum rule for the input variables , , and output variable in the range [0, 1]. Only one output variable is subject to each rule’s application of a single fuzzy subset. Defuzzification, which turns fuzzy outputs into crisp outputs, is the final stage of the fuzzy system. This system is consensual with input and output variables. The most widely utilized defuzzification method is called the centroid.
A fuzzy set exists if is a group of elements indicated by the generic symbol . An ordered pair set in is defined as
| (6) |
where the set is called the membership function as defined in (6). Defuzzification is a technique for converting a fuzzy output set into a crisp output. For triangular linear functions, the centroid method is created as
| (7) |
where defines output in the universe of discourse and is its membership value, with being a unique centroid crisp output value as stated in (7). MIN fuzzy inference rules for input variables , and output variable , in the interval [0,1], are presented in Table 6. Similarly, MAX inference rules are defined based on OR logic. This system was implemented in MATLAB with the help of the fuzzy toolbox.
Table 6.
Structure for minimum fuzzy inference rules.
| Rule | Input | Input | Output |
|---|---|---|---|
| 1 | if | if | then |
| 2 | if | if | then |
| 3 | if | if | then |
| 4 | if | if | then |
Example 2.3
Fig. 8 shows three output membership functions. By considering Fig. 8’s “likely” membership function, the value of lower-end parameter is 0.1 or 10%; the value of middle parameter is 0.5 or 50%; and the value of the upper-end parameter is 0.9 or 90%.
Fig. 8.
Output membership functions and assignments.
Example 2.4
Now, we use an academic example to illustrate the rules and defuzzification process.
Suppose one patient stays one night in a hospital. The next day, the patient receives a medical discharge and is asked to rate the accommodation from 0 to 10, understanding that 0 means the hospital was lousy and that 10 means the hospital was fabulous. The patient decides to perform the rating considering two components: (i) the service received by the medical staff and (ii) the quality of the room. Then, the patient decides to use the following rules: (i) if the care of the medical staff is “bad” or the room quality is “poor”, then the hospital’s rating is “low”; (ii) if the care of the medical staff is “good”, then the rating of the hospital is “normal”; (iii) if the care of the medical staff is “outstanding” and the room quality is “high”, then the rating of the hospital is “high”. Note that we have two input variables: (care of medical staff) and (room quality). We have an output variable: (hospital rating).
For the variable , we have three fuzzy sets: (bad), (good), and (outstanding), with membership functions , , and , respectively.
For the variable , we have two fuzzy sets: (poor quality) and (high quality), with membership functions and , respectively.
For the variable , we have three fuzzy sets: (low), (normal), and (high), with memberships , , and , respectively.
Suppose the patient rates medical care and room quality from 0 to 10, where 0 is the lowest rate and 10 is the highest rate. If the patient rates the medical care with and the room quality with , how would the patient rate the hospital? The first step is to evaluate the membership functions of all the input variables with the corresponding values. Suppose also that, after evaluating, the values that we see in Table 7 are obtained. Furthermore, assume that the membership functions of the output variable behave as in Fig. 9.
The second step is to apply the fuzzy rules. The first rule tells us that if the medical staff’s care is “bad” or the room quality is “poor”, then the hospital’s rating is “low”.
Let us look at the antecedent of the rule. Note that and . Thus, we take the maximum of these two values, 0.6 namely, due to fuzzy disjunction. With the value of 0.6, we apply a cut to the fuzzy set with membership function , as shown in Fig. 10.
The second rule tells us: if the care of the medical staff is “good”, then the rating of the hospital is “normal”. The antecedent of implication only has a single fuzzy proposition. Hence, we take the value and cut the membership function of the fuzzy set , as shown in Fig. 11.
Then, the third rule tells us: if the care of the medical staff is “outstanding” and the room quality is “high”, then the rating of the hospital is “high”.
Let us look at the antecedent of this last rule. Note that and . Thus, we take the minimum of these two values, 0.1, due to fuzzy conjunction. With the value of 0.1, we apply a cut to the fuzzy set with membership function , as shown in Fig. 12.
The outputs obtained by the three fuzzy rules are combined by the union of the three regions obtained previously. This union of regions is shown in Fig. 13. To finish the defuzzification process, a value for the variable is calculated using the centroid method. The value of 3.66 is obtained by computing the centroid. Thus, the hospital’s rating is . Therefore, using fuzzy logic, from the values and , the value is obtained.
Table 7.
Evaluation in the membership functions of the input variables in the hospital example.
| Variable | Membership functions | ||
|---|---|---|---|
Fig. 9.
Plot of the membership functions of the output variable in the hospital example.
Fig. 10.
Cut of the membership function of the fuzzy set in the hospital example.
Fig. 11.
Cut of the membership function of the fuzzy set in the hospital example.
Fig. 12.
Cut of the membership function of the fuzzy set in the hospital example.
Fig. 13.
Region over which the centroid method is applied in the hospital example.
2.5. Training and summary of the methodology
As mentioned, our research also provides training in a fuzzy system to achieve high accuracy in real-time critical heart condition detection.
In Fig. 14, we can see the stages that are carried out to train the fuzzy system. The critical part of the training occurs when the membership functions are constructed, and the fuzzy rules are generated.
Fig. 14.
Stages of the system training.
We work with the original ECG signals and the subsamples of approximately 10 Hz each to build the membership functions. For both the original ECG signals taken from the MIT-BIH database and corresponding subsamples, the statistical indicators that allow us to build the membership functions of the fuzzy sets are computed and selected.
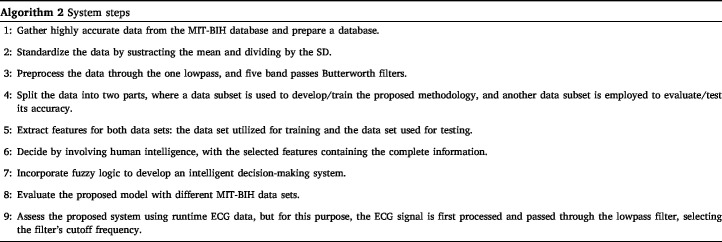
The designed methodology of our intelligent fuzzy system is shown in Figs. 15, Fig. 16, Fig. 17. As mentioned, the recorded ECG data preprocessing is required before the feature extraction. The features with maximum information and maximum diversity are then selected for the training of the fuzzy system. The accuracy of the trained model is tested in real-time signals of critical cardiac arrhythmia patients. Algorithm 2 shows the system’s steps to provide the corresponding medication to a patient. Output results provided almost 100 percent accuracy of the proposed intelligent system.
Fig. 15.
Design of the intelligent system.
Fig. 16.
Proposed IoT-based intelligent methodology.
Fig. 17.
Flowchart of the proposed system.
Recall that 50% of the ECG signal data are used for model development (training), and 50% remaining are employed for accuracy evaluation of intelligent fuzzy system (testing). About 100 experiments are conducted to evaluate the algorithm’s precision. We conduct numerous trials to verify the accuracy of the designed system. Astute human observations reduce the computational cost by limiting the training set to the most crucial elements.
3. Results
In this section, the results obtained from our study about the calculation of standard features, the choice of training features, and the accuracy of the proposed intelligent system are presented.
3.1. Extraction and calculation of features
The behavior of its QRS peaks characterizes each ECG. An ECG signal is shown in Fig. 18 and labeled with its Q, R, and S peaks. Accurate detection of QRS peaks, as labeled in Fig. 18, has been a challenge for researchers, as discussed in [7], [8], [9], [10].
Fig. 18.
The QRS peaks of the ECG of signal.
QRS complexes determine the rhythm of normal and critical conditions of arrhythmia patients [48].
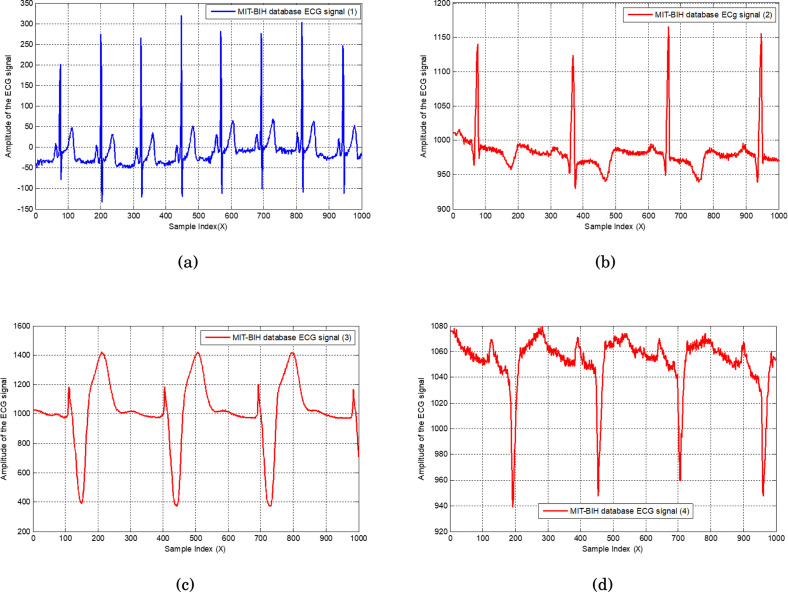
The accuracy of critical arrhythmia diagnosis entirely depends on the intelligent selection of quantitative and qualitative features [49], [50]. The proposed fuzzy system requires an intelligent selection of these features for high accuracy. This high level is achieved by recording different samples of four ECG signals of arrhythmia patients from the MIT-BIH database. The first ECG signal is recorded as normal, and the remaining ECG data are selected from different arrhythmia patients utilizing the MIT-BIH database.
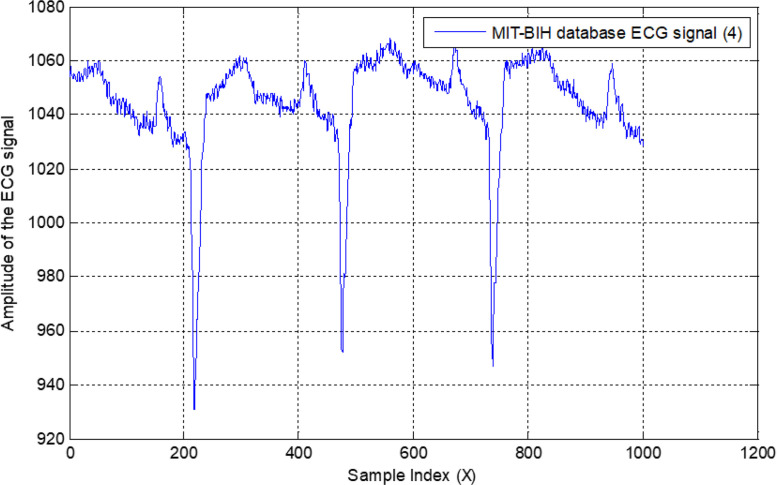
All normal and arrhythmia patient’s signals are shown in Fig. 19, where Fig. 19(a) represents the normal status, and Fig. 19(b)(c)(d) show the different arrhythmia patients. Amplitudes of all ECG signals are represented in millivolts on the vertical axis without normalization.
Fig. 19.
Recorded normal ECG signal with 1000 samples (a); recorded first arrhythmia ECG signal (b); recorded second arrhythmia ECG signal (c); and recorded third arrhythmia ECG signal (d).
Next, as mentioned, each ECG signal is adjusted by subtracting the mean and then dividing by the SD [51]. Observe that all ECG signals are sampled at 128 Hz. The equal bandwidth of each filter is considered in the design of all six finite impulse response (FIR) filters. This approximated 10 Hz bandwidth is obtained by dividing 64 Hz into six parts.
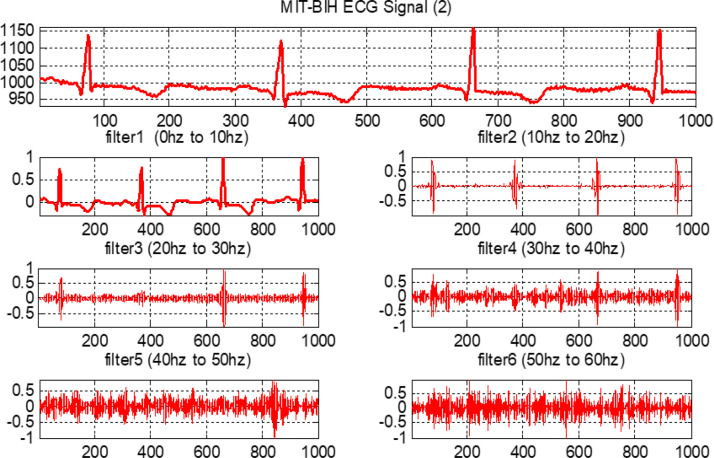
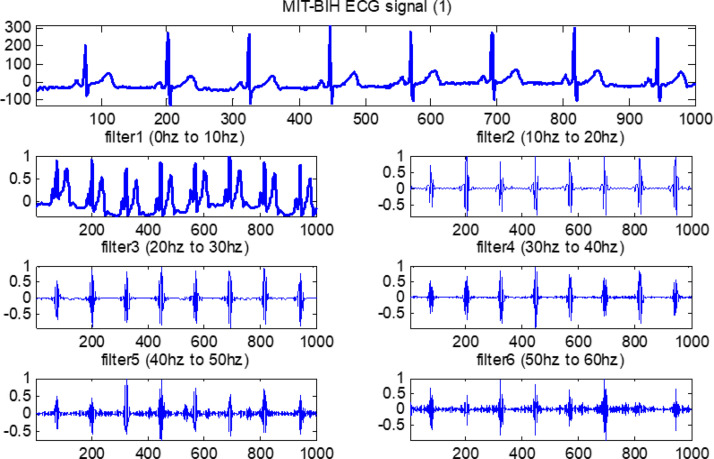
Each filter is a second-order system. The following ranges are considered in the design of all six FIR filters: (i) the first FIR filter is lowpass and ranges from 0–10 Hz; (ii) the second FIR filter is bandpass with a range from 10–20 Hz; and, similarly, (iii) third, fourth, fifth and sixth FIR filters are also bandpass with ranges from 20–30 Hz, 30–40 Hz, 40–50 Hz, and 50–60 Hz, respectively. All ECG data from the MIT-BIH database are moved through these six designed filters.
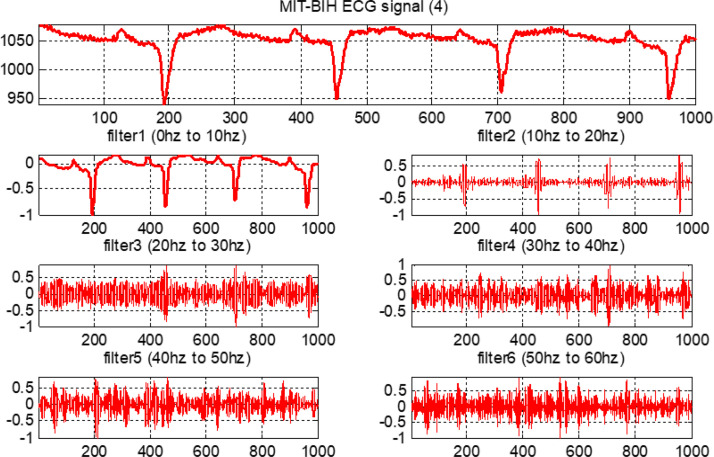
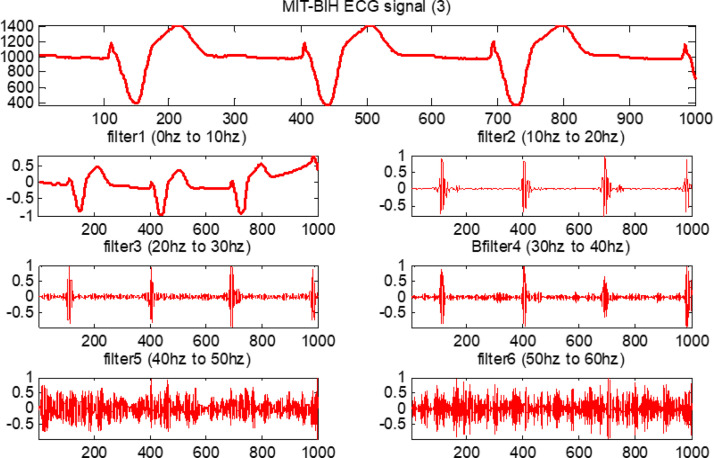
The output results are evaluated for feature calculation, which is an important part of the training of the fuzzy system. Fig. 20, Fig. 21, Fig. 22, Fig. 23 show the original ECG signal and their filter outputs.
Fig. 20.
The filtered outputs for normal status.
Fig. 21.
The filtered outputs for first arrhythmia.
Fig. 22.
The filtered outputs for second arrhythmia.
Fig. 23.
The filtered outputs for third arrhythmia.
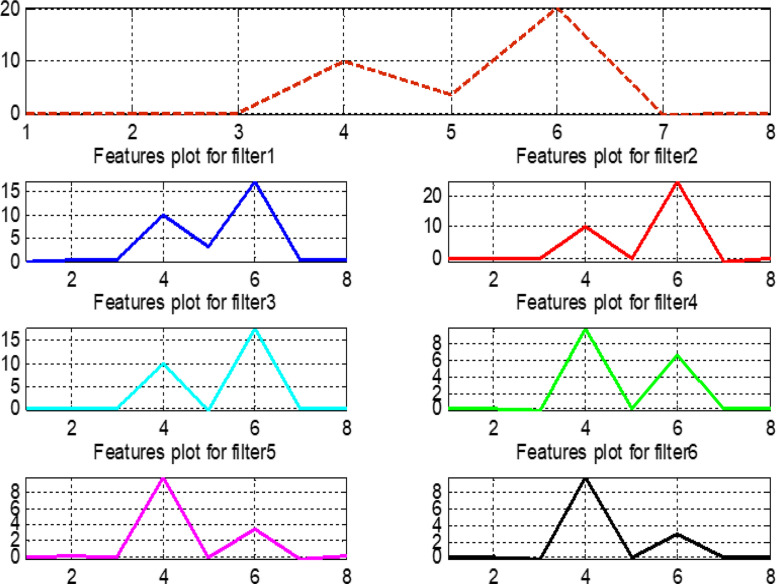
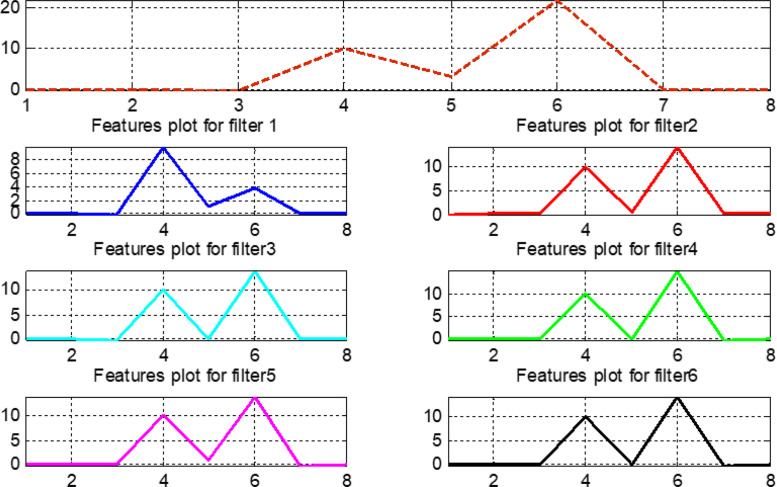
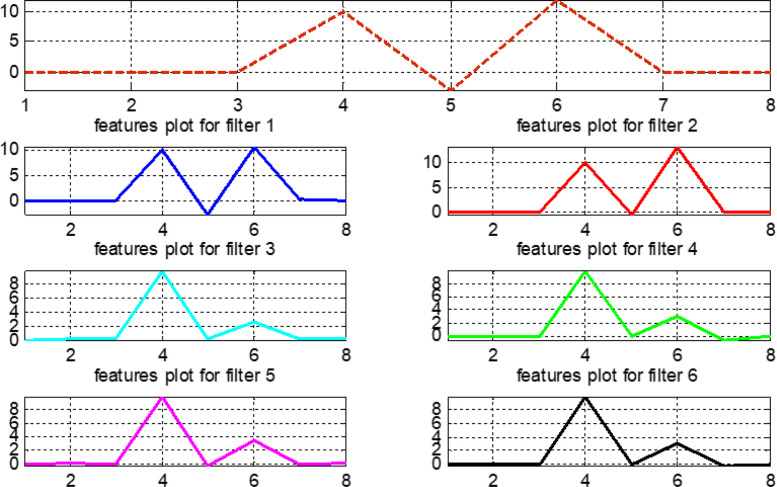
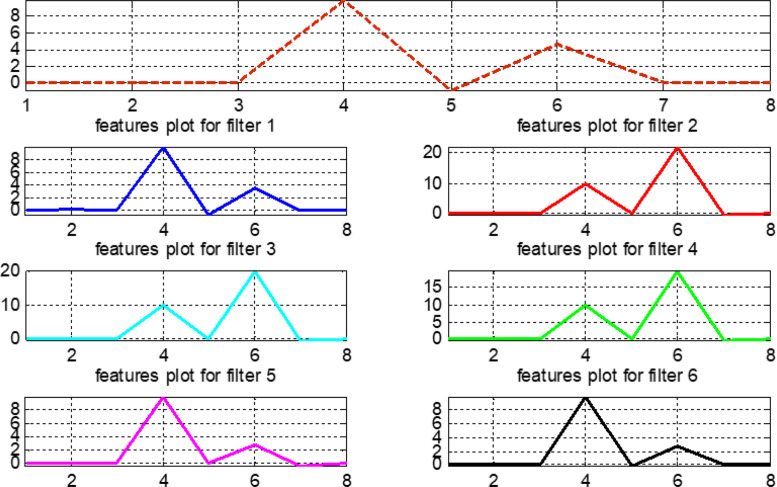
The pre-processed normalized data are considered for calculating the features presented in Table 4. The vertical axis of Fig. 24, Fig. 25, Fig. 26, Fig. 27 represents the magnitude values of all features, while the horizontal axis states the features in the same sequence as mentioned in Table 4. Features that exhibit variable and different behavior for the original signal and filtered outputs contain more information and help in intelligent training of the proposed fuzzy systems.
Fig. 24.
Features plot for the normal signal.
Fig. 25.
Features plot for the first arrhythmia.
Fig. 26.
Features plot for the second arrhythmia.
Fig. 27.
Features plot for the third arrhythmia.
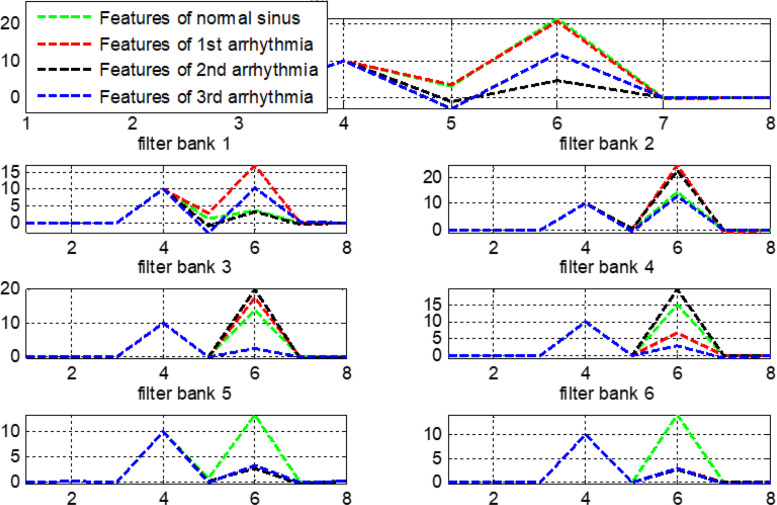
Fig. 28 compares features for all original signals and six filter banks. This comparison helps to make wise observations and to choose the most important features when training the our fuzzy system. In Fig. 28, note that features 4, 5, 6, and 7 provide a complete information about the original signals. Similarly, in filter bank 1, features 5, 6, and 7 give full information related to this bank.
Fig. 28.
Plot for features values of original signals and six filter banks.
Table 8 reports the details of all informative and valuable features. They are enough for intelligent training of the fuzzy system. Table 8, Table 9 show how each signal and its subsamples are related to the calculated statistical indicators. In addition, Figs. 24, 25, 26, 27, and 28, illustrate with plots this important stage of training. Regarding fuzzy rules, where IF-THEN statements are used, Section 3.2 presents all the details. In this last stage, the membership functions previously built and the participation of the human being are fundamental.
Table 8.
Intelligent selection of features for fuzzy rules design.
| Signal | Selected features |
|---|---|
| Original | 4, 5, 6, 7 |
| Filter bank 1 | 5, 6, 7 |
| Filter bank 2 | 6, 7 |
| Filter bank 3 | 4, 6 |
| Filter bank 4 | 5, 6, 7 |
| Filter bank 5 | 4, 6, 7 |
| Filter bank 6 | 4, 6 |
Table 9.
Information about different aspects of the data sets.
| Data set | Type of data | Total of | Total of | Intelligently selected |
|---|---|---|---|---|
| instances | calculated features | features for training | ||
| Normal status | One-dimension array | 36 | 8 | 4 |
| First arrhythmia | One-dimension array | 36 | 8 | 4 |
| Second arrhythmia | One-dimension array | 36 | 8 | 4 |
| Third arrhythmia | One-dimension array | 36 | 8 | 4 |
After calculating the features, intelligent selection of them for training purposes is a difficult and sensitive task. This selection is only possible by involving human intelligence when observing the calculated features.
Now, by analyzing the results of Fig. 24, Fig. 25, Fig. 26, Fig. 27, Fig. 28, different features, with maximum information and diversity, are chosen for original signals and all filter banks. The intelligent classification of different critical arrhythmia conditions of all the recorded signals is made employing a selection of calculated feature values.
A few important measures are taken for all filter banks to differentiate all four ECG signals. For all original and filter banks of signals, an intelligent selection of all calculated features is presented in Table 8. For example, observe that, by the magnitude of features of Fig. 28, filter bank 6 contains a complete information for features 4 and 6. These features are selected by using human intelligence from the calculated standard features for filter bank 6.
Note that features can be applied separately for all six FIR filters, which causes a high computational cost. We observe the features combined plot in Fig. 28 and choose the four filters that provided complete information. Thus, our results proved the accuracy at a meager computational cost. The information about the data sets (MIT-BIH arrhythmia) that were used, including the number of instances of each category (normal ECG signal, first arrhythmia ECG signal, second arrhythmia ECG signal, and third arrhythmia ECG signal), type of data, and total number of characteristics, among others, are described in Table 9.
3.2. System evaluation using rules and membership functions
The intelligent fuzzy system for critical arrhythmia detection is designed and evaluated using the following inputs, outputs, and rules:
-
(i)
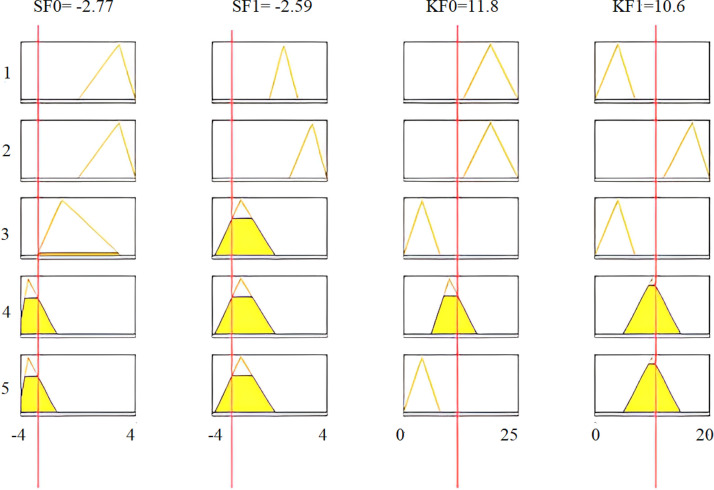
Human intelligence is applied to the space of features, where the input variables related to skewness (SF) and kurtosis (KF) features, denoted by SF0, KF0, SF1, and KF1, are selected intelligently from the space of calculated features. Note that SF0 and KF0 are the skewness and kurtosis feature variables of the original signal, respectively, whereas the variables SF1 and KF1 take the values of features for filtered outputs.
-
(ii)
Diagnosis of the critical arrhythmia condition is carried out, where four variables of output membership functions are selected. Observe that the first output membership function variable is chosen for normal condition patients, and the other three output membership function variables are defined for critical arrhythmia patients.
-
(iii)
Reduction of the complexity and computational burden of the proposed design is performed, where five rules are defined. In this way, we get high accuracy with fewer rules, and then an intelligent and heuristic understanding of calculated features is applied.
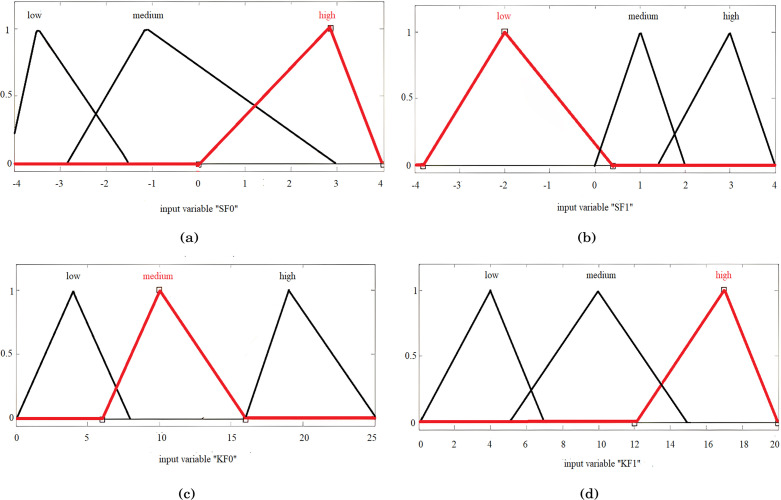
Fig. 29 shows the assignment of membership functions for input features SF0, KF0, SF1, and KF1. This figure also sketches four input features and three membership functions assigned to each input variable. Similarly, three membership functions are chosen for each output variable.
Fig. 29.
Assignment of membership functions to SF0 (a), SF1 (b), KF0 (c), and KF1 (d).
Human intelligence is involved in selecting training features that increase the proposed system’s accuracy and reduce the computational burden.
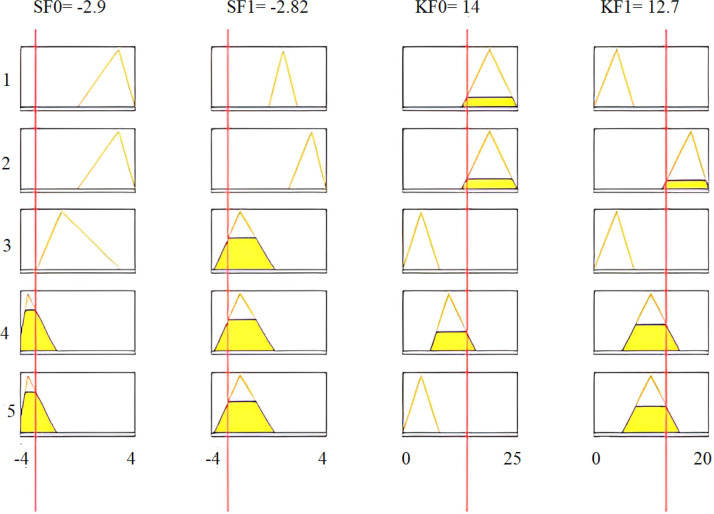
Inference rules using the AND operation are applied to the intelligent fuzzy system. Then, the performance of this system is evaluated under different conditions. The degree of membership of critical arrhythmia conditions is determined utilizing the AND operation, where four features are combined for each rule. To evaluate the accuracy of the fuzzy algorithm, the recorded ECG signal sample of a third arrhythmia patient is moved through all designed digital filters and then features SF0, SF1, KF0, and KF1 are calculated. Table 10 reports the intelligently selected features for the ECG signals of a third arrhythmia patient, with the following five rules being considered in this table:
Table 10.
Features calculation and selection for real-time implementation.
| Features for third arrhythmia signal | Calculated values |
|---|---|
| SF0 | −2.77 |
| SF1 | −2.59 |
| KF0 | 11.80 |
| KF1 | 10.60 |
-
(i)
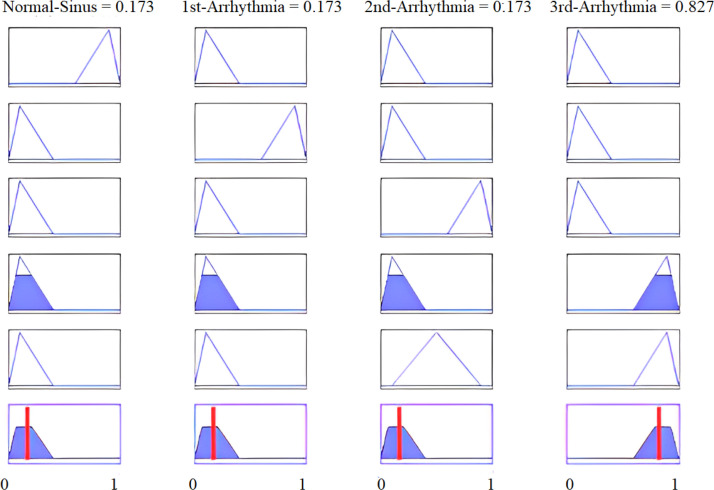
If (SF0 high) and (SF1 medium) and (KF1 low) and (KF0 high), then a normal signal is highly likely.
-
(ii)
If (SF0 high) and (SF1 high) and (KF1 high) and (KF0 high), then the first arrhythmia signal is highly likely.
-
(iii)
If (SF0 medium) and (SF1 low) and (KF1 low) and (KF0 low), then the second arrhythmia signal is highly likely.
-
(iv)
If (SF0 low) and (SF1 low) and (KF1 medium) and (KF0 medium), then the third arrhythmia signal is highly likely.
-
(v)
If (SF0 low) and (SF1 low) and (KF1 medium) and (KF0 low), then the second arrhythmia signal is likely, and the third arrhythmia signal is highly likely.
As the above rules (i)–(v) are established, evaluation and implementation of the proposed intelligent fuzzy system are made for a recorded ECG sample of a third arrhythmia signal from the MIT-BIH database.
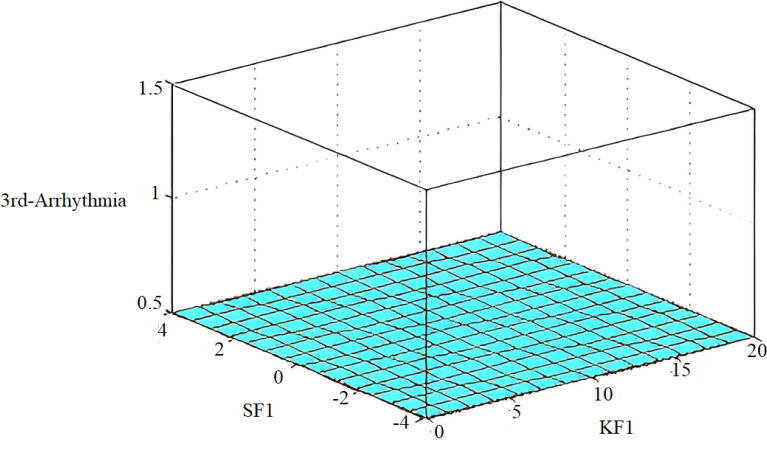
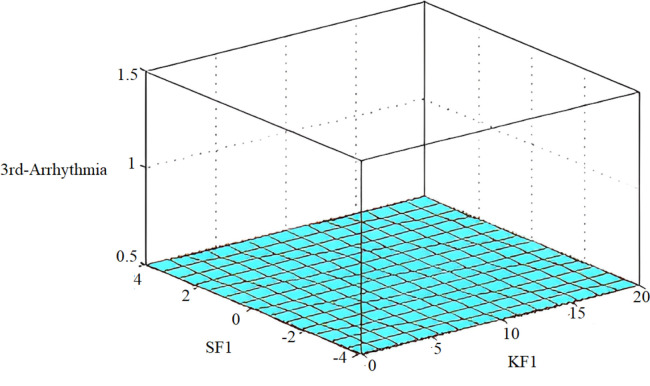
The implementation results are shown in Fig. 30, Fig. 31, while multi-dimensional subset decision surfaces are shown in Fig. 32, Fig. 33 for third arrhythmia signals against four selected features SF0, KF0, SF1, and KF1.
Fig. 30.
Features of the third arrhythmia signal as input.
Fig. 31.
Results of arrhythmia signals being highly likely.
Fig. 32.
Decision surface between SF1-SF0 (a) and SF0-KF0 (b).
Fig. 33.
Decision surface for diagnosis of arrhythmia patients between SF1 and KF1.
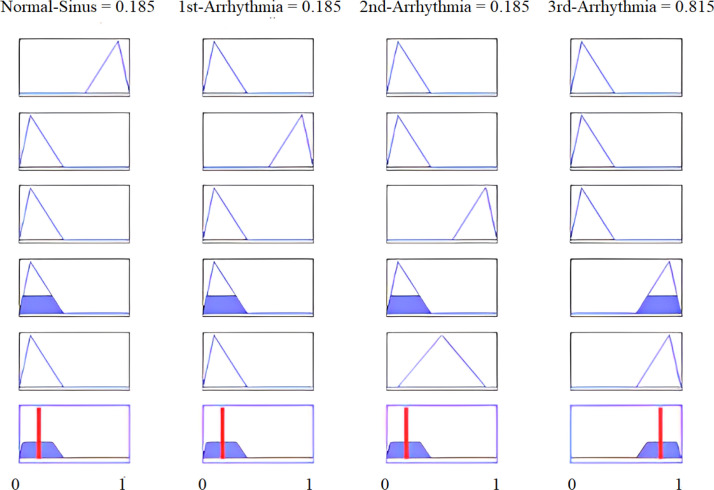
To illustrate the proposed methodology, numerical values of all four features are calculated for real-time data of a third arrhythmia signal as reported in Table 10. Fig. 30 shows that 4th and 5th rules are evaluated for feature SF0, with its calculated value of . The linguistic variable “low” defines the first membership function of input feature SF0 of our proposed fuzzy intelligent system as displayed in Fig. 29(a). If we see all five rules, only the fourth and fifth rules have the feature SF0 low, and are evaluated under AND operation. All defined rules are based on AND logic. Hence, these rules are evaluated only when all the conditions are true. For the particular case of Fig. 30, a total of eight rules are evaluated for all four features of Table 10. The MAX inference rule is then applied to get a unique and highest value at the output. Note that a third arrhythmia signal is highly likely for both the fourth and fifth rules. Defuzzification results are shown in Fig. 31.
The results presented next define the overall high accuracy of the proposed intelligent system. This system was also applied to different recorded samples of the same patients, where the proposed system was performed with total efficiency. Fig. 34 shows the last 1000 samples of third arrhythmia patients.
Fig. 34.
Last 1000 samples recorded for the third arrhythmia ECG signal.
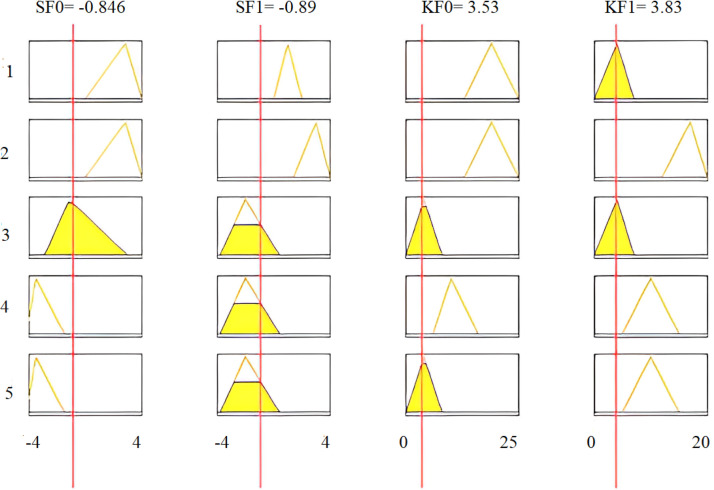
Features calculation and results from implementation for the last 1000 samples of third arrhythmia patients are presented in Fig. 35, Fig. 36, respectively.
Fig. 35.
Features of the last 1000 samples of the third arrhythmia patient as input.
Fig. 36.
Results of the third arrhythmia patient being highly likely for the last 1000 samples.
To add more comprehensive evaluations of the results, we have also considered different portions of the second arrhythmia patient. The resulting figures with the corresponding degree of membership are displayed below.
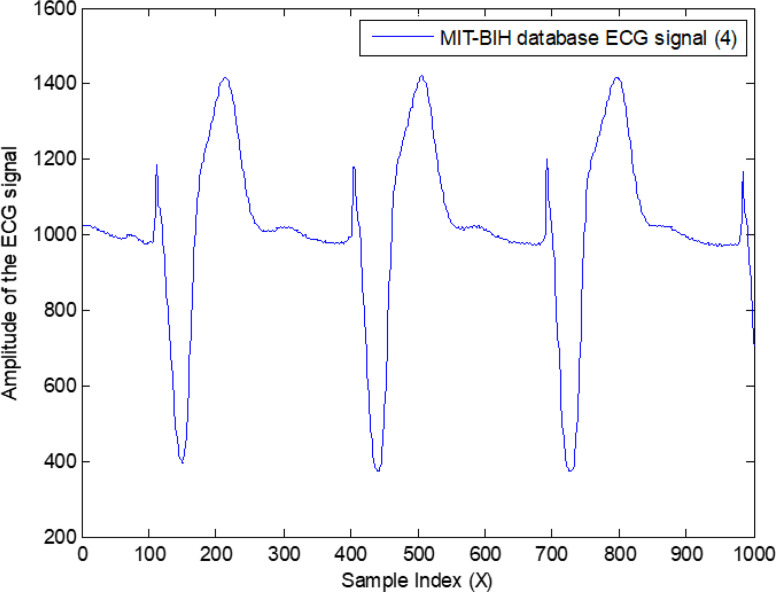
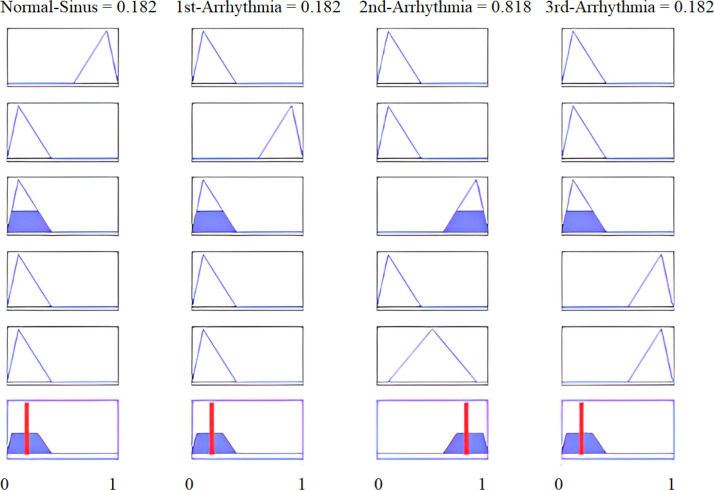
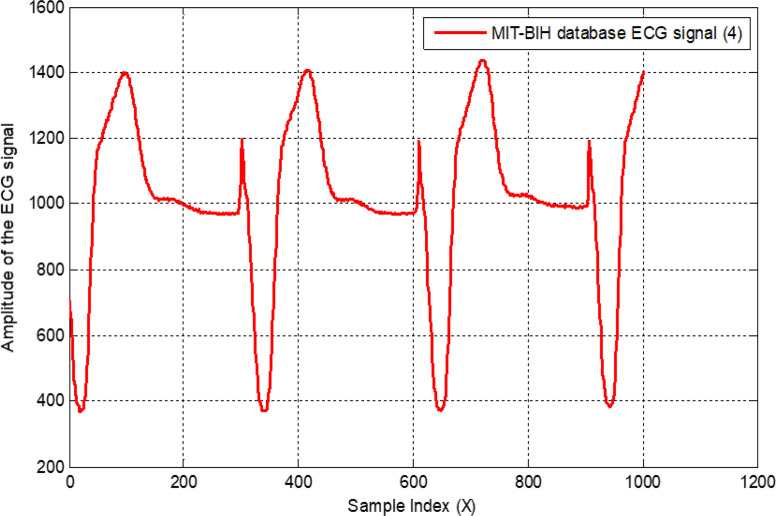
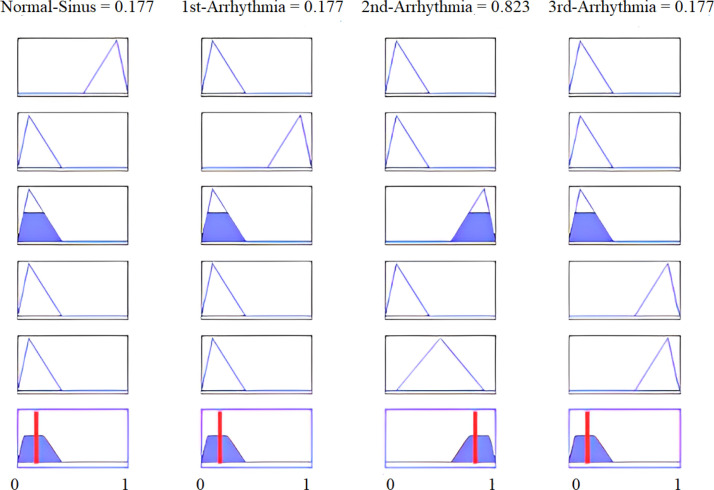
Calculated feature values of the last 1000 samples of the second arrhythmia patient as input are presented in Fig. 40. Fig. 37 shows the first 1000 samples of the second arrhythmia patient, and Fig. 38 provides the results where the second arrhythmia patient is highly likely for the first 1000 samples. Similarly, Fig. 39 sketches the last 1000 samples of the second arrhythmia patient.
Fig. 40.
Features values of the last 1000 samples of the second arrhythmia patient as input.
Fig. 37.
Results of the second arrhythmia patient for the first 1000 samples.
Fig. 38.
Results of the second arrhythmia patient being highly likely for first 1000 samples.
Fig. 39.
Results of the second arrhythmia patient for the last 1000 samples.
Fig. 41 provides the results where the second arrhythmia patient is also highly likely for the last 1000 samples. Analogously, for the second arrhythmia patient and the first 1000 samples, the value of highly likely was 0.818, while for the last 1000 samples, it increased to 0.823. Experiments were repeated 100 times to evaluate the algorithm’s accuracy, and each time we found reliable results, as reported by the comparison above. We can conclude that our system performs flawlessly.
Fig. 41.
Results of the second arrhythmia patient being highly likely for the last 1000 samples.
4. Conclusions
In this investigation, we have proposed an IoT-based intelligent health monitoring and diagnosis system for critical cardiac arrhythmia COVID-19 patients. Our system is divided into two parts: (i) IoT-based health monitoring/surveillance; and (ii) intelligent design based on a fuzzy diagnosis system. The intensive care of isolated COVID-19 patients with critical heart conditions is achieved by designing an autonomous intelligent feature based on fuzzy logic to detect critical arrhythmia conditions accurately.
The proposed intelligent system diagnoses different critical arrhythmia conditions for recording different samples of real-time ECG data. The results have proved the high accuracy of the proposed intelligent system in detecting critical conditions of third arrhythmia patients. Our intelligent algorithm has the advantage of its simple structure because it performs simple calculations. Its practical importance increases because no complex mathematics is involved in the algorithm’s design. Due to the reasons mentioned earlier, only a few resources and very little time is required to complete the detection process in real time, which minimizes its computational complexity and execution cost.
The proposed algorithm is beneficial for detecting QRS peaks of ECG data. Another advantage of the proposed algorithm is its ability to perform various analyses on ECG data. In a real-time implementation, our intelligent system has obtained satisfactory results for interpreting the critical variability of heartbeats. Due to all the above advantages, the practical importance of the proposed system is justified. This system is interfaced with low-cost microcontrollers to develop IoT-based intelligent monitoring for arrhythmia patients. The design of a fuzzy system in combination with an IoT-based methodology is helpful for doctors and intensive care personnel of critical COVID-19 patients with cardiac arrhythmia.
Declaration of Competing Interest
The authors declare that they have no known competing financial interests or personal relationships that could have appeared to influence the work reported in this paper.
Acknowledgments
The authors would also like to thank six reviewers for their constructive comments, which improved the presentation of this article. This research was supported and partially funded by FONDECYT grant number 1200525 (V. Leiva) from the National Agency for Research and Development (ANID) of the Chilean government under the Ministry of Science, Technology, Knowledge, and Innovation.
Data availability
The codes and data are available at request from the authors.
References
- 1.Hu R., Chen J., Zhou L. A transformer-based deep neural network for arrhythmia detection using continuous ECG signals. Comput. Biol. Med. 2022;144 doi: 10.1016/j.compbiomed.2022.105325. [DOI] [PubMed] [Google Scholar]
- 2.P.S. Hamilton, W.J. Tompkins, Adaptive matched filtering for QRS detection, in: Proceedings of the 10th Annual International Conference of the IEEE in Medicine and Biology Society, 1988, pp. 147–148.
- 3.Singh J.P., Larson M.G., O’Donnell C.J., Wilson P.F., Tsuji H., Lloyd-Jones D.M., Levy D. Association of hyperglycemia with reduced heart rate variability (The Framingham Heart Study) Am. J. Cardiol. 2000;86:309–312. doi: 10.1016/s0002-9149(00)00920-6. [DOI] [PubMed] [Google Scholar]
- 4.Forsström J., Forsström J., Heinonen E., Välimäki I., Antila K. Effects of haemodialysis on heart rate variability in chronic renal failure. Scand. J. Clin. Lab. Invest. 1986;46:665–670. doi: 10.3109/00365518609083729. [DOI] [PubMed] [Google Scholar]
- 5.Holsinger W.P., Kempner K.M., Miller M.H. A QRS preprocessor based on digital differentiation. IEEE Trans. Biomed. Eng. 1971;3:212–217. [Google Scholar]
- 6.Morizet-Mahoudeaux P., Moreau C., Moreau D., Quarante J.J. Simple microprocessor-based system for on-line ECG arrhythmia analysis. Med. Biol. Eng. Comput. 1981;19:497–500. doi: 10.1007/BF02441319. [DOI] [PubMed] [Google Scholar]
- 7.Fraden J., Neuman M.R. QRS wave detection. Med. Biol. Eng. Comput. 1980;18:125–132. doi: 10.1007/BF02443287. [DOI] [PubMed] [Google Scholar]
- 8.F. Zhang, Y. Lian, Electrocardiogram QRS detection using multiscale filtering based on mathematical morphology, in: Proceedings of the 29th Annual International Conference of the IEEE in Medicine and Biology Society, 2007, pp. 3196–3199. [DOI] [PubMed]
- 9.F. Zhang, Y. Lian, Novel QRS detection by CWT for ECG sensor, in: Proceedings of the 2007 IEEE Biomedical Circuits and Systems Conference, 2007, pp. 211–214.
- 10.Vidal C., Charnay P., Arce P. Proceedings of the 4th European Conference of the International Federation for Medical and Biological Engineering. Springer; Berlin, Heidelberg: 2009. Enhancement of a QRS detection algorithm based on the first derivative, using techniques of a QRS detector algorithm based on non-linear transformations; pp. 393–396. [Google Scholar]
- 11.Throne R.D., Jenkins J.M., Dicarlo L.A. A comparison of four new time-domain techniques for discriminating monomorphic ventricular tachycardia from sinus rhythm using ventricular waveform morphology. IEEE Trans. Biomed. Eng. 1991;38:561–570. doi: 10.1109/10.81581. [DOI] [PubMed] [Google Scholar]
- 12.Afonso V.X., Tompkins W.J., Nguyen T.Q., Luo S. ECG beat detection using filter banks. IEEE Trans. Biomed. Eng. 1999;46:192–202. doi: 10.1109/10.740882. [DOI] [PubMed] [Google Scholar]
- 13.Koski A. Modelling ECG signals with hidden Markov models. Artif. Intell. Med. 1996;8:453–471. doi: 10.1016/S0933-3657(96)00352-1. [DOI] [PubMed] [Google Scholar]
- 14.Benitez D., Gaydecki P.A., Zaidi A., Fitzpatrick A.P. The use of the Hilbert transform in ECG signal analysis. Comput. Biol. Med. 2001;31:399–406. doi: 10.1016/s0010-4825(01)00009-9. [DOI] [PubMed] [Google Scholar]
- 15.Laguna P., Jané R., Olmos S., Thakor N.V., Rix H., Caminal P. Adaptive estimation of QRS complex wave features of ECG signal by the Hermite model. Med. Biol. Eng. Comput. 1996;34:58–68. doi: 10.1007/BF02637023. [DOI] [PubMed] [Google Scholar]
- 16.Li C., Zheng C., Tai C. Detection of ECG characteristic points using wavelet transforms. IEEE Trans. Biomed. Eng. 1995;42:21–28. doi: 10.1109/10.362922. [DOI] [PubMed] [Google Scholar]
- 17.Meau Y.P., Ibrahim F., Narainasamy S.A., Omar R. Intelligent classification of electrocardiogram (ECG) signal using extended Kalman filter (EKF) based neuro fuzzy system. Comput. Methods Programs Biomed. 2006;82:157–168. doi: 10.1016/j.cmpb.2006.03.003. [DOI] [PubMed] [Google Scholar]
- 18.Hosseini H.G., Luo D., Reynolds K.J. The comparison of different feed forward neural network architectures for ECG signal diagnosis. Med. Eng. Phys. 2006;28:372–378. doi: 10.1016/j.medengphy.2005.06.006. [DOI] [PubMed] [Google Scholar]
- 19.De Silva C.W. CRC Press; Boca Raton, FL, USA: 2018. Intelligent Control: Fuzzy Logic Applications. [Google Scholar]
- 20.Alshammari O., Kchaou M., Jerbi H., Aoun S.B., Leiva V. A fuzzy design for a sliding mode observer-based control scheme of Takagi–Sugeno Markov jump systems under imperfect premise matching with bio-economic and industrial applications. Mathematics. 2022;10:3309. [Google Scholar]
- 21.Ali Z., Mahmood T., AlSalman H., Alkhamees B.F., Rahman S.M.M. Analysis of medical diagnosis based on variation coefficient similarity measures under picture hesitant fuzzy sets and their application. Math. Biosci. Eng. 2022;19:855–872. doi: 10.3934/mbe.2022039. [DOI] [PubMed] [Google Scholar]
- 22.Vlamou E., Papadopoulos B. Fuzzy logic systems and medical applications. AIMS Neurosci. 2019;6:266–272. doi: 10.3934/Neuroscience.2019.4.266. [DOI] [PMC free article] [PubMed] [Google Scholar]
- 23.Perumal K., Manohar M. In: Internet of Things: Novel Advances and Envisioned Applications. Acharjya D., Geetha M., editors. Springer; Cham, Switzerland: 2017. A survey on internet of things: Case studies, applications, and future directions; pp. 281–297. [Google Scholar]
- 24.Yang G., et al. A health-IoT platform based on the integration of intelligent packaging, unobtrusive bio-sensor, and intelligent medicine box. IEEE Trans. Ind. Inform. 2014;10:2180–2191. [Google Scholar]
- 25.P. Serikul, N. Nakpong, N. Nakjuatong, Smart farm monitoring via the Blynk IoT platform: Case study: Humidity monitoring and data recording, in: Proceedings of the 16th International Conference on ICT and Knowledge Engineering, 2018, pp. 1–6.
- 26.Sihombing P., Karina N.A., Tarigan J.T., Syarif M.I. Automated hydroponics nutrition plants systems using Arduino microcontroller based on android. J. Phys. 2018;978 [Google Scholar]
- 27.Alkady W., ElBahnasy K., Leiva V., Gad W. Classifying COVID-19 based on amino acids encoding with machine learning algorithms. Chemometr. Intell. Lab. Syst. 2022;224 doi: 10.1016/j.chemolab.2022.104535. [DOI] [PMC free article] [PubMed] [Google Scholar]
- 28.Martin-Barreiro C., Ramirez-Figueroa J.A., Cabezas X., Leiva V., Galindo-Villardón M.P. Disjoint and functional principal component analysis for infected cases and deaths due to COVID-19 in South American countries with sensor-related data. Sensors. 2021;21:4094. doi: 10.3390/s21124094. [DOI] [PMC free article] [PubMed] [Google Scholar]
- 29.Sardar I., Akbar M.A., Leiva V., Alsanad A., Mishra P. Machine learning and automatic ARIMA/Prophet models-based forecasting of COVID-19: Methodology, evaluation, and case study in SAARC countries. Stoch. Environ. Res. Risk Assess. 2023;34:345–359. doi: 10.1007/s00477-022-02307-x. [DOI] [PMC free article] [PubMed] [Google Scholar]
- 30.Mahdi E., Leiva V., Mara’Beh S., Martin-Barreiro C. A new approach to predicting cryptocurrency returns based on the gold prices with support vector machines during the COVID-19 pandemic using sensor-related data. Sensors. 2021;21:6319. doi: 10.3390/s21186319. [DOI] [PMC free article] [PubMed] [Google Scholar]
- 31.Chahuán-Jiménez K., Rubilar R., De La Fuente-Mella H., Leiva V. Breakpoint analysis for the COVID-19 pandemic and its effect on the stock markets. Entropy. 2021;23:100. doi: 10.3390/e23010100. [DOI] [PMC free article] [PubMed] [Google Scholar]
- 32.Jerez-Lillo N., Lagos-Álvarez B.L., Muñoz-Gutiérrez J., Figueroa-Zúñiga J.I., Leiva V. A statistical analysis for the epidemiological surveillance of COVID-19 in Chile. Signa Vitae. 2021;18:19–30. [Google Scholar]
- 33.Ospina R., Leite A., Ferraz C., Magalhães A., Leiva V. Data-driven tools for assessing and combating COVID-19 outbreaks in Brazil based on analytics and statistical methods. Signa Vitae. 2022;18:18–32. [Google Scholar]
- 34.Sajid M.R., Muhammad N., Zakaria R., Bukhari S.A.C. Modifiable risk factors and overall cardiovascular mortality: Moderation of urbanization. J. Public Health Res. 2020;9:410–416. doi: 10.4081/jphr.2020.1893. [DOI] [PMC free article] [PubMed] [Google Scholar]
- 35.Sajid M.R., Muhammad N., Zakaria R., Shahbaz A., Bukhari S.A.C., Kadry S., Suresh A. Nonclinical features in predictive modeling of cardiovascular diseases: A machine learning approach. Interdiscipl. Sci.: Comput. Life Sci. 2021;13:201–211. doi: 10.1007/s12539-021-00423-w. [DOI] [PubMed] [Google Scholar]
- 36.Hossain M.A., Kim J.H. Possibility as role of ginseng and ginsenosides on inhibiting the heart disease of COVID-19: A systematic review. J. Ginseng Res. 2022;46:321–330. doi: 10.1016/j.jgr.2022.01.003. [DOI] [PMC free article] [PubMed] [Google Scholar]
- 37.Sadad T., Bukhari S.A.C., Munir A., Ghani A., El-Sherbeeny A.M., Rauf H.T. Detection of cardiovascular disease based on PPG signals using machine learning with cloud computing. Comput. Intell. Neurosci. 2022;2022 doi: 10.1155/2022/1672677. [DOI] [PMC free article] [PubMed] [Google Scholar]
- 38.Taylan O., Alkabaa A.S., Alqabbaa H.S., Pamukcu E., Leiva V. Early prediction in classification of cardiovascular diseases with machine learning, neuro-fuzzy and statistical methods. Biology. 2023;12 doi: 10.3390/biology12010117. [DOI] [PMC free article] [PubMed] [Google Scholar]
- 39.Guk K., Han G., Lim J., Jeong K., Kang T., Lim E.K., Jung J. Evolution of wearable devices with real-time disease monitoring for personalized healthcare. Nanomaterials. 2019;9:813. doi: 10.3390/nano9060813. [DOI] [PMC free article] [PubMed] [Google Scholar]
- 40.Manas M., Sinha A., Sharma S., Mahboob M.R. A novel approach for IoT based wearable health monitoring and messaging system. J. Ambient Intell. Humaniz. Comput. 2019;10:2817–2828. [Google Scholar]
- 41.Khan M.M., Mehnaz S., Shaha A., Nayem M., Bourouis S. IoT-based smart health monitoring system for COVID-19 patients. Comput. Math. Methods Med. 2021;2021 doi: 10.1155/2021/8591036. [DOI] [PMC free article] [PubMed] [Google Scholar] [Retracted]
- 42.J.P. Queralta, T.N. Gia, H. Tenhunen, T. Westerlund, Edge-AI in LoRa-based health monitoring: Fall detection system with fog computing and LSTM recurrent neural networks, in: Proceedings of the 4th International Conference on Telecommunications and Signal Processing, 2019, pp. 601–604.
- 43.Bhardwaj V., Joshi R., Gaur A.M. IoT-based smart health monitoring system for COVID-19. SN Comput. Sci. 2022;3:137. doi: 10.1007/s42979-022-01015-1. [DOI] [PMC free article] [PubMed] [Google Scholar]
- 44.U. Dampage, C. Balasuriya, S. Thilakarathna, D. Rathnayaka, L. Kalubowila, AI-based heart monitoring system, in: Proceedings of the 4th International Conference on Computing, Power and Communication Technologies, 2021, pp. 1–6.
- 45.A. Škraba, A. Koložvari, D. Kofjač, R. Stojanović, V. Stanovov, E. Semenkin, Prototype of group heart rate monitoring with NodeMCU ESP8266, in: Proceedings of the 6th Mediterranean Conference on Embedded Computing, 2017, pp. 1–4.
- 46.Selesnick I.W., Burrus C.S. Generalized digital Butterworth filter design. IEEE Trans. Signal Process. 1998;46:1688–1694. [Google Scholar]
- 47.Xue D. de Gruyter; 2020. MATLAB Programming: Mathematical Problem Solutions. [Google Scholar]
- 48.Ruschitzka F., Abraham W.T., Singh J.P., et al. Cardiac-resynchronization therapy in heart failure with a narrow QRS complex. N. Engl. J. Med. 2013;369:1395–1405. doi: 10.1056/NEJMoa1306687. [DOI] [PubMed] [Google Scholar]
- 49.Qaisar S.M., Hussain S.F. An effective arrhythmia classification via ECG signal subsampling and mutual information based subbands statistical features selection. J. Ambient Intell. Humaniz. Comput. 2023 doi: 10.1007/s12652-021-03275-w. in press. [DOI] [Google Scholar]
- 50.Xun L., Zheng G. ECG signal feature selection for emotion recognition. TELKOMNIKA Indonesian J. Electr. Eng. 2013;11:1363–1370. [Google Scholar]
- 51.Quackenbush J. Microarray data normalization and transformation. Nature Genet. 2002;32:496–501. doi: 10.1038/ng1032. [DOI] [PubMed] [Google Scholar]
Associated Data
This section collects any data citations, data availability statements, or supplementary materials included in this article.
Data Availability Statement
The codes and data are available at request from the authors.


