

Abstract
OBJECTIVE:
We sought to determine whether small-for-gestational age (SGA) and large-for-gestational age (LGA) birthweights increase autism risk.
STUDY DESIGN:
This was a retrospective cohort analysis comparing children with autism (n = 20,206) within a birth cohort (n = 5,979,605). Stratification by sex and birthweight percentile (SGA, <5th or 5–10th percentile; appropriate size for gestational age [GA], >10th to <90th percentile; LGA, either 90–95th or >95th percentile) preceded Cochran-Mantel-Haenszel analysis for GA effect, and multivariate analysis.
RESULTS:
Autism risk was increased in preterm SGA (<5th percentile) infants 23–31 weeks (adjusted odds ratio [aOR], 1.60; 95% confidence interval [CI], 1.09–2.35) and 32–33 weeks (aOR, 1.83; 95% CI, 1.16–2.87), and term LGA (>95th percentile) infants 39–41 weeks (aOR, 1.16; 95% CI, 1.08–1.26), but was decreased in preterm LGA infants 23–31 weeks (aOR, 0.45; 95% CI, 0.21–0.95).
CONCLUSION:
SGA was associated with autism in preterm infants, while LGA demonstrated dichotomous risk by GA, with increased risk at term, and decreased risk in the premature infants. These findings likely reflect disparate pathophysiologies, and should influence prenatal counseling, pediatric autism screening, and further autism research.
Keywords: autism, intrauterine growth restriction, large for gestational age, small for gestational age
Autism is a neurodevelopmental disorder involving impaired communication skills, limited social interactions, restricted interests, and stereotypical behaviors. Autism is often associated with abnormalities in cognitive functioning, learning, attention, and sensory processing,1,2 and typically presents in early childhood. The autism spectrum disorders are considered to be a significant public health issue, affecting 0.9% of US children.3
Despite increased public awareness and research efforts, the etiology of autism remains largely uncertain. Based on the myriad of genetic, environmental, perinatal, and immunologic associations to date, it is likely that either there is a multifactorial causal pathway (eg, an underlying genetic susceptibility triggered by an exogenous stressor)4,5 or that autism is the common end point of multiple causal pathways.2 Adverse perinatal conditions are common targets of inquiry, and several conditions, including prematurity5–10 and low birthweight (BW)7,11–14 have been associated with the later development of autism.
Prior analyses evaluated the role of abnormal BW percentiles, with conflicting results. A recent comprehensive meta-analysis of perinatal and neonatal risk factors for autism reported that small-for-gestational age (SGA) but not large-for-gestational age (LGA) BW were significantly associated with autism.12 Within a Swedish case-control study, LGA BW were associated with increased rates of autism (odds ratio [OR], 1.7; 95% confidence interval [CI], 1.0–2.7).14 An analysis of autism risk by BW appropriateness stratified by gestational age (GA) at birth has not been published. It is conceivable that the combination of intrauterine and postnatal stressors associated with growth restriction and prematurity, or alternately fetal overgrowth met with placental senescence at term, may be more detrimental to neurodevelopment than anticipated. The goal of this analysis was to determine whether SGA or LGA infants are at increased risk for autism relative to appropriate-for-GA infants, and whether the association differs by GA at birth.
Materials and Methods
This was a population-based cohort study, approved by the California Protection of Human Subjects Committee; the Office of Statewide Health Planning and Development (OSHPD); and the University of California, Davis Human Subjects Committee.
We utilized a database constructed by our group in 2007 to evaluate perinatal risk factors for developmental disabilities. An 11-year birth cohort (Jan. 1, 1991, through Dec. 31, 2001) was identified within a database provided by the California OSHPD, which had previously merged birth records from the Linked Vital Statistics Birth and Infant Death File published by the California Department of Health Services with maternal and infant hospital discharge records from the entire state. The analysis was limited to infants who survived to 1 year of age, without exclusion of children with comorbid congenital or neurodevelopmental abnormalities. This database provided perinatal data that was collected prospectively (at the time of hospital discharge, and filing of birth certificate data), such as maternal demographics and comorbidities, prenatal care, delivery type, and infant BW and GA at delivery. We then identified children with autism within the California Department of Disabilities database who were born in California from Jan. 1, 1991, through Dec. 31, 2001, and linked their information to the maternal and infant birth records within the OSHPD/Department of Health Services files using linkage analysis. The overall rate of successful linkage was 85%, with a range of 81% (in 1991) to 90% (in 2001).
In the current analysis, the predictive variable was defined as BW appropriateness for GA. All births in the cohort were separated by year of birth and sex, and were then assigned to a GA group based on completed weeks of gestation at the time of birth. Regarding determination of GA, the basis for dating criteria was not a variable included within the California OSHPD administrative birth files. For each year, we calculated the threshold values for male and female BW appropriateness by GA within the annual birth cohort (at the 5th, 10th, 90th, and 95th BW percentiles). Each birth according to sex and year was identified as SGA (either <5th or 5–10th percentile), appropriate for GA (>10th to <90th percentile), or LGA (either 90–95th or >95th percentile). Annualized BW percentile thresholds for each GA were tabulated and averaged for descriptive purposes (Table 1). Trend tests demonstrated no significant time trend in percentile thresholds over the 1991 through 2001 time period.
TABLE 1.
Birthweight percentiles by gestational age at birth
| Sex | Birthweight percentile | |||
|---|---|---|---|---|
| 5th | 10th | 90th | 95th | |
| Birthweight, g | ||||
| Male | ||||
| Gestational age | ||||
| 23 | 539 | 569 | 1147 | 1302 |
| 24 | 543 | 599 | 1138 | 1289 |
| 25 | 587 | 648 | 1236 | 1447 |
| 26 | 633 | 712 | 1431 | 1655 |
| 27 | 695 | 779 | 1622 | 1892 |
| 28 | 774 | 875 | 1886 | 2168 |
| 29 | 865 | 967 | 2262 | 2505 |
| 30 | 963 | 1105 | 2642 | 2828 |
| 31 | 1118 | 1278 | 2960 | 3107 |
| 32 | 1319 | 1502 | 3208 | 3346 |
| 33 | 1532 | 1735 | 3412 | 3557 |
| 34 | 1765 | 1964 | 3585 | 3747 |
| 35 | 1994 | 2188 | 3722 | 3931 |
| 36 | 2193 | 2380 | 3755 | 3977 |
| 37 | 2411 | 2602 | 3844 | 4055 |
| 38 | 2630 | 2797 | 3962 | 4157 |
| 39 | 2772 | 2934 | 4080 | 4267 |
| 40 | 2853 | 3021 | 4174 | 4360 |
| 41 | 2888 | 3060 | 4249 | 4438 |
| 42 | 2838 | 3016 | 4240 | 4433 |
| 43 | 2807 | 2984 | 4180 | 4376 |
| Female | ||||
| Gestational age | ||||
| 23 | 491 | 520 | 1130 | 1253 |
| 24 | 523 | 547 | 1110 | 1263 |
| 25 | 558 | 600 | 1181 | 1405 |
| 26 | 596 | 656 | 1325 | 1593 |
| 27 | 652 | 723 | 1600 | 1915 |
| 28 | 687 | 795 | 1908 | 2189 |
| 29 | 800 | 913 | 2322 | 2534 |
| 30 | 933 | 1063 | 2679 | 2849 |
| 31 | 1065 | 1221 | 2987 | 3124 |
| 32 | 1219 | 1411 | 3186 | 3339 |
| 33 | 1451 | 1643 | 3373 | 3526 |
| 34 | 1677 | 1873 | 3521 | 3697 |
| 35 | 1891 | 2089 | 3627 | 3837 |
| 36 | 2091 | 2287 | 3655 | 3871 |
| 37 | 2320 | 2500 | 3725 | 3928 |
| 38 | 2530 | 2700 | 3827 | 4017 |
| 39 | 2681 | 2829 | 3925 | 4111 |
| 40 | 2762 | 2913 | 4015 | 4194 |
| 41 | 2790 | 2951 | 4084 | 4267 |
| 42 | 2758 | 2918 | 4081 | 4269 |
| 43 | 2724 | 2883 | 4041 | 4233 |
For each year within the 1991–2001 birth cohort, annual birthweight percentiles were calculated and used to determine birthweight appropriateness for children born within that year. The analysis included children who survived to 1 year of age. Gestational age refers to completed gestational age at birth (23w1d = 23 weeks).
Moore. Autism risk by birthweight percentile. Am J Obstet Gynecol 2012.
The outcome of the current analysis was a diagnosis of autism. Within California, 75–80% of children with autism are followed up by the California Department of Developmental Services (DDS),15 which provides services for people with autism, epilepsy, cerebral palsy, and mental retardation, without regard for income. The Client Development Evaluation Report (CDER) database held by DDS was utilized to identify cases of autism by: (1) an autistic level of “one” (full syndrome autism) on any CDER report; or (2) an International Classification of Diseases, Ninth Revision (ICD-9) code of 299.0 (autistic disorder), 299.8, or 299.9.16 As specific autism ICD-9 codes were not routinely included in the CDER during the time period queried, we do not have precise information regarding the number of cases of each autism spectrum disorder included without our cohort. We suspect that the majority of cases were autistic disorder, which is the only autism spectrum disorder eligible for services through DDS, in the absence of significant disability. While autism is typically diagnosed by age 3 years, the analysis included cases identified by DDS through Nov. 30, 2006, at which time the youngest member of our cohort was 4 years and 11 months old,17 leaving time for most of the children with a delayed diagnosis to be included in the analysis.
To estimate the strength of association between BW percentile and autism, OR was calculated with 95% CI. A multivariate logistic regression analysis was designed to account for perinatal risk factors previously associated with both BW percentiles extremes (SGA or LGA) and autism. We screened covariates for association with BW percentile (either SGA or LGA) using previously published studies, and confirmed an association with autism through the univariate analysis, using a 95%CI entirely >1.0 or <1.0 as a threshold for inclusion. We included chronic hypertension (, Clinical Modification [ICD-9-CM] 642.0–642.2, 642.7),14,18,19 preeclampsia (ICD-9-CM 642.5),20,21 maternal diabetes (ICD-9-CM 250, 648.0, 648.8),22–24 maternal age,15,25,26 twin gestation (ICD-9-CM 651.0),15,27–29 birth order (derived from maternal parity),15,26,30–32 race,33–35 and interpregnancy interval (derived from a search for previous deliveries in mothers with a parity >0).36,37
To determine whether GA at birth influenced the association between autism risk and BW appropriateness, the analysis was stratified by GA: very preterm 23–27 weeks 6 days and 28–31 weeks 6 days; midpreterm 32–33 weeks 6 days; late preterm 34–36 weeks 6 days; early term 37–38 weeks 6 days; term 39–41 weeks 6 days; and postdates >42 weeks. Effect modification was ascertained for GA strata using a Cochran-Mantel-Haenszel test for difference of OR without a continuity correction.
Results
Within the cohort of 5,979,605 children born in California from 1991 through 2001, 21,717 children with autism were identified. The remainder of the birth cohort served as the control group (n = 5,957,888). Male sex, advanced maternal and paternal ages, Asian race, chronic hypertension, preeclampsia, any form of diabetes, high birth order (≥3), short interpregnancy interval, and twin gestations were significantly associated with autism (Table 2).
TABLE 2.
Demographic data of the 1991–2001 California birth cohort according to autism status
| Variable | No autism |
Autism |
Analysis |
|||
|---|---|---|---|---|---|---|
| Deliveries, n | % | Deliveries, n | % | OR | 95% CI | |
|
| ||||||
| Total | 5,957,888 | 21,717 | ||||
|
| ||||||
| Sex of child | ||||||
|
| ||||||
| Male | 3,040,131 | 51 | 18011 | 83 | 4.66 | 4.50–4.84 |
|
| ||||||
| Female | 2,917,757 | 49 | 3706 | 17 | 1.00 | Reference |
|
| ||||||
| Age of mother | ||||||
|
| ||||||
| ≤20 | 960,822 | 16 | 1753 | 8 | 0.77 | 0.68–0.86 |
|
| ||||||
| 21–25 | 1,499,201 | 25 | 4263 | 20 | 1.00 | Reference |
|
| ||||||
| 26–30 | 1,633,158 | 27 | 6081 | 28 | 1.28 | 1.21–1.36 |
|
| ||||||
| 30–35 | 1,242,483 | 21 | 5927 | 27 | 1.67 | 1.57–1.77 |
|
| ||||||
| 35–40 | 530,653 | 9 | 3107 | 14 | 2.02 | 1.89–2.16 |
|
| ||||||
| ≥41 | 90,664 | 2 | 583 | 3 | 2.15 | 1.91–2.43 |
|
| ||||||
| Age of father | ||||||
|
| ||||||
| ≤20 | 408,807 | 7 | 668 | 3 | 0.73 | 0.61–0.87 |
|
| ||||||
| 21–25 | 1,149,714 | 19 | 2838 | 13 | 1.00 | Reference |
|
| ||||||
| 26–30 | 1,480,484 | 25 | 4958 | 23 | 1.30 | 1.21–1.39 |
|
| ||||||
| 30–35 | 1,339,188 | 22 | 5741 | 26 | 1.63 | 1.52–1.74 |
|
| ||||||
| 35–40 | 757,722 | 13 | 3953 | 18 | 1.98 | 1.84–2.12 |
|
| ||||||
| ≥41 | 408,036 | 7 | 2449 | 11 | 2.29 | 2.12–2.48 |
|
| ||||||
| Maternal race/ethnicity | ||||||
|
| ||||||
| Non-hispanic white | 2,082,149 | 35 | 8789 | 40 | 1.00 | Reference |
|
| ||||||
| African American | 421,764 | 7 | 1764 | 8 | 1.02 | 0.95–1.10 |
|
| ||||||
| Hispanic | 2,759,541 | 46 | 7809 | 36 | 0.69 | 0.66–0.73 |
|
| ||||||
| Asian | 593,146 | 10 | 3049 | 14 | 1.33 | 1.25–1.41 |
|
| ||||||
| Other race | 75,398 | 1 | 206 | 1 | 0.69 | 0.57–0.84 |
|
| ||||||
| Chronic hypertension | ||||||
|
| ||||||
| No | 5,919,730 | 99 | 21516 | 99 | 1.00 | Reference |
|
| ||||||
| Yes | 38,158 | 1 | 201 | 1 | 1.45 | 1.26–1.67 |
|
| ||||||
| Preeclampsia | ||||||
|
| ||||||
| No | 5,700,487 | 96 | 20468 | 94 | 1.00 | Reference |
|
| ||||||
| Yes | 257,401 | 4 | 1249 | 6 | 1.42 | 1.29–1.57 |
|
| ||||||
| Diabetes (any) | ||||||
|
| ||||||
| No | 5,747,210 | 96 | 20624 | 95 | 1.00 | Reference |
|
| ||||||
| Yes | 210,678 | 4 | 1093 | 5 | 1.42 | 1.34–1.52 |
|
| ||||||
| Parity | ||||||
|
| ||||||
| Unknown | 8,336 | <1 | 23 | 28 | 0.14 | 0.01–1.50 |
|
| ||||||
| Nulliparous | 2,314,526 | 39 | 9194 | 42 | 1.00 | Reference |
|
| ||||||
| 1 | 1,851,911 | 31 | 7810 | 36 | 0.29 | 0.04–2.04 |
|
| ||||||
| 2 | 1,003,761 | 17 | 2937 | 14 | 0.20 | 0.03–1.41 |
|
| ||||||
| 3 | 440,443 | 7 | 1087 | 5 | 0.15 | 0.02–1.08 |
|
| ||||||
| 4 | 181,708 | 3 | 370 | 2 | 0.13 | 0.02–0.93 |
|
| ||||||
| ≥5 | 157,203 | 3 | 296 | 1 | 0.13 | 0.02–0.91 |
|
| ||||||
| Birth order | ||||||
|
| ||||||
| Unknown | 772,322 | 13 | 3185 | 41 | 1.16 | 1.11–1.20 |
|
| ||||||
| 1 | 5,162,747 | 87 | 18,414 | 36 | 1.00 | Reference |
|
| ||||||
| 2 | 22,466 | <1 | 114 | 5 | 1.4 | 1.18–1.71 |
|
| ||||||
| ≥3 | 353 | <1 | 4 | 11 | 3.18 | 1.19–8.52 |
|
| ||||||
| Multiple gestation | ||||||
|
| ||||||
| No | 5,882,776 | 99 | 21234 | 98 | 1.00 | Reference |
|
| ||||||
| Yes | 75,112 | 1 | 483 | 2 | 1.81 | 1.65–1.98 |
|
| ||||||
| Months since last live birth | ||||||
|
| ||||||
| Unknown | 2,721,666 | 46 | 10992 | 51 | 1.5 | 1.39–1.61 |
|
| ||||||
| 0–1.5 y | 367,914 | 6 | 1673 | 8 | 1.70 | 1.60–1.81 |
|
| ||||||
| 1.5–2.5 y | 796,301 | 13 | 3310 | 15 | 1.53 | 1.45–1.62 |
|
| ||||||
| 2.5–4 y | 850,760 | 14 | 2328 | 11 | 1.00 | Reference |
|
| ||||||
| 4–6 y | 604,500 | 10 | 1383 | 6 | 0.82 | 0.76–0.88 |
|
| ||||||
| ≥6 y | 616,747 | 10 | 2031 | 9 | 1.19 | 1.12–1.26 |
|
| ||||||
| Birthweight percentile | ||||||
|
| ||||||
| Unknown | 436,800 | 7 | 1516 | 7 | 0.97 | 0.92–1.02 |
|
| ||||||
| <5% | 260,587 | 4 | 1090 | 5 | 1.17 | 1.10–1.24 |
|
| ||||||
| 5–10% | 280,316 | 5 | 1070 | 5 | 1.07 | 1.00–1.13 |
|
| ||||||
| >10 to <90% | 4,414,624 | 74 | 15828 | 73 | 1.00 | Reference |
|
| ||||||
| 90–95% | 290,242 | 5 | 1083 | 5 | 1.04 | 0.98–1.11 |
|
| ||||||
| >95% | 275,319 | 5 | 1130 | 5 | 1.15 | 1.08–1.22 |
Data includes only infants that survived to 1 year of age.
CI, confidence interval; OR, unadjusted odds ratio.
Moore. Autism risk by birthweightpercentile. Am J Obstet Gynecol 2012.
Within the entire population, autism risk was significantly higher at BW percentile extremes, with a ~10% increase in autism risk in the SGA (<5th percentile) and LGA (>95th percentile) groups. The trend toward increased autism risk was also seen at both the 5–10th percentile and 90–95th percentile BW groups, although the results did not reach significance (Table 3).
TABLE 3.
Autism risk by birthweight percentile after multivariate analysis
| Variable | aOR | 95% CI | 95% Wald | |
|---|---|---|---|---|
|
| ||||
| Birthweight percentile | ||||
| <5% | 1.10 | 1.04–1.18 | 1.04 | 1.18 |
| 5–10% | 1.04 | 0.98–1.11 | 0.98 | 1.11 |
| >10 to <90% | 1.00 | Reference | ||
| 90–95% | 1.04 | 0.97–1.10 | 0.97 | 1.10 |
| >95% | 1.12 | 1.05–1.19 | 1.05 | 1.19 |
| Multivariate analysis | ||||
| Maternal preeclampsia | 1.11 | 0.95–1.29 | 0.95 | 1.29 |
| Maternal hypertension | 1.09 | 0.95–1.25 | 0.95 | 1.25 |
| Maternal diabetes | 1.22 | 1.15–1.30 | 1.15 | 1.30 |
| Maternal age | ||||
| ≤20 | 0.58 | 0.55–0.61 | 0.55 | 0.61 |
| 21–25 | 1.00 | Reference | ||
| 26–30 | 1.3 5 | 1.30–1.40 | 1.30 | 1.40 |
| 30–35 | 1.76 | 1.69–1.83 | 1.69 | 1.83 |
| 35–40 | 2.19 | 2.09–2.30 | 2.09 | 2.30 |
| ≥41 | 2.42 | 2.22–2.65 | 2.22 | 2.65 |
| Twin gestation | 1.56 | 1.41–1.73 | 1.41 | 1.73 |
| Birth order | ||||
| 1 | 1.0 | Referenee; | ||
| 2 | 0.62 | 0.50–0.76 | 0.50 | 0.76 |
| ≥3 | 1.13 | 0.42–3.05 | 0.44 | 3.19 |
| Unknown | 1.18 | 1.14–1.23 | 1.14 | 1.23 |
| Race | ||||
| Non-hispanic white | 1.00 | Reference | Reference | |
| Hispanic | 0.83 | 0.80–0.86 | 0.80 | 0.86 |
| African American | 1.19 | 1.13–1.25 | 1.13 | 1.25 |
| Asian | 1.15 | 1. 10–1. 19 | 1. 10 | 1. 19 |
| Other | 0.72 | 0.63–0.83 | 0.63 | 0.83 |
| Time since last live birth | ||||
| Missing | 1.74 | 1.67–1.82 | 1.67 | 1.82 |
| 0–1 5 y | 1.89 | 1.78–2.02 | 1.78 | 2.02 |
| 1.5–2.5 y | 1.60 | 1.52–1.69 | 1.52 | 1.69 |
| 2.5–4 y | 1.00 | Reference | Reference | |
| 4–6 y | 0.81 | 0.75–0.86 | 0.75 | 0.86 |
| ≥6 y | 0.99 | 0.94–1.06 | 0 94 | 1.06 |
aOR, adjusted odds ratio; CI, confidence interval.
Moore. Autism risk by birthweight percentile. Am J Obstet Gynecol 2012.
After stratification by GA at birth, the test for difference of OR among different GA groups was significant (P <.001). The association between BW appropriateness and autism reached significance in the 23- to 31-week and 32- to 33-week GA groups. While an association between SGA (<5th percentile) and autism was noted in all GA strata, the effect reached significance only in infants born <34 weeks (23–31 weeks: adjusted OR, 1.60; 95% CI, 1.09–2.35; and 32–33 weeks: adjusted OR, 1.83; 95% CI, 1.16–2.87) (Table 4 and Figure). The risk for autism with an LGA BW depended on GA at birth. Above 37 weeks, there was a positive correlation between LGA BW and autism, significant in the 39-to 41-weekgroup, where LGA BW (>95th percentile) was associated with a 16% increase in autism risk. The effect was protective however, in the setting of prematurity (23–31 weeks), where LGA BW (90–95th or >95th percentile) was associated with a 51% and 55% reduction, respectively, in autism risk (Table 4). The number of children in each BW percentile and GA strata is outlined by autism status in Table 5.
TABLE 4.
Autism risk by gestational age and birthweight percentile
| Gestational age groups | All (23–43 wks) | 23–31 wks | 32–33 wks | 34–36 wks | 37–38 wks | 39–41 wks | ≥42 wks | |||||||
|---|---|---|---|---|---|---|---|---|---|---|---|---|---|---|
| aOR | 95% CI | aOR | 95% CI | aOR | 95% CI | aOR | 95% CI | aOR | 95% CI | aOR | 95% CI | aOR | 95% CI | |
|
| ||||||||||||||
| Birthweight percentile | ||||||||||||||
|
| ||||||||||||||
| SGA: <5% | 1.10 | 1.04–1.18 | 1.60 | 1.09–2.35 | 1.83 | 1.16–2.87 | 1.07 | 0.86–1.34 | 1.10 | 0.97–1.25 | 1.09 | 1.00–1.18 | 1.24 | 0.98–1.58 |
|
| ||||||||||||||
| SGA: 5–10% | 1.04 | 0.98–1.11 | 1.36 | 0.91–2.02 | 1.00 | 0.57–1.78 | 1.12 | 0.91–1.38 | 1.01 | 0.89–1.15 | 1.03 | 0.95–1.12 | 1.17 | 0.92–1.48 |
|
| ||||||||||||||
| AGA: >10 to <90% | 1.00 | Reference | 1.00 | Reference | 1.00 | Reference | 1.00 | Reference | 1.00 | Reference | 1.00 | Reference | 1.00 | Reference |
|
| ||||||||||||||
| LGA: 90–95% | 1.04 | 0.97–1.10 | 0.49 | 0.25–0.95 | 0.56 | 0.25–1.26 | 1.04 | 0.84–1.30 | 0.98 | 0.86–1.11 | 1.07 | 0.99–1.16 | 1.16 | 0.92–1.46 |
|
| ||||||||||||||
| LGA: >95% | 1.12 | 1.05–1.18 | 0.45 | 0.21–0.95 | 1.00 | 0.52–1.89 | 0.97 | 0.77–1.22 | 1.10 | 0.97–1.24 | 1.16 | 1.08–1.26 | 1.11 | 0.88–1.41 |
The odds ratios were adjusted for maternal age, race, hypertension, preeclampsia, diabetes, birth order, twin gestation, and months since last live birth. The analysis included infants that survived to 1 year of age. 95% confidence internals (CIs) and adjusted odds ratios (aOR) are reported.
AGA, appropriate-for-gestational age; LGA, large-for-gestational age; SGA, small-for-gestational age.
Moore. Autism risk by birthweight percentile. Am J Obstet Gynecol 2012.
FIGURE. Autism risk by birthweight percentile and gestational age.
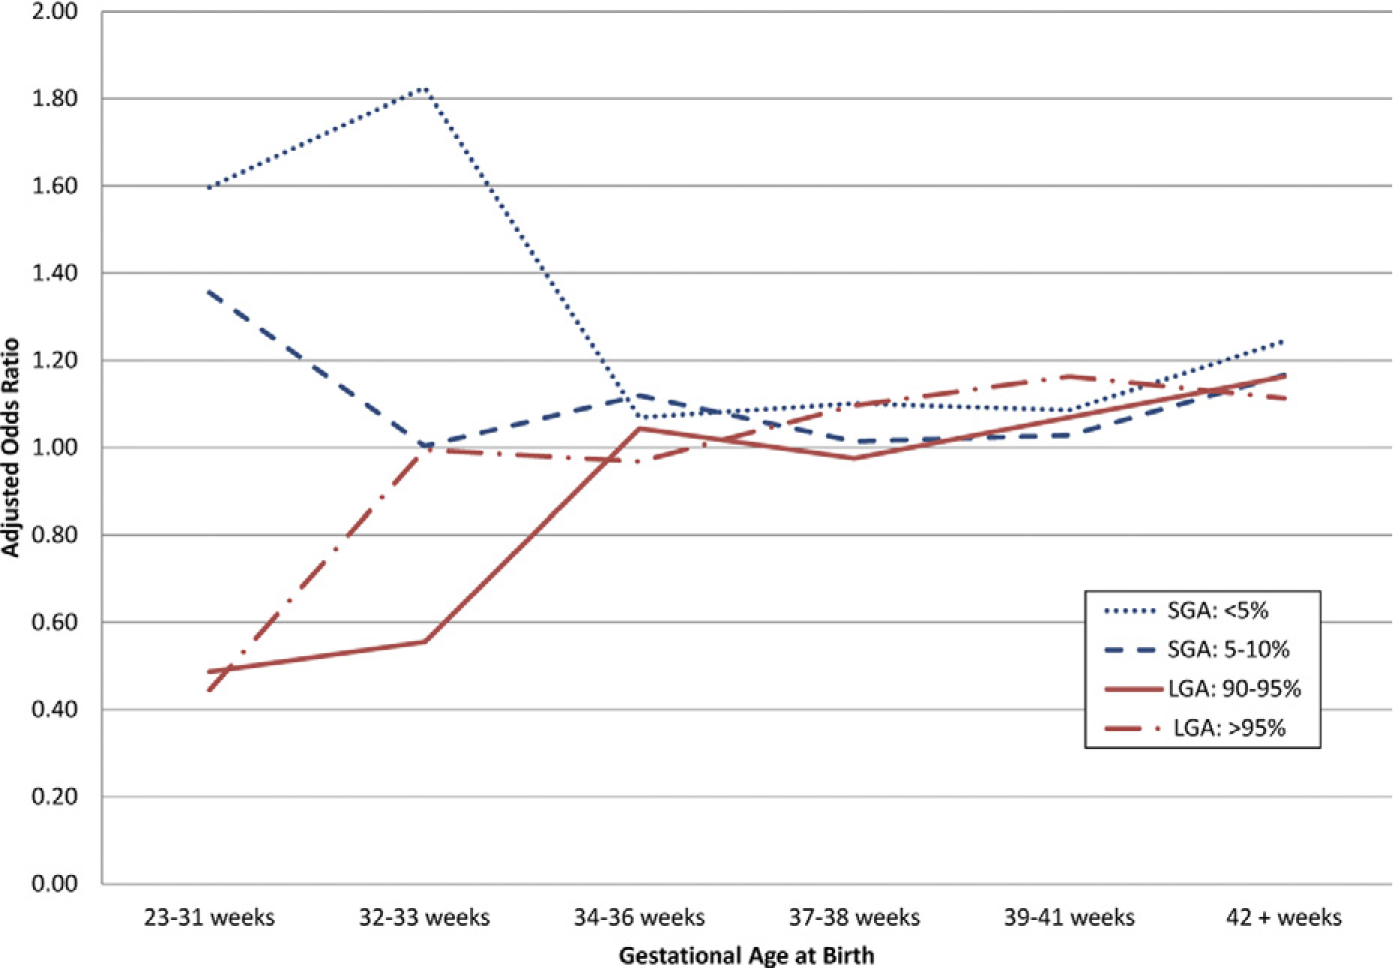
Within 1991 through 2001 California birth cohort, small-for-gestational age (SGA) birthweights (BW) (blue lines) were associated with increased autism risk <34 weeks, relative to appropriate-for-gestational age (GA) BW. Large-for-gestational age (LGA) BW (red lines) were protective against autism in preterm period but were associated with increased autism risk at 39–41 weeks. Analysis included infants that survived to 1 year of age. Multivariate analysis was performed for maternal age, race, hypertension, preeclampsia, birth order, twin gestation, and months since last live birth.
TABLE 5.
Numerical comparison of birthweight percentile and gestational age groups
| Gestational age groups | 23–31 wks |
32–33 wks |
34–36 wks |
37–38 wks |
39–41 wks |
≥42 wks |
||||||||||||||||||
|---|---|---|---|---|---|---|---|---|---|---|---|---|---|---|---|---|---|---|---|---|---|---|---|---|
| No autism |
Autism |
No autism |
Autism |
No autism |
Autism |
No autism |
Autism |
No autism |
Autism |
No autism |
Autism |
|||||||||||||
| n | % | n | % | n | % | n | % | n | % | n | % | n | % | n | % | n | % | n | % | n | % | n | % | |
|
| ||||||||||||||||||||||||
| Birthweight percentile | ||||||||||||||||||||||||
|
| ||||||||||||||||||||||||
| SGA <5% | 2423 | 5 | 30 | 8 | 2971 | 5 | 23 | 10 | 17,513 | 4 | 87 | 5 | 58,053 | 5 | 256 | 5 | 160,921 | 5 | 620 | 5 | 18,706 | 5 | 74 | 6 |
|
| ||||||||||||||||||||||||
| SGA 5–10% | 2722 | 5 | 28 | 8 | 3079 | 5 | 13 | 5 | 18,533 | 5 | 95 | 6 | 63,558 | 5 | 252 | 5 | 172,256 | 5 | 609 | 5 | 20,168 | 5 | 73 | 6 |
|
| ||||||||||||||||||||||||
| AGA >10 to <90% | 40,470 | 79 | 293 | 80 | 51,279 | 80 | 185 | 78 | 319,225 | 80 | 1325 | 79 | 1,018,370 | 80 | 3855 | 79 | 2,673,571 | 80 | 9184 | 78 | 311,709 | 80 | 986 | 77 |
|
| ||||||||||||||||||||||||
| LGA 90–95% | 3028 | 6 | 9 | 2 | 3730 | 6 | 6 | 3 | 21,771 | 5 | 85 | 5 | 66,445 | 5 | 246 | 5 | 174,857 | 5 | 658 | 6 | 20,411 | 5 | 79 | 6 |
|
| ||||||||||||||||||||||||
| LGA >95% | 2641 | 5 | 7 | 2 | 3427 | 5 | 10 | 4 | 20,704 | 5 | 77 | 5 | 63,750 | 5 | 273 | 6 | 165,432 | 5 | 689 | 6 | 19,365 | 5 | 74 | 6 |
AGA, appropriate-for-gestational age; LGA, large-for-gestational age; SGA, small-for-gestational age.
Moore. Autism risk by birthweight percentile. Am J Obstet Gynecol 2012.
Comment
Our large birth-cohort analysis describes autism risk by BW percentile, stratified by GA at birth. Within the entire cohort, both SGA and LGA BW were associated with autism. Stratification by GA revealed that only preterm SGA infants (<34 weeks) and term LGA infants (39–41 weeks) had a significantly increased risk for autism, while preterm LGA infants (<32weeks) were protected against autism.
The strengths of this analysis lie primarily in the large number of children with autism diagnosed using standardized criteria within a single analysis, and a population-based birth cohort with systematic and prospectively collected perinatal data allowing for determination of risk and limitation of recall bias. One of the potential limitations inherent to utilization of a large administrative database is the dependence on previously conducted diagnostic evaluations, as the sheer number of cases included precludes confirmation of diagnostic criteria for each individual case. It is fortunate that the California DDS uses a strict and uniform diagnostic criteria for autism throughout the state, distinguishing cases of autistic disorder from other disorders along the autism spectrum (pervasive developmental disorder–not otherwise specified and Asperger disorder), which are not eligible for services in the absence of significant disability. Regarding the possibility of incomplete inclusion of children with autism born within our birth cohort, DDS provides services to people with autism without regard to financial means or citizenship, and there isa75–80% rate of service provision by the DDS to children with autism.15 Intrinsic BW percentile tables were created for this analysis. We suspect that the tables are slightly skewed toward higher BW due to the increased mortality rates at the lowest BW,38 and the inclusion within the database of only children who survived to 1 year of age. As the BW percentiles that reached significance in our study (<5th and >95th) are likely to be within the SGA and LGA criteria used in practice (<10th and >90th), we believe that our results will be clinically useful.
Our finding that SGA BW is associated with increased autism risk within the entire cohort confirms the results of 2 recent studies describing perinatal and neonatal risk factors for autism.10,12 The current study provides certainty and strength to this association within a single study population using a large birth cohort. In addition, the current analysis demonstrates that this association is significant only in preterm infants, which has not been previously reported in a GA-stratified fashion. We also demonstrate a GA-dependent relationship between LGA BW and autism or of a protective effect of LGA BW in premature children. The increased risk for autism seen in term LGA infants is consistent with the results of a nested Swedish case-control study in which BW >2 SD was associated with autism (OR, 1.7; 95% CI, 1.0–2.7).14 The association was again noted but without attainment of significance in a comprehensive metaanalysis of perinatal risk factors for autism (OR, 1.11; 95% CI, 0.85–1.46).12 LGA may not be a more commonly reported finding due to 2 factors. Principally, the increase in risk we found was small (12% prior to stratification by GA), and may not have reached significance in smaller analyses. Secondly, the opposing term and preterm relationships may have cancelled out any significant correlations between LGA BW and autism in analyses that did not stratify results by GA at birth.
The association between SGA BW and autism may reflect an insult to neurodevelopment that occurred in the prenatal or postnatal time period. Within the prenatal state, it is conceivable that the pathophysiology that limited fetal growth also compromised neurologic development. Of primary interest is intrauterine growth restriction (IUGR) due to placental insufficiency, in which a fetus does not reach its growth potential due to limited transport of nutrients and oxygen. IUGR of placental insufficiency is a condition associated with chronic hypoxia, metabolic derangements, and eventually acidosis.39,40 Neonatal consequences of intrauterine acidosis include hypoxic ischemic encephalopathy, intraventricular hemorrhage, and periventricular leukomalacia.41 Not surprisingly, IUGR is associated with poor neurodevelopmental outcomes42,43 including behavioral and school difficulties,44 cognitive deficits,45 and cerebral palsy.46 It is thus conceivable that IUGR may contribute to the manifestations of autism seen in SGA children. Aside from IUGR from placental dysfunction, SGA can also be a consequence of intrauterine infection47 or genetic abnormality,48 both conditions associated abnormal neurodevelopment.43,49 The association between SGA BW and autism may also reflect complications after birth such as intraventricular hemorrhage, which is more commonly seen in SGA infants of all GA.50 Within our study population, the greatest risk of autism was noted within the 23- to 31-week and 32- to 33-week age groups of SGA infants (<5th percentile), which confirmed our hypothesis that the highest risk would be seen at the earliest GA, based on prior associations between autism and prematurity.5–10 Finally, speculation into the nature of the association between SGA BW and autism must take into consideration the accuracy of the variables used to calculate BW percentiles. BW are a more certain variable than GA at birth, which can be derived from either menstrual record or ultrasound history. GA definitions using last menstrual period alone can underestimate the degree of prematurity by up to 35%.51 In fact, a common explanation for SGA BW is incorrect dating. Thus, low BW may reflect a greater degree of prematurity, which is a known risk factor for autism.5–10
We found a dichotomous relationship between LGA BW and autism in preterm and term infants. The increased risk for autism seen in term LGA infants may reflect direct exposure to maternal metabolic abnormalities such as diabetes and obesity, inflammatory changes associated with maternal metabolic abnormalities, complications of labor, birth trauma, or postnatal metabolic derangements. It is notable that maternal diabetes and obesity are both risk factors for delivery an LGA child,20–21 and have both been associated with increased autism risk.9,24 While diabetes was a significant risk factor for autism in our overall analysis (OR, 1.42; 95% CI, 1.34–1.52), obesity was not included due to the poor coding of obesity within the OSHPD database, with a previously demonstrated sensitivity of 14%.52 The nature of the relationship between maternal diabetes and obesity with autism may be related to the altered inflammatory milieu seen in both maternal diabetes and obesity. Higher levels of circulating interleukin-6 levels were found in mothers with gestational diabetes (independent of obesity),53 and systemic increases in circulating inflammatory cytokines and acute phase proteins were demonstrated in obese women.54 Inflammatory mediators (including interleukin-6), have been shown to cross the placenta and to alter neurodevelopment in animal models.55 Aside from the potential for a direct effect on fetal neurodevelopment, it is hypothesized that exposure to in utero inflammation primes the fetal immune system for lifelong immune dysfunction, a condition previously demonstrated in both children and adults with autism (including elevated proinflammatory cytokine profiles in the cerebrospinal fluid and blood), and that may contribute to the underlying aberrant neurodevelopment and behavioral abnormalities seen in autistic disorder.56 Alternately, the relationship between maternal diabetes or obesity and autism may reflect permanent metabolic alterations via fetal programming. While the association may be incidental, a recent case-control study supported the role of fetal programming in autism, as people affected by autism were more likely to develop hyperlipidemia inadulthood.57
Perinatal events may also contribute to the connection between LGA BW and autism seen in term infants. Birth trauma including shoulder dystocia is more common in LGA infants, as the risk appears to be proportional to weight at birth.58 Shoulder dystocia is associated with neonatal encephalopathy59 (which is a risk factor for poor neurologic outcome),60 and birth trauma was significantly associated with autism in a recent metaanalysis of perinatal risk factors for autism (OR, 4.9; 95% CI, 1.41–16.94).12 While one half of shoulder dystocias occur in infants of normal BW (2500–4000 g), the incidence of shoulder dystocia is 10-fold higher in infants weighing >4000 g.61 Within our population, a BW of 4000 g is not reached at the 90th percentile until >38 weeks in boys and 39 weeks in girls (Table 1), which coincides with the increased autism risk seen in term LGA children >39 weeks. LGA BW are associated with prolonged second and third stages of labor that impart greater risk for intraamniotic infection, and an increased likelihood of undergoing augmentation of labor; however, neither prolonged labor nor augmentation of labor were associated with autism in the recent metaanalysis of Gardener et al12 on perinatal risk factors for autism. Why LGA BW would be protective against autism in children born <32 weeks is unclear. As preterm LGA infants have both higher rates of survival and higher rates of survival without major morbidity (grade III or IV intraventricular hemorrhage or periventricular leukomalacia, retinopathy of prematurity, necrotizing enterocolitis, or chronic lung disease),38 more LGA preterm infants may survive infancy without significant neurologic pathology.
Conclusion
Autism risk is significantly increased at both extremes of BW appropriateness. Stratification by GA yielded a more complex relationship, with increased risk seen only in preterm SGA infants and term LGA infants. Unexpectedly, LGA BW correlated with a significantly lower autism risk in children born <32 weeks. The nature of the associations between SGA and LGA BW and autism risk remains uncertain. We hope to further investigate perinatal conditions surrounding term delivery of LGA infants, and better characterize the relationship between maternal metabolic disorders and autism. The association between LGA BW and autism risk at term adds further momentum to the current public health emphasis on appropriate prepregnancy weight and weight gain in pregnancy.
Acknowledgments
Supported in part by National Institutes of Health grant number R03-HD050575.
Footnotes
The authors report no conflict of interest.
Presented at the 32nd annual meeting of the Society for Maternal-Fetal Medicine, Dallas, TX, Feb. 6–11, 2012.
The racing flag logo above indicates that this article was rushed to press for the benefit of the scientific community.
Contributor Information
Gaea Schwaebe Moore, Department of Obstetrics and Gynecology, University of California Davis; Department of Obstetrics and Gynecology, University of Colorado Health Sciences Center, Aurora, CO.
Anna Weber Kneitel, Department of Obstetrics and Gynecology, University of California Davis.
Cheryl K. Walker, Department of Obstetrics and Gynecology, University of California Davis.
William M. Gilbert, Department of Obstetrics and Gynecology, University of California Davis; Department of Obstetrics and Gynecology, Sutter Medical Center.
Guibo Xing, Department of Obstetrics and Gynecology, University of California Davis; Center for Healthcare Policy and Research, University of California Davis, Sacramento, CA.
REFERENCES
- 1.Rice C Prevalence of autism spectrum disorders–autism and developmental disabilities monitoring network, 14 sites, United States, 2002. MMWR Morb Mortal Wkly Rep 2007;56:12–28. [PubMed] [Google Scholar]
- 2.Johnson CP, Myers SM. Identification and evaluation of children with autism spectrum disorders. Pediatrics 2007;120:1183–215. [DOI] [PubMed] [Google Scholar]
- 3.Rice C Prevalence of autism spectrum disorders–autism and developmental disabilities monitoring network, United States, 2006. MMWR Morb Mortal Wkly Rep 2009;58:1–20. [PubMed] [Google Scholar]
- 4.Lauritsen MB, Pedersen CB, Mortensen PB. Effects of familial risk factors and place of birth on the risk of autism: a nationwide register-based study. J Child Psychol Psychiatry 2005;46:963–71. [DOI] [PubMed] [Google Scholar]
- 5.Limperopoulos C Autism spectrum disorders in survivors of extreme prematurity. Clin Perinatol 2009;36:791–805, vi. [DOI] [PubMed] [Google Scholar]
- 6.Brimacombe M, Ming X, Lamendola M. Prenatal and birth complications in autism. Matern Child Health J 2007;11:73–9. [DOI] [PubMed] [Google Scholar]
- 7.Eaton WW, Mortensen PB, Thomsen PH, Frydenberg M. Obstetric complications and risk for severe psychopathology in childhood. J Autism Dev Disord 2001;31:279–85. [DOI] [PubMed] [Google Scholar]
- 8.Buchmayer S, Johansson S, Johansson A, Hultman CM, Sparen P, Cnattingius S. Can association between preterm birth and autism be explained by maternal or neonatal morbidity? Pediatrics 2009;124:e817–25. [DOI] [PubMed] [Google Scholar]
- 9.Dodds L, Fell DB, Shea S, Armson BA, Allen AC, Bryson S. The role of prenatal, obstetric and neonatal factors in the development of autism. J Autism Dev Disord 2011;41:891–902. [DOI] [PubMed] [Google Scholar]
- 10.Guinchat V, Thorsen P, Laurent C, Cans C, Bodeau N, Cohen D. Pre-, peri-, and neonatal risk factors for autism. Acta Obstet Gynecol Scand 2011. [Epub ahead of print]. [DOI] [PubMed] [Google Scholar]
- 11.Schendel D, Bhasin TK. Birth weight and gestational age characteristics of children with autism, including a comparison with other developmental disabilities. Pediatrics 2008;121:1155–64. [DOI] [PubMed] [Google Scholar]
- 12.Gardener H, Spiegelman D, Buka SL. Perinatal and neonatal risk factors for autism: a comprehensive meta-analysis. Pediatrics 2011;128:344–55. [DOI] [PMC free article] [PubMed] [Google Scholar]
- 13.Mason-Brothers A, Ritvo ER, Pingree C, et al. The UCLA-University of Utah epidemiologic survey of autism: prenatal, perinatal, and postnatal factors. Pediatrics 1990;86:514–9. [PubMed] [Google Scholar]
- 14.Hultman CM, Sparen P, Cnattingius S. Perinatal risk factors for infantile autism. Epidemiology 2002;13:417–23. [DOI] [PubMed] [Google Scholar]
- 15.Croen LA, Grether JK, Selvin S. Descriptive epidemiology of autism in a California population: who is at risk? J Autism Dev Disord 2002;32:217–24. [DOI] [PubMed] [Google Scholar]
- 16.State of California Health and Agency Welfare, Department of Developmental Services. Client Development Evaluation Report–field report, 2nd ed. 1986. Available at: http://www.dds.ca.gov/FactsStats/docs/CDER_manualBM.pdf. Accessed Feb. 12, 2012.
- 17.Gilbert WM, Jacoby BN, Xing G, Danielsen B, Smith LH. Adverse obstetric events are associated with significant risk of cerebral palsy. Am J Obstet Gynecol 2010;203:328.e1–5. [DOI] [PMC free article] [PubMed] [Google Scholar]
- 18.Sibai BM. Chronic hypertension in pregnancy. Obstet Gynecol 2002;100:369–77. [DOI] [PubMed] [Google Scholar]
- 19.Allen VM, Joseph K, Murphy KE, Magee LA, Ohlsson A. The effect of hypertensive disorders in pregnancy on small for gestational age and stillbirth: a population-based study. BMC Pregnancy Childbirth 2004;4:17. [DOI] [PMC free article] [PubMed] [Google Scholar]
- 20.Odegard RA, Vatten LJ, Nilsen ST, Salvesen KA, Austgulen R. Preeclampsia and fetal growth. Obstet Gynecol 2000;96:950–5. [PubMed] [Google Scholar]
- 21.Mann JR, Mcdermott S, Bao H, Hardin J, Gregg A. Pre-eclampsia, birth weight, and autism spectrum disorders. J Autism Dev Disord 2009;40:548–54. [DOI] [PubMed] [Google Scholar]
- 22.Haeri S, Khoury J, Kovilam O, Miodovnik M. The association of intrauterine growth abnormalities in women with type 1 diabetes mellitus complicated by vasculopathy. Am J Obstet Gynecol 2008;199:278.e1–5. [DOI] [PubMed] [Google Scholar]
- 23.Okun N, Verma A, Mitchell BF, Flowerdew G. Relative importance of maternal constitutional factors and glucose intolerance of pregnancy in the development of newborn macrosomia. J Matern Fetal Med 1997;6:285–90. [DOI] [PubMed] [Google Scholar]
- 24.Lyall K, Pauls DL, Spiegelman D, Ascherio A, Santangelo SL. Pregnancy complications and obstetric suboptimality in association with autism spectrum disorders in children of the Nurses’ Health Study II. Autism Res 2011. [Epub ahead of print]. [DOI] [PMC free article] [PubMed] [Google Scholar]
- 25.Odibo AO, Nelson D, Stamilio DM, Sehdev HM, Macones GA. Advanced maternal age is an independent risk factor for intrauterine growth restriction. Am J Perinatol 2006;23:325–8. [DOI] [PubMed] [Google Scholar]
- 26.Glasson EJ, Bower C, Petterson B, De Klerk N, Chaney G, Hallmayer JF. Perinatal factors and the development of autism: a population study. Arch Gen Psychiatry 2004;61:618–27. [DOI] [PubMed] [Google Scholar]
- 27.Greenberg DA, Hodge SE, Sowinski J, Nicoll D. Excess of twins among affected sibling pairs with autism: implications for the etiology of autism. Am J Hum Genet 2001;69:1062–7. [DOI] [PMC free article] [PubMed] [Google Scholar]
- 28.Betancur C, Leboyer M, Gillberg C. Increased rate of twins among affected sibling pairs with autism. Am J Hum Genet 2002;70:1381–3. [DOI] [PMC free article] [PubMed] [Google Scholar]
- 29.Cleary-Goldman J, D’Alton ME. Growth abnormalities and multiple gestations. Semin Perinatol 2008;32:206–12. [DOI] [PubMed] [Google Scholar]
- 30.Seidman DS, Armon Y, Roll D, Stevenson DK, Gale R. Grand multiparity: an obstetric or neonatal risk factor? Am J Obstet Gynecol 1988;158:1034–9. [DOI] [PubMed] [Google Scholar]
- 31.Shah PS. Parity and low birth weight and preterm birth: a systematic review and meta-analyses. Acta Obstet Gynecol Scand 2011;89:862–75. [DOI] [PubMed] [Google Scholar]
- 32.Thompson JM, Clark PM, Robinson E, et al. Risk factors for small-for-gestational-age babies: the Auckland birthweight collaborative study. J Paediatr Child Health 2001;37:369–75. [DOI] [PubMed] [Google Scholar]
- 33.Alexander GR, Wingate MS, Mor J, Boulet S. Birth outcomes of Asian-Indian-Americans. Int J Gynaecol Obstet 2007;97:215–20. [DOI] [PubMed] [Google Scholar]
- 34.Lang JM, Cohen A, Lieberman E. Risk factors for small-for-gestational-age birth in a preterm population. Am J Obstet Gynecol 1992;166:1374–8. [DOI] [PubMed] [Google Scholar]
- 35.Croen LA, Grether JK, Hoogstrate J, Selvin S. The changing prevalence of autism in California. J Autism Dev Disord 2002;32:207–15. [DOI] [PubMed] [Google Scholar]
- 36.Conde-Agudelo A, Rosas-Bermudez A, Kafury-Goeta AC. Birth spacing and risk of adverse perinatal outcomes: a meta-analysis. JAMA 2006;295:1809–23. [DOI] [PubMed] [Google Scholar]
- 37.Salihu HM, August EM, Mbah AK, et al. The impact of birth spacing on subsequent feto-infant outcomes among community enrollees of a federal healthy start project. J Community Health 2012;37:137–42. [DOI] [PubMed] [Google Scholar]
- 38.Shah PS, Ye XY, Synnes A, Rouvinez-Bouali N, Yee W, Lee SK. Prediction of survival without morbidity for infants born at under 33 weeks gestational age: a user-friendly graphical tool. Arch Dis Child Fetal Neonatal Ed 2011. Sep 6 [Epub ahead of print]. [DOI] [PubMed] [Google Scholar]
- 39.Soothill PW, Nicolaides KH, Bilardo K, Hackett GA, Campbell S. Utero-placental blood velocity resistance index and umbilical venous pO2, pCO2, pH, lactate and erythroblast count in growth-retarded fetuses. Fetal Ther 1986;1:176–9. [DOI] [PubMed] [Google Scholar]
- 40.Soothill PW, NicolaidesKH, Campbell S. Prenatal asphyxia, hyperlacticemia, hypoglycemia, and erythroblastosis in growth retarded fetuses. Br Med J (Clin Res Ed) 1987;294:1051–3. [DOI] [PMC free article] [PubMed] [Google Scholar]
- 41.Malin GL, Morris RK, Khan KS. Strength of association between umbilical cord pH and perinatal and long term outcomes: systematic review and meta-analysis. BMJ 2010;340:c1471. [DOI] [PMC free article] [PubMed] [Google Scholar]
- 42.Baschat AA. Neurodevelopment following fetal growth restriction and its relationship with antepartum parameters of placental dysfunction. Ultrasound Obstet Gynecol 2011;37:501–14. [DOI] [PubMed] [Google Scholar]
- 43.Torrance HL, Bloemen MC, Mulder EJ, et al. Predictors of outcome at 2 years of age after early intrauterine growth restriction. Ultrasound Obstet Gynecol 2010;36:171–7. [DOI] [PubMed] [Google Scholar]
- 44.Morsing E, Asard M, Ley D, Stjernqvist K, Marsal K. Cognitive function after intrauterine growth restriction and very preterm birth. Pediatrics 2011;127:e874–82. [DOI] [PubMed] [Google Scholar]
- 45.Guellec I, Lapillonne A, Renolleau S, et al. Neurologic outcomes at school age in very preterm infants born with severe or mild growth restriction. Pediatrics 2011;127:e883–91. [DOI] [PubMed] [Google Scholar]
- 46.Baschat AA, Viscardi RM, Hussey-Gardner B, Hashmi N, Harman C. Infant neurodevelopment following fetal growth restriction: relationship with antepartum surveillance parameters. Ultrasound Obstet Gynecol 2009;33:44–50. [DOI] [PubMed] [Google Scholar]
- 47.Williams MC, O’Brien WF, Nelson RN, Spellacy WN. Histologic chorioamnionitis is associated with fetal growth restriction in term and preterm infants. Am J Obstet Gynecol 2000;183:1094–9. [DOI] [PubMed] [Google Scholar]
- 48.Snijders RJ, Sherrod C, Gosden CM, Nicolaides KH. Fetal growth retardation: associated malformations and chromosomal abnormalities. Am J Obstet Gynecol 1993;168:547–55. [DOI] [PubMed] [Google Scholar]
- 49.Rovira N, Alarcon A, Iriondo M, et al. Impact of histological chorioamnionitis, funisitis and clinical chorioamnionitis on neurodevelopmental outcome of preterm infants. Early Hum Dev 2011;87:253–7. [DOI] [PubMed] [Google Scholar]
- 50.Damodaram M, Story L, Kulinskaya E, Rutherford M, Kumar S. Early adverse perinatal complications in preterm growth-restricted fetuses. Aust N Z J Obstet Gynaecol 2011;51:204–9. [DOI] [PubMed] [Google Scholar]
- 51.Mongelli M, Gardosi J. Birth weight, prematurity and accuracy of gestational age. Int J Gynaecol Obstet 1997;56:251–6. [DOI] [PubMed] [Google Scholar]
- 52.Yasmeen S, Romano PS, Schembri ME, Keyzer JM, Gilbert WM. Accuracy of obstetric diagnoses and procedures in hospital discharge data. Am J Obstet Gynecol 2006;194:992–1001. [DOI] [PubMed] [Google Scholar]
- 53.Morisset AS, Dube MC, Cote JA, Robitaille J, Weisnagel SJ, Tchernof A. Circulating interleukin-6 concentrations during and after gestational diabetes mellitus. Acta Obstet Gynecol Scand 2011;90:524–30. [DOI] [PubMed] [Google Scholar]
- 54.Lumeng CN, Saltiel AR. Inflammatory links between obesity and metabolic disease. J Clin Invest 2011;121:2111–7. [DOI] [PMC free article] [PubMed] [Google Scholar]
- 55.Jonakait GM. The effects of maternal inflammation on neuronal development: possible mechanisms. Int J Dev Neurosci 2007;25:415–25. [DOI] [PubMed] [Google Scholar]
- 56.Onore C, Careaga M, Ashwood P. The role of immune dysfunction in the pathophysiology of autism. Brain Behav Immun 2011. [Epub ahead of print]. [DOI] [PMC free article] [PubMed] [Google Scholar]
- 57.Tyler CV, Schramm SC, Karafa M, Tang AS, Jain AK. Chronic disease risks in young adults with autism spectrum disorder: forewarned is forearmed. Am J Intellect Dev Disabil 2011;116:371–80. [DOI] [PubMed] [Google Scholar]
- 58.Tsur A, Sergienko R, Wiznitzer A, Zlotnik A, Sheiner E. Critical analysis of risk factors for shoulder dystocia. Arch Gynecol Obstet 2011. [Epub ahead of print]. [DOI] [PubMed] [Google Scholar]
- 59.Leung TY, Stuart O, Sahota DS, Suen SS, Lau TK, Lao TT. Head-to-body delivery interval and risk of fetal acidosis and hypoxic ischemic encephalopathy in shoulder dystocia: a retrospective review. BJOG 2011;118:474–9. [DOI] [PubMed] [Google Scholar]
- 60.Martinez-Biarge M, Diez-Sebastian J, Kapellou O, et al. Predicting motor outcome and death in term hypoxic-ischemic encephalopathy. Neurology 2011;76:2055–61. [DOI] [PMC free article] [PubMed] [Google Scholar]
- 61.Langer O, Berkus MD, Huff RW, Samueloff A. Shoulder dystocia: should the fetus weighing greater than or equal to 4000 grams be delivered by cesarean section? Am J Obstet Gynecol 1991;165:831–7. [DOI] [PubMed] [Google Scholar]