

Abstract
Birth weight is a key human biological characteristic as a measure of prenatal development and a variable related to later quality of life. Studies have firmly established that a stressful situation in utero adversely affects newborns’ birth weight. Using birth statistics provided by Statistics Korea, this study examined how universal cash transfer during the COVID-19 crisis affected newborns’ birth weight in South Korea. Given that the normal gestation period is nearly 10 months, we chose newborns without a self-selection issue by utilizing information on birthdate and total pregnancy period from the dataset, subsequently applying difference-in-differences estimation. Results showed that universal cash transfer offset newborns’ weight loss amid the COVID-19 pandemic. The effects differed according to households’ sociodemographic characteristics, with effects being more pronounced for girls; more pronounced for households with more than two children; more pronounced in local districts severely affected during the initial stage of the pandemic, but less significant in metropolitan regions; and more among middle-class families. This study presents evidence that governmental cash transfer during the pandemic has improved newborns’ health and that continuing such a policy would positively impact future generations from a health perspective.
Keywords: COVID-19, Cash transfer, Birth weight, South Korea
Introduction
COVID-19 has spread rapidly worldwide since January 2020 and impacted society profoundly. Governments have actively responded to prevent COVID-19’s adverse effects (Brodeur et al., 2021). Particularly, financial support such as cash transfer has been provided to the public to avoid an economic recession. Much research has examined these fiscal policies’ societal effects from various perspectives (Alberola et al., 2021; Devereux et al., 2020).
In response to COVID-19, the South Korean government also introduced expansionary fiscal policies through supplementary budgeting (Park & Maher, 2020).1 The most controversial and noteworthy policy is the universal cash transfer program, referred to as the “emergency disaster relief fund.” The government introduced this program on March 30, 2020, about three months after the first outbreak of COVID-19 in South Korea. The total size of the universal cash transfer was around KRW 14.2 trillion,2 which was approximately 2.76% of the main budget expenditure and 0.87% of the total GDP in 2020. Each household received KRW 1 million for four or more individuals, KRW 800,000 for three individuals, KRW 600,000 for two individuals, and KRW 400,000 for one individual. The cash transfer was implemented quickly, and more than 99% of the population benefited from the program.
This unprecedented fiscal policy has sparked political debates, including whether the universal basic income is necessary for the welfare system (Baek, 2020; Yang, 2020). Many scholars have examined the societal effects of emergency disaster relief funds, generally from an economic perspective such as consumption and employment (Baek et al., 2021; Kim & Lee, 2021; Kim & Oh, 2021; Kim et al., 2020; Woo et al., 2021).
This study investigates the effects of the South Korean government’s universal cash transfer in response to COVID-19 on newborns’ birth weight by applying the difference-in-differences (DID) estimation method. The endogeneity issue must be addressed to identify causal effects of the cash transfer on newborns’ birth weight. For example, the timing of pregnancy and childbirth can be adjusted according to the information on cash transfer, and this self-selection can interfere with the identification of causal linkage. This study overcomes this problem by limiting the scope of analysis to cohorts not affected by the government’s decision on emergency disaster relief fund.
This study is closely related to previous research in three ways. First, much research has demonstrated that birth weight is a robust indicator of babies’ in utero environment and development, and it affects individuals’ health and human capital accumulation over the lifespan (Almond & Currie, 2011; Almond et al., 2005; Behrman & Rosenzweig, 2004).3 The consequences of low birth weight range from various health risks to lower educational achievement and labor market performance (Bogin & Varea, 2020; Negrato & Gomes, 2013). Thus, birth weight is commonly used as a proxy variable to predict quality of life across many dimensions (Black et al., 2007; Currie & Moretti, 2007; Lee, 2014a).
Second, pregnant women under the influence of interacting social, economic, and political factors at the individual, family, and community levels are vulnerable to stressful situations. Maternal stress can adversely affect fetuses’ development by increasing levels of corticotropin-releasing hormone (Wadhwa et al., 1993), manifesting as low birth weight (Pike, 2005). Various studies have analyzed causal effects of crises on newborns’ health by exploiting quasi-experimental situations, such as natural disasters (Currie & Rossin-Slater, 2013; Kim et al., 2017; Le & Nguyen, 2021; Torche, 2011), major disease outbreaks and accidents (Almond et al., 2009; Burlando, 2014; Lin & Liu, 2014), social disruptions (Lee, 2014b; Mansour & Rees, 2012; Quintana-Domeque & Ródenas-Serrano, 2017), and economic recessions (Bozzoli & Quintana-Domeque, 2014; Carlson, 2015; Clark et al., 2021; Lee & Orsini, 2018; Olafsson, 2016).
Third, the government’s economic support can have positive effects on newborns’ weight by improving pregnant women’s living conditions (Almond et al., 2011; Amarante et al., 2016; Baker, 2008; Barber & Gertler, 2010; Chung et al., 2016; Gaarder et al., 2010; Hoynes et al., 2015; Hoynes et al., 2011; Strully et al., 2010). The literature suggests various mechanisms via which income support improves newborns’ birth weight. For example, while pregnant women’s stress hormones cause slow fetal growth, the government’s income support can help mothers alleviate their stress (Camacho, 2008; Weinstock, 2005). Mothers in low-income families or underdeveloped countries can supplement nutritional needs through income support (Currie, 2009). Moreover, cash subsidies enable mothers to cultivate healthy lifestyle habits by utilizing health facilities.
We contribute to the literature by integrating the preceding three perspectives into one framework and presenting additional evidence in the Korean context. In recent years, literature that has paid attention to the negative relationship between COVID-19 and neonatal outcomes, including birth weight, has been accumulated in various countries (Dileep et al., 2022; Vousden et al., 2022). And scholars point out that one main channel that causes adverse effects of COVID-19 on infant health is prenatal stress during the pandemic (Pope et al., 2022; Preis et al, 2021; Provenzi, et al., 2021), thus emphasizing the importance of measures to relieve stress (Corno, et al, 2022). Beyond the fact that the outbreak of COVID-19 is negatively associated with birth weight, this study presents a new perspective on the role of government in that government subsidy can prevent the negative effects of COVID-19 on neonatal weight. Moreover, this study is distinguished from previous literature that generally has analyzed the effects of universal cash transfer policies on newborn’s birth weight during the pandemic from an economic viewpoint, enabling us to evaluate whether universal income support during a large-scale crisis not only “saves the economy” but also “saves health.” We also extend the scope of existing studies that focus on either specific samples or regions to the entire populations and regions within one country, helping us provide additional evidence from a different context and draw conclusions about general policy. Finally, we present heterogeneous results across multiple spectra, such as gender, siblings, region, and parental education, and present relevant policy implications.
This article is organized as follows. Section "Institutional background" explains the institutional background. Section "Research design" explains the research design. Section "Results and discussion" presents the estimation results. Section "Conclusion" concludes the study.
Institutional Background
The first COVID-19 case in South Korea was detected on January 20, 2020. While the virus appeared to be under control shortly thereafter, there was then a major outbreak beginning in mid-February. Particularly, the number of confirmed cases increased significantly in Daegu and Gyeongbuk.4 At the end of March, the total number of confirmed cases approached 10,000. Figure 1 shows the trends in daily and cumulative confirmed cases of COVID-19 in South Korea during 2020.
Fig. 1.
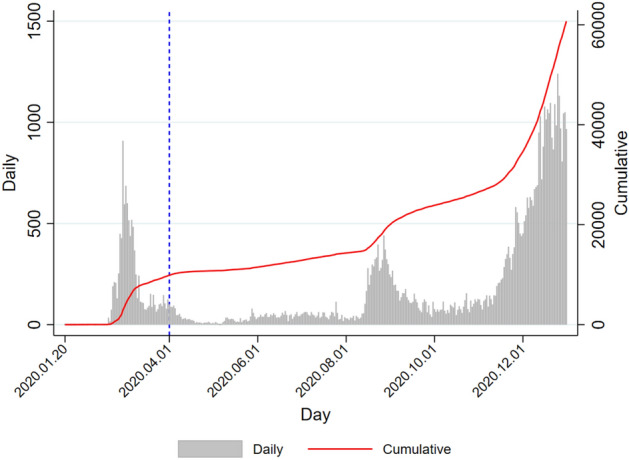
COVID-19 trends in South Korea.
Source: http://ncov.mohw.go.kr/. The blue dotted line represents when the government announced the universal cash transfer program (March 30)
Amid the spread of the virus across the country, the Korea Centers for Disease Control and Prevention announced a state of emergency in February 2020. To mitigate the spread of COVID-19, the government implemented various policies (Kim, 2020; Park et al., 2020; You, 2020), such as social distancing, flexible work schedules, shortened mandatory school days, and restricted business hours, most of which inevitably restricted social and economic activities.
These measures have limited disease transmission, but they have increased the risk of an economic recession due to constraints on industrial production and private consumption. To prevent a COVID-19-induced economic downturn, the government implemented the first emergency disaster relief fund—a one-time universal cash transfer to households—on March 30, 2020.5 This cash transfer was mainly intended to boost private consumption and support small businesses and their employees, who were particularly vulnerable to declining sales due to COVID-19.
Because this cash transfer was an unprecedented policy that required many fiscal resources, it provoked intense political debates and opposition. Originally, the government discussed the policy as a selective payment based on income and wealth (i.e., those with income levels below the 70th percentile would qualify). However, the government finally announced on April 30 that the cash transfer would be universal with no strings attached; consequently, nearly the entire population benefitted from the emergency disaster relief fund.
Specifically, the emergency disaster relief fund was paid to all households based on the number of household members, regardless of household income or property. The size of the first emergency disaster relief fund was KRW 1 million for each household of four or more individuals, KRW 800,000 for each household of three individuals, KRW 600,000 for each household of two individuals, and KRW 400,000 for single-person households. Approximately 2.7 million especially vulnerable households received the funds without a separate application process beginning May 4th, and the remaining households received payment between May and August after completing separate applications. Vulnerable households received cash funds, and the remaining households were paid in the form of credit cards, check cards, local business gift cards, or prepaid cards, based on their preference, which had to be used by August. The use of subsidies was restricted in businesses such as large discounting stores, department stores, and entertainment establishments. Implementation was swift, and approximately 99% of households had received payment by May. According to the government’s announcement in September, a total of KRW 14.23 trillion was distributed, with 22.16 million households receiving subsidies.
Research Design
Data, Sample Construction, and Descriptive Statistics
This study used birth statistics provided by Statistics Korea. The Korean government requires registering newborns within one month of birth, and several statistics are publicly available. The information includes gender, birth year and month, couples’ marriage year and month, gestation period, birth order, birth weight, twin status, and parents’ schooling. Unfortunately, there are limitations with respect to analyzing the effects of COVID-19 and cash transfer according to households’ economic status because there is no information available on household income.
First, this study focused on all individuals born between 2019 and 2020 to create homogeneous groups that are exempt from confounding effects due to various macroeconomic shocks across years.6 Additionally, we needed to observe newborns free from self-selection with respect to pregnancy and childbirth to identify the causal linkage between the universal cash transfer and birth weight during COVID-19 (Joyce, 1994). COVID-19 was widely known to the public and began spreading in January 2020. Additionally, the government first announced the cash transfer program on March 30 and implemented the policy plan in April. Therefore, households’ self-selection in terms of pregnancy and childbirth could occur based on information related to COVID-19 and government policy. For example, the time of childbirth could be delayed due to COVID-19 or accelerated by the unconditional cash transfer. This means that to address possible self-selection and infer causality, we needed to target newborns whose mothers could not manipulate whether to conceive or give birth based on the pandemic and subsidy information.
Given that the normal gestation period is nearly 10 months, we chose newborns without a self-selection problem by utilizing the information of birthdate and total pregnancy period in the data. First, we selected all individuals born between January and October in 2019 and 2020, respectively.7 For these cases, COVID-19 and cash transfer did not affect the pregnancy because it was before the first outbreak of COVID-19. Specifically, we selected the sample using the normal gestation period of 37–41 weeks8 and reversely calculating the time of pregnancy. Next, we excluded cases of multiple fetuses who have a large difference in birth weight (Cho & Lee, 2021).
There was a 3 month gap between the spread of COVID-19 in China (the first confirmed case of COVID-19 in South Korea was publicly known in January 2020) and when the South Korean government announced the emergency relief fund in late March 2020. Therefore, we classified cases into four comparable neonatal cohorts: individuals born between January and March 2019, between April and October 2019, between January and March 2020, and between April and October 2020.
Table 1 shows descriptive statistics for our sample. Approximately, 438,000 newborns were included, representing approximately 90% of all births reported during the period. Approximately 49% of the newborns were female. The average gestational period was 38.7 weeks. Most individuals were born in hospitals and to married couples, with approximately 40% being born within 2 years of marriage. Parents on average had 1.5 births, and most had graduated from college. On average, fathers were 35.4 years old, and mothers were 32.7 years old. Around half of the newborns were born in the Seoul metropolitan area. Figure 2 shows the distribution of birth weight by cohort.
Table 1.
Descriptive statistics
| Variable | Mean | SD | Min | Max | N |
|---|---|---|---|---|---|
| Birth weight | 3260.082 | 375.133 | 490.000 | 5720.000 | 438,192 |
| Female | 0.490 | 0.500 | 0 | 1 | 438,192 |
| Gestational period | 38.679 | 1.010 | 37.000 | 41.000 | 438,192 |
| Birth in a clinic | 0.996 | 0.060 | 0 | 1 | 438,192 |
| Birth after marriage | 0.977 | 0.149 | 0 | 1 | 438,192 |
| Birth within 2 years | 0.401 | 0.490 | 0 | 1 | 438,192 |
| Total births | 1.515 | 0.642 | 1 | 3 | 438,192 |
| Father’s schooling | 0.216 | 0.411 | 0 | 1 | 438,192 |
| Mother’s schooling | 0.193 | 0.395 | 0 | 1 | 438,192 |
| Father’s age | 35.373 | 4.873 | 15.413 | 70.676 | 434,365 |
| Mather’s age | 32.698 | 4.355 | 13.000 | 55.000 | 438,183 |
| Seoul metropolitan area | 0.514 | 0.500 | 0 | 1 | 438,192 |
The unit of birth weight is grams (g). Birth within two years indicates babies born to parents within two years of marriage. The schooling variable indicates whether the parent has an educational level of a high school diploma and below
Fig. 2.
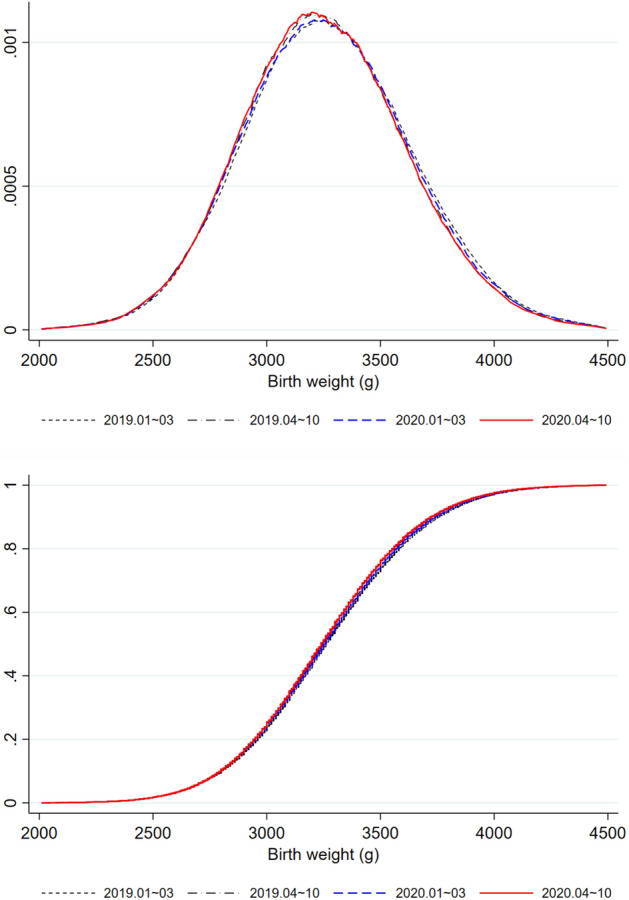
Distribution of newborns’ birth weight. The top figure is the density distribution function of newborns’ birth weight, and the bottom figure is the cumulative distribution function
Estimation Strategy
To examine the effects of universal cash transfer during COVID-19 on newborns’ birth weight, we applied the following DID estimation:
is ’s birth weight, who was born at . indicates whether the newborn had experienced COVID-19 in the prenatal phase. It is equal to 1 when the birth month is after January 2020 when the first COVID-19 case was detected, and 0 otherwise. Because the universal cash transfer was first announced on March 30, 2020, is a dummy variable equal to 1 when the birth month is after April each year, and 0 otherwise.
Through its interaction with , plays a role in distinguishing the effects of COVID-19 itself and the emergency relief fund. Specifically, the and variables classify cases into four cohorts: January–March 2019, April–October 2019, January–March 2020, and April–October 2020. The cohorts of April–October 2020 and April–October 2019 differ in terms of the presence of the COVID-19 pandemic during pregnancy through. The cohorts of April–October 2020 and January–March 2020 differ in terms of parents’ exposure to information on cash transfer during pregnancy through the. The DID estimation can identify the effects of universal cash transfer during the pandemic on birth weight by utilizing these two variables.9 is the coefficient of interest, as it captures the effects of the emergency relief fund during COVID-19 on newborns’ birth weight.
Gestational conditions and sociodemographic factors may affect newborns’ birth weight (Currie & Hyson, 1999). Based on the literature (Bogin & Varea, 2020), comprises variables that control for these factors. Specifically, we controlled for gender, provincial-level birthplace, gestational period, birth in a clinic, birth within 2 years of marriage, mothers’ total number of births, parents’ schooling, and parents’ ages. We also include the birth month in the covariates, as unobserved disparities in mothers’ attitudes and time preferences can partially explain differences in birth weight. is the error term, and we applied robust standard errors to accommodate any heteroscedasticity. Moreover, we conducted a battery of robustness checks by applying multiple model specifications to support the main results.
Results and Discussion
Main Results
Before moving on to the main analysis, we performed an event study analysis by extending the analysis period to 10 years (between 2011 and 2020). Figure 3 shows the preliminary results. The y-axis displays newborns’ birth weight, and each dot indicates the coefficient of the interaction term between a year dummy and an indicator variable, which is equal to 1 when the birth month is April and 0 when the birth month is between January and March. The blue line is a 95% confidence interval, and the base year is 2011. The period other than 2020 can serve as a placebo test by falsely assuming that COVID-19 occurred in January and income subsidies were distributed in April each year. The graph shows that the effects were only significant in 2020, suggesting that they stem from the presence of COVID-19 and implementation of the universal cash transfer policy.
Fig. 3.
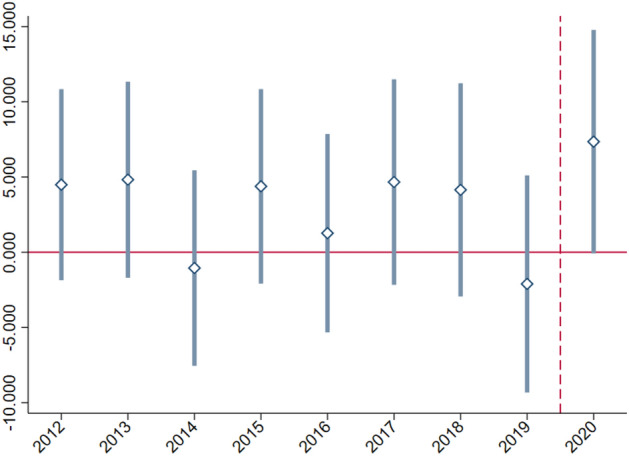
Event study analysis of newborns’ birth weight. The y-axis displays newborns’ birth weight. Each dot indicates the coefficient of the interaction between a year dummy and an indicator variable, which is equal to 1 when the birth month is April and 0 when the birth month is between January and March. The blue lines represent 95% confidence intervals. The base year is 2011
Table 2 shows the main results. Column (1) shows the effect when the control variables are not included. The cohorts who experienced the COVID-19 pandemic during the prenatal stage lost about 9.6 g of weight, which aligns with previous findings that newborns whose mothers experience stressful situations during pregnancy weigh less at birth. The cohorts born after April tended to weigh less than those born before April, demonstrating birth month effects. We found that the universal cash transfer during COVID-19 increased newborns’ birth weight by about 7.4 g, which means that approximately 80% of the decreased birth weight due to COVID-19 was recovered through the government’s income assistance program.10
Table 2.
Main results
| Variable | (1) | (2) | (3) | (4) | (5) |
|---|---|---|---|---|---|
| Birth weight (g) | Birth weight (g) | Birth weight (g) | Birth weight (dummy) | Birth weight (dummy) | |
| − 9.647** | − 3.036 | − 4.225* | − 0.001 | − 0.000 + | |
| (2.030) | (1.927) | (1.864) | (0.001) | (0.000) | |
| − 18.422** | − 19.776** | − 19.791** | 0.001 | − 0.000 | |
| (1.689) | (2.608) | (2.521) | (0.001) | (0.000) | |
| 7.370** | 6.547** | 6.517** | − 0.001 | 0.000 | |
| (2.448) | (2.322) | (2.246) | (0.001) | (0.000) | |
| Female | − 112.658** | − 105.935** | 0.010** | − 0.000 | |
| (1.077) | (1.041) | (0.000) | (0.000) | ||
| Birth in a clinic | 16.260 + | 16.236 + | 0.000 | 0.000** | |
| (9.225) | (8.955) | (0.003) | (0.000) | ||
| Birth after marriage | 29.955** | 24.812** | − 0.006** | 0.000** | |
| (4.728) | (4.506) | (0.002) | (0.000) | ||
| Birth within 2 years | − 8.467** | − 7.197** | 0.002** | 0.000* | |
| (1.353) | (1.305) | (0.001) | (0.000) | ||
| Total births | 47.834** | 40.577** | − 0.009** | − 0.000 + | |
| (1.046) | (1.009) | (0.000) | (0.000) | ||
| Father’s schooling | 9.340** | 10.065** | 0.000 | 0.000 | |
| (1.504) | (1.452) | (0.001) | (0.000) | ||
| Mother’s schooling | 6.716** | 9.107** | 0.002** | − 0.000 | |
| (1.637) | (1.578) | (0.001) | (0.000) | ||
| Father’s age | − 1.012 | − 1.338 | − 0.000 | 0.000 | |
| (1.159) | (1.113) | (0.000) | (0.000) | ||
| Father’s age squared | 0.010 | 0.017 | 0.000 | − 0.000 | |
| (0.016) | (0.015) | (0.000) | (0.000) | ||
| Mother’s age | 14.079** | 11.781** | − 0.003** | 0.000 | |
| (1.520) | (1.459) | (0.001) | (0.000) | ||
| Mother’s age squared | − 0.190** | − 0.149** | 0.000** | 0.000 | |
| (0.023) | (0.022) | (0.000) | (0.000) | ||
| Birth month FE | N | Y | Y | Y | Y |
| Birth region FE | N | Y | Y | Y | Y |
| Gestational period FE | N | Y | Y | Y | Y |
| R2 | 0.000 | 0.105 | 0.092 | 0.020 | 0.000 |
| N | 438,192 | 434,355 | 426,385 | 434,355 | 434,355 |
The estimation is based on the difference-in-difference method. Column (1) shows the results when the covariates are not controlled, and Column (2) shows the results when including all control variables. Column (3) shows the results when limiting the sample to those whose birth weight was greater than 2500 g. We employed the dependent variable of birth weight (g) in Columns (1) to (3) and the dummy variable indicating low-birth weight infants in Columns (4) and (5), which is equal to 1 if newborns were less than 2500 g or 1500 g at birth, respectively
Robust standard errors in parentheses, + p < 0.10, *p < 0.05, **p < 0.01
Column (2) shows the results when controlling all covariates that may influence birth weight. The results are similar, implying that the effects primarily originated from the cash transfer and were not confounded by other sociodemographic conditions.
We also examined whether the COVID-19 crisis affected the frequency of births of infants weighing less than either 2500 g or 1500 g, who must receive special attention regarding potential health conditions. Columns (4) and (5) show the estimation results when the dependent variable is a dummy variable, which is equal to 1 when the newborn’s birth weight is 2500 g or 1500 g, respectively. Here, we did not observe statistically significant results. When compared with the results in Column (3), which limits the sample to those whose birth weight was greater than 2500 g, these results suggest that COVID-19’s effects on birth weight were limited to changes within normal weight range.
Overall, our findings indicate that the universal cash transfer limited the pandemic’s adverse effects by compensating for the decrease in birth weight. While the results were statistically significant, the biological significance may be questionable as the magnitude was rather small. However, these figures are comparable to those of previous studies, such as Camacho (2008), who found that terrorist attacks created maternal stress and caused an 8.7 g decrease in birth weight, and Hoynes et al. (2011), who demonstrated that government income support led to an average birth weight increase of 2 to 7 g. We emphasize that universal cash assistance can mitigate sudden crises’ adverse effects on birth weight. Given that COVID-19 emerged suddenly and spread quickly, the results imply that the pandemic’s negative effects on birth weight were reversed quickly through governmental cash transfer.
Opponents of the universal cash transfer program often argue that the one-time income assistance generates large government debt and shifts the fiscal burden to future generations, with limited actual benefits. However, the quality of life (e.g., health quality, educational achievement, and labor market performance) of the generation who experienced COVID-19 in utero would have been compromised had they not been supported by the government and hence had lower birth weight, which is a biomarker of future quality of life. Thus, universal cash transfer during the pandemic can overcome the current economic crisis and alleviate adverse effects on future generations from a health perspective.
Robustness Tests
We conducted a battery of robustness checks to determine whether the main results would hold across multiple model specifications. Table 3 shows the results.
Table 3.
Robustness tests
| Variable | (1) | (2) | (3) | (4) | (5) |
|---|---|---|---|---|---|
| Narrow gestational period | Narrow birth month range [1] | Narrow birth month range [2] | Logged dependent variable | Clustering by region and month | |
| − 2.829 | − 3.056 | − 2.186 | − 0.001 | − 3.036 | |
| (2.060) | (1.929) | (2.402) | (0.001) | (2.201) | |
| − 20.116** | − 9.896** | − 8.422** | − 0.006** | − 19.776** | |
| (2.787) | (2.719) | (3.134) | (0.001) | (2.287) | |
| 5.174* | 8.045** | 9.439* | 0.002** | 6.547* | |
| (2.481) | (2.766) | (4.172) | (0.001) | (2.625) | |
| Female | − 113.507** | − 113.551** | − 112.265** | − 0.035** | − 112.658** |
| (1.151) | (1.382) | (1.960) | (0.000) | (1.141) | |
| Birth in a clinic | 25.978** | 24.708* | 29.669 + | 0.005 + | 16.260 + |
| (9.981) | (11.707) | (17.168) | (0.003) | (8.436) | |
| Birth after marriage | 30.077** | 22.954** | 26.405** | 0.010** | 29.955** |
| (5.124) | (6.137) | (8.687) | (0.001) | (3.979) | |
| Birth within 2 years | − 7.172** | − 7.413** | − 6.334* | − 0.003** | − 8.467** |
| (1.448) | (1.739) | (2.471) | (0.000) | (1.395) | |
| Total births | 44.324** | 47.198** | 48.545** | 0.015** | 47.834** |
| (1.126) | (1.328) | (1.888) | (0.000) | (1.224) | |
| Father’s schooling | 7.239** | 10.115** | 11.311** | 0.003** | 9.340** |
| (1.610) | (1.932) | (2.726) | (0.000) | (1.342) | |
| Mother’s schooling | 4.720** | 7.641** | 5.813 + | 0.002** | 6.716** |
| (1.763) | (2.102) | (2.988) | (0.001) | (1.477) | |
| Father’s age | − 0.504 | − 0.453 | 0.472 | − 0.000 | − 1.012 |
| (1.245) | (1.493) | (2.143) | (0.000) | (1.247) | |
| Father’s age squared | 0.004 | 0.005 | -0.007 | 0.000 | 0.010 |
| (0.017) | (0.020) | (0.029) | (0.000) | (0.016) | |
| Mother’s age | 13.422** | 14.013** | 16.370** | 0.004** | 14.079** |
| (1.636) | (1.976) | (2.807) | (0.000) | (1.542) | |
| Mother’s age squared | − 0.181** | − 0.190** | − 0.228** | − 0.000** | − 0.190** |
| (0.025) | (0.030) | (0.043) | (0.000) | (0.023) | |
| Birth month FE | Y | Y | Y | Y | Y |
| Birth region FE | Y | Y | Y | Y | Y |
| Gestational period FE | Y | Y | Y | Y | Y |
| R2 | 0.071 | 0.105 | 0.104 | 0.109 | 0.105 |
| N | 372,932 | 266,183 | 132,523 | 434,355 | 434,355 |
We limited the sample to those whose gestational period was between 38 and 40 weeks in column (1). We limited the sample to those whose birth months were from January to June in column (2). We limited the sample to those whose birth months were from February to April in column (3). The dependent variable is the log-transformed birth weight in column (4). Column (5) shows the estimation results when clustering standard errors at the month-region level
Robust standard errors in parentheses, + p < 0.10, *p < 0.05, **p < 0.01
First, we changed gestational period from 37–41 weeks to 38–40 weeks. By narrowing this range, we could control for gestational period’s effect on birth weight and alleviate self-selection issues more rigorously. Column (1) shows that the coefficient slightly decreased to 5.2 g, but the cash transfer’s effect of offsetting the weight loss caused by the COVID-19 crisis remained statistically significant.
Second, we restricted the analysis scope to address the endogeneity issue more rigorously. Babies born during April and June experienced the COVID-19 crisis during the last trimester of pregnancy. Previous studies have shown that the impact of maternal stress on fetal growth is greatest during the last trimester, when the prenatal environment is more influential than genetic factors (Negrato & Gomes, 2013; Painter et al., 2005). Moreover, when COVID-19 became pervasive and universal cash transfer became widespread, individuals may have adapted to these new circumstances, rendering the effects on birth weight less drastic. Thus, the results could be more pronounced if the analysis period is limited to when COVID-19 and cash transfer exerted more influence. Furthermore, narrowing the scope of analysis is advantageous in controlling for seasonal effects on birth weight.
Column (2) shows the results when the sample was restricted to those born between January and June 2020, and Column (3) shows the results for the cohort between February and April 2020. We found that the effects became more pronounced. While COVID-19 decreased newborns’ birth weight by 9.9 g, 8.0 g were recovered through the universal cash transfer when the analysis period was between January and June 2020. The effect size was even greater (by 9.4 g) when the analysis period was more restricted. These findings further support that universal cash transfer, as a countermeasure to COVID-19, has effectively improved newborns’ health.
Third, we applied the log-transformed dependent variable to limit the weight outliers’ effects. Column (4) shows that the coefficient of the interaction between and was 0.002, indicating that newborns’ birth weight increased by 0.2% on average due to the emergency disaster relief fund.
Finally, we clustered the standard errors at the regional and month levels to accommodate heteroscedasticity in the period and geographical unit, which can be pertinent to birth weight. Column (5) still shows the statistically significant results.
Heterogeneity of Effects of Government Subsidies
We examined how the effects of government subsidies during COVID-19 differed according to demographic and socioeconomic characteristics, specifically gender, sibling status, region, and educational background. Tables 4 and 5 shows the results.
Table 4.
Differences by gender, siblings, and region
| Variable | Gender | Siblings | Region | |||
|---|---|---|---|---|---|---|
| (1) | (2) | (3) | (4) | (5) | (6) | |
| Girl | Boy | One | Two or more | Daegu & Gyeongbuk | Seoul metropolitan | |
| − 5.984* | − 0.271 | − 1.392 | − 5.253 + | − 10.083 | − 1.795 | |
| (2.722) | (2.727) | (2.573) | (2.906) | (6.367) | (2.693) | |
| − 16.563** | − 22.965** | − 20.717** | − 18.839** | − 25.508** | − 19.063** | |
| (3.692) | (3.685) | (3.486) | (3.931) | (8.655) | (3.633) | |
| 9.768** | 3.544 | 1.888 | 12.515** | 14.481 + | 3.736 | |
| (3.279) | (3.286) | (3.101) | (3.500) | (7.672) | (3.238) | |
| Female | − 109.332** | − 116.989** | − 114.986** | − 113.136** | ||
| (1.439) | (1.622) | (3.559) | (1.499) | |||
| Birth in a clinic | 0.477 | 30.052* | 12.427 | 20.076 | 12.352 | 12.045 |
| (13.442) | (12.654) | (12.505) | (13.628) | (35.769) | (12.798) | |
| Birth after marriage | 35.611** | 24.239** | 29.308** | 22.795* | 21.069 | 30.341** |
| (6.634) | (6.733) | (5.293) | (10.640) | (15.330) | (6.589) | |
| Birth within 2 years | − 6.621** | − 10.208** | − 6.254** | − 7.411* | 2.212 | − 8.831** |
| (1.912) | (1.914) | (1.592) | (2.968) | (4.572) | (1.857) | |
| Total births | 45.733** | 49.863** | 29.648** | 47.425** | 51.981** | |
| (1.481) | (1.476) | (2.224) | (3.486) | (1.468) | ||
| Father’s schooling | 7.087** | 11.472** | 14.069** | 4.755* | 3.750 | 9.074** |
| (2.120) | (2.133) | (2.022) | (2.251) | (4.772) | (2.206) | |
| Mother’s schooling | 7.285** | 6.240** | 13.966** | 1.103 | 12.545* | 6.983** |
| (2.312) | (2.319) | (2.266) | (2.380) | (5.240) | (2.375) | |
| Father’s age | − 3.067 + | 0.879 | − 2.654 + | 1.876 | 1.607 | − 2.907 + |
| (1.629) | (1.646) | (1.511) | (1.902) | (3.640) | (1.740) | |
| Father’s age squared | 0.039 + | − 0.016 | 0.031 | − 0.022 | − 0.021 | 0.039 + |
| (0.022) | (0.022) | (0.021) | (0.025) | (0.049) | (0.023) | |
| Mother’s age | 14.020** | 14.219** | 16.290** | 18.707** | 14.570** | 12.748** |
| (2.139) | (2.157) | (1.955) | (2.640) | (4.903) | (2.264) | |
| Mother’s age squared | − 0.190** | − 0.191** | − 0.233** | − 0.245** | − 0.205** | − 0.174** |
| (0.033) | (0.033) | (0.031) | (0.039) | (0.076) | (0.034) | |
| Birth month FE | Y | Y | Y | Y | Y | Y |
| Birth region FE | Y | Y | Y | Y | Y | Y |
| Gestational period FE | Y | Y | Y | Y | Y | Y |
| R2 | 0.090 | 0.087 | 0.110 | 0.099 | 0.101 | 0.111 |
| N | 212,973 | 221,382 | 245,378 | 188,977 | 39,434 | 223,200 |
Seoul metropolitan areas include Seoul, Incheon, and Gyeonggi
Robust standard errors in parentheses, +p < 0.10, *p < 0.05, **p < 0.01
Table 5.
Differences across parental education levels
| Variable | (1) | (2) | (3) | (4) |
|---|---|---|---|---|
| − 1.321 | − 3.129 | − 2.606 | − 2.880 | |
| (13.602) | (1.929) | (2.027) | (4.593) | |
| − 9.850 | − 19.862** | − 19.381** | − 25.130** | |
| (18.439) | (2.612) | (2.742) | (6.105) | |
| 0.644 | 6.703** | 6.225* | 6.259 | |
| (16.452) | (2.325) | (2.440) | (5.504) | |
| Female | − 105.209** | − 112.616** | − 112.673** | − 113.401** |
| (7.700) | (1.078) | (1.131) | (2.539) | |
| Birth in a clinic | 89.955 + | 16.409 + | 20.237* | 13.845 |
| (50.833) | (9.214) | (9.875) | (22.703) | |
| Birth after marriage | 51.672** | 28.885** | 17.790** | 22.787* |
| (17.829) | (4.770) | (5.419) | (11.107) | |
| Birth within two years | − 19.487* | − 8.552** | − 7.900** | − 10.593** |
| (9.229) | (1.356) | (1.433) | (3.200) | |
| Total births | 21.502** | 47.997** | 51.417** | 57.035** |
| (6.337) | (1.048) | (1.118) | (2.465) | |
| Father’s schooling | 14.254 | 9.561** | 14.729** | 36.539** |
| (10.707) | (1.507) | (1.815) | (8.908) | |
| Mother’s schooling | 1.000 | 7.004** | 13.521** | − 4.952 |
| (12.374) | (1.642) | (2.132) | (10.081) | |
| Father’s age | 3.756 | − 1.534 | − 3.343* | − 6.776 + |
| (3.111) | (1.181) | (1.427) | (3.546) | |
| Father’s age squared | − 0.048 | 0.018 | 0.042* | 0.089 + |
| (0.040) | (0.016) | (0.019) | (0.047) | |
| Mother’s age | 18.987** | 14.097** | 12.351** | 17.371** |
| (6.082) | (1.539) | (1.849) | (4.430) | |
| Mother’s age squared | − 0.243* | − 0.190** | − 0.165** | − 0.238** |
| (0.101) | (0.024) | (0.028) | (0.066) | |
| Birth month FE | Y | Y | Y | Y |
| Birth region FE | Y | Y | Y | Y |
| Gestational period FE | Y | Y | Y | Y |
| R2 | 0.100 | 0.105 | 0.107 | 0.121 |
| N | 9596 | 432,926 | 387,444 | 74,305 |
Robust standard errors in parentheses, + p < 0.10, *p < 0.05, **p < 0.01
Column (1) shows the results when either the mother or the father had a middle school education or lower. Column (2) shows the results when either the mother or the father had a high school education or higher. Column (3) shows the results when either the mother or the father had a college education or higher. Column (4) shows the results when either the mother or the father had a graduate education or higher
First, Columns (1) and (2) in Table 4 show that girls experienced greater birth weight loss due to in-utero exposure to COVID-19-related stressful situations, and the cash transfer offset the loss to a greater extent. These positive effects of cash transfer on birth weight are noteworthy considering that girls on average weigh less than boys and are more likely to be underweight.
Second, Columns (3) and (4) in Table 4 show that newborns with older siblings gained 12.5 g of weight at birth after the cash transfer. This implies that while families with additional children may have been adversely affected by the pandemic (the lockdown affected childcare and the school system), governmental cash relief has improved mothers’ health by alleviating budgetary constraints and stress from COVID-19.
Third, Columns (5) and (6) in Table 4 focus on two large local districts—Daegu and Gyeongbuk, which were heavily impacted during the initial stage of the pandemic between January and March 2020—and the Seoul metropolitan area, where the population density is high and the price of residential real estate has increased sharply. We found that the effects of universal cash transfer on birth weight were more pronounced in Daegu and Gyeongbuk, although statistical significance was somewhat compromised. We can infer that the government’s income assistance improved prenatal health in regions where stressful circumstances due to the pandemic were more pronounced in the initial stage. Additionally, we found that the effects dissipated in the Seoul metropolitan area. This is possibly because the metropolitan area is densely populated and has a large amount of movement, and the disaster relief fund may not have eased budgetary constraints as much in an area where housing prices rose much more than they did in other regions during the period.
Finally, we analyzed whether the effects differed depending on households’ socioeconomic characteristics because the universal cash transfer occurred at the household level. The current data were limited in that we could not assess household income and wealth levels, but we could examine parental education. We assumed a positive correlation between education level and socioeconomic status (SES), and therefore, used the former as a proxy variable.
Table 5 shows the results across parental education levels. Interestingly, we found that the positive effect of cash transfer on birth weight likely occurred for middle-class households (columns 2 and 3) but not for very low- or high-SES households (columns 1 and 4). This finding contrasts with previous research showing that cash transfers are more effective for lower-educated households, as the marginal utility of additional income will be higher for the economically disadvantaged.11
We infer that this is because of several specific features of the pandemic cash transfer: (1) the pandemic was an event for everyone irrespective of socioeconomic status; (2) the emergency disaster relief fund was a one-time, universal measure; (3) birth itself can be a constrained choice for low-SES status families regardless of their receipt of a government subsidy; and (4) the budgetary constraints faced by high-SES households may not be affected by a temporary cash subsidy. Considering these circumstances, a temporary disaster support fund may impact middle-class individuals more strongly. For instance, for low-SES families, temporary cash support may not alleviate budgetary constraints and maternal stress sufficiently. However, the effects of universal cash transfer may be more pronounced for middle-class families, who generally do not rely on government support but experienced an unprecedented shock from COVID-19.
Furthermore, while it is beyond the scope of our research because we did not observe households’ behavioral responses after the cash transfer, the SES-related differences suggest that limited use of disaster relief funds can be beneficial. As mentioned in the institutional background section, vulnerable families were supported with cash, and there were no restrictions on where the cash could be used. This implies that the one-time cash transfer could have been wasted on addictive behaviors such as smoking and drinking by the group who are more susceptible to budgetary constraints, myopia, and self-control problems (Currie et al., 2009; Sheehan, 1998). Therefore, it may be beneficial to provide in-kind assistance so that the the disaster support fund can be used for sound purposes.
Conclusion
This study examined causal effects of the South Korean government’s universal cash transfer during COVID-19 on newborns’ birth weight. It was the first attempt to estimate the effect of universal cash transfer on birth weight in the context of public health at the population level.
Our DID estimation results show that the unconditional cash transfer successfully offset the decline in newborns’ average birth weight during the COVID-19 crisis. These results were consistent across multiple model specifications. The positive effects of cash transfer on birth weight were more pronounced in girls (who weigh less than boys on average) and regions where the spread of COVID-19 was more severe. Furthermore, the cash transfer’s effects were more pronounced in households with more than two children, less pronounced in metropolitan regions, and potentially more beneficial to middle-class households.
The results indicate that the COVID-19 crisis is biocultural in nature with a major impact on birth weight, and universal cash transfer can help mitigate the adverse effects of this health crisis. Focusing on the role of governmental intervention, our findings that universal cash transfer can offset declining average birth weight are meaningful because they demonstrate that the potential positive health benefits of non-health programs should not be ignored. Expansionary fiscal policy is commonly considered as a burden on future generations. However, such a burden can be offset if future generations’ health is secured through income support policies. Given the substantial lifetime costs of low birth weight, offsetting the birth weight loss during the pandemic through the universal cash transfer is not trivial. These health impacts are typically not considered in policymaking, but the benefits to vulnerable cohorts should be considered in discussions of the value of universal cash transfer. Such programs can benefit individuals in terms of health and human capital accumulation. In this sense, our results suggest that unconditional money transfers in response to nationwide crises should be evaluated positively from the perspective of health economics.
Acknowledgement
I appreciate Taehoon Kwon (Ministry of Agriculture, Food and Rural Affairs) for providing helpful comments.
Funding
This work is supported by the Ministry of Education of the Republic of Korea and the National Research Foundation of Korea (NRF-2022S1A5A2A0305221911).
Declarations
Conflict of interest
The author reports no conflicts of interest.
Footnotes
In 2020, the government introduced supplementary budgets in the middle of the fiscal year four times to mitigate the adverse economic effects of the COVID-19 pandemic.
As of March 30, 2020, 1 USD was approximately KRW 1224.
Birth weight is subdivided into variables related to gestation length and developmental conditions (Kramer, 1987), and low birth weight can result from either short gestational length or intrauterine growth retardation, among which the former is relatively difficult to control.
There are 17 provincial-level local governments in South Korea. Among them, Daegu and Gyeongbuk accounted for 68.3% of the total confirmed cases from January through March 2020.
Refer to the following article: “South Korea to pay families hundreds of dollars to ease coronavirus impact,” https://www.reuters.com/article/us-health-coronavirus-southkorea-idUSKBN21H07R.
The reason for observing births in 2 years (2019 and 2020) was that newborns born in 2019 could serve as a control group for babies born in 2020 in the DID estimation.
Here, we excluded newborns born in November and December because COVID-19, which began spreading in January 2020, could have affected parents’ pregnancy decisions in these months.
Here, the normal gestational period is based on the commonly accepted medical standard. About 95% are born after 37 to 41 weeks, and 81% are born after 38 to 40 weeks.
There is a large body of literature on the association between the month and season of birth and birth weight. This empirical framework is also advantageous because it can control for the effects of birth season and month on birth weight by comparing two years (2019 and 2020) and two time segments based on a month (before and after April).
While we do not present the results here, we performed the change-in-changes estimation suggested by Athey and Imbens (2006). This yielded a result of 12.18 g, which is both quantitively and qualitatively comparable to the DID estimation results.
Still, we should be cautious about the interpretation of the results due to the data limitation. Most observations are with a higher than a high school degree, which makes the level of education at such aggregate level may not capture differences in SES of the households.
Publisher's Note
Springer Nature remains neutral with regard to jurisdictional claims in published maps and institutional affiliations.
References
- Alberola E, Arslan Y, Cheng G, Moessner R. Fiscal response to the COVID-19 crisis in advanced and emerging market economies. Pacific Economic Review. 2021;26(4):459–468. doi: 10.1111/1468-0106.12370. [DOI] [Google Scholar]
- Almond D, Chay KY, Lee DS. The costs of low birth weight. The Quarterly Journal of Economics. 2005;120(3):1031–1083. [Google Scholar]
- Almond D, Currie J. Killing me softly: The fetal origins hypothesis. Journal of Economic Perspectives. 2011;25(3):153–172. doi: 10.1257/jep.25.3.153. [DOI] [PMC free article] [PubMed] [Google Scholar]
- Almond D, Edlund L, Palme M. Chernobyl’s subclinical legacy: Prenatal exposure to radioactive fallout and school outcomes in Sweden. The Quarterly Journal of Economics. 2009;124(4):1729–1772. doi: 10.1162/qjec.2009.124.4.1729. [DOI] [Google Scholar]
- Almond D, Hoynes HW, Schanzenbach DW. Inside the war on poverty: The impact of food stamps on birth outcomes. The Review of Economics and Statistics. 2011;93(2):387–403. doi: 10.1162/REST_a_00089. [DOI] [Google Scholar]
- Amarante V, Manacorda M, Miguel E, Vigorito A. Do cash transfers improve birth outcomes? Evidence from matched vital statistics, program, and social security data. American Economic Journal: Economic Policy. 2016;8(2):1–43. [Google Scholar]
- Athey S, Imbens GW. Identification and inference in nonlinear difference-in-differences models. Econometrica. 2006;74(2):431–497. doi: 10.1111/j.1468-0262.2006.00668.x. [DOI] [Google Scholar]
- Baek S. The right to better argument: A review of the basic income debate. Economy and Society. 2020;128:12–57. doi: 10.18207/criso.2020..128.12. [DOI] [Google Scholar]
- Baek S, Kim S, Rhee T, Shin W. The consumption response to universal payments: Evidence from a natural experiment. Life Science. 2021 doi: 10.2139/ssrn.3838445. [DOI] [PMC free article] [PubMed] [Google Scholar]
- Baker, K. (2008). Do cash transfer programs improve infant health: Evidence from the 1993 expansion of the earned income tax credit [Unpublished manuscript]. University of Notre Dame
- Barber SL, Gertler PJ. Empowering women: How Mexico’s conditional cash transfer programme raised prenatal care quality and birth weight. Journal of Development Effectiveness. 2010;2(1):51–73. doi: 10.1080/19439341003592630. [DOI] [Google Scholar]
- Behrman JR, Rosenzweig MR. Returns to birthweight. Review of Economics and Statistics. 2004;86(2):586–601. doi: 10.1162/003465304323031139. [DOI] [Google Scholar]
- Black SE, Devereux PJ, Salvanes KG. From the cradle to the labor market? The effect of birth weight on adult outcomes. The Quarterly Journal of Economics. 2007;122(1):409–439. doi: 10.1162/qjec.122.1.409. [DOI] [Google Scholar]
- Bogin B, Varea C. COVID-19, crisis, and emotional stress: A biocultural perspective of their impact on growth and development for the next generation. American Journal of Human Biology. 2020 doi: 10.1002/ajhb.23474. [DOI] [PMC free article] [PubMed] [Google Scholar]
- Bozzoli C, Quintana-Domeque C. The weight of the crisis: Evidence from newborns in Argentina. Review of Economics and Statistics. 2014;96(3):550–562. doi: 10.1162/REST_a_00398. [DOI] [Google Scholar]
- Brodeur A, Gray D, Islam A, Bhuiyan S. A literature review of the economics of COVID-19. Journal of Economic Surveys. 2021;35(4):1007–1044. doi: 10.1111/joes.12423. [DOI] [PMC free article] [PubMed] [Google Scholar]
- Burlando A. Transitory shocks and birth weights: Evidence from a blackout in Zanzibar. Journal of Development Economics. 2014;108:154–168. doi: 10.1016/j.jdeveco.2014.01.012. [DOI] [Google Scholar]
- Camacho A. Stress and birth weight: Evidence from terrorist attacks. American Economic Review. 2008;98(2):511–515. doi: 10.1257/aer.98.2.511. [DOI] [PubMed] [Google Scholar]
- Carlson K. Fear itself: The effects of distressing economic news on birth outcomes. Journal of Health Economics. 2015;41:117–132. doi: 10.1016/j.jhealeco.2015.02.003. [DOI] [PubMed] [Google Scholar]
- Cho H, Lee YW. Multiple births and low birth weight: Evidence from South Korea. American Journal of Human Biology. 2021;2021:e23648. doi: 10.1002/ajhb.23648. [DOI] [PubMed] [Google Scholar]
- Chung W, Ha H, Kim B. Money transfer and birth weight: Evidence from the Alaska permanent fund dividend. Economic Inquiry. 2016;54(1):576–590. doi: 10.1111/ecin.12235. [DOI] [Google Scholar]
- Clark AE, D’Ambrosio C, Rohde N. Prenatal economic shocks and birth outcomes in UK cohort data. Economics & Human Biology. 2021;41:100964. doi: 10.1016/j.ehb.2020.100964. [DOI] [PubMed] [Google Scholar]
- Corno G, Villani D, de Montigny F, Pierce T, Bouchard S, Molgora S. The role of perceived social support on pregnant women’s mental health during the COVID-19 pandemic. Journal of Reproductive and Infant Psychology. 2022 doi: 10.1080/02646838.2022.2042799. [DOI] [PubMed] [Google Scholar]
- Currie J. Healthy, wealthy, and wise: Socioeconomic status, poor health in childhood, and human capital development. Journal of Economic Literature. 2009;47(1):87–122. doi: 10.1257/jel.47.1.87. [DOI] [Google Scholar]
- Currie J, Hyson R. Is the impact of health shocks cushioned by socioeconomic status? The case of low birthweight. American Economic Review. 1999;89(2):245–250. doi: 10.1257/aer.89.2.245. [DOI] [Google Scholar]
- Currie J, Moretti E. Biology as destiny? Short-and long-run determinants of intergenerational transmission of birth weight. Journal of Labor Economics. 2007;25(2):231–264. doi: 10.1086/511377. [DOI] [Google Scholar]
- Currie J, Neidell M, Schmieder JF. Air pollution and infant health: Lessons from New Jersey. Journal of Health Economics. 2009;28(3):688–703. doi: 10.1016/j.jhealeco.2009.02.001. [DOI] [PMC free article] [PubMed] [Google Scholar]
- Currie J, Rossin-Slater M. Weathering the storm: Hurricanes and birth outcomes. Journal of Health Economics. 2013;32(3):487–503. doi: 10.1016/j.jhealeco.2013.01.004. [DOI] [PMC free article] [PubMed] [Google Scholar]
- Devereux MP, Güçeri İ, Simmler M, Tam EH. Discretionary fiscal responses to the COVID-19 pandemic. Oxford Review of Economic Policy. 2020;36(1):S225–S241. doi: 10.1093/oxrep/graa019. [DOI] [Google Scholar]
- Dileep A, ZainAlAbdin S, AbuRuz S. Investigating the association between severity of COVID-19 infection during pregnancy and neonatal outcomes. Scientific Reports. 2022;12(1):1–7. doi: 10.1038/s41598-022-07093-8. [DOI] [PMC free article] [PubMed] [Google Scholar]
- Gaarder MM, Glassman A, Todd JE. Conditional cash transfers and health: Unpacking the causal chain. Journal of Development Effectiveness. 2010;2(1):6–50. doi: 10.1080/19439341003646188. [DOI] [Google Scholar]
- Hoynes HW, Miller DL, Simon D. Income, the earned income tax credit, and infant health. American Economic Journal: Economic Policy. 2015;7(1):172–211. [Google Scholar]
- Hoynes HW, Page M, Stevens AH. Can targeted transfers improve birth outcomes? Evidence from the introduction of the WIC program. Journal of Public Economics. 2011;95(7–8):813–827. doi: 10.1016/j.jpubeco.2010.12.006. [DOI] [Google Scholar]
- Joyce T. Self-selection, prenatal care, and birthweight among Blacks, Whites, and Hispanics in New York City. Journal of Human Resources. 1994;29(3):762–794. doi: 10.2307/146252. [DOI] [Google Scholar]
- Kim B, Carruthers CK, Harris MC. Maternal stress and birth outcomes: Evidence from the 1994 Northridge earthquake. Journal of Economic Behavior & Organization. 2017;140:354–373. doi: 10.1016/j.jebo.2017.05.014. [DOI] [Google Scholar]
- Kim EA. Social distancing and public health guidelines at workplaces in Korea: Responses to coronavirus disease-19. Safety and Health at Work. 2020;11(3):275–283. doi: 10.1016/j.shaw.2020.07.006. [DOI] [PMC free article] [PubMed] [Google Scholar]
- Kim MJ, Lee S. Can stimulus checks boost an economy under COVID-19? Evidence from South Korea. International Economic Journal. 2021;35(1):1–12. doi: 10.1080/10168737.2020.1864435. [DOI] [Google Scholar]
- Kim M, Oh Y. The impact of COVID-19 regional cash subsidies on the sales of local businesses in South Korea. KDI Journal of Economic Policy. 2021;43(2):103–123. [Google Scholar]
- Kim S, Koh K, Lyou W. Spending impact of COVID-19 stimulus payments: Evidence from card transaction data in South Korea. SSRN Electronic Journal. 2020 doi: 10.2139/ssrn.3701676. [DOI] [Google Scholar]
- Kramer MS. Determinants of low birth weight: Methodological assessment and meta-analysis. Bulletin of the World Health Organization. 1987;65(5):633–737. [PMC free article] [PubMed] [Google Scholar]
- Le K, Nguyen M. The impacts of rainfall shocks on birth weight in Vietnam. Journal of Development Effectiveness. 2021;2021:1–17. [Google Scholar]
- Lee C. In utero exposure to the Korean War and its long-term effects on socioeconomic and health outcomes. Journal of Health Economics. 2014;33:76–93. doi: 10.1016/j.jhealeco.2013.11.002. [DOI] [PubMed] [Google Scholar]
- Lee C. Intergenerational health consequences of in utero exposure to maternal stress: Evidence from the 1980 Kwangju uprising. Social Science & Medicine. 2014;119:284–291. doi: 10.1016/j.socscimed.2014.07.001. [DOI] [PubMed] [Google Scholar]
- Lee S, Orsini C. Girls and boys: Economic crisis, fertility, and birth outcomes. Journal of Applied Econometrics. 2018;33(7):1044–1063. doi: 10.1002/jae.2646. [DOI] [Google Scholar]
- Lin MJ, Liu EM. Does in utero exposure to illness matter? The 1918 influenza epidemic in Taiwan as a natural experiment. Journal of Health Economics. 2014;37:152–163. doi: 10.1016/j.jhealeco.2014.05.004. [DOI] [PubMed] [Google Scholar]
- Mansour H, Rees DI. Armed conflict and birth weight: Evidence from the al-Aqsa Intifada. Journal of Development Economics. 2012;99(1):190–199. doi: 10.1016/j.jdeveco.2011.12.005. [DOI] [Google Scholar]
- Negrato CA, Gomes MB. Low birth weight: Causes and consequences. Diabetology & Metabolic Syndrome. 2013;5(1):1–8. doi: 10.1186/1758-5996-5-49. [DOI] [PMC free article] [PubMed] [Google Scholar] [Retracted]
- Olafsson A. Household financial distress and initial endowments: Evidence from the 2008 financial crisis. Health Economics. 2016;25:43–56. doi: 10.1002/hec.3426. [DOI] [PubMed] [Google Scholar]
- Painter RC, Roseboom TJ, Bleker OP. Prenatal exposure to the Dutch famine and disease in later life: An overview. Reproductive Toxicology. 2005;20(3):345–352. doi: 10.1016/j.reprotox.2005.04.005. [DOI] [PubMed] [Google Scholar]
- Park S, Maher CS. Government financial management and the coronavirus pandemic: A comparative look at South Korea and the United States. The American Review of Public Administration. 2020;50(6–7):590–597. doi: 10.1177/0275074020941720. [DOI] [Google Scholar]
- Park SW, Sun K, Viboud C, Grenfell BT, Dushoff J. Potential role of social distancing in mitigating spread of coronavirus disease. South Korea. Emerging Infectious Diseases. 2020;26(11):2697–2700. doi: 10.3201/eid2611.201099. [DOI] [PMC free article] [PubMed] [Google Scholar]
- Pike IL. Maternal stress and fetal responses: Evolutionary perspectives on preterm delivery. American Journal of Human Biology. 2005;17(1):55–65. doi: 10.1002/ajhb.20093. [DOI] [PubMed] [Google Scholar]
- Pope J, Olander EK, Leitao S, Meaney S, Matvienko-Sikar K. Prenatal stress, health, and health behaviours during the COVID-19 pandemic: An international survey. Women and Birth. 2022;35(3):272–279. doi: 10.1016/j.wombi.2021.03.007. [DOI] [PMC free article] [PubMed] [Google Scholar]
- Preis H, Mahaffey B, Pati S, Heiselman C, Lobel M. Adverse perinatal outcomes predicted by prenatal maternal stress among US women at the COVID-19 pandemic onset. Annals of Behavioral Medicine. 2021;55(3):179–191. doi: 10.1093/abm/kaab005. [DOI] [PMC free article] [PubMed] [Google Scholar]
- Provenzi L, Grumi S, Altieri L, Bensi G, Bertazzoli E, Biasucci G, Anna C, Lidia D, Rossana F, Anna F, Barbara G, Roberta G, Roberto G, Elena G, Paola G, Maria LM, Paola M, MOM-COPE Study Group Prenatal maternal stress during the COVID-19 pandemic and infant regulatory capacity at 3 months: A longitudinal study. Development and Psychopathology. 2021 doi: 10.1017/S0954579421000766. [DOI] [PubMed] [Google Scholar]
- Quintana-Domeque C, Ródenas-Serrano P. The hidden costs of terrorism: The effects on health at birth. Journal of Health Economics. 2017;56:47–60. doi: 10.1016/j.jhealeco.2017.08.006. [DOI] [PubMed] [Google Scholar]
- Sheehan TJ. Stress and low birth weight: A structural modeling approach using real life stressors. Social Science & Medicine. 1998;47(10):1503–1512. doi: 10.1016/S0277-9536(98)00236-6. [DOI] [PubMed] [Google Scholar]
- Strully KW, Rehkopf DH, Xuan Z. Effects of prenatal poverty on infant health: State earned income tax credits and birth weight. American Sociological Review. 2010;75(4):534–562. doi: 10.1177/0003122410374086. [DOI] [PMC free article] [PubMed] [Google Scholar]
- Torche F. The effect of maternal stress on birth outcomes: Exploiting a natural experiment. Demography. 2011;48(4):1473–1491. doi: 10.1007/s13524-011-0054-z. [DOI] [PubMed] [Google Scholar]
- Vousden N, Ramakrishnan R, Bunch K, Morris E, Simpson N, Gale C, O’Brien P, Quigley M, Brocklehurst P, Kurinczuk JJ, Knight M. Management and implications of severe COVID-19 in pregnancy in the UK: data from the UK obstetric surveillance system national cohort. Acta Obstetricia Et Gynecologica Scandinavica. 2022;101(4):461–470. doi: 10.1111/aogs.14329. [DOI] [PMC free article] [PubMed] [Google Scholar]
- Wadhwa PD, Sandman CA, Porto M, Dunkel-Schetter C, Garite TJ. The association between prenatal stress and infant birth weight and gestational age at birth: A prospective investigation. American Journal of Obstetrics and Gynecology. 1993;169(4):858–865. doi: 10.1016/0002-9378(93)90016-C. [DOI] [PubMed] [Google Scholar]
- Weinstock M. The potential influence of maternal stress hormones on development and mental health of the offspring. Brain, Behavior, and Immunity. 2005;19(4):296–308. doi: 10.1016/j.bbi.2004.09.006. [DOI] [PubMed] [Google Scholar]
- Woo S, Aum S, Kim D, Moon H, Lee S. Consumption response to Seoul’s COVID-19 shopping coupons: Evidence from consumer data. SSRN Electronic Journal. 2021 doi: 10.2139/ssrn.3913023. [DOI] [Google Scholar]
- Yang J. Universal basic income as obstacle to welfare state development. Economy and Society. 2020;128:58–77. doi: 10.18207/criso.2020..128.58. [DOI] [Google Scholar]
- You J. Lessons from South Korea’s COVID-19 policy response. The American Review of Public Administration. 2020;50(6–7):801–808. doi: 10.1177/0275074020943708. [DOI] [Google Scholar]