Abstract
Hyperpolarized carbon-13 magnetic resonance imaging is a promising technique for in vivo metabolic interrogation of alterations between health and disease. This study introduces a formalism for quantifying the metabolic information in hyperpolarized imaging. This study investigated a novel perfusion formalism and metabolic clearance rate (MCR) model in pre-clinical stroke and in the healthy human brain. Simulations showed that the proposed model was robust to perturbations in T1, transmit B1, and kPL. A significant difference in ipsilateral vs contralateral pyruvate derived cerebral blood flow (CBF) was detected in rats (140 ± 2 vs 89 ± 6 mL/100 g/min, p < 0.01, respectively) and pigs (139 ± 12 vs 95 ± 5 mL/100 g/min, p = 0.04, respectively), along with an increase in fractional metabolism (26 ± 5 vs 4 ± 2%, p < 0.01, respectively) in the rodent brain. In addition, a significant increase in ipsilateral vs contralateral MCR (0.034 ± 0.007 vs 0.017 ± 0.02/s, p = 0.03, respectively) and a decrease in mean transit time (31 ± 8 vs 60 ± 2 s, p = 0.04, respectively) was observed in the porcine brain. In conclusion, MCR mapping is a simple and robust approach to the post-processing of hyperpolarized magnetic resonance imaging.
Subject terms: Physiology, Medical research, Neurology
Introduction
Hyperpolarized carbon-13 (13C) Magnetic Resonance Imaging (MRI) is a metabolic imaging technique that can be used to dynamically image metabolic pathways in vivo1. Currently, the only technique that can be used clinically is known as ‘Dynamic Nuclear Polarization’ (DNP). This method provides a transient boost in 13C nucleus MR signal through the transfer of spin polarization through the combination of a large (> 3 T) magnetic field, a source of free electrons, a helium bath (< 1.4 K) and a microwave source2. Upon completion of the DNP process, the 13C labelled molecule is rapidly brought to room temperature, neutralized with a buffer, and injected into the participant, with subsequent imaging3. The clinical translation of hyperpolarized [1-13C]pyruvate MRI is currently ongoing at sites around the world4–9. The method has already shown its value in the pre-clinical setting in various pathologies such as brain tumors9–11, breast cancer5,12, cardiovascular disease13–15, and inflammation16; and the clinical value of this technology is in the process of being demonstrated17–24. Previous studies have proposed apparent rate constants25,26, time-to-peak27, and area-under-the-curve28 as quantitative surrogates for apparent metabolic activity. One of the most popular approaches to quantifying data is to divide the summed signal from a metabolite (for example [1-13C]lactate, by the total observed substrate, for example, [1-13C]pyruvate). In this study, a perfusion formalism currently used in both 1H perfusion MRI and in Positron Emission Tomography (PET), is applied to hyperpolarized imaging to provide a complementary quantifiable measure of the hyperpolarized data. Indeed, one major obstacle to clinical translation is the lack of general consensus on the acquisition and analysis of hyperpolarized data. Primarily, this challenge is due to the nature of the observed signal being a complicated mixture of unknown origin, in particular a lack of sensitivity to individual cell specific metabolic signals, and, therefore, it is difficult to develop quantifiable measures that allow general comparison across sites and species3. The approach used in this study is based upon commercially available software, allowing for the rapid introduction of the method into clinical studies, and may help tackle this challenge.
The general premise behind the approach used in this study is that the passage of a hyperpolarized contrast agent injected into the body can be tracked through time, and the subsequent change in MRI signal post-processed to estimate quantitative perfusion-related parameters. These parameters include: the volume of hyperpolarized contrast agent in a given location (sometimes referred to as ‘Cerebral Blood Volume’ or CBV), flow speed of the hyperpolarized contrast agent (Cerebral Blood Flow or CBF), time taken to reach peak concentration (TTP), the mean time that the hyperpolarized contrast agent spends in the vascular system (MTT), the signal decay (T1) and the rate of metabolic consumption of the hyperpolarized contrast agent29. In the case of a non-metabolized, non-hyperpolarized contrast agent, such as gadolinium, the last two terms are ignored.
The metabolic clearance rate
The metabolic clearance rate (MCR) can be defined as the amount of hyperpolarized contrast agent that leaves a given tissue, either by metabolic conversion or by flow. The MCR parameter is used in positron emission tomography (PET) imaging, where the effective decay of radioactive signal is attributed to the metabolic conversion of the tracer of interest30. MCR has been shown to correlate with myocardial and renal oxidative metabolism31,32 and, as such, offers a quantitative measure of the metabolic status of tissue in vivo.
An approach for determining the metabolic clearance rate has been demonstrated, which utilizes the mean transit time (MTT) of the hyperpolarized contrast agent concentration (C(t)) in tissue33:
| 1 |
where Ci is the signal in a voxel at a given time, and CAIF is the signal of an arterial input function assumed to be free from any metabolic interaction. Thus, the fraction of [1-13C]pyruvate turnover in a hyperpolarized experiment can be written as a linear combination of the contribution of perfusion and the metabolic decay.
| 2 |
where k is the metabolic clearance rate (/s). It is known that estimations of the MTT of a hyperpolarized contrast agent needs to be corrected for radiofrequency (RF) decay33. However, the calculation of the flow of a hyperpolarized contrast agent through a voxel is independent of RF decay. As a hyperpolarized experiment relies on supraphysiological concentrations of the agent, and under the assumption that the intracellular levels of pyruvate are small, it can be assumed that intracellular pyruvate is very small in comparison to the large extracellular signal. Therefore, [1-13C]pyruvate may be considered a “surrogate” first-pass perfusion marker with limited metabolic conversion of the pyruvate pool in the blood. Thus, it can be assumed that the MTT of pyruvate is approximately that of a gadolinium or arterial spin labelling experiment. Thus, if the estimated MTT for [1-13C]pyruvate and from a perfusion experiment are not equal, this implies that metabolism is affecting the apparent passage of the hyperpolarized contrast agent. Therefore, a final extension to (2) is to combine the k Gadolinium and kPyruvate to produce ‘Metabolic Clearance Rate’ (MCR) maps:
| 3 |
However, as the MTT in a hyperpolarized experiment needs to be corrected for T1-mediated signal decay33, which can be confounded with the many complexities of understanding transmit B1 inhomogeneity and regional variations in T134, it may be easier to consider the blood flow differences between a gadolinium and pyruvate experiment, given that flow (mL/100 g/min) is not confounded by RF inhomogeneity.
Considering the contribution of perfusion and metabolism is particularly important in situations with reduced blood flow, as there may be cases where metabolism is maintained or changed35. If CBFPyruvate CBFGadolinium, this implies that metabolism is affecting the pyruvate signal.
Therefore, combining CBFGadolinium and CBFPyruvate could be used to determine the relative contribution of metabolism and perfusion to the pyruvate signal via:
| 4 |
where FM is termed the ‘fractional metabolism’, CBFGadolinium and CBFPyruvate are the Cerebral Blood Flow measurements of the gadolinium derived and pyruvate perfusion imaging, respectively.
This study combined data from pre-clinical small and large animal experiments, and human hyperpolarized imaging to demonstrate the potential use of metabolic clearance rate mapping in the brain.
Results
Simulation analysis
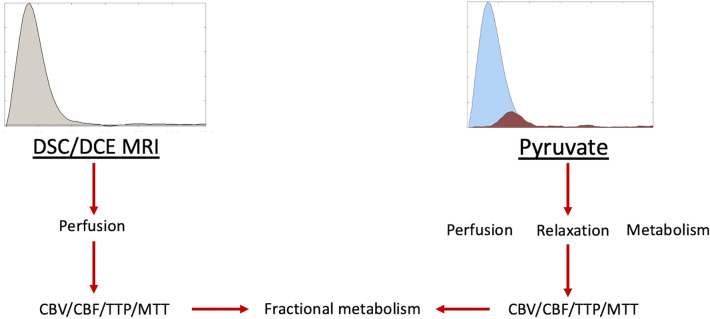
An overview of the methodology used in this study is shown in Fig. 1, with an example of simulated curves for pyruvate and lactate shown in Fig. 2. Simulation perturbations revealed differing effects upon the final estimated CBV/CBF/MTT depending on the signal-to-noise ratio (SNR), radiofrequency transmit inhomogeneity (B1+), [1-13C]pyruvate T1, and metabolic consumption rate (kPL) assumed.
Figure 1.
An example overview of the processing used in this methodology. The graph on the left side of the figure demonstrates the change in relative T1 or R2* observed in a DSC/DCE experiment. The graph on the left demonstrates the signal time course of [1-13C]pyruvate (blue) and subsequent exchange to [1-13C]lactate (brown) observed in a hyperpolarized experiment. The text shows the flow of data from each experiment for the Metabolic Clearance Rate formalism.
Figure 2.
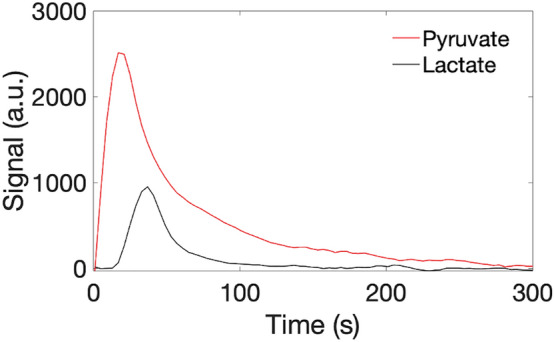
Example simulated metabolic curves for intracellular pyruvate (red) and lactate (black). T1Pyruvate, T1Lactate, TR, kPL, and SNR are assumed to be 35 s, 30 s, 4 s, 0.012/s, and 100, respectively.
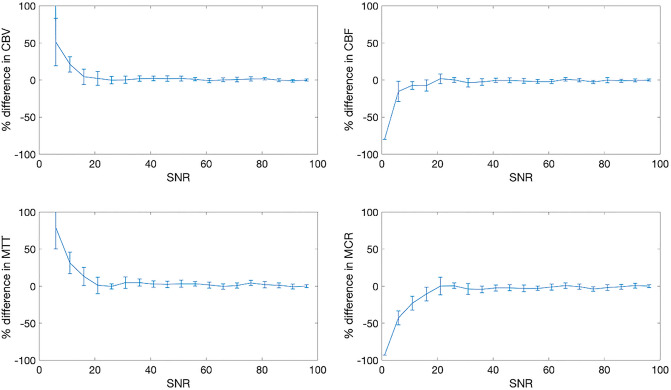
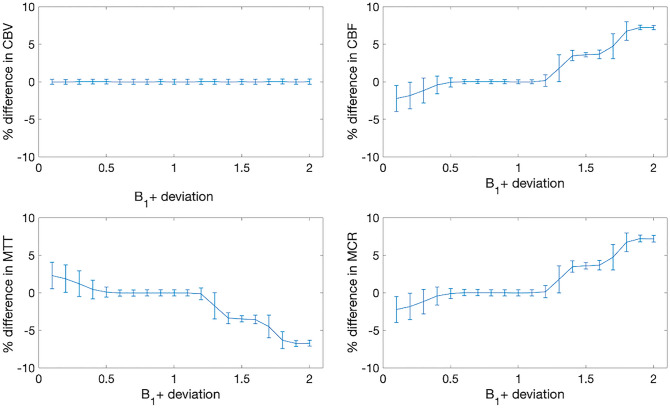
Perturbing [1-13C]pyruvate SNR showed minimal alterations in the calculated CBV, CBF, and MTT—with results showing less than 10% error at an SNR as low as 6 in all parameters (see Fig. 3). Further perturbations to the transmit B1 error at a low flip angle (10°) show that this method is very stable for CBV. However, CBF, MTT, and MCR were affected by B1+ deviation from the nominal flip angle (see Fig. 4), with the maximum deviation being 8%.
Figure 3.
Simulation results demonstrating relative model stability down to SNR of 15 for all parameters. T1pyruvate, kPL, flip angle, and B1 error are assumed to be 35 s, 0/s, 10°, and a factor of 1, respectively.
Figure 4.
Simulation results demonstrating relative model stability for all parameters due to B1+ deviation. T1pyruvate, kPL, flip angle, and SNR are assumed to be 35 s, 0, 10°, and 100, respectively.
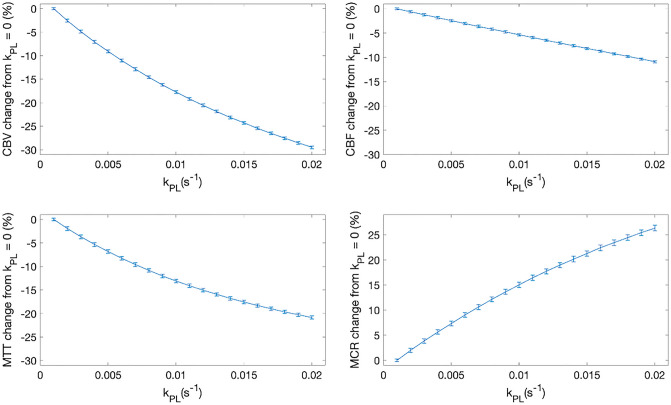
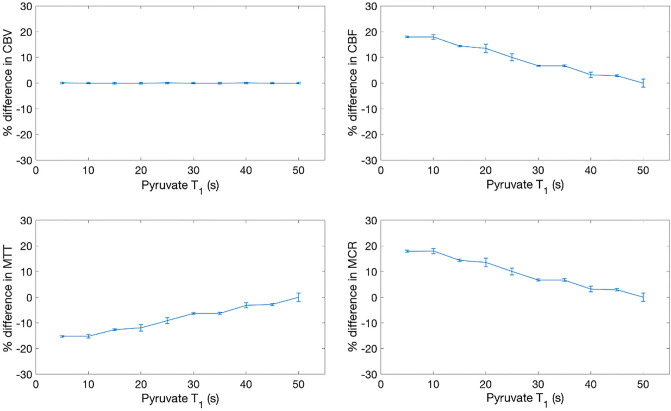
Varying kPL revealed a subsequent decrease in CBV, CBF, and MTT—with a maximum difference of − 28%, − 10%, and − 20% for CBV, CBF and MTT, respectively. MCR rose with increasing kPL, to a maximum increase of 27% at kPL = 0.02/s, graphically shown in Fig. 5. Varying the assumed T1 of [1-13C]pyruvate revealed that the CBF, MTT, and MCR varied approximately linearly, as shown in Fig. 6.
Figure 5.
Simulation results demonstrating sensitivity of the model to kPL. T1pyruvate, B1+ deviation, flip angle, and B1 error are assumed to be 35 s, 1, 10°, and 1, respectively.
Figure 6.
Simulation results demonstrating model variation with pyruvate T1 across all parameters. kPL, flip angle, SNR, and B1 error are assumed to be 0, 10°, 100, and 1, respectively.
Varying the AIF to tissue input function (TIF) size showed very little change in FM when the AIF was much greater (> 75 × TIF) but high variation in FM as the AIF approached TIF amplitude (FM > 20% at AIF/TIF < 20), see Fig. 7.
Figure 7.
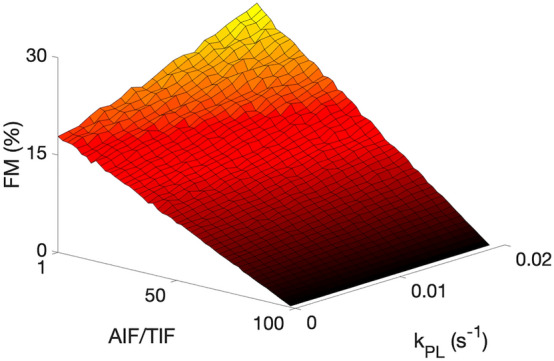
Simulation results showing the variation in FM (%) as both AIF/TIF and kPL are varied. SNR and B1 error are assumed to be 100, and 1, respectively. Generally, an increase in metabolism is observed as perfusion decreased and kPL increased.
Image analysis
Pre-clinical imaging was successful across species, with variations in metabolic and perfusion parameters seen in the post-stroke brain.
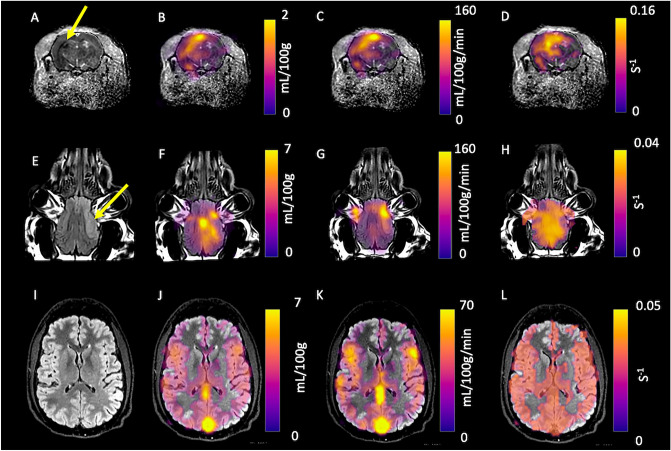
Example post-stroke rodent imaging can be seen in Fig. 8, where ADC (A), CBV (B,F,J), CBF (C,G,K), and MCR (D,H,L) are shown. There was a significant difference between the ipsilateral and contralateral brain in the rodent model of stroke for CBFpyruvate (140 ± 2 vs 89 ± 6 mL/100 g/min, p < 0.01, respectively), CBFDSC (106 ± 8 vs 86 ± 5 mL/100 g/min, p = 0.03, respectively), Lactate:Pyruvate (2.7 ± 0.2, vs 2.1 ± 0.2, p = 0.05, respectively) and FM (26 ± 5 vs 4 ± 2%, p = 0.04, respectively). Detailed results are provided in Table 1.
Figure 8.
Parametric mapping demonstrated in a rodent and procine models of stroke. The lesion (denoted by the yellow arrow on Apparent Diffusion Coefficient (A) and T2 FLAIR weighted imaging (E), with CBV (B and F, respectively), CBF (C and G, respectively), and MCR (D and H, respectively). Also, parametric mapping of the healthy human brain is shown: T2 FLAIR (I), CBV (J), CBF (K), and MCR (L).
Table 1.
Results from ROI analysis from the rodent model of stroke.
| Feature | Ipsilateral | Contralateral | p-value |
|---|---|---|---|
| TTPPyruvate (s) | 4.5 ± 0.6 | 3.9 ± 0.2 | >0.05 |
| TTPDSC (s) | 6 ± 0.5 | 7 ± 0.5 | > 0.05 |
| CBVPyruvate (mL/100g) | 1.5 ± 0.4 | 0.9 ± 0.01 | > 0.05 |
| CBVDSC (mL/100g) | 4.8 ± 0.5 | 4.1 ± 0.9 | > 0.05 |
| CBFPyruvate (mL/100g/min) | 140 ± 2 | 89 ± 6 | < 0.01* |
| CBFDSC (mL/100g/min) | 106 ± 8 | 86 ± 5 | 0.03* |
| MTTPyruvate (s) | 6 ± 1 | 6 ± 1 | > 0.05 |
| MTTDSC (s) | 1.4 ± 0.3 | 0.97 ± 0.04 | > 0.05 |
| MCR (/s) | 0.17 ± 0.04 | 0.16 ± 0.01 | > 0.05 |
| Lactate:Pyruvate | 2.7 ± 0.2 | 2.1 ± 0.2 | 0.04* |
| FM (%) | 26 ± 5 | 4 ± 2 | < 0.01* |
* Statistically significant.
Example T2 FLAIR (8E), CBV (8F), CBF(8G), and MCR (8H) from porcine imaging are also shown. There was a significant difference between ipsilateral and contralateral CBFpyruvate (139 ± 12 vs 95 ± 5 mL/100 g/min, p = 0.003, respectively), CBFDSC (116 ± 24 vs 63 ± 40, p = 0.03, respectively), MTTpyruvate (31 ± 8 vs 60 ± 2, p = 0.04, respectively), MCR (0.034 ± 0.007 vs 0.017 ± 0.02/s, p = 0.03, respectively) and Lactate:Pyruvate (1.09 ± 0.07 vs 0.70 ± 0.06, p < 0.01), respectively). Detailed results are provided in Table 2.
Table 2.
Results from ROI analysis from the porcine model of stroke.
| Feature | Ipsilateral | Contralateral | p-value |
|---|---|---|---|
| TTPPyruvate (s) | 22 ± 3 | 24 ± 4 | > 0.05 |
| TTPDSC (s) | 9.7 ± 0.9 | 9.7 ± 0.9 | > 0.05 |
| CBVPyruvate (mL/100g) | 7 ± 2 | 6 ± 2 | > 0.05 |
| CBVDSC (mL/100g) | 3.0 ± 0.8 | 1.9 ± 0.4 | > 0.05 |
| CBFPyruvate (mL/100g/min) | 139 ± 12 | 95 ± 5 | 0.003* |
| CBFDSC (mL/100g/min) | 116 ± 24 | 63 ± 40 | 0.03* |
| MTTPyruvate (s) | 31 ± 8 | 60 ± 2 | 0.006* |
| MTTDSC (s) | 3 ± 0.5 | 2.6 ± 0.4 | > 0.05 |
| MCR (/s) | 0.034 ± 0.007 | 0.017 ± 0.02 | 0.03* |
| Lactate:Pyruvate | 1.09 ± 0.07 | 0.70 ± 0.06 | 0.004* |
| FM (%) | 20 ± 6 | 19 ± 11 | > 0.05 |
* Statistically significant.
The human imaging was completed successfully, with example T2 FLAIR(8I), CBV(8J), CBF(8K), and MCR(8L) images shown. A significant positive correlation between pyruvate and ASL rCBF was found in the healthy human brain (r = 0.81, p = 0.02), with results shown in Fig. 9.
Figure 9.
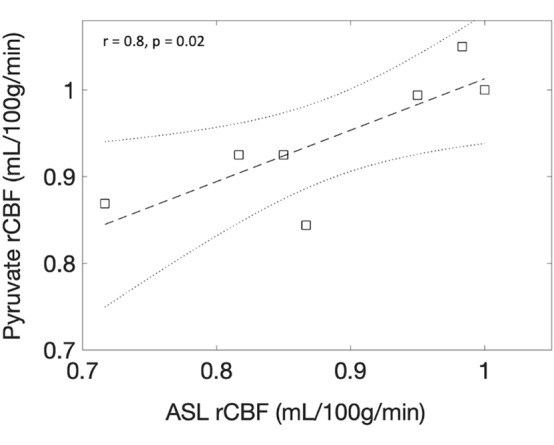
Correlation results from rCBF analysis from the healthy human brain demonstrating a strong correlation between ASL rCBF and pyruvate rCBF.
Discussion
The main finding in this study is the ability to achieve a quantitative analysis of hyperpolarized 13C metabolic imaging data using the metabolic clearance rate formalism utilized in PET36. This method is readily implemented, allows for future comparison across sites and between species as demonstrated in both a porcine and rodent model of stroke, and thus supports the progress towards human application in the clinical setting. The method is simple, and the simulation shows that it is both reliable and reproducible across a number of potential perturbations to the assumed model. Indeed, it is of note that the model assumes that the T1 of pyruvate is constant both in the blood and in tissue, specifically this approach has assumed that the fast-exchange regime holds27. Specifically, [1-13C] pyruvate T1 in blood appears to vary from 30 to 40 s37.
The metabolic clearance rate formalism extends the sensitivity and specificity of hyperpolarized MR by adding additional information and thus supports additional contrasts for multi-parametric mapping. The fact that the supra-physiological pyruvate signal seems to reflect cerebral perfusion also supports the use of the perfusion measures directly in the analysis. Indeed, a further advantage of using the pyruvate signal is that high-resolution imaging can be performed due to the relatively strong signal from the substrate, in comparison to its downstream low-signal metabolites38. Further comparison of model-free deconvolution with modelled solutions using gamma-variate functions could be performed39, however the use of model-free deconvolution imposes fewer restrictions on the outcome and thus supports the translation of the method. A particular observation is that the model stability in Fig. 4 is not completely symmetric around a B1 error of 1. This could be due to the non-linear changes to apparent T1 due to RF irradiation, and so produces an asymmetric effect on model parameters27. This highlights the need for accurate measurements of transmit B1 to reduce errors in hyperpolarized MRI.
The introduction of this methodology to the field of hyperpolarized 13C MRI provides quantitative imaging that is akin to that already used in the clinic, notably derived from Arterial Spin Labeling or gadolinium-enhanced MRI40,41. Indeed, this approach may prove to be a translation steppingstone for adoption into the clinic, with a focus on imaging outputs that are similar to those already produced and reported. Indeed, the quantitation of CBV and CBF by gadolinium-enhanced imaging is already extensively undertaken in stroke and brain tumors29,42, with perfusion known to play a key role in understanding tissue recruitment to the ischemic core (in the case of stroke) or tumor aggressiveness43. Of note, the absolute difference in calculated CBF and CBV between perfusion-weighted and hyperpolarized imaging may be derived from the difference in bolus size, leading to a difference in stress response and/or bioavailability of the substrate in comparison to gadolinium, and this warrants further investigation.
The main limitation of this method is the need for a full sampling of the time course of the hyperpolarized contrast agent, limiting the window of opportunities for selective acquisition schemes, such as chemical shift imaging (CSI), commonly acquiring only one single time point. However, the need to only acquire the injected high SNR substrate simplifies and improves the experimental protocol significantly and combines well with clinical perfusion imaging, which is routinely collected in a number of pathologies. Furthermore, most clinical sites are currently opting for dynamic acquisition protocols for hyperpolarized MRI, and so this may not prove to be a large barrier to community adoption of this methodology. Indeed, further validation of this approach to post-processing and quantification of hyperpolarized 13C data is needed, especially using multi-site data within and beyond the brain. Indeed, it is noted that this method does not explicitly distinguish between the downstream pathways that are changed due to pathology, for example, elevated [1-13C]lactate labeling or changes in 13C Bicarbonate production but provides potentially complementary information to more targeted measures (such as Lactate:Pyruvate ratio). The variability in measurements of metabolism using different acquisition approaches is yet unknown and is a key hurdle to surpass for the further adoption of this imaging method. Finally, a limitation may be that this approach requires a perfusion-weighted sequence to be acquired for each examination. However, as perfusion MRI is routinely performed for a number of pathologies, this may not prove to be too burdensome44. Indeed, it is of importance that the standard clinical imaging protocol is acquired to assess the added value of hyperpolarized MRI in clinical practice in future studies.
Further investigation and assessment of the added clinical benefit of the MCR and FM formalism, in comparison to kPL and ratiometric measures of metabolism, is needed—and this will be a vital component for future clinical radiological studies using hyperpolarized MRI. An additional assessment of the repeatability and reproducibility of the formalism in both pre-clinical and clinical studies is also needed. Indeed, the actual added clinical value of the technique needs to be further studied, and there is a promise for the method to detect early response to therapy in Breast Cancer45, amongst other diseases. Finally, it is of note that this study did not determine the cause of the increase of metabolism in the rodent brain post-stroke; however, it could be due to activated microglia or astrocytes46.
Methods
Simulations
All simulations were performed in Matlab (The Mathworks, MI, 2019a). Initially, the hyperpolarized pyruvate time course was simulated using a step function arterial input function (AIF) with ongoing radiofrequency and metabolic (kPL) and T1 mediated decay for 200 s.
Simulated data were processed using a Matlab implementation of model-free deconvolution47, assuming regularization of 0.1. All simulations were run 1000 times per perturbation (perturbations described below).
To understand model stability, model input variables were perturbed one at a time, and the resulting Cerebral Blood Flow (mL/100 g/min), Cerebral Blood Volume (mL/100 g), Mean Transit Time (s) and metabolic clearance rate (MCR, /s) error (compared to non-perturbed data) was calculated as per Eq. (5).
| 5 |
Data (perfect AIF) assumes flip angle = 10°, T1 = 35 s, Signal to noise ratio (SNR) = 100, Transmit B1 error = 1, and kPL = 0.
AIF perturbations
Perturbations included: random noise was added to each time course to give SNR (as defined as the peak signal of the pyruvate curve divided by the standard deviation of the noise at the end of the experiment) varying from 1 to 100. kPL was varied from 0 to 0.04 (/s) in steps of 0.001 (/s) (here the tissue concentration of pyruvate was assumed to be 100 times lower than the AIF (extracellular) pyruvate concentration). Transmit B1 deviation was varied from 0.1 to 2× nominal flip angle (two simulations: 10° and 30°) in steps of 0.1.
Simulations compared calculated CBV, CBF, and MTT for each kPL step to kPL = 0 data as per Eq. (4).
A final simulation was run to assess the sensitivity of FM calculations using a non-metabolized AIF that was scaled in size from 100 × Tissue Input Function (TIF), pyruvate in the intracellular space, amplitude to the AIF amplitude. Simultaneously, kPL was varied as above for the TIF. The AIF and TIF were used to calculate the FM.
Pre-clinical experiments
Animal experiments
All rodent experiments were conducted in accordance under license and ethical review granted by the UK Home Office (rodent experiments) or the Danish animal inspectorate regulations (porcine experiments), all experiments were performed in accordance with appropriate guidelines and regulations, with appropriate clearance through relevant ethical committees, and are reported in accordance with the ARRIVE guidelines. 3 male Wistar rats were anaesthetized with isoflurane, and heads were fixed in a stereotaxic frame. A burrhole was drilled (coordinates relative to bregma, AP + 0.1, ML − 0.3, SI − 0.4 mm), and a fine glass capillary was inserted into the striatum. 1 μL of Endothelin-1 was injected over 2 min, with the capillary withdrawn and the scalp sutured. Rodents were allowed to recover with food and water ad libitum for 3 days prior to imaging.
Pigs (n = 3, 36–44 kg) were subjected to stroke. Pigs were anaesthetized with propofol and fentanyl. A burrhole was drilled (1.5 cm from the midline just behind the orbit), and 30 µg ET-1 in 200 µl saline was injected over 10 min through a 30-gauge needle48. The animals were then imaged after 3–4 h.
Hyperpolarization protocol
[1-13C]EthylPyruvate (Cambridge Isotopes) was polarized. Briefly, a batch of [1-13C]Ethylpyruvate was mixed with AH111501 (Syncom, NL) to a concentration of 15 mmol/L. 15 μL of Dotarem dissolved in ethanol (2:100% volume to volume) was added to the batch. 90 µL of Ethyl pyruvate was polarized for 45 min in a prototype polarizer (Alpha System, Oxford Instruments) prior to dissolution with 4.5 mL of sodium hydroxide as previously described49. 1 mL of hyperpolarized solution was injected over approximately 4 s with a 300 µL saline chase.
Rodent imaging
Rodent imaging was performed using a 7 T MRI system (Agilent magnet). Rats were anesthetized on day 3 post-surgery with 2.5% isoflurane and 60:40% O2:N2O)35, a tail vein cannula inserted, and placed in a cradle with a 2 channel 13C receive array (Rapid Biomedical, Rimpar, Germany). Animals were maintained at 2% isoflurane in the magnet with heated air to maintain core temperature. Proton localizers and a 3D RF and gradient spoiled gradient echo (Field of view (FOV) = 60 mm3, acquisition matrix = 256 × 256 × 64, reconstruction matrix = 512 × 512 × 64, repetition time (TR) = 4 ms, Echo time (TE) = 2 ms, flip angle (FA) = 10°, averages = 2) imaging was performed using the 1H/13C body coil for transmit and receive. 13C imaging was performed as previously described49. Briefly, a multi-echo spiral with interleaved free induction decay (FOV = 40 mm2, TR (per echo time) = 500 ms, FA = 15°, acquisition matrix = 40 × 40, reconstruction matrix = 128, slice thickness = 20 mm, Temporal resolution = 4 s, total number of time steps = 30) was acquired with iterative decomposition using least-squares estimation (IDEAL) from the time of injection as previously described49. Images were reconstructed using explicit calculation of the Fourier matrix and a non-uniform fast Fourier transform.
Subsequently, animals were transferred to a separate cradle for further proton imaging using a 4-channel receive array (Rapid Biomedical, Rimpar, Germany). The cradle featured integrated anaesthetic gas delivery, rectal thermometry, MR-compatible electrical heating, and respiration monitoring, based on designs described elsewhere50–52.
The protocol included 3D RF and gradient spoiled gradient echo (as above but with FOV = 40 mm3, TR = 5.71 ms, TE = 2.87 ms, FA = 12°), 2D T2 weighted imaging (FOV = 40 mm2, TR = 2000 ms, TE = 30 ms, echo train length = 2, averages = 4, matrix = 128 × 128, slice thickness = 0.62 mm, reconstruction matrix = 256 × 256), diffusion weighted imaging (FOV = 40 mm2, TR = 2000 ms, TE = 30 ms, echo train length = 2, averages = 4, matrix = 128 × 128, slice thickness = 0.62 mm, reconstruction matrix = 256 × 256, b values = 0, 1000), and perfusion weighted imaging (FOV = 35mm2, matrix = 128 × 64, slice thickness = 0.62 mm, TE = 10 ms, TR = 20 ms, flip angle = 20°, temporal resolution = 1 s, timepoints before injection of contrast = 3, gadolinium agent = Dotarem, bolus volume = 200 µL)53.
Porcine imaging
The porcine data were acquired on a 3 T system (MR750, GE Healthcare, WI). A commercial flexible array coil was used for proton imaging (GE Healthcare, WI), while a home-built 14-channel receive coil combined with a commercial transmit (RAPID Biomedical) was used for carbon imaging. After injection of hyperpolarized [1-13C] pyruvate (0.875 ml/kg at 5 mL/s of 250 mM pyruvate, 20 mL saline chase) in the femoral vein, spectral-spatial imaging was performed (6°/37° flip angles on pyruvate/metabolites). A stack-of-spirals readout was employed for four slices with 10 × 10 × 15 mm3 resolution. The temporal resolution was 960 ms for pyruvate. T1- and T2-FLAIR weighted images were acquired for anatomical reference & a dynamic susceptibility contrast using 2D gradient echo planar imaging exam performed (TR = 800 ms, TE = 25 ms, flip angle = 30°, FOV = 240 mm2, slice thickness = 4 mm, slice gap = 5 mm, acquisition matrix = 128 × 128).
Human imaging
Human examinations were performed after approval from the Ethics Committee of Central Denmark and the Danish Medicine Agency (EudraCT: 2020-000352-36) and were performed in accordance with relevant guidelines and regulations. After providing informed consent, a volunteer underwent MRI with hyperpolarized [1-13C] pyruvate (male, 38 years). The examination was performed on a 3 T scanner (MR750, GE Healthcare, WI) using a dual-tuned 1H/13C birdcage transceiver coil. Hyperpolarized [1-13C] pyruvate was produced according to good manufacturing practice and injected in the antecubital vein (0.43 mL/s at 5 mL/s of 250 mM pyruvate, 20 mL saline flush). A spectral-spatial excitation (flip angles = 12°/70°, TR = 500 ms, TE = 10 ms) was combined with a variable-resolution spiral readout (8.75 × 8.75 mm2 for pyruvate, 17.5 × 17.5 mm2 for metabolites). Six slices of 20 mm were acquired with a temporal resolution of 2 s. In addition to 13C-imaging, T1-weighted images were acquired for anatomy, and a pseudo-continuous arterial spin labeling sequence was employed for assessment of cerebral blood flow (3D spiral, 3.6 × 3.6 × 3.6mm3, 2025 ms post label delay, TR = 4.5 s, TE = 9.8 ms).
Image post-processing and analysis
Perfusion weighted and hyperpolarized imaging were processed with model-free deconvolution54 using block-circular deconvolution with in-house reconstruction pipelines in Matlab (2019a, The Mathworks, USA). Voxels below a signal (defined as the summed signal from the 13C EthylPyruvate or pyruvate imaging) to noise (defined as a region outside of the brain and body) ratio of 5 were excluded. A region of interest (ROI) was drawn in the supplying vessels of the rat and pig by a physicist with 9 years of experience in neuroimaging, and the ROI for the clinical exam was placed by a neuroradiologist.
3D gradient echo images were used for image co-registration in the rodent case. The signal from the [1-13C]Ethyl pyruvate and [1-13C]pyruvate were used for rodent and porcine/human processing, respectively. The final images consisted of CBV, CBF, MTT, Time to peak (TTP), and MCR.
Perfusion-weighted imaging processing was performed in the same manner to hyperpolarized imaging, with signal defined from the pre-contrast injection images, with CBF, CBV, MTT, and TTP maps calculated. Images were overlaid on T2 weighted imaging for all studies. ROIs were drawn in the ipsilateral and contralateral hemispheres for both the porcine and rodent imaging, using the perfusion-weighted imaging and T2 for guidance, and used for all subsequent statistical analysis.
For the clinical exam, relative CBF results, using an ROI placed in deep grey matter to normalize data, were calculated from ASL and [1-13C]Pyruvate imaging for the healthy human brain. ROIs were placed in various regions of deep grey matter and the spinal column.
Statistical analysis
Statistical analysis was performed in R (4.1.0, The R project). The difference in the metabolic and perfusion weighed imaging parameters between ipsilateral and contralateral regions in the rodent and porcine brain was calculated using the Wilcoxon test. The correlation between ASL and pyruvate rCBF was calculated using a linear model. A p-value below 0.05 was considered significant.
Acknowledgements
James Grist is funded by an EU Horizon 2020 Grant “Alternatives to Gd”, Grant/Award Number: 858149, Damian Tyler would like to acknowledge the British Heart Foundation (Grant/Award Number: FS/19/18/34252), Christoffer Laustsen would like to acknowledge the Lundbeck foundation.
Author contributions
Study design: J.T.G., C.L., N.B. Data acquisition: J.T.G., Y.C., N.B., A.M.S., R.H., V.B., S.S. Data processing: J.T.G., N.B. Statistical Analysis: J.T.G. Manuscript preparation and review: J.T.G., N.B., E.S.S.H., A.M.S., R.H., V.B., J.J.J.J.M., S.S., Y.C., A.B., D.J.T., C.L.
Data availability
All data are available upon request to the corresponding author.
Competing interests
The authors declare no competing interests.
Footnotes
Publisher's note
Springer Nature remains neutral with regard to jurisdictional claims in published maps and institutional affiliations.
These authors contributed equally: Damian J. Tyler and Christoffer Laustsen.
References
- 1.Zaccagna F, et al. Hyperpolarized carbon-13 magnetic resonance spectroscopic imaging: A clinical tool for studying tumour metabolism. Br. J. Radiol. 2018;91:20170688. doi: 10.1259/bjr.20170688. [DOI] [PMC free article] [PubMed] [Google Scholar]
- 2.Hurd RE, Yen Y-F, Chen A, Ardenkjaer-Larsen JH. Hyperpolarized 13C metabolic imaging using dissolution dynamic nuclear polarization. J. Magn. Reson. Imaging. 2012;36:1314–1328. doi: 10.1002/jmri.23753. [DOI] [PubMed] [Google Scholar]
- 3.Grist JT, et al. Hyperpolarized 13C MRI: A novel approach for probing cerebral metabolism in health and neurological disease. J. Cereb. Blood Flow Metab. 2020 doi: 10.1177/0271678X20909045. [DOI] [PMC free article] [PubMed] [Google Scholar]
- 4.Grist JT, et al. Quantifying normal human brain metabolism using hyperpolarized [1–13C]pyruvate and magnetic resonance imaging. Neuroimage. 2019;189:171–179. doi: 10.1016/j.neuroimage.2019.01.027. [DOI] [PMC free article] [PubMed] [Google Scholar]
- 5.Gallagher FA, et al. Imaging breast cancer using hyperpolarized carbon-13 MRI. Proc. Natl. Acad. Sci. 2020 doi: 10.1073/pnas.1913841117. [DOI] [PMC free article] [PubMed] [Google Scholar]
- 6.Cunningham CH, et al. Hyperpolarized 13C metabolic MRI of the human heart: Initial experience. Circ. Res. 2016;119:1177–1182. doi: 10.1161/CIRCRESAHA.116.309769. [DOI] [PMC free article] [PubMed] [Google Scholar]
- 7.Chung BT, et al. First hyperpolarized [2-13C]pyruvate MR studies of human brain metabolism. J. Magn. Reson. 2019;309:106617. doi: 10.1016/j.jmr.2019.106617. [DOI] [PMC free article] [PubMed] [Google Scholar]
- 8.Park I, et al. Development of methods and feasibility of using hyperpolarized carbon-13 imaging data for evaluating brain metabolism in patient studies. Magn. Reson. Med. 2018;80:864–873. doi: 10.1002/mrm.27077. [DOI] [PMC free article] [PubMed] [Google Scholar]
- 9.Zaccagna F, et al. Imaging glioblastoma metabolism by using hyperpolarized [1-13C]pyruvate demonstrates heterogeneity in lactate labeling: A proof of principle study. Radiol. Imaging Cancer. 2022;4:1–10. doi: 10.1148/rycan.210076. [DOI] [PMC free article] [PubMed] [Google Scholar]
- 10.Day SE, Kettunen MI, Cherkuri MK, Mitchell JB, Lizak MJ, Morris HD, Koretsky AP, Brindle KM, et al. Detecting response of rat C6 glioma tumors to radiotherapy using hyperpolarized [1-13C]pyruvate and 13C magnetic resonance spectroscopic imaging. Magn. Reson. Med. 2006;203:557–563. doi: 10.1002/mrm.22698. [DOI] [PMC free article] [PubMed] [Google Scholar]
- 11.Chaumeil MM, et al. Hyperpolarized 13C MR imaging detects no lactate production in mutant IDH1 gliomas: Implications for diagnosis and response monitoring. NeuroImage Clin. 2016;12:180–189. doi: 10.1016/j.nicl.2016.06.018. [DOI] [PMC free article] [PubMed] [Google Scholar]
- 12.Witney TH, et al. Detecting treatment response in a model of human breast adenocarcinoma using hyperpolarised [1-13C]pyruvate and [1,4–13C2]fumarate. Br. J. Cancer. 2010;103:1400–1406. doi: 10.1038/sj.bjc.6605945. [DOI] [PMC free article] [PubMed] [Google Scholar]
- 13.Rider OJ, et al. Noninvasive in vivo assessment of cardiac metabolism in the healthy and diabetic human heart using hyperpolarized 13C MRI. Circ. Res. 2020;2020:725–736. doi: 10.1161/CIRCRESAHA.119.316260. [DOI] [PMC free article] [PubMed] [Google Scholar]
- 14.Savic D, et al. L-Carnitine stimulates in vivo carbohydrate metabolism in the type 1 diabetic heart as demonstrated by hyperpolarized MRI. Metabolites. 2021;11:191. doi: 10.3390/metabo11030191. [DOI] [PMC free article] [PubMed] [Google Scholar]
- 15.Miller JJ, et al. Hyperpolarized [1,4–13C2]fumarate enables magnetic resonance-based imaging of myocardial necrosis. JACC Cardiovasc. Imaging. 2018;11:1594–1606. doi: 10.1016/j.jcmg.2017.09.020. [DOI] [PMC free article] [PubMed] [Google Scholar]
- 16.Anderson S, Grist JT, Lewis A, Tyler DJ. Hyperpolarized 13 C magnetic resonance imaging for non-invasive assessment of tissue inflammation hyperpolarized 13 C magnetic resonance imaging for non-invasive assessment of tissue inflammation. NMR Biomed. 2020;4460:1–12. doi: 10.1002/nbm.4460. [DOI] [PMC free article] [PubMed] [Google Scholar]
- 17.Grist JT, Mariager CØ, Qi H, Nielsen PM, Laustsen C. Detection of acute kidney injury with hyperpolarized [13C, 15N]Urea and multiexponential relaxation modeling. Magn. Reson. Med. 2019;84:1–7. doi: 10.1002/mrm.28134. [DOI] [PubMed] [Google Scholar]
- 18.Schroeder MA, et al. Hyperpolarized 13C magnetic resonance reveals early- and late-onset changes to in vivo pyruvate metabolism in the failing heart. Eur. J. Heart Fail. 2013;15:130–140. doi: 10.1093/eurjhf/hfs192. [DOI] [PMC free article] [PubMed] [Google Scholar]
- 19.Le Page LM, et al. Simultaneous in vivo assessment of cardiac and hepatic metabolism in the diabetic rat using hyperpolarized MRS. NMR Biomed. 2016;29:1759–1767. doi: 10.1002/nbm.3656. [DOI] [PMC free article] [PubMed] [Google Scholar]
- 20.Mariager CØ, Nielsen PM, Qi H, Ringgaard S, Laustsen C. Hyperpolarized 13C, 15N2-urea T2 relaxation changes in acute kidney injury. Magn. Reson. Med. 2017;702:696–702. doi: 10.1002/mrm.27050. [DOI] [PubMed] [Google Scholar]
- 21.Hansen ESS, Stewart NJ, Wild JM, Stødkilde-Jørgensen H, Laustsen C. Hyperpolarized 13C, 15N2-Urea MRI for assessment of the urea gradient in the porcine kidney. Magn. Reson. Med. 2016;76:1895–1899. doi: 10.1002/mrm.26483. [DOI] [PubMed] [Google Scholar]
- 22.Qi H, et al. Early diabetic kidney maintains the corticomedullary urea and sodium gradient. Physiol. Rep. 2016;4:1–6. doi: 10.14814/phy2.12714. [DOI] [PMC free article] [PubMed] [Google Scholar]
- 23.Nielsen PM, et al. Fumarase activity: An in vivo and in vitro biomarker for acute kidney injury. Sci. Rep. 2017;7:40812. doi: 10.1038/srep40812. [DOI] [PMC free article] [PubMed] [Google Scholar]
- 24.Mariager CØ, et al. Can hyperpolarized 13 C-urea be used to assess glomerular filtration rate? A retrospective study. Tomography. 2017;3:146–152. doi: 10.18383/j.tom.2017.00010. [DOI] [PMC free article] [PubMed] [Google Scholar]
- 25.Khegai O, et al. Apparent rate constant mapping using hyperpolarized [1-(13)C]pyruvate. NMR Biomed. 2014;27:1256–1265. doi: 10.1002/nbm.3174. [DOI] [PubMed] [Google Scholar]
- 26.Gómez-Damián PA, et al. Multisite kinetic modeling of 13C metabolic MR using [1- 13 C]pyruvate. Radiol. Res. Pract. 2014;2014:1–10. doi: 10.1155/2014/871619. [DOI] [PMC free article] [PubMed] [Google Scholar]
- 27.Daniels CJ, et al. A comparison of quantitative methods for clinical imaging with hyperpolarized 13C-pyruvate. NMR Biomed. 2016;29:387–399. doi: 10.1002/nbm.3468. [DOI] [PMC free article] [PubMed] [Google Scholar]
- 28.Lee CY, et al. Lactate topography of the human brain using hyperpolarized 13C-MRI. Neuroimage. 2019;204:116202. doi: 10.1016/j.neuroimage.2019.116202. [DOI] [PubMed] [Google Scholar]
- 29.Shiroishi MS, et al. Principles of T2∗-weighted dynamic susceptibility contrast MRI technique in brain tumor imaging. J. Magn. Reson. Imaging. 2015;41:296–313. doi: 10.1002/jmri.24648. [DOI] [PubMed] [Google Scholar]
- 30.Choi Y, et al. A simplified method for quantification of myocardial blood flow using nitrogen-13-ammonia and dynamic PET. J. Nucl. Med. 1993;34:488–497. [PubMed] [Google Scholar]
- 31.Muzik O, et al. Validation of nitrogen-13-ammonia tracer kinetic model for quantification of myocardial blood flow using PET. J. Nucl. Med. 1993;34:83–91. [PubMed] [Google Scholar]
- 32.Juillard L, et al. Validation of renal oxidative metabolism measurement by positron-emission tomography. Hypertension. 2007;50:242–247. doi: 10.1161/HYPERTENSIONAHA.107.089607. [DOI] [PubMed] [Google Scholar]
- 33.Johansson E, et al. Cerebral perfusion assessment by bolus tracking using hyperpolarized 13C. Magn. Reson. Med. 2004;51:464–472. doi: 10.1002/mrm.20013. [DOI] [PubMed] [Google Scholar]
- 34.Walker CM, et al. Effects of excitation angle strategy on quantitative analysis of hyperpolarized pyruvate. Magn. Reson. Med. 2019;81:1–9. doi: 10.1002/mrm.27687. [DOI] [PMC free article] [PubMed] [Google Scholar]
- 35.Healicon R, et al. Assessing the effect of anesthetic gas mixtures on hyperpolarized 13 C pyruvate metabolism in the rat brain. Magn. Reson. Med. 2022;1:1–9. doi: 10.1002/mrm.29274. [DOI] [PMC free article] [PubMed] [Google Scholar]
- 36.Mikkelsen EFR, et al. Hyperpolarized [1-13C]-acetate renal metabolic clearance rate mapping. Sci. Rep. 2017;7:1–9. doi: 10.1038/s41598-017-15929-x. [DOI] [PMC free article] [PubMed] [Google Scholar]
- 37.Marco-Rius I, et al. Hyperpolarized singlet lifetimes of pyruvate in human blood and in the mouse. NMR Biomed. 2013;26:1696–1704. doi: 10.1002/nbm.3005. [DOI] [PMC free article] [PubMed] [Google Scholar]
- 38.Gordon JW, et al. A variable resolution approach for improved acquisition of hyperpolarized 13 C metabolic MRI. Magn. Reson. Med. 2020;00:1–10. doi: 10.1002/mrm.28421. [DOI] [PMC free article] [PubMed] [Google Scholar]
- 39.Patil V, Johnson G. An improved model for describing the contrast bolus in perfusion MRI. Med. Phys. 2011;38:6380–6383. doi: 10.1118/1.3658570. [DOI] [PMC free article] [PubMed] [Google Scholar]
- 40.van Osch MJP, et al. Advances in arterial spin labelling MRI methods for measuring perfusion and collateral flow. J. Cereb. Blood Flow Metab. 2018;38:1461–1480. doi: 10.1177/0271678X17713434. [DOI] [PMC free article] [PubMed] [Google Scholar]
- 41.Heye AK, et al. Tracer kinetic modelling for DCE-MRI quantification of subtle blood-brain barrier permeability. Neuroimage. 2016;125:446–455. doi: 10.1016/j.neuroimage.2015.10.018. [DOI] [PMC free article] [PubMed] [Google Scholar]
- 42.Wintermark M, et al. Imaging recommendations for acute stroke and transient ischemic attack patients: A joint statement by the American Society of Neuroradiology, the American College of Radiology and the Society of NeuroInterventional Surgery. J. Am. Coll. Radiol. 2013;10:828–832. doi: 10.1016/j.jacr.2013.06.019. [DOI] [PMC free article] [PubMed] [Google Scholar]
- 43.Grist JT, et al. Combining multi-site magnetic resonance imaging with machine learning predicts survival in paediatric brain tumours. Sci. Rep. 2021;11:1–10. doi: 10.1038/s41598-021-96189-8. [DOI] [PMC free article] [PubMed] [Google Scholar]
- 44.Grade M, et al. A neuroradiologist’s guide to arterial spin labeling MRI in clinical practice. Neuroradiology. 2015;57:1181–1202. doi: 10.1007/s00234-015-1571-z. [DOI] [PMC free article] [PubMed] [Google Scholar]
- 45.Woitek R, et al. Hyperpolarized carbon-13 MRI for early response assessment of neoadjuvant chemotherapy in breast cancer patients. Cancer Res. 2021 doi: 10.1158/0008-5472.can-21-1499. [DOI] [PMC free article] [PubMed] [Google Scholar]
- 46.Jayaraj RL, Azimullah S, Beiram R, Jalal FY, Rosenberg GA. Neuroinflammation: Friend and foe for ischemic stroke. J. Neuroinflamm. 2019;16:1–24. doi: 10.1186/s12974-019-1516-2. [DOI] [PMC free article] [PubMed] [Google Scholar]
- 47.Wu O, et al. Tracer arrival timing-insensitive technique for estimating flow in MR perfusion-weighted imaging using singular value decomposition with a block-circulant deconvolution matrix. Magn. Reson. Med. 2003;50:164–174. doi: 10.1002/mrm.10522. [DOI] [PubMed] [Google Scholar]
- 48.Bøgh N, et al. Metabolic MRI with hyperpolarized [1-13C] pyruvate separates benign oligemia from infarcting penumbra in porcine stroke. JCBFM. 2021 doi: 10.1177/0271678X211018317. [DOI] [PMC free article] [PubMed] [Google Scholar]
- 49.Miller JJ, et al. 13C pyruvate transport across the blood-brain barrier in preclinical hyperpolarised MRI. Sci. Rep. 2018;8:15082. doi: 10.1038/s41598-018-33363-5. [DOI] [PMC free article] [PubMed] [Google Scholar]
- 50.Tweedie MEP, Kersemans V, Gilchrist S, Smart S, Warner JH. Electromagnetically transparent graphene respiratory sensors for multimodal small animal imaging. Adv. Healthc. Mater. 2020;9:1–7. doi: 10.1002/adhm.202001222. [DOI] [PubMed] [Google Scholar]
- 51.Kinchesh P, et al. Reduced respiratory motion artefact in constant TR multi-slice MRI of the mouse. Magn. Reson. Imaging. 2019;60:1–6. doi: 10.1016/j.mri.2019.03.018. [DOI] [PMC free article] [PubMed] [Google Scholar]
- 52.Kersemans V, et al. A resistive heating system for homeothermic maintenance in small animals. Magn. Reson. Imaging. 2015;33:847–851. doi: 10.1016/j.mri.2015.03.011. [DOI] [PMC free article] [PubMed] [Google Scholar]
- 53.Broom KA, et al. MRI reveals that early changes in cerebral blood volume precede blood-brain barrier breakdown and overt pathology in MS-like lesions in rat brain. J. Cereb. Blood Flow Metab. 2005;25:204–216. doi: 10.1038/sj.jcbfm.9600020. [DOI] [PubMed] [Google Scholar]
- 54.Bronikowski TA, Dawson CA, Linehan JH. Model-free deconvolution techniques for estimating vascular transport functions. Int. J. Biomed. Comput. 1983;14:411–429. doi: 10.1016/0020-7101(83)90024-7. [DOI] [PubMed] [Google Scholar]
Associated Data
This section collects any data citations, data availability statements, or supplementary materials included in this article.
Data Availability Statement
All data are available upon request to the corresponding author.


