

INTRODUCTION
Frontotemporal dementia (FTD) is a term that refers to multiple neurologic syndromes with multiple subclassifications and overlapping symptoms overlying one of several specific protein-based neuropathologies. FTD is the most common cause of early-onset dementia and is primarily characterized by tau protein deposition and frontotemporal lobar degeneration. Currently, FTD has been divided into 3 main presentations: behavioral variant FTD (bvFTD), nonfluent/agrammatic variant primary progressive aphasia (nfvPPA), and semantic variant primary progressive aphasia (svPPA).1 As bvFTD has an incidence 4 times greater than primary progressive aphasia (PPA) diagnoses and accounts for more than 50% of cases of autopsy-confirmed FTD,2,3 it will be the focus of this review.
bvFTD was previously called Pick disease (PiD). In 1892, Pick described the first patient with FTD (an svPPA diagnosis). In 1911, Alois Alzheimer coined the term Pick disease,4 and in 1923, Gans reported “Pick’s atrophy” to distinguish cases of patients with frontotemporal atrophy from other similar neurodegenerative phenomena.5 Just 3 years later, Pick’s students Onari and Patz differentiated “Pick’s cells” from “Pick’s bodies,” reclassifying “Pick’s disease” (PiD) as an individual pathologic unit.5 Subsequent research resulted in a paradigm shift concerning the cause of dementia in the 1970s, moving toward a protein misfolding and deposition focus.6,7 Today, PiD refers to neurodegeneration displaying Pick bodies associated with tau aggregates; Pick bodies can be seen in all three of the main FTD types. FTD now has subtypes based off of a variety of these protein aggregates, including TAR DNA binding protein (FTLD-TDP) and tau (FTLD-tau).
PET has been used to study dementia since the 1980s and was originally innovated to study normal brain physiology through interrogation of glucose metabolism.8 This modality has become increasingly used in the diagnosis of neurodegenerative disorders owing to the complexity of presentations and related symptom overlap.
MR IMAGING VERSUS 18F-FLUORODEOXYGLUCOSE-PET: DIAGNOSTIC UTILITY
The utility of both MR imaging and PET in the diagnosis of bvFTD has already been well established, and neuroimaging is required to take a bvFTD diagnosis from “possible” to “probable.”9 Currently, the typical protocol is to first have an MR imaging done and then follow up with a fluorodeoxyglucose (FDG)-PET to increase sensitivity/specificity2; 18F-FDG-PET hypometabolic changes can be visualized before structural changes on computed tomography (CT) or MR imaging in dementia-like disorders and provides superior diagnostic accuracy allowing for earlier and more accurate patient care triage.10 This section looks at the findings and effectiveness of each imaging technique individually and then in tandem.
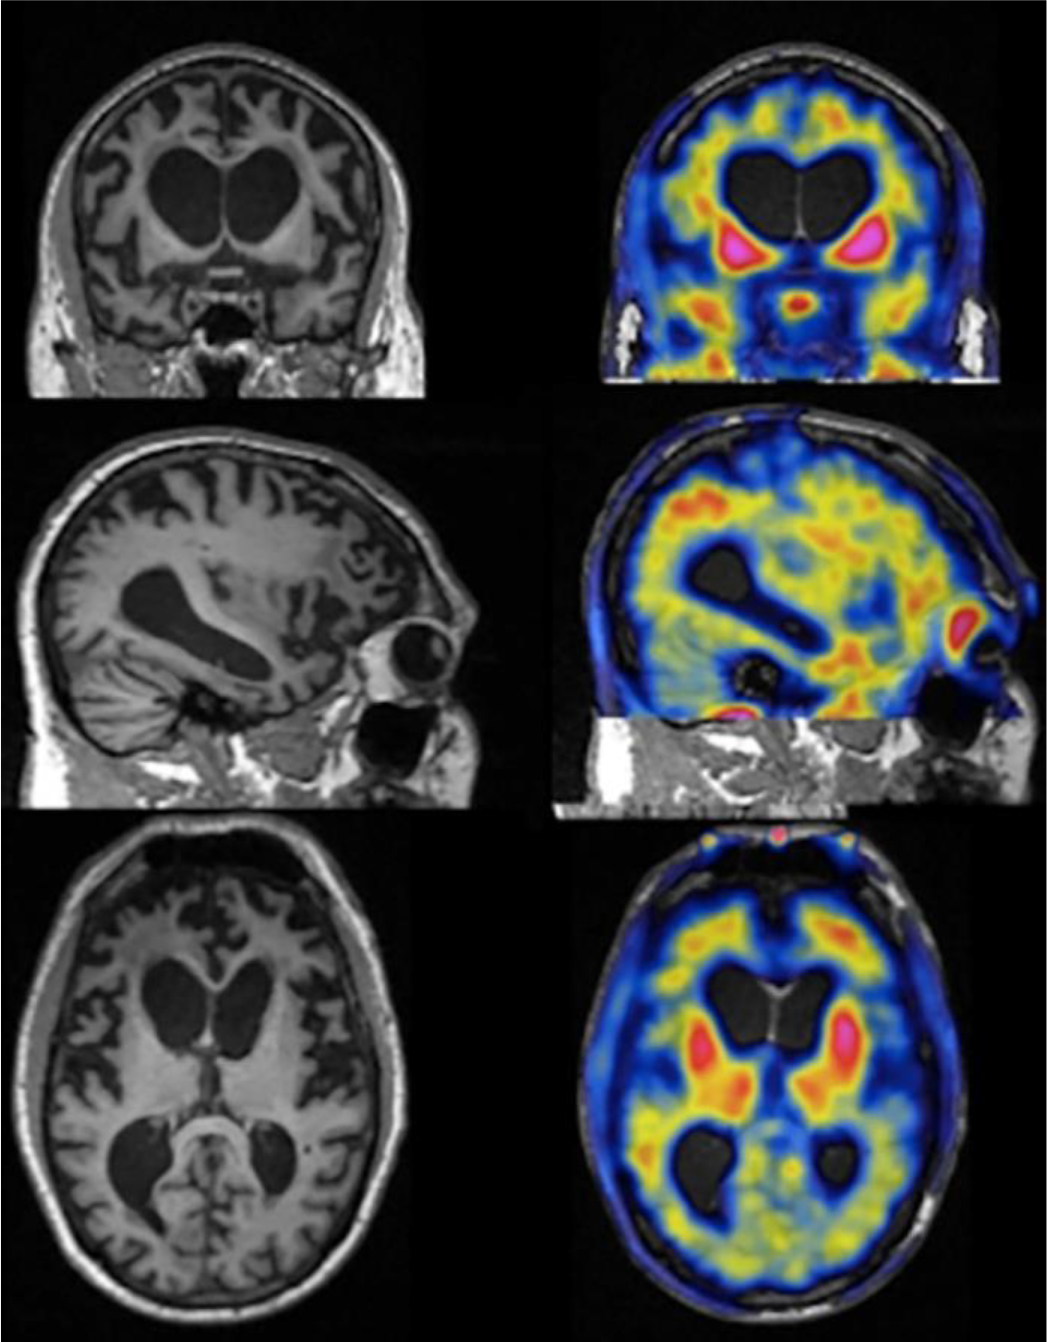
Overall, both MR imaging and FDG-PET display atrophy/hypometabolism across similar regions in bvFTD. On MR imaging for a patient with bvFTD, there is typically atrophy of the frontotemporal lobes, and11,12 the right hemisphere often displays more extensive atrophy than the left side.13,14 Early in the disease course, von Economo neurons, large spindle-shaped neurons that facilitate faster communication across brain regions, in the anterior insula and anterior cingulate cortex present as the origin point for bvFTD neuropathology15–17 before it progresses to the frontotemporal lobes. An MR imaging of a person with advanced FTD is shown in Fig. 1.
Fig. 1.

Structural MR imaging of a person with advanced FTD. There is marked atrophy of the frontotemporal lobes bilaterally. However, the parietooccipital lobe is comparatively preserved.
When structural imaging is inconclusive, 18F-FDG-PET can help make a clearer distinction. Although the areas affected are similar, frontotemporal hypometabolism on 18F-FDG-PET is detected earlier and in a comparatively widespread fashion compared with MR atrophy patterns.18 Frontal lobe hypometabolism specifically targets the medial, dorsolateral, and ventrolateral prefrontal cortex (PFC), as well as the orbitofrontal and anterior cingulate cortex.19–21 The medial temporal lobe and the anterior and inferior aspect of the temporal lobes are typically affected with hypometabolism extending to the posterior fusiform gyrus.19,20 Limbic regional hypometabolism is also noted, including the hippocampus, amygdala,19,20 caudate, and thalamus.20,21
These bvFTD PET findings contrast with hypometabolism in other prominent neurodegenerative diseases. In the early stage of Alzheimer disease (AD), frontotemporal hypometabolism that is comparatively less severe than bvFTD can be seen (see Fig. 3), and there is frontal, temporal, and parietal hypometabolism in advanced AD. The characteristic FDG-PET finding associated with pathologically confirmed AD is bilateral temporoparietal hypometabolism.22 Characteristic findings in dementia with Lewy bodies (DLB), corticobasal degeneration (CBD), and AD are shown in Fig. 2. By knowing the different regional patterns of hypometabolism, these diseases can be differentiated.
Fig. 3.

Axial brain FDG-PET uptake in representative participants31 displayed in neurologic orientation (right side of the image is on reader’s right-hand side). The clinically normal participant shows uniform Food and Drug Administration uptake throughout the brain as illustrated by the widespread intense bright colors. The person with clinical AD shows early asymmetric frontal and temporal hypometabolism that is comparatively more advanced in a person with bvFTD. (Adapted from Tosun D, Schuff N, Rabinovici GD, Ayakta N, Miller BL, Jagust W, Kramer J, Weiner MM, Rosen HJ. Diagnostic utility of ASL-MRI and FDG-PET in the behavioral variant of FTD and AD. Ann Clin Transl Neurol. 2016 Aug 30;3(10):740–751.)
Fig. 2.
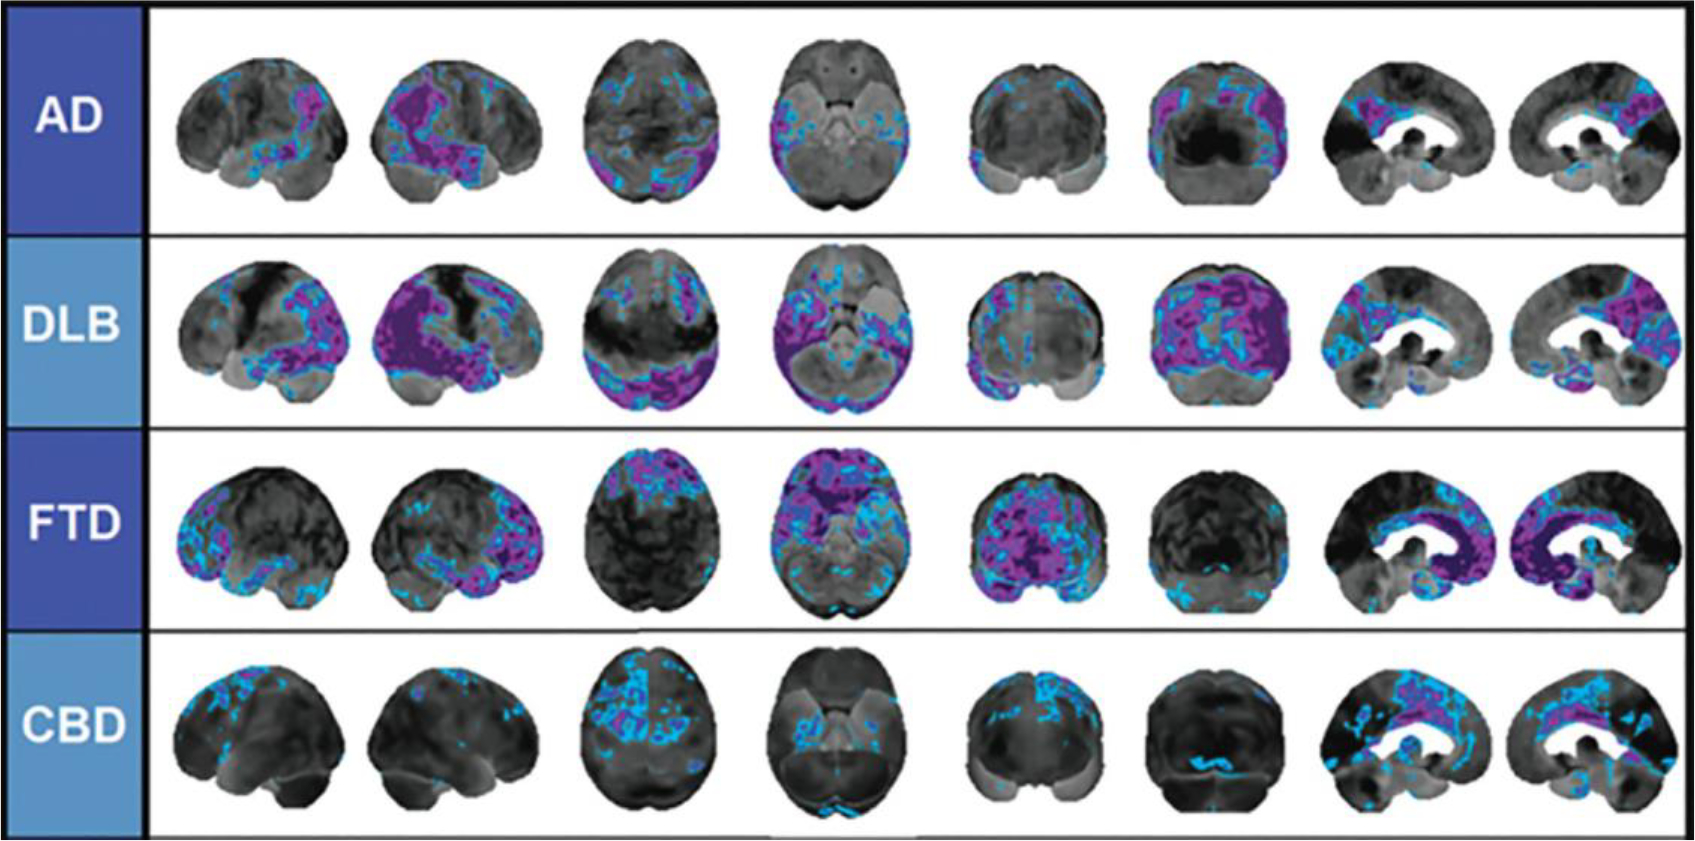
Differential patterns of hypometabolism on FDG-PET z-score maps in neurodegenerative disease. Blue and purple colors denote areas of the FDG-PET scan that are −2 standard deviations or more below the mean of the control comparison group. There is temporoparietal hypometabolism in AD, marked occipital hypometabolism in DLB, predominantly frontal hypometabolism in FTD, and asymmetric hypometabolism in CBD.30 From Brown RK, Bohnen NI, Wong KK, Minoshima S, Frey KA. Brain PET in suspected dementia: patterns of altered FDG metabolism. Radiographics: a Review Publication of the Radiological Society of North America, Inc. 2014 May-Jun;34(3):684–701.
FTD MR imaging and PET findings change as a function of disease severity/duration. As FTD progresses to advanced stages, similar brain regions show increasingly severe and diffuse volume/metabolic loss over time. Hypometabolism on PET progresses23–25 across multiple regions, including the frontal poles, supplementary motor area, middle temporal gyri, posterior cingulate cortex, precuneus, inferior parietal lobule, lateral superior occipital cortex, and cerebellum.19,25 Early in the course of FTD, structural MR imaging may detect changes in the temporal region that may not be as apparent on 18F-FDG-PET owing to the differences in anatomic resolution across the techniques. Overall, more metabolic changes than volume changes are noted as FTD progresses year by year. Metabolic decline is also overall more diffuse at both early and late stages.19
As imaging findings evolve over time, differences in sensitivity/specificity in PET and MR imaging are also evident with varying stages of disease severity. In patients at early stages of dementia, 18F-FDG-PET outperformed arterial spinlabeled MR in sensitivity as well as volumetric abnormalities.26 The sensitivity of MR imaging in bvFTD in patients with late-onset behavioral changes is 70%, and the specificity is 93%. 18F-FDG-PET has a sensitivity of 90% and a specificity of 68%. In general practice, MR imaging is ordered first simply because there is greater availability when compared with PET scanners; the American College of Radiology states that MR imaging is usually appropriate in suspected FTD, whereas an FDG-PET “may be appropriate.”27 This delineation may be due to the greater availability, the higher cost of PET, and the patient payment issues. It should be noted, however, that a standalone MR imaging with characteristic atrophy is not as sensitive as FDG-PET, and that in order to maximize both sensitivity and specificity, both must be used together. When used together, MR imaging with a follow-up PET has a sensitivity of 96% with a specificity of 73%. In 66% of patients with FTD in which a mutation was the cause of disease, MR imaging did not display the typical frontotemporal atrophy patterns, and a primary psychiatric disorder was the final diagnosis in 40% of cases with a false positive 18F-FDG-PET scan.2 Thus, it is important to use caution when interpreting neuroimaging results for patients with a genetic history of mutations (such as MAPT or P301L) that are associated with specific PET findings. This care is especially necessary when a primary psychiatric disorder is being considered as a diagnosis and 18F-FDG-PET is the sole source of FTD-related imaging findings.
Although 18F-FDG-PET is widely used in neurodegenerative disease diagnosis by differentiating disease subtypes, it remains important to recognize that the landscape for these disorders is rapidly changing because of increasing knowledge. One such set of factors under increasing consideration is comorbidities that can modify risk for FTD. Such FTD risk modifiers include traumatic brain injury, diabetes mellitus, autoimmune disorders, and a family history of FTD.28 Prior work has shown that head trauma incidence is significantly higher among patients with FTD than other forms of dementia.29 Such factors can alter 18F-FDG-PET findings such as asymmetric hypometabolism related to a specific site of head trauma. Atypical patterns on 18F-FDG-PET should therefore be contextualized with known history, including risk modifiers and comorbidities. As AD is frequently considered in the differential diagnosis of FTD, Fig. 3 demonstrates examples of different FTD-PET patterns on these disorders compared with normal metabolic findings on this modality.
SINGLE-PHOTON EMISSION COMPUTED TOMOGRAPHY
Although 99mTc-hexamethylpropyleneamine oxime (HMPAO)–single-photon emission computed tomography (SPECT) has been shown to have some diagnostic utility in FTD, 18F-FDG-PET has demonstrated comparatively higher diagnostic utility.2 Like FDG-PET, SPECT’s diagnostic application in FTD comes primarily from distinguishing AD from FTD, but a systematic review has offered support for its utility differentiating FTD from DLB as well.32 The pooled weighted sensitivity and specificity of 99mTc-HMPAO-SPECT in a meta-analysis investigating its capacity for distinguishing AD from FTD was 79.7% and 79.9%, respectively.33 FTD findings in 99mTc-HMPAO-SPECT include bilateral hypoperfusion that targets the frontal lobes (Fig. 4), with asymmetric hypoperfusion of the right frontal lobes. This finding contrasts with other disorders like AD, in which there is bilateral hypoperfusion of the temporal lobes (Fig. 5).34 These disorders can be differentiated not only by the comparatively higher burden of temporal hypoperfusion of AD but also by the anterior temporal hypoperfusion that can be seen in FTD (see Fig. 5) compared with the more lateral hypoperfusion in AD (see Fig. 4). Prior work suggests that 99mTc-HMPAO-SPECT may also assist in the discrimination of FTD variants, as there are distinct findings for patients with each of the three-core spectrum FTD disorders.35
Fig. 4.

Visual assessment of brain perfusion in a patient with AD using SPECT. There is hypoperfusion in the parietal lobes bilaterally.34 (From Valotassiou, V, Tsougos, I, Tzavara, C, Georgoulias, P, Papatriantafyllou, J, Karageorgiou, C, Sifakis, N, & Zerva, C (2009). Evaluation of brain perfusion in specific Brodmann areas in Frontotemporal dementia and Alzheimer disease using automated 3-D voxel based analysis. Journal of Instrumentation, 4(05), P05020.)
Fig. 5.

Visual assessment of brain perfusion in a patient with FTD using SPECT. There is slightly asymmetric hypoperfusion in the frontal lobes, favoring the right side.34 (From Valotassiou, V, Tsougos, I, Tzavara, C, Georgoulias, P, Papatriantafyllou, J, Karageorgiou, C, Sifakis, N, & Zerva, C (2009). Evaluation of brain perfusion in specific Brodmann areas in Frontotemporal dementia and Alzheimer disease using automated 3-D voxel based analysis. Journal of Instrumentation, 4(05), P05020.)
123I-FP-CIT-SPECT had a specificity of 64% and a sensitivity of 95% for differentiating FTD from DLB.32 For 99mTc-HMPAO-SPECT, findings in bvFTD include bilateral frontotemporal hypoperfusion with an absence of posterior changes.33 Fig. 6 shows an example of SPECT findings in bvFTD. In general, SPECT in FTD is used more as a supplement to other imaging and clinical information particularly when FDG-PET is not readily available. Finally, it should be noted that although most studies suggest PET superiority over SPECT, there is relatively little evidence of SPECT’s performance as it pertains to FTD. Further comparative studies will help to clarify SPECT’s role in the treatment of these diseases.36
Fig. 6.

Example of hypoperfusion on SPECT in a person with bvFTD. There is bifrontal and bitemporal hypoperfusion.37 Reprinted from J Alzheimers Dis. 30(4), Rollin-Sillaire A, Bombois S, Deramecourt V, et al. Contribution of single photon emission computed tomography to the differential diagnosis of dementia in a memory clinic, 833–845. Copyright 2012, with permission from IOS Press. The publication is available at IOS Press through http://dx.doi.org/10.3233/JAD-2012-111067.
AMYLOID PET
Amyloid PET has been shown to have diagnostic utility in FTD.38 As amyloid-PET imaging typically has no tracer retention in patients with FTD, negative amyloid PET rules out AD.39,40 This finding is important, as clinical presentations can have considerable overlap, particularly in bvFTD and PPA. PiB-PET, the most commonly used amyloid-PET tracer, has been shown to distinguish FTLD from AD with higher sensitivity (89% vs 73%) but relatively lower specificity (83% vs 98%) compared with 18F-FDG-PET.2 However, it should be noted that although it is relatively rare to have a positive amyloid-PET with a clinical diagnosis of bvFTD, it is possible. On autopsies of patients with a positive amyloid-PET, an FTD syndrome, and typical FTD-like patterns of atrophy/hypometabolism, there have been multiple cases whereby AD and FTD pathologic condition are found to coexist.41,42 Thus, a positive amyloid-PET should not completely rule out FTD. However, the weight of evidence suggests using amyloid-PET imaging whenever a patient presents with cognitive impairment that creates suspicion for AD. Fig. 7 shows examples of amyloid deposition and FTD hypometabolism in normal cognition, AD, and FTD variants.
Fig. 7.

Amyloid and FDG-PET abnormalities across normal cognition, AD, and FTD variants (lvPPA, logopenic variant primary progressive aphasia; bvFTD, and svPPA). DVR, distribution volume ratio; NC, normal controls; SUVR, standardized uptake value ratio. There is a comparative lack of amyloid uptake in the FTD syndromes.43 (From Laforce R Jr, Rabinovici GD. Amyloid imaging in the differential diagnosis of dementia: review and potential clinical applications. Alzheimers Res Ther. 2011;3(6):31. Published 2011 Nov 10.)
TAU PET
The FTLD-Tau subtypes come in 2 common forms: three-repeat (3R) and four-repeat (4R) tauopathies. 3R and 4R tauopathies refer to tau isoforms that have either 3 microtubule-binding repeat domains (3R-tau) or 4 domains (4R-tau). The only nongenetic 3R tauopathy that primarily occurs with bvFTD is PiD, although svPPA, nfvPPA, and corticobasal syndrome can also occur.44–46 On the other hand, there are multiple 4R tauopathies that can lead to FTD; the most common by far are progressive supranuclear palsy (PSP), CBD, globular glial tauopathies, argyrophilic grain disease, and PSP and CBD together.47 These often present as syndromes combined with one of the core spectrum disorders (ie, PSP-bvFTD, CBD-bvFTD, CBD-nfvPPA) to create very complex presentations. As tau-PET findings for these specific subtypes are essentially nonexistent, the findings are mostly based on structural imaging and are not discussed in detail here.
In general, tau-PET has been shown to be useful in differentiating AD pathologic condition from other types of neuropathology, and it can distinguish AD from FTD syndromes with high accuracy.48In a multicenter cross-sectional study comparing the discriminative accuracy of 18F-flortaucipir PET in differentiating AD from other non-AD neurodegenerative disorders, it had a sensitivity of 89.9% and specificity of 90.6%. However, tau-PET is not as useful for delineation of FTLD subtypes, having had mixed results in distinguishing FTLD pathologic conditions among in vivo studies. It should also be noted that 18F-flortaucipir, the PET tracer most widely used to study tau accumulation in the brain,49 has yet to demonstrate binding in tauopathies outside of AD and has been shown to bind to several other non-tau targets.47
Also, several studies have shown that flortaucipir-PET is elevated in some patients with specific MAPT mutations.50–53 This elevation occurs in MAPT mutations that result in a mix of 3R/4R tau pathologic condition, but there is variation in the literature, as others have reported data that a mild increase in flortaucipir binding is observed in multiple FTLD-tau subtypes and is therefore not useful in differentiating these subtypes.54 PET and MR imaging findings in a person with a specific MAPT mutation are shown in Fig. 8.
Fig. 8.
MR imaging (left) and 18F-T807 PET (right) brain images from a 56-year-old person with P301L MAPT mutation FTD. Visually apparent frontal and temporal atrophy is noted on MR imaging along with increased tau uptake in the basal ganglia.55 (From Ghetti B, Oblak AL, Boeve BF, Johnson KA, Dickerson BC, Goedert M. Invited review: Frontotemporal dementia caused by microtubule-associated protein tau gene (MAPT) mutations: a chameleon for neuropathology and neuroimaging [published correction appears in Neuropathol Appl Neurobiol. 2015 Jun;41(4):571] [published correction appears in Neuropathol Appl Neurobiol. 2015 Jun;41(4):571]. Neuropathol Appl Neurobiol. 2015;41(1):24–46.)
NOVEL RADIOTRACERS
PET imaging with amyloid and tau ligands has been tailored for AD investigation and diagnosis. However, many of these tracers have little to no binding to non-AD tau isoforms and high offtarget binding to non-tau structures.56 This limits the diagnostic utility of such tracers in non-AD tauopathies.
There remains a need for novel radiotracers that target FTD-associated proteins. Pathologic TDP-43 and tau are involved in w90% of FTLD cases, with the remaining 10% made up of fused-in-sarcoma protein (FUS).57 Although multiple PET tau tracers have been developed,56 there have been efforts to design binding ligands for other proteins, like TDP-43.59 Discoveries of small molecules such as nTRD22 have brought insights into targets that novel ligands could have (Fig. 9). Also, the dopamine transporter (DAT) is an established PET target49 that has recently been reported to have abnormal findings on DAT-SPECT imaging in some patients with FTD.59,60 Future research could investigate developing new radiotracers that target TDP-43 as well as FUS, and DAT for PET and SPECT imaging.
Fig. 9.

nTRD22, a novel small molecule that allosterically modulates TDP-43 and may serve as a binding domain for new tau PET tracers.58 From Rao PPN, Shakeri A, Zhao Y, Calon F. Strategies in the design and development of (TAR) DNA-binding protein 43 (TDP-43) binding ligands. Eur J Med Chem. 2021;225:113753.
SUMMARY OF CLINICAL FINDINGS IN NEUROIMAGING WITH FLUORODEOXYGLUCOSE-PET
In summary, there are key findings for multiple neurodegenerative diseases on FDG-PET. For FTD, there is frontal and temporal hypometabolism. In AD, the most important findings are bilateral temporal and parietal lobe hypometabolism. In DLB, there is frontal and occipital hypometabolism. These differing areas of hypometabolism, as well as their combinations, can be used to differentiate diseases. For example, if there is frontal hypometabolism but the occipital lobe is spared, DLB is less likely. A comparatively anterior temporal hypometabolism advances the differential diagnosis closer to FTD, whereas AD shows medial temporal and hippocampal hypometabolism. Table 1 lists areas of hypometabolism of these and other important neurodegenerative diseases.
Table 1.
Neurodegenerative diseases with respective hypometabolic regions on fluorodeoxyglucose-PET
| PC | Pari | Lat Temp | Med Temp | Fron | Occ | SM | ST | TH | BS | |
|---|---|---|---|---|---|---|---|---|---|---|
| MCI due to AD | Y | Y | / | / (or Y) | / | / | / | / | / | / |
| AD (mild) | Y | Y | Y | / (or Y) | / | / | / | / | / | / |
| AD (moderate) | Y | Y | Y | Y | Y | / | / | / | / | / |
| DLB | Y | Y | Y | / | Y | Y | / | / | / | / |
| FTD | / (or Y) | / (or Y) | Y | Y | / | / | / | / (or Y) | / | / |
| SD | / | / (or Y) | YY | Y | / | / | / | / | / | / |
| PSP | / | / | / (or Y) | / | Y | / | / | Y | / | Y |
| CBD (1) | Y | Y | Y | / | Y | / | Y | Y | Y | / |
| VaD (2) | / (or Y) | / (or Y) | / (or Y) | / (or Y) | Y | / | / (or Y) | / (or Y) | / (or Y) | / |
Abbreviations: (1), asymmetric reduction is characteristic; (2), predominantly frontal metabolic reduction is often demonstrated as well as an infarction region; BS, brainstem; Fron, frontal cortex; Lat, null; lateral, temporal cortex; MCI, mild cognitive impairment; Med, null; medial, temporal cortex; Occ, occipital cortex; Pari, parietal association cortex; PC, posterior cingulate gyrus; SD, semantic dementia; SM, sensorimotor cortex; ST, striatum; TH, thalamus; VaD, vascular dementia; /, preserved; Y, decreased.
From Ishii K. PET approaches for diagnosis of dementia. AJNR Am J Neuroradiol. 2014 Nov-Dec;35(11):2030–8.61
CLINICS CARE POINTS.
PETscans may not be partial volume corrected for atrophy.62 Thus, brain MR imaging acquired with PET can be important for PET processing as well as atrophy detection.
Common mimics of frontotemporal dementia on scans include Alzheimer disease and dementia with Lewy bodies. Thus, interpretations of PET scans should consider related disease presentation, for example, the presence of visual hallucinations in dementia with Lewy bodies versus other dementias as well as the executive dysfunction that predominates in frontotemporal dementia.
Newer techniques on PET, such as tau PET, hold promise for identifying frontotemporal dementia but are limited by the lack of radioligands that can identify the full range of tau isoforms that can manifest in frontotemporal dementia variants.
KEY POINTS.
Diagnostic imaging of frontotemporal demential (FTD), particularly behavioral variant FTD (bvFTD), entails both MR neuroimaging and brain PET.
Brain MR displays atrophy, a proxy of neurodegeneration, in frontal and temporal lobar areas and FDG-PET shows hypometablism in these regions.
Additional imaging techniques of interest for FTD include brain SPECT, amyloid, and tau PET but these methods are not as frequently utilized in clinical practice compared to MRI and FDG-PET.
ACNOWLEDGEMENT
Mr. Ward was supported in this work by the Mallinckrodt Institute of Radiology Summer Research Program (Mentor: CA Raji). Dr. Raji is supported in his research by NIA 1RF1AG072637-01 (CA Raji, P.I.). Dr. Raji is a consultant for Brainreader ApS, Neurevolution LLC, Icometrix, and Apollo Health.
Footnotes
DISCLOSURE
The authors have nothing to disclose.
REFERENCES
- 1.Olney RK, Murphy J, Forshew D, et al. The effects of executive and behavioral dysfunction on the course of ALS. Neurology 2005;65(11):1774–7. [DOI] [PubMed] [Google Scholar]
- 2.Duignan JA, Haughey A, Kinsella JA, et al. Molecular and anatomical imaging of dementia with Lewy bodies and frontotemporal lobar degeneration. Semin Nucl Med 2021;51(3):264–74. [DOI] [PubMed] [Google Scholar]
- 3.Uber die Beziehungen der senilen Hirnatrophie zur Aphasie | CiNii Research. Available at: https://cir.nii.ac.jp/crid/1572261550500971008. Accessed June 8, 2022. [Google Scholar]
- 4.Alzheimer A ü ber eigenartige Krankheitsfä lle des spä teren Alters. Z fü r die gesamte Neurologie Psychiatrie 1911;4(1):356–85. [Google Scholar]
- 5.Thibodeau MP, Miller BL. Limits and current knowledge of Pick’s disease: its differential diagnosis”. A translation of the 1957 Delay, Brion, Escourolle article. Neurocase 2013;19(5):417–22. [DOI] [PubMed] [Google Scholar]
- 6.Román G Vascular dementia: a historical background. Int Psychogeriatr 2003;15(Suppl 1):11–3. [DOI] [PubMed] [Google Scholar]
- 7.Ryan NS, Rossor MN, Fox NC. Alzheimer’s disease in the 100 years since Alzheimer’s death. Brain 2015;138(Pt 12):3816–21. [DOI] [PubMed] [Google Scholar]
- 8.DE K, ME P, EJ H, et al. Initial clinical experience with 18F-2-fluoro-2-deoxy-d-glucose for determination of local cerebral glucose utilization by emission computed tomography. Acta Neurol Scand Suppl 1977;64:192–3. Available at: https://europepmc.org/article/MED/268784. Accessed June 6, 2022. [PubMed] [Google Scholar]
- 9.Rascovsky K, Hodges JR, Knopman D, et al. Sensitivity of revised diagnostic criteria for the behavioural variant of frontotemporal dementia. Brain 2011; 134(9):2456. [DOI] [PMC free article] [PubMed] [Google Scholar]
- 10.Minoshima S, Mosci K, Cross D, et al. Brain [F-18] FDG PET for clinical dementia workup: differential diagnosis of Alzheimer’s disease and other types of dementing disorders. Semin Nucl Med 2021; 51(3):230–40. [DOI] [PubMed] [Google Scholar]
- 11.Schroeter ML, Raczka K, Neumann J, et al. Towards a nosology for frontotemporal lobar degenerations-a meta-analysis involving 267 subjects. Neuroimage 2007;36(3):497–510. [DOI] [PubMed] [Google Scholar]
- 12.Schroeter ML. Considering the frontomedian cortex in revised criteria for behavioural variant frontotemporal dementia. Brain 2012;135(4):e213. [DOI] [PMC free article] [PubMed] [Google Scholar]
- 13.Perry DC, Brown JA, Possin KL, et al. Clinicopathological correlations in behavioural variant frontotemporal dementia. Brain 2017;140(12):3329–45. [DOI] [PMC free article] [PubMed] [Google Scholar]
- 14.Whitwell JL, Przybelski SA, Weigand SD, et al. Distinct anatomical subtypes of the behavioural variant of frontotemporal dementia: a cluster analysis study. Brain 2009;132(11):2932. [DOI] [PMC free article] [PubMed] [Google Scholar]
- 15.Brown JA, Deng J, Neuhaus J, et al. Patient-tailored, connectivity-based forecasts of spreading brain atrophy. Neuron 2019;104(5):856–68.e5. [DOI] [PMC free article] [PubMed] [Google Scholar]
- 16.Seeley WW, Crawford RK, Zhou J, et al. Neurodegenerative diseases target large-scale human brain networks. Neuron 2009;62(1):42–52. [DOI] [PMC free article] [PubMed] [Google Scholar]
- 17.Zhou J, Gennatas ED, Kramer JH, et al. Predicting regional neurodegeneration from the healthy brain functional connectome. Neuron 2012;73(6):1216–27. [DOI] [PMC free article] [PubMed] [Google Scholar]
- 18.Buhour MS, Doidy F, Laisney M, et al. Pathophysiology of the behavioral variant of frontotemporal lobar degeneration: a study combining MRI and FDG-PET. Brain Imaging Behav 2016;11(1):240–52. [DOI] [PubMed] [Google Scholar]
- 19.Bejanin A, Tammewar G, Marx G, et al. Longitudinal structural and metabolic changes in frontotemporal dementia. Neurology 2020;95(2):e140. [DOI] [PMC free article] [PubMed] [Google Scholar]
- 20.Franceschi M, Anchisi D, Pelati O, et al. Glucose metabolism and serotonin receptors in the frontotemporal lobe degeneration. Ann Neurol 2005; 57(2):216–25. [DOI] [PubMed] [Google Scholar]
- 21.Diehl-Schmid J, Grimmer T, Drzezga A, et al. Decline of cerebral glucose metabolism in frontotemporal dementia: a longitudinal 18F-FDG-PET-study. Neurobiol Aging 2007;28(1):42–50. [DOI] [PubMed] [Google Scholar]
- 22.Hoffman JM, Welsh-Bohmer KA, Hanson M, et al. Special contributions FDG PET imaging in patients with pathologically verified dementia. J Nucl Med 2000;41:1920–8. [PubMed] [Google Scholar]
- 23.Bejanin A, la Joie R, Landeau B, et al. Distinct interplay between atrophy and hypometabolism in Alzheimer’s versus semantic dementia. Cereb Cortex 2019;29(5):1889–99. [DOI] [PubMed] [Google Scholar]
- 24.Kanda T, Ishii K, Uemura T, et al. Comparison of grey matter and metabolic reductions in frontotemporal dementia using FDG-PET and voxel-based morphometric MR studies. Eur J Nucl Med Mol Imaging 2008;35(12):2227–34. [DOI] [PubMed] [Google Scholar]
- 25.Jeong Y, Cho SS, Park JM, et al. 18F-FDG PET findings in frontotemporal dementia: an SPM analysis of 29 patients. J Nucl Med 2005;46(2):233–9. [PubMed] [Google Scholar]
- 26.Ceccarini J, Bourgeois S, van Weehaeghe D, et al. Direct prospective comparison of 18 F-FDG PET and arterial spin labelling MR using simultaneous PET/MR in patients referred for diagnosis of dementia. Eur J Nucl Med Mol Imaging 2020;47(9): 2142–54. [DOI] [PubMed] [Google Scholar]
- 27.Moonis G, Subramaniam RM, Trofimova A, et al. , ACR Appropriateness Criteria® Dementia Expert Panel on Neurological Imaging, J Am Coll Radiol, 17 (5s), 2020, S100–S112. [DOI] [PubMed] [Google Scholar]
- 28.Rasmussen H, Stordal E, Rosness TA. Risk factors for frontotemporal dementia. Tidsskr Nor Laegeforen 2018;138(14). 10.4045/TIDSSKR.17.0763. [DOI] [PubMed] [Google Scholar]
- 29.Yv Kalkonde, Jawaid A Qureshi SU, et al. Medical and environmental risk factors associated with frontotemporal dementia: a case-control study in a veteran population. Alzheimers Dement 2012;8(3): 204–10. [DOI] [PubMed] [Google Scholar]
- 30.Brown RKJ, Bohnen NI, Wong KK, et al. Brain PET in suspected dementia: patterns of altered FDG metabolism. Radiographics 2014;34(3):684–701. [DOI] [PubMed] [Google Scholar]
- 31.Tosun D, Schuff N, Rabinovici GD, et al. Diagnostic utility of ASL-MRI and FDG-PET in the behavioral variant of FTD and AD. Ann Clin Transl Neurol 2016;3(10):740. [DOI] [PMC free article] [PubMed] [Google Scholar]
- 32.Brigo F, Turri G, Tinazzi M. 123I-FP-CIT SPECT in the differential diagnosis between dementia with Lewy bodies and other dementias. J Neurol Sci 2015; 359(1–2):161–71. [DOI] [PubMed] [Google Scholar]
- 33.Yeo JM, Lim X, Khan Z, et al. Systematic review of the diagnostic utility of SPECT imaging in dementia. Eur Arch Psychiatry Clin Neurosci 2013;263(7): 539–52. [DOI] [PubMed] [Google Scholar]
- 34.Valotassiou V, Papatriantafyllou J, Sifakis N, et al. Evaluation of brain perfusion in specific Brodmann areas in frontotemporal dementia and Alzheimer disease using automated 3-D voxel based analysis. J Instrumentation 2009;4(05):P05020. [Google Scholar]
- 35.Mamouli D, Stavrakaki S, Iakovou I, et al. SPECT analysis and language profile in Greek speaking patients with subtypes of frontotemporal dementia. Hell J Nucl Med 2022;25(1):43–56. [DOI] [PubMed] [Google Scholar]
- 36.Davison CM, O’Brien JT. A comparison of FDG-PET and blood flow SPECT in the diagnosis of neurodegenerative dementias: a systematic review. Int J Geriatr Psychiatry 2014;29(6):551–61. [DOI] [PubMed] [Google Scholar]
- 37.Rollin-Sillaire A, Bombois S, Deramecourt V, et al. Contribution of single photon emission computed tomography to the differential diagnosis of dementia in a memory clinic. J Alzheimer’s Dis 2012;30(4): 833–45. [DOI] [PubMed] [Google Scholar]
- 38.Krishnadas N, Villemagne VL, Doré V, et al. Advances in brain amyloid imaging. Semin Nucl Med 2021;51(3):241–52. [DOI] [PubMed] [Google Scholar]
- 39.Shi Z, Fu LP, Zhang N, et al. Amyloid PET in dementia syndromes: a Chinese multicenter study. J Nucl Med 2020;61(12):1814–9. [DOI] [PubMed] [Google Scholar]
- 40.Tan RH, Kril JJ, Yang Y, et al. Assessment of amyloid b in pathologically confirmed frontotemporal dementia syndromes. Alzheimer’s Demen Diagn Assess Dis Monit 2017;9(1):10–20. [DOI] [PMC free article] [PubMed] [Google Scholar]
- 41.de Leon J, Mandelli ML, Nolan A, et al. Atypical clinical features associated with mixed pathology in a case of non-fluent variant primary progressive aphasia. Neurocase 2019;25(1–2):39–47. [DOI] [PMC free article] [PubMed] [Google Scholar]
- 42.Langheinrich T, Kobylecki C, Jones M, et al. Amyloid-PET–positive patient with bvFTD. Neurol Clin Pract 2021;11(6):e952–5. [DOI] [PMC free article] [PubMed] [Google Scholar]
- 43.Laforce R, Rabinovici GD. Amyloid imaging in the differential diagnosis of dementia: review and potential clinical applications. Alzheimers Res Ther 2011; 3(6). 10.1186/ALZRT93. [DOI] [PMC free article] [PubMed] [Google Scholar]
- 44.Choudhury P, Scharf EL, Paolini MA, et al. Pick’s disease: clinicopathologic characterization of 21 cases. J Neurol 2020;267(9):2697–704. [DOI] [PubMed] [Google Scholar]
- 45.Piguet O, Halliday GM, Reid WGJ, et al. Clinical phenotypes in autopsy-confirmed Pick disease. Neurology 2011;76(3):253–9. [DOI] [PubMed] [Google Scholar]
- 46.Irwin DJ, Brettschneider J, McMillan CT, et al. Deep clinical and neuropathological phenotyping of Pick disease. Ann Neurol 2016;79(2):272–87. [DOI] [PMC free article] [PubMed] [Google Scholar]
- 47.Peet BT, Spina S, Mundada N, et al. Neuroimaging in frontotemporal dementia: heterogeneity and relationships with underlying neuropathology. Neurotherapeutics 2021;18(2):728–52. [DOI] [PMC free article] [PubMed] [Google Scholar]
- 48.Ossenkoppele R, Rabinovici GD, Smith R, et al. Discriminative accuracy of [18F]flortaucipir positron emission tomography for Alzheimer disease vs other neurodegenerative disorders. JAMA 2018;320(11): 1151. [DOI] [PMC free article] [PubMed] [Google Scholar]
- 49.van Waarde A, Marcolini S, de Deyn PP, et al. PET agents in dementia: an overview. Semin Nucl Med 2021;51(3):196–229. [DOI] [PubMed] [Google Scholar]
- 50.Tsai RM, Bejanin A, Lesman-Segev O, et al. 18F-flortaucipir (AV-1451) tau PET in frontotemporal dementia syndromes. Alzheimers Res Ther 2019;11(1). 10.1186/S13195-019-0470-7. [DOI] [PMC free article] [PubMed] [Google Scholar]
- 51.Spina S, Schonhaut DR, Boeve BF, et al. Frontotemporal dementia with the V337M MAPT mutation: tau-PET and pathology correlations. Neurology 2017; 88(8):758. [DOI] [PMC free article] [PubMed] [Google Scholar]
- 52.Smith R, Puschmann A, Schö ll M, et al. 18F-AV-1451 tau PET imaging correlates strongly with tau neuropathology in MAPT mutation carriers. Brain 2016; 139(9):2372. [DOI] [PMC free article] [PubMed] [Google Scholar]
- 53.Jones DT, Knopman DS, Graff-Radford J, et al. In vivo 18F-AV-1451 tau PET signal in MAPT mutation carriers varies by expected tau isoforms. Neurology 2018;90(11):e947. [DOI] [PMC free article] [PubMed] [Google Scholar]
- 54.Soleimani-Meigooni DN, Iaccarino L, Joie R la, et al. 18F-flortaucipir PET to autopsy comparisons in Alzheimer’s disease and other neurodegenerative diseases. Brain 2020;143(11):3477. [DOI] [PMC free article] [PubMed] [Google Scholar]
- 55.Ghetti B, Oblak AL, Boeve BF, et al. Invited review: frontotemporal dementia caused by microtubule-associated protein tau gene (MAPT) mutations: a chameleon for neuropathology and neuroimaging. Neuropathol Appl Neurobiol 2015;41(1):24–46. [DOI] [PMC free article] [PubMed] [Google Scholar]
- 56.Beyer L, Brendel M. Imaging of tau pathology in neurodegenerative diseases: an update. Semin Nucl Med 2021;51(3):253–63. [DOI] [PubMed] [Google Scholar]
- 57.Rademakers R, Neumann M, MacKenzie IR. Advances in understanding the molecular basis of frontotemporal dementia. Nat Rev Neurol 2012;8(8): 423–34. [DOI] [PMC free article] [PubMed] [Google Scholar]
- 58.Rao PPN, Shakeri A, Zhao Y, et al. Strategies in the design and development of (TAR) DNA-binding protein 43 (TDP-43) binding ligands. Eur J Med Chem 2021;225:113753. [DOI] [PubMed] [Google Scholar]
- 59.Kobayashi R, Kawakatsu S, Ohba M, et al. Dopamine transporter imaging for frontotemporal lobar degeneration with motor neuron disease. Front Neurosci 2022;16. 10.3389/FNINS.2022.755211/FULL. [DOI] [PMC free article] [PubMed] [Google Scholar]
- 60.Morgan S, Kemp P, Booij J, et al. Differentiation of frontotemporal dementia from dementia with Lewy bodies using FP-CIT SPECT. J Neurol Neurosurg Psychiatry 2012;83(11):1063–70. [DOI] [PubMed] [Google Scholar]
- 61.Ishii K PET approaches for diagnosis of dementia. AJNR Am J Neuroradiol 2014;35(11):2030. [DOI] [PMC free article] [PubMed] [Google Scholar]
- 62.Meltzer CC, Kinahan PE, Greer PJ, et al. Comparative evaluation of MR-based partial-volume correction schemes for PET. J Nucl Med 1999;40(12): 2053–65. [PubMed] [Google Scholar]