

Abstract
The extent to which basic medical research is translated into clinical practice is a topic of interest to all stakeholders. In this study, we assessed the clinical translation intensity of papers published by scientists who have made outstanding contributions to the field of basic medicine (Lasker Prize winners for Basic Medical Research). Approximate Potential for Translation (APT), Translational science scores (TS), and Citations by clinical research (Cited by Clin.) were analyzed as dependent variables. A traditional citation indicator was used as a reference (relative citation ratio, RCR). In order to examine the correlation between these different indicators and the characteristics of the paper, the author, and the institution. we used nonparametric tests, Spearman correlations, ordinal least squares regressions (OLS), quantile regressions, and zero-inflated negative binomial regression methods. We found that among the basic medical research papers published by Lasker Basic Medicine Award winners, (1) 20% are cited by clinical research; 11.6% of the papers were more valuable for clinical research than basic research; 12.8% have a probability of more than 50% to be cited in future clinical studies; (2) Spearman correlations were conducted among APT, TS, Cited by Clin., RCR, and all of the other continuous variables. There is a significant, positive, low to moderate correlation between APT, TS, and Cited by Clin (APT and TS: r = 0.549, p < 0.01; APT and Cited by Clin: r = 0.530, p < 0.01; TS and Cited by Clin: r = 0.383, p < 0.01). However, the relationship between RCR and the three indicators of clinical translation intensity was not consistent. APT was positively correlated with RCR (r = 0.553, p < 0.01). Cited by Clin. is weakly positively correlated with RCR (r = 0.381, p < 0.01). There is almost no correlation between TS and RCR (r = 0.184, p < 0.01). (3) Publication age, primary research paper, multidisciplinary science, number of disciplines, authors, institutions, funded projects, references, length of the title, length of paper, physical age, gender, nationality, institutional type, Nobel Prize have a significant relationship with 1 to 3 types of clinical translation intensity measures. In a sample of basic medical research papers published by the world’s top scientists in basic medicine, we came to the following conclusions: the three indicators, APT, TS and Cited by Clin., measured the clinical translation intensity of the papers from different perspectives. They are both related to each other and have their own characteristics. In a sample of basic medical research papers published by the world’s top scientists in basic medicine, characteristics at the paper, winner, and institution level significantly correlated with the measures of clinical translation intensity. Gender effect on the clinical translation intensity of papers was confirmed. Traditional citation-based indicators and translational-focused indicators measure academic impact and clinical impact respectively. There is a certain degree of disconnect between them. Two types of indicators should be used in combination in future assessments of basic medical research.
Supplementary Information
The online version contains supplementary material available at 10.1007/s11192-023-04634-4.
Keywords: Clinical translation intensity, Approximate potential to translate (APT), Translational science score (TS score), Basic medical research, Lasker Prize, Impact assessment
Introduction
The goal of medical research is to improve the quality of health care worldwide and improve people’s health. It has become one of the most difficult and challenging goals of medicine to translate basic research findings into clinical practice (Honey, 2007). The long lag between the initial basic research discovery and the ultimate clinical practice is usually measured in decades (Beierlein et al., 2017; Spector et al., 2018). The reason is the inherent barrier between basic medical research and drug development, clinical research, and public health practice (Morris et al., 2011).
Recognizing this challenge, many researchers, institutions, and governments have made substantial efforts to break down this barrier and build a bridge between basic research and clinical practice. Dr. Choi proposed a concept called “from bench to bedside” in 1992 (Choi, 1992). Shortly after this, the concept of “translational medicine” gradually took shape and was first introduced by Geraghty in the Lancet in 1996 (Geraghty, 1996). Since it was formally proposed by the National Institutes of Health (NIH) of the United States in 2003, translational medicine has attracted more and more attention from medical circles around the world (Zerhouni, 2003). As a science, translational medicine can fill the gap between basic medical theory and clinical practice. It can help to achieve new breakthroughs in medicine, and better serve people’s health by promoting the translation of scientific research results into the industry. In recent years, significant progress has been made in the field of cancer immunotherapy, epidemic prevention and etc. In particular, since the outbreak of COVID-19, COVID-19 vaccine technology has made remarkable progress from development to clinical application and popularization.
According to the National Center for Advancing Translational Science (NCATS), “translation” refers to the process of changing medical practice and behavior through the translation of lab-generated research results into interventions that can improve the health of individuals and the public (Han et al., 2018). Translation includes a series of multi-stage knowledge flows, and the scientific outputs generated at each stage are naturally endowed with corresponding clinical value. In short, translation refers to the flow of knowledge from basic scientific findings found in a laboratory setting into clinical practice (potential treatments for a disease).
The extent to which knowledge from basic medical research is transferred to clinical application is an ongoing topic of concern for all stakeholders. Over the years, this evaluation object has been expressed in many forms. For example, Narin called it the “Research Level” which ranged from the most applied (clinical observation) to the most fundamental (basic biomedical research) (Narin et al., 1976). Weber developed the term “translational index (The position of one or more articles when projected onto the translational axis)” (Weber, 2013); The word most frequently mentioned is the number of citations of papers cited by clinical trials or clinical guidelines (Andersen, 2013; Grant et al., 2000; Thelwall & Kousha, 2016). However, there is no uniform term to describe the objects being measured. Li and Tang developed a bibliometric indicator called “translation intensity” (Li & Tang, 2021) to quantify the result of a drug research’s translation, which is based on “Approximate Potential to Translate (APT)” (Hutchins et al., 2019). Inspired by Li’s study, we proposed a concept that we named “clinical translation intensity”, which collectively refers to the intensity or level at which basic medical research findings in a paper are translated into clinical applications.
What quantitative indicators have been developed to measure clinical translation intensity? It is believed that if original articles in basic medicine are cited in clinical trials, clinical guidelines, and other clinical studies, it marks the transfer or flow of knowledge generated in basic medical research to clinical research and clinical application (Andersen, 2013; Eriksson et al., 2020; Grant et al., 2000; Kryl et al., 2012; Lewison & Sullivan, 2008; Thelwall & Kousha, 2016; Thelwall & Maflahi, 2016). In recent years, some scholars have developed relatively novel quantitative indicators to evaluate and predict the clinical translational intensity of articles in basic medicine. We will review the previous literature on the measurement and tools of clinical translation intensity and conduct exploratory empirical research on the newly designed indicators.
The Albert Lasker Medical Research Award is one of the top prizes in physiology and medicine in addition to the Nobel Prize in Physiology or Medicine. The Lasker Awards, which began in 1945, are awarded in four categories: Basic Medical Research Award, Clinical Medical Research Award, Special Achievement Award in Medical Science, and Public Service Award. The Albert Lasker Medical Research Awards honor scientists, physicians, and public service personnel who have made outstanding contributions to the understanding, diagnosis, treatment, cure, or prevention of human disease.
In recent years, Lasker Prize-related research has focused on the distribution of significant medical research achievements of previous Lasker prize winners (Gray et al., 2019; Littman, 2015; Miller & Su, 2011; Yancopoulos, 2010). Charlton used the Lasker Prize for Clinical Medicine, the Nobel Prize in Physiology or Medicine, and the Gairdner Prize as representative awards in the field of medicine to evaluate and compare the contributions of countries and institutions to revolutionary biomedicine from 1987 to 2006 (Charlton, 2007a, 2007b). Nevertheless, there is a lack of quantitative analysis of the relationship between the characteristics of papers and winners and their impact.
The Lasker Basic Medical Research Award has been hailed as a bellwether for the Nobel Prize. From 1946 to 2019, 88 Lasker Laureates received the Nobel Prize in Physiology and Medicine, including 77 Lasker Laureates in Basic Medicine (49% of the 157 Lasker Prize winners in Basic Medicine). In this study, we selected articles authored by Lasker Basic Medical Prize winners as research samples for the following two reasons: Firstly, The Lasker Prize for Basic Medicine is awarded to distinguished contributors in the field of basic medicine and, as a result, their published papers are biased towards basic medical topics. The separation of the Lasker Award for Basic Medicine and the Lasker Award for Clinical Medicine enables us to better target high-quality papers authored by outstanding basic medicine scientists in the field of basic medicine. Secondly, the intensity to which these outstanding achievements in basic medicine have been translated into clinical research and clinical practice since the paper was published is unknown. In other words, the intensity of knowledge transferred from basic medical research papers to clinical practice along the translational continuum is worth exploring.
Backward citations of published clinical studies are mostly used to measure the clinical translation intensity of the cited papers. In 2019, Hutchins developed an indicator called “Approximate Potential to Translate (APT)” based on a machine-learning algorithm to predict translational progress in biomedical research at the article level (Hutchins et al., 2019). In 2020, Kim proposed a novel bibliometric indicator named “Translational Science score (TS score)” to capture the translational degree of focal articles in basic medicine (Kim et al., 2020). NIH iCite also reports the number of clinical citations to a paper which is called Cited by Clin. in 2016 or so. These three quantitative evaluation indicators of clinical translation intensity have rarely been empirically studied since they have just been developed.
In this paper, three indicators (APT, TS and Cited by Clin.) were used to evaluate the clinical translation intensity of basic medical research papers published by the world’s top scientists in the field of basic medicine, aiming to achieve the following three research objectives:
The overall clinical translation intensity of basic medical research papers published by Lasker Prize winners in Basic Medicine and their changing trend with publication age.
Among the characteristics of the paper, the author, and the institution, which factors show an effect on the clinical translation intensity of basic medical research papers published by Lasker Prize winners for Basic Medicine?
Correlation among clinical translation intensity and traditional citation indicators of basic medical research papers published by Lasker Prize winners for Basic Medicine.
Literature review
Studies on the models of translational research stages
To better understand translational research, scholars have put forward a variety of models depicting the characteristics of translational research stages. There is no doubt that “from bench to bedside” is the prototype of the 1 T model (Choi, 1992). The 1 T model focuses on the interface between basic medicine and clinical medicine. It refers to the translation of knowledge generated in basic science into novel ways of preventing, diagnosing, and treating disease. Since 2000, the US Congress has shown concern regarding the disconnection between basic science and the delivery of better health (Woolf, 2008). The Institute of Medicine regularly organized clinical research roundtables and identified two major barriers to translation. Sung visually represented a two-phase model (Sung et al., 2003). The first phase (T1) is the translation from basic biomedical research to human studies and the second phase (T2) is the translation of new clinical knowledge into clinical practice and health decision-making. In 2007, Westfall et al. developed a three-stage translational research model by splitting Sung et al.’s T2 stage into two distinct stages with “practice-based research” as the interface (Westfall et al., 2007). In Westfall et al.’s T2 phase, knowledge transfers from phase I and II clinical trials to phase III and IV clinical trials through developing the clinical guideline, meta-analyses, and systematic reviews. The “practice-based research” interface is a crucial transition interface (translations to patients) where happens a massive shift in the continuum from basic research to clinical practice and a critical leap was made from individual clinical study knowledge to more comprehensive general knowledge across different studies. In addition, different versions of the more complicated three-stage translation model (Dougherty & Conway, 2008), four-stage translation model (Khoury et al., 2007), and five-stage translation model (Surkis et al., 2016) have been proposed successively.
Studies on the classification of translational publications by “research level”
In 1976, Narin examined the journal interrelations in biomedical articles and put forward the concept of “Research Level” to classify over 900 biomedical journals into four Research Levels ranging from clinical observation to clinical mix, clinical investigation, and basic biomedical research (Narin et al., 1976). The most applied is clinical observation and the most fundamental is basic biomedical research. However, Narin’s “Research Level” classification method has certain limitations. For example, it doesn’t fit the journal’s research direction. In addition, it does not apply to journals from other databases in addition to the “Science Citation Index”; “Research Level” for papers in a journal is unique and is not assigned according to the research direction of the paper.
Lewison and Paraje extended the “Research Level” to the Medline database (Lewison & Paraje, 2004). They calculated the proportion of only clinical research papers, only basic research papers, and both clinical and basic research papers in biomedical journals based on the “basic” and “clinical” title lists, and assigned weighted coefficients of 1, 4, and 2.5, respectively, to obtain the RLcalc score. According to the RLcalc score, journals are assigned to the corresponding “Research Level”. Boyack developed a “Research Level” classification model for individual article-level, using multinomial logistic regression to train the model by extracting word texts from the title words, abstract words, and references, and to achieve the “Research Level” classification of more than 25 million papers in all disciplines in the Scopus database (Boyack et al., 2014). Compared with previous journal-level models, this article-level model has the advantage that it can be used to classify articles in any discipline and any database, regardless of whether the articles are published in SCI journals or biomedical journals. Surkis et al. created a list of definitions for each stage from T0 to T4 in the translational research spectrum proposed by CTSA and then identified and classified translational studies based on the titles, abstracts, and complete MeSH terms associated with publications using the Bayesian logistic regression algorithm (Surkis et al., 2016). Ke defined MeSH terms related to cells, molecules, and animals as basic research terms, and MeSH terms related to humans as applied terms (Ke, 2020). Next, he obtained a translational axis by learning vector representation of the MeSH terms (Ke, 2019). Then he used the representation learning method to obtain the vector representation of the MeSH terms of the paper, calculated the cosine similarity between the MeSH word vector and the translational axis vector, and assigned a “Level Score” (LS) to each MeSH term of each paper. The LS score for a paper is the average of LS for all MeSH terms of the paper. LS is a continuous variable used to identify translational science through embeddings of controlled vocabularies. Different from the previously developed “Research Level” indicator, LS can avoid classifying all papers into the same predefined “Research Level”. LS is capable of capturing more subtle differences in papers with different intensities of translation within the same “Research Level” identified.
Studies on identifying translational science within the triangle of biomedicine
Weber proposed a new way to quantify the “Research Level” using MeSH terms (Weber, 2013). Weber divided biomedical papers into seven categories based on whether they incorporated MeSH terms related to cells/molecules (C), animals (A), and humans (H). If only one of the MeSH terms such as animals (A), cell/molecular (C), and human (H) is included in one paper, it is classified as A, C, or H, respectively. When one paper includes both animal (A) and cell/molecular (C) related MeSH terms, it is classified as AC; Papers that include both animal (A) and human (H) related MeSH terms are classified as AH; Papers that include both cell/molecular (C) and human (H) related MeSH terms are classified as CH; Papers that include all three are classified as ACH. To define the MeSH terms of papers, Weber used the tree hierarchy of MeSH to map the three MeSH terms cell/molecular (C), animal (A), and human (H) to specific MeSH hierarchy nodes and their subtrees. To identify translational research, Weber constructed a “biomedical triangle”. Class A, C, and H papers are mapped to the three vertices of an equilateral triangle. AC, AH, and CH papers are respectively mapped to the midpoints of the three sides of the triangle. ACH papers map the center of the triangle. A collection of papers can be represented by the average position of a group of papers. Although a single paper can be mapped to only one of seven points (A, C, H, AC, AH, CH), a collection of papers can be mapped to any location within the triangle.
Studies on citation analysis between publications of different types
A paper was cited in clinical trials or clinical guidelines, suggesting that the paper might have an effect on clinical research or clinical practice that extends beyond academia. Based on a bibliometric analysis of 15 papers cited in clinical practice guidelines, Grant found that reference analysis of guidelines is a new way to monitor knowledge transfer (Grant et al., 2000). According to Eriksson, papers that were cited in clinical guidelines had a higher clinical “Research Level” score than papers that were uncited (Eriksson et al., 2020). Early works have shown that papers that were cited in clinical guidelines were often from their own countries and were more highly cited in the citation database than uncited ones (Grant, 1999; Lewison & Paraje, 2004; Lewison & Sullivan, 2008; Pallari et al., 2018). Contopoulos-Ioannidis, based on a sample of 101 basic research journal articles, found that there was a long-time interval between basic research and clinical trials (Contopoulos-Ioannidis et al., 2003). Thelwall used citations in clinical trials to predict the future influence of articles and found that the average number of citations for articles that have been cited in clinical trials was much higher than those of other articles in the same journal that have not been referenced in clinical trials (Thelwall & Kousha, 2016).
Based on the theory of the multi-stage translational research model, Rosas et al. regarded the emergence of primary research outputs in significant secondary research outputs (such as systematic reviews, meta-analyses, and clinical guidelines) as a milestone in the translation of primary research outputs (Rosas et al., 2013). To identify translational research, whether primary research is included in synthesized research is considered a measure. Rosas used the Mesh terms of papers in the PubMed database to determine the document type of forwarding citations. Han et al. partially revised Rosas’ method. Han et al. divided translational research into two categories: primary translational research, that is, the paper was any one of 11 types related to clinical research, clinical trials, or clinical guidelines; The second category is secondary translational research, which does not belong to any of the clinical research categories, but if a paper is cited in primary translational research, then the paper also makes an important contribution to the translational process (Han et al., 2018).
Newly developed indicators for measuring translation intensity
To predict the clinical translational potential of a single paper or a group of research papers, Hutchins et al. developed a novel indicator named “Approximate potential to translate scores (APT)” based on the method of the “biomedical triangle” and random forest model in machine learning (Hutchins et al., 2019). To construct vector space for machine learning, Hutchins summarized 7 characteristics of the focal paper (the proportion of “Molecular/cellular” (MC), “animal” (A) and “human”(H) MeSH terms; Whether “disease” (D), “treatment/diagnosis method” (E), “chemical/drug” (CD) is included in MeSH terms of the focal paper), average cited rate per year and 15 characteristics (Max, Mean and standard deviation of MC, A, and H; Mean and standard deviation of D, E, and CD) of the papers that cite the focal papers. APT was divided into 5 subgroups: < 5%, < 25%, < 50%, < 75% and > 95%. Hutchins et al. used citation data from different time windows to test the model and found that citation data from 2 years after publication also had a quite highly predictive performance.
Park et al. reported that the average APT for a group of problematic articles (human gene research articles with wrongly identified nucleotide sequences) ranged from 15 to 35%, indicating that there is a 15–35% chance that they will be referenced in clinical trials in the future (Park et al., 2022). The average APT of publications funded by the NIH Research Plan on Rehabilitation goals decreased from 2015 to 2018 with values between 0.33 and 0.29 (Jackson & Cernich, 2020). For publications supported by the Georgia CTSA grant (2007–2021), Llewellyn et al. calculated a mean APT score of 0.51, which suggests a 51% likelihood that the articles in the portfolio will be translated into clinical practice (Llewellyn et al., 2021). Li regarded APT as an indicator of translation intensity, which was used to quantify the translation results of 18 FDA-approved drugs (Li & Tang, 2021). They found that translation intensity (APT) had a positive correlation with the interdisciplinary characteristics of drug research. Nelson verified that content-based models (training the machine learning models by extracting characteristics from the metadata, titles, and abstracts) were superior to the citation-based method (inclusion in future patents, clinical guidelines, and clinical policies) in terms of forecasting the translational impact of medical papers (Nelson et al., 2022).
Kim et al. created a new measurement indicator called “Translational science scores (TS)” based on Han’s ideas (Kim et al., 2020). He believes that if a basic research paper is cited in a clinical research journal, it signals a transfer of knowledge from basic science to clinical science. Because each journal might be assigned multiple subject categories by the WOS database, Kim classified the journals that contained only the “clinical sciences” subject category as “clinical journals,” and the rest as “non-clinical journals”. TS refers to the ratio of the number of forward citations from “clinical journals” to the total number of forward citations the paper received. In order to ensure a stable TS score, the paper’s citation data must be maintained at least 4 years after publication (correlation coefficient threshold: 0.7), but if the paper has been cited at least 5 times, citation data of less than 4 years can also be used. Kim used several methods to verify the validity of TS. For example, a new indicator, called Department-based Translational Science (dTS), was calculated by using the proportion of clinical attributes of the first author’s institution, and it was found that dTS had a correlation of 0.748 with TS. Another example, the average TS of papers cited by patents was significantly higher than those papers that were not cited by patents. Furthermore, the average TS of basic research papers cited by patents was significantly higher than the average TS of all basic research papers in the sample.
Methodology
To investigate the clinical translation intensity of basic medical papers written by the Lasker Prize winners, we obtained the winners’ information from the official website of the Lasker Prize. We searched the published papers of the winners through the Web of Science and PubMed databases. We also established the dataset of published papers of Lasker Prize winners in Basic Medicine. Then, we further examined the clinical translation intensity of the Lasker Basic Medical Research Award winners’ basic medical research papers. We also examined the relationship between clinical translation intensity and the characteristics of the paper, the author, and the institution. The research framework is shown in Fig. 1.
Fig. 1.

Overall process of research framework
Sample selection
Clinical translation intensity is a novel dimension to evaluate the social impact of papers. Because clinical research and basic research are located at different positions in the timeline of medical translation, there are certain differences in translation intensity between the two types of studies. In this paper, we only selected basic research papers for measurement, and it is innovative and meaningful to investigate the clinical impact of basic medical research.
In the award setting of the Lasker Medical Research Award, the basic medical research Award and the clinical medical research Award are awarded as different awards. This allows us to target the world’s leading contributors to basic medicine, who produce research papers that are more focused on basic medicine. Winners of the Lasker Prize have not only published basic research papers, but also clinical research papers. The Lasker Award for Basic Medical Research recipients may have produced a small number of clinical research papers. Therefore, after we collected papers published by winners of the Lasker Award for Basic Medical Research, we began to distinguish between basic research papers and clinical research papers.
In the field of biomedicine, basic medical research is biased toward biomedical theory, and clinical research is biased toward clinical practice. Clinical research focuses on discovering new or better ways to detect, diagnose, treat, and prevent diseases. So, clinical research is mainly carried out on patients, including collecting patients’ personal information, disease information, and response to treatment. Clinical trials are the core component of clinical research. In contrast, basic medical research is carried out in the laboratory, mainly using cell or animal models. The goal of basic medical research is to better understand cell biology and the mechanisms of interaction between various molecules and pathways. This will help us discover new therapeutic targets.
In this framework, the iCite platform roughly divides papers into basic research papers and clinical research papers and proposes an indicator called “Clinical” under the translation module of the iCite platform. It is a publication-type tag (Yes/No) that is assigned to each paper to indicate whether it is a clinical research paper or not. A paper is considered by iCite to be a clinical research paper when it falls into at least one of the following categories: Clinical Study, Clinical Trial, Clinical Trial, Phase I, Clinical Trial, Phase II, Clinical Trial, Phase III, Clinical Trial, Phase IV, Adaptive Clinical Trial, Controlled Clinical Trial, Randomized Controlled Trial, Clinical Trial Protocol, Observational Study, Guideline, Practice Guideline. We will use this indicator called “Clinical” to identify clinical medical research in our sample. In addition to clinical medicine research papers, we consider them to be basic research papers.
As we all know, the Lasker Basic Medicine Award winners are a group of outstanding scientists in the field of basic medicine. Accordingly, the papers published by these laureates represent high-quality papers with considerable academic impact in the field of basic medicine. We prefer to believe that these high-quality papers may have a stronger clinical translation intensity than more general papers. Only if the paper has sufficient clinical translation intensity can further analysis of the relationship of the characteristics of the paper, the author, and the institution with clinical translation intensity be carried out.
Figure 2 shows the flowchart of the identification and selection of research data. We used the Web of Science Core Collection database and the PubMed database for retrieving papers. The recipients’ names and institutions are used as search terms. The retrieval period was from April 6 to June 25, 2020. We initially received 10,048 papers from different databases. After 10,048 papers were imported into the iCite database, 9596 papers were returned. We performed de-duplication processing based on PMID number; 9323 papers remained. According to the TS score calculation method described by Kim in her paper, 59 papers of the “clinical” type were excluded. To calculate the TS score, 269 papers without forward citation information were deleted, and 8995 papers remained. Next, all the journals included in JCR in 2019 were classified by reference to the WOSCs discipline. According to the comparison table of “WOSCs classification—clinical and non-clinical” provided by Kim, Python programming was used to further sort out the “Journal name—Clinical and non-clinical comparison table” (including 3106 clinical journals and 9145 non-clinical journals). We used the pubmed_mapper program package to tag the clinical attributes of forward citations in our sample. Based on the TS calculation formula, we successfully assigned TS variables to 8782 papers. We referred to the stability thresholds of APT and TS comprehensively. We lowered the correlation coefficient threshold of TS to 0.6 so that the cumulative citation data 2 years after publication could meet the stability requirements of APT and TS. Then, we only retain papers that have been published for at least two years or have been cited at least five times. Because “review”, “letter & editorial material” and “other types” of papers may affect the stability of the results in our study, we deleted the papers that were not “Article” and the papers with an empty publication type. In the end, we had a sample of 7274 papers.
Fig. 2.
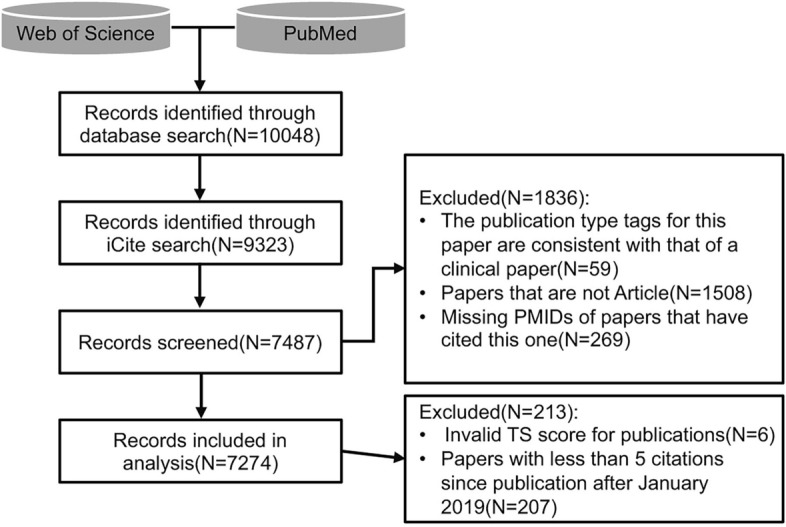
Flowchart of the identification and selection of research data. According to iCite’s definition of publication types, clinical article tags include Clinical Study, Clinical Trial, Clinical Trial, Phase I, Clinical Trial, Phase II, Clinical Trial, Phase III, Clinical Trial, Phase IV, Adaptive Clinical Trial, Controlled Clinical Trial, Randomized Controlled Trial, Clinical Trial Protocol, Observational Study, Guideline, Practice Guideline
Variable selection
Three dependent variables (APT, TS and Cited by Clin.) were chosen to measure the clinical translation intensity of papers. RCR was used as a reference variable. We selected three types of explanatory variables: 9 characteristic variables about the paper, 4 characteristic variables about the Lasker prize winners, and 2 characteristic variables about the institutions based mainly on the following evidence. All of the variables we selected are listed in Table 1.
Table 1.
Description of the variables
| Type | Number | Indicator | Description |
|---|---|---|---|
| Clinical impact indicator | 1 | APT score (approximate potential to translate) | Likelihood estimates of future citation of papers by clinical trials or clinical practice guidelines based on machine learning algorithms. |
| 2 | TS score (translational science score) | The ratio of the number of forward citations a paper received from clinical science to the total number of forward citations. | |
| 3 | Cited by clin. | The number of times a research paper is cited in a clinical research paper. | |
| Academic impact indicator | 1 | RCR (relative citation ratio) | A field-normalized and time-normalized citation score. RCR of a paper is the ratio of the paper citation rate to the expected citation rate in the field. According to Hutchins, when calculating the RCR, papers financed by NIH's R01 program were used as a benchmark. |
| Characteristics of the paper | 1 | Publication age | The year difference between the date of publication and the search date of the paper. |
| 2 | Primary research paper | Whether the paper is a primary research paper. Primary research papers include journal articles, clinical trials, pathology reports, etc., rather than editorial or reviews, etc.0=No;1=Yes. | |
| 3 | Multidisciplinary subject or not | Whether the category “Multidisciplinary science” is included in the Web of Science subject classification of a paper. 0 = No; 1 = Yes. | |
| 4 | Number of disciplines | The number of disciplines in the Web of Science subject classification. | |
| 5 | Number of authors | The number of all authors of the paper. | |
| 6 | Number of funded projects | The number of funded projects publicly mentioned in the paper by the authors. | |
| 7 | Title length | Number of words in Title. | |
| 8 | Paper length | The number of paper pages. | |
| 9 | Number of references | Number of references cited in the paper. | |
| Characteristics of the author | 1 | Physical age | The age of the author who received the Lasker Prize in Basic Medicine at the time of publication of the paper. |
| 2 | Gender | Gender of the author who received the Lasker Prize in Basic Medicine. 0 = male; 1 = female. | |
| 3 | Nationality | Nationality of the author who received the Lasker Prize in Basic Medicine. The first nationality of the winners is chose to be analyzed. | |
| 4 | Nobel prize | Whether the author who received the Lasker Prize in Basic Medicine has also received a Nobel Prize. 1 = received, 0 = not received. | |
| Characteristics of the institution | 1 | Number of institutions | Total number of institutions to which all authors belong. |
| 2 | Institutional type | The type of the institution where the author who received the Lasker Prize in Basic Medicine works, includes universities, research institutes, hospitals, businesses or company, and foundations. |
Dependent variables
APT
APT was first proposed by Hutchins in 2019. In the opinion of He and his colleagues [12], a paper cited once by clinical papers such as clinical trials or clinical practice guidelines marked a significant advance in the translation of biomedical knowledge. Hutchins selected 22 characteristic factors of each paper as early markers for the translation from basic research to clinical research. These factors predicted the probability of the paper being cited by clinical papers in the future, that is, the clinical usefulness of the paper in the future. On the iCite platform, the “clinical translational potential approximation (APT)” indicator is divided into five groups: < 5%, 25%, 50%, 75%, and > 95%. When the APT value of papers is 0.25, an average of 25% of papers are expected to be referenced in clinical papers. When the APT value of papers is 0.75, an average of 75% of papers are most likely to be mentioned in clinical papers. The larger the APT value, the greater the probability of the paper being used by clinical research in the future. The maximum APT value is 1, indicating that papers are expected to have an average of 100% chance of being cited in clinical papers. There is a minimum value of 0, which indicates that the probability of a paper being cited in a clinical paper is close to zero.
TS
In 2020, Kim proposed TS based on the ratio of the number of forward citations received from clinical science to the total number of forward citations. Forward citations from clinical research were seen as evidence of the clinical application of basic research. The authors used the share of citations in clinical journals to evaluate the relative importance of knowledge in a basic research paper for subsequent clinical and basic research. The TS score is between 0 and 1. The higher the TS score, the greater the clinical importance of a cited paper. A TS score greater than 0.5 indicates that the research paper will have a significant impact on clinical research than on basic research.
Clited by Clin.
Clited by Clin.is an indicator provided in the translation module on the iCite platform handled by the office of Portfolio Analysis at the National Institutes of Health (NIH). The developers of this indicator consider the fact that basic research papers are cited by clinical research papers to be a strong indication that knowledge generated in basic research papers has been transferred to clinical research. Clinical research papers are generally defined as clinical trials or clinical practice guidelines. iCite classifies any of the 13 types of research (as listed in “Sample selection” section) as clinical research. In this framework, Cited by Clin. (The number of times a research paper is cited in a clinical research paper) is an indicative indicator of clinical translation intensity.
Reference variable
RCR (The relative citation ratio) is an indicator developed by the National Institutes of Health (NIH) in 2015 (Hutchins et al., 2016). RCR is a field- and time-normalized citation score. Hutchins, the earliest researcher on RCR, pointed out that the co-citation network can accurately reflect a paper’s field. Firstly, the field citation rate of the paper is calculated. Then, the RCR of the paper is the ratio of the paper citation rate to the expected citation rate in the field. According to Hutchins, when calculating the RCR, papers financed by NIH’s R01 program were used as a benchmark. When RCR is equal to 1.0, it indicates that the academic impact of the paper is equivalent to the average impact of NIH R01 project-funded papers. When RCR is greater than 1.0, it indicates that the academic impact of the paper is higher than the average level of NIH R01 project-funded papers. The RCR value can be obtained through the citation module of the iCite platform of NIH.
Explanatory variables
Characteristic variables of the papers
It takes a long time for basic research findings to be translated into clinical interventions to bring broader benefits to public health. So, there is a large “translational lag” (Roberts et al., 2012) or “valley of death” (Meslin et al., 2013). Studies have shown that it takes an average of 17 years for scientific research evidence to reach clinical practice (Westfall et al., 2007). Contopoulos-Ioannidis found that only 25% of high-impact basic medical research papers with clear treatment options or high potential for disease prevention entered clinical trials 20 years after publication (Contopoulos-Ioannidis et al., 2003, 2008). Therefore, publication age may be an factor influencing the clinical translation intensity of papers.
Broadly speaking, papers can be divided into primary research and secondary research. Scientific discovery needs to undergo a process of knowledge translation from its generation to its application in clinical research and practice. A primary research study generates the most original results, whereas a review, practice guidelines, and policy literature are considered secondary research. Primary research translates knowledge into secondary research through dissemination and diffusion. The inclusion of primary research into secondary research is a symbolic event of the occurrence of knowledge translation (Rosas et al., 2013). In other words, secondary research is the output of the next stage of primary research along the translation continuum. Therefore, whether a paper is a primary research or not might be correlated with the clinical translation intensity of the paper.
Bordons analyzed papers published by Spanish authors from 1990 to 1993. He found that there was a significant positive correlation between the Research Level and the interdisciplinary nature of the papers in both the cardiovascular system and pharmacology fields. The higher the Research Level was, the higher the degree of interdisciplinary research was (Bordons & Zulueta, 1997). Li studied drug research papers and concluded that the diversity of studies was positively correlated with the translation intensity of drugs (Li & Tang, 2021). Therefore, interdisciplinarity may be associated with the clinical translation intensity of papers. In the WOS database, the subject classification is determined based on the subject attributes of journals. One journal corresponds to one or more disciplines. In this study, we chose the number of disciplines assigned to journals and whether the journal includes the “Multidisciplinary Science” category to measure the interdisciplinary nature of papers.
In addition, we also chose some characteristics of papers as explanatory variables that have been proven to be related to the citation times or the quality of papers, such as number of authors and funded projects, length of the title, length of the paper, number of references (Amara et al., 2015; Ayres & Vars, 2000; Bornmann & Leydesdorff, 2015; Di Vaio et al., 2012; Falagas et al., 2013; Vanclay, 2013; Webster et al., 2009).
Characteristic variables about the authors
In terms of the characteristics of authors, studies have shown that authors of different ages have different citation behaviors (Costas & Bordons, 2011; Costas et al., 2012). The physical age reflects the author’s career stage which has been found to affect scientific integrity (Fanelli et al., 2015), knowledge recency (Liang et al., 2020), work meaningfulness (Lopez & Ramos, 2017), future research impact (Zuo & Zhao, 2021), publication and scientists’ satisfaction (Husemann et al., 2017). Whether there are differences in clinical translation intensity in the papers published by authors at different career stages needs to be further examined. At the same time, gender, nationality, and institution are biased in the research community. Gender has a significant influence on the citations of papers. In some research fields, publications by female first authors receive fewer citations than expected. For example, in the urology field, female authorship exhibited a significant citation advantage over male authors, but female authors were less likely to be cited (Shukla et al., 2021; Zhang et al., 2021). This situation also exists in astronomical publications (Caplar et al., 2017). In terms of nationality, some studies have found that international co-authorship is associated with higher citations (Sin, 2011). Therefore, in this study, gender and nationality are included as explanatory variables. Finally, the award effect does exist, and papers written by highly reputed authors often receive higher citations (Collet et al., 2014). The publications of Nobel prize-winning authors are more likely to receive substantial citation growth than non-Nobel publications (Frandsen & Nicolaisen, 2013). Therefore, whether the author won the Nobel Prize was taken as one of the explanatory variables.
Characteristic variables of the institutions
Some studies have found that the size of the cooperative team had a potential impact on the citations of outputs (Lecocq & Van Looy, 2009). The number of institutions co-publishing papers was also slightly associated with an increase in citations to publications (Didegah & Thelwall, 2013; Leimu & Koricheva, 2005). Narin and Hamilton found that the average Research Level of papers published by medical schools, hospitals, and clinics in the United States was between 2.0 and 3.0, while the average Research Level of papers published by universities was between 3.0 and 4.0 (Narin & Hamilton, 1996). It can be seen that university research is more basic than that of medical schools, hospitals, and clinics. Narin and Rozek discovered that in the same journals between 1973 and 1975, biomedical research conducted by pharmaceutical companies was more clinical than that accomplished by universities but more basic than the biomedical research conducted by major U.S. medical schools, hospitals, and clinics (Narin & Rozek, 1988). Top universities tend to be associated with more outputs and citation scores (Amara et al., 2015). Given this, we assumed that the clinical translation intensity of biomedical research might be related to the author’s institutional type and the number of institutions.
Data acquisition
In this study, APT, Cited by Clin. and RCR were extracted based on the PMID numbers through the iCite database. TS was calculated according to Kim’s calculation method. In total, we chose 9 variables to describe the characteristics of the papers, and 4 variables to represent the characteristics of the authors (Note that the characteristics of the author here refer specifically to the characteristics of the author of each paper who received the Lasker Prize in Basic Medicine, not to any author of each paper). And 2 variables for institutional characteristics. The official website of the Lasker Prize (https://laskerfoundation.org) is the most authoritative data source which has recorded the name, year of award, and the institutions of the winners. We searched for other information such as the gender, the nationality of the winners, and whether they ever won the Nobel Prize through Wikipedia and Google. We obtained the characteristics of the papers and the institutions through the Web of Science database and PubMed. These characteristics include publication year, the total number of pages, the title, the authors, the institutions, the WOS discipline, and funded projects. We calculated publication age, the length of titles, the number of authors, institutions, disciplines, and funded projects. In addition, papers are tagged as to whether they are primary research papers or not based on information from the iCite database. We classified papers into multi-disciplinary and non-multi-disciplinary according to whether or not they contained “Multidisciplinary Sciences categories” in the WOS discipline field. We manually divided the institutions of the winners into five categories.
Statistical methods
Firstly, we conducted a descriptive analysis of the distribution characteristics of APT and TS. Next, a nonparametric test including Mann–Whitney U (2 samples) and Kruskal–Wallis 1-way ANOVA (k samples) was selected for the univariate analysis to compare the distributions of APT, TS, and Cited by Clin. across groups. Because the distribution of clinical translation intensity varied among subgroups, the mean rank was compared between two and more independent samples. Thirdly, we used the Spearman rank correlation test to analyze the correlation among continuous variables. Next, we used the OLS regression model and a quantile regression model (Koenker & Bassett, 1978) to examine whether the characteristics of papers, authors, and institutions have an effect on the clinical translation intensity of papers and their changing trends. By correcting heteroscedasticity, the OLS regression method can provide more robust results. Quantile regression is suitable for the test of linear or nonlinear relationships between the dependent variable and the explanatory variables. The quantile regression method can show the overall characteristics of dependent variables under each quantile, less affected by outliers. By comparison to the OLS regression method, the quantile regression method helps eliminate biased estimates in OLS and is more robust. Different from APT and TS, Cited by Clin. contains a large number of zero values (80%), and its numerical distribution is over-dispersion (the Variance is significantly larger than the Mean), which exceeds the predictive ability of the quantile regression model. Therefore, the zero-inflated negative binomial (ZINB) model (Cameron & Trivedi, 1998) was used to test the influencing factors Cited by Clin. SPSS 26.0 software was used for descriptive statistics, univariate analysis, and correlation analysis, and STATA 16.0 software was used for regression analysis. p values less than 0.05 were considered statistically significant.
Results
Descriptive analysis
APT is an indicator to predict the probability of a paper or a group of papers being cited by clinical papers in the future. This refers to the clinical utility of papers in the future. As shown in Table 2, APT (N = 7274) ranges from 0.05 to 0.95 (Mean ± SD: 0.24 ± 0.26, Median: 0.05). The median APT value of Lasker Prize winners’ published papers is 0.05, indicating that 50% of Lasker prize winners’ papers have an approximate value of clinical translational potential less than 0.05, and the potential of being referenced by clinical papers is less than 5%. APT values of more than half of the papers were 0.05 (51.8%), and the rest were 0.25 (24.7%), 0.50 (10.7%), 0.75 (10.2%), and 0.95 (2.6%) according to their frequency. It can be seen that the papers with an APT value less than or equal to 0.50 account for 87.2%, while those with an APT value greater than 0.5 account for only 12.8%. And that means, 87.2% of the papers had a 50% or lower probability of being cited in future clinical papers, and only 12.8% had a more than 50% probability of being cited in future clinical papers.
Table 2.
Descriptive statistics for dependent variables
| APT (N = 7274) | TS (N = 7274) | Cited by Clin. (N = 7274) | ||||||
|---|---|---|---|---|---|---|---|---|
| Mean ± SD | Median (IQR) | Range | Mean ± SD | Median (IQR) | Range | Mean ± SD | Median (IQR) | Range |
| 0.24 ± 0.26 | 0.05 (0.05–0.25) | 0.05–0.95 | 0.24 ± 0.21 | 0.19 (0.06–0.36) | 0.00–1.00 | 0.59 ± 2.40 | 0.00 (0.00–0.00) | 0.00–64.00 |
| Valid values | Frequency | % | Valid values | Frequency | % | Valid values | Frequency | % |
|---|---|---|---|---|---|---|---|---|
| APT = 0.05 | 3769 | 51.8 | TS ≤ 0.05 | 1627 | 22.4 | 0 | 5821 | 80.0 |
| APT = 0.25 | 1794 | 24.7 | 0.05 < TS ≤ 0.25 | 2826 | 38.9 | 1 | 740 | 10.2 |
| APT = 0.50 | 778 | 10.7 | 0.25 < TS ≤ 0.50 | 1973 | 27.1 | 2 | 270 | 3.7 |
| APT = 0.75 | 742 | 10.2 | 0.50 < TS ≤ 0.75 | 678 | 9.3 | 3 | 146 | 2.0 |
| APT = 0.95 | 191 | 2.6 | 0.75 < TS ≤ 0.95 | 101 | 1.4 | 4 | 88 | 1.2 |
| 0.95 < TS ≤ 1.00 | 69 | 0.9 | 5–6 | 83 | 1.1 | |||
| 7–8 | 47 | 0.7 | ||||||
| 9–23 | 63 | 0.9 | ||||||
| ≧24 | 16 | 0.2 |
TS value is between 0 and 1. It stands for the ratio of the paper’s forward citations from clinical research to the total forward citations the paper received. The higher the TS value, the more critical the basic research paper is to subsequent clinical research, and the more valuable it is to clinical research. If the TS score exceeds 0.5, it indicates that a basic research paper is mainly cited in clinical research papers. This is because its value to clinical research exceeds its value to basic research. In our sample, TS (N = 7274) ranged from 0.00 to 1.00 (Mean ± SD: 0.24 ± 0.21, Median: 0.19). 88.4% of the papers had TS values less than or equal to 0.5. Only 11.6% of papers had a TS value of more than 0.5. 11.6% of papers were more valuable for clinical research than for basic research and had relatively higher clinical translation intensity. The median TS value of the papers is 0.19 (less than 0.5), suggesting that 50% of the Lasker Prize winners’ papers are relatively more influential for subsequent basic research. From the perspective of upper and lower quartiles, the lower quartile was 0.06, while the upper quartile was only 0.36, still less than 0.5, indicating that 75% of papers in our sample had a higher value for basic research than for clinical research, and the clinical translation intensity was low. On further examination, the 85th and 95th percentile of TS scores were 0.47 and 0.65 respectively. So, to be more precise, about 85% of Lasker Prize-papers have more value for basic research than for clinical research; About 15% of Lasker Prize winners’ papers had more value to clinical research than basic research, and 5% of Lasker Prize winners’ papers had nearly twice as much value to clinical research as to basic research.
On average, the 7274 papers in this sample were cited 0.59 times by clinical research papers. The maximum number of citations of a single paper by clinical research papers reached 64. However, eighty percent of the papers had a Cited by Clin. of zero. This suggests that 80% of the papers in our sample have not yet been cited in clinical research papers. 10.2% of the papers were cited once by clinical research papers; 3.7% were cited twice by clinical research papers; 3.2% of the papers were cited 3–4 times by clinical research papers; Papers that were cited five or more times by clinical research papers accounted for only 2.9% of the sample.
As shown in Fig. 3a, when the publication age is less than 20 years, APT and TS show a slight fluctuation between 0.2 and 0.3, but the variation of TS is always around a horizontal line, while APT shows a downward trend. When the age of the papers is between 20 and 34, the average APT value of the papers continues to decline, approaching 0.075, while the average TS value still has no significant change and only fluctuates in a small range between 0.2 and 0.3. When the papers are older than 34, there is a significant fluctuation in the rise of APT and TS. The trend line of TS is close to 0.8, and APT rises to 0.56. In Fig. 3b, when the age of the paper is less than 33 years old, the average Cited by Clin. of the papers tends to increase slowly from 0 to 1. When a paper is 13 years, 15 years, and 19 years old, Cited by Clin. value has a small peak, slightly exceeding 1. After the age of 33, there is a big jump in the Cited by Clin. score every three years: at 33, the average Cited by Clin. score is 1.32; At the age of 36, the average Cited by Clin. score was 3.63; At age 40, the average Cited by Clin. score is 8.5.
Fig. 3.

Box plot of the APT, TS score, and Cited by Clin. distribution and average clinical translation intensity compared with that average citation at different publication ages. As Box plots shown in Fig. 3, APT, TS, and Cited by Clin. are all positively skewed. The first quantile value of the box of APT is equal to the median and the lower limit. The median of APT and TS is both smaller than the mean. Since the median, first quartile, third quartile, upper limit, and lower limit of Cited by Clin. are all 0, the box and the whisker are barely visible. And plenty of outliers from Cited by Clin. are shown. In Fig. 3, we can also compare the average APT, TS, and Cited by Clin. of papers at different publication ages in the sample and their differences with average RCR. This is a two-ordinate plot. The left ordinate is APT, TS, and Cited by Clin. and the right ordinate is RCR. If Cited by Clin. is compared with APT and TS in the same figure, APT and TS of the paper change slightly with the age of publication, which is masked by the change in Cited by Clin. Therefore, we use a, b to compare the differences between APT & TS and RCR, and the differences between Cited by Clin. and RCR, respectively
RCR is the ratio of the average number of citations per year to the expected number of citations per year for papers funded by the R01 program NIH. In Fig. 3a and Fig. 3b, the RCR value of papers is relatively stable when the papers are 2 to 10 years old. However, RCR varies greatly between 3.0 and 6.0 when the publication age is from 10 to 34 years. There is a substantial increase in the average RCR of papers after 34 years, even exceeding 7.0 to some extent.
In general, compared with RCR, APT, TS and Cited by Clin. have a more similar trend with the age of publication increase. RCR fluctuates a great deal before the age of 34. Instead of that, APT, TS, and Cited by Clin. do not change significantly before the papers are less than 34 years old. We were surprised to find that after the paper had been published for 34 years, the four variables exhibited the same change trend. There was a small decrease, but it increased steadily on the whole. In particular, the trend line of APT and TS almost coincided.
Nonparametric test
Non-parametric tests were used to compare the clinical translation intensity between 12 independent variables’ subgroups (Table 3). We found that clinical translation intensity differed significantly in these 6 characteristics related to the paper, 4 characteristics about the author, and 2 characteristics of the institutions. However, we also found that there were no significant differences in publication age, multidisciplinary science, number of disciplines, gender, and Nobel Prize for individual types of clinical translation intensity variables. We’ll work through them one by one.
Table 3.
Nonparametric test of APT, TS and Cited by Clin. differences between groups
| Variable | Frequency | % | APT | TS | Cited by Clin. | ||||||
|---|---|---|---|---|---|---|---|---|---|---|---|
| Mean rank | Statistics | p value | Mean Rank | Statistics | p value | Mean rank | Statistics | p value | |||
| Characteristics of the paper | 7274 | ||||||||||
| Age of publication | 134.298*** | 0.000 | 1.367 | 0.713 | 64.481*** | 0.000 | |||||
| ≤ 10 (REF) | 3027 | 41.61 | 3884.16 | 3635.36 | 3475.86 | ||||||
| 11–20 | 2017 | 27.74 | 3670.51 | 3602.10 | 3766.18 | ||||||
| 21–30 | 1805 | 24.81 | 3314.80 | 3681.31 | 3755.61 | ||||||
| ≥ 31 | 425 | 5.84 | 3094.56 | 3634.69 | 3676.41 | ||||||
| Primary research paper | − 2.404* | 0.016 | − 8.603*** | 0.000 | − 4.110*** | 0.000 | |||||
| No (REF) | 409 | 5.62 | 3860.27 | 4503.93 | 3926.65 | ||||||
| Yes | 6865 | 94.38 | 3624.23 | 3585.88 | 3620.27 | ||||||
| Multidisciplinary science | − 5.663*** | 0.000 | − 1.780 | 0.075 | − 4.013*** | 0.000 | |||||
| No (REF) | 5223 | 71.80 | 3557.24 | 3664.92 | 3594.32 | ||||||
| Yes | 2051 | 28.20 | 3841.88 | 3567.66 | 3747.47 | ||||||
| Number of disciplines | − 3.660*** | 0.000 | − 5.144*** | 0.000 | − 1.054 | 0.292 | |||||
| 1 discipline | 4943 | 67.95 | 3580.66 | 3550.67 | 3625.07 | ||||||
| ≥ 2 disciplines | 2331 | 32.05 | 3758.04 | 3821.63 | 3663.87 | ||||||
| Number of authors | 795.584*** | 0.000 | 481.189*** | 0.000 | 128.936*** | 0.000 | |||||
| 1 author | 239 | 3.29 | 3517.08 | 4541.45 | 3834.75 | ||||||
| 2–5 authors | 3514 | 48.31 | 3063.45 | 3121.82 | 3438.07 | ||||||
| 6–10 authors | 2388 | 32.83 | 3932.05 | 3902.93 | 3794.33 | ||||||
| ≥ 11 authors | 1133 | 15.58 | 4822.51 | 4486.77 | 3883.88 | ||||||
| Number of funded projects | 162.352*** | 0.000 | 67.652*** | 0.000 | 7.598* | 0.022 | |||||
| 0 funded project | 1834 | 25.21 | 3367.23 | 3658.34 | 3703.84 | ||||||
| 1–3 funded projects | 2611 | 35.89 | 3437.73 | 3387.54 | 3582.02 | ||||||
| ≥ 4 funded projects | 2829 | 38.90 | 3997.09 | 3854.69 | 3645.69 | ||||||
| Characteristics of the author | |||||||||||
| Physical age | 38.415*** | 0.000 | 61.759*** | 0.000 | 61.394*** | 0.000 | |||||
| ≤ 35 | 38 | 0.52 | 3812.88 | 4279.62 | 3639.16 | ||||||
| 36–45 | 369 | 5.07 | 3673.12 | 3549.45 | 4004.33 | ||||||
| 46–55 | 1634 | 22.47 | 3663.99 | 3534.23 | 3784.27 | ||||||
| 56–65 | 2480 | 34.09 | 3534.99 | 3564.61 | 3629.67 | ||||||
| 66–75 | 1730 | 23.79 | 3559.79 | 3573.01 | 3496.06 | ||||||
| ≥ 75 | 1023 | 14.06 | 3955.75 | 4096.11 | 3528.85 | ||||||
| Gender | − 1.717 | 0.086 | − 0.035 | 0.972 | − 4.764*** | 0.000 | |||||
| Male | 7005 | 96.30 | 3629.89 | 3637.67 | 3621.47 | ||||||
| Female | 269 | 3.70 | 3835.66 | 3633.07 | 4054.98 | ||||||
| Nationality | 200.296*** | 0.000 | 329.320*** | 0.000 | 190.633*** | 0.000 | |||||
| The U.S. (REF) | 4765 | 65.51 | 3680.71 | 3633.47 | 3639.14 | ||||||
| Japan | 539 | 7.41 | 3704.36 | 4011.42 | 3499.82 | ||||||
| United Kingdom | 486 | 6.68 | 3164.83 | 3497.36 | 3443.69 | ||||||
| Australia | 343 | 4.71 | 3878.98 | 3639.59 | 4253.64 | ||||||
| Germany | 347 | 4.77 | 3158.15 | 2426.09 | 3155.74 | ||||||
| Canada | 283 | 3.89 | 3323.87 | 3282.74 | 3863.97 | ||||||
| Switzerland | 157 | 2.16 | 4719.60 | 4745.21 | 4351.32 | ||||||
| Israel | 97 | 1.33 | 2706.84 | 3406.66 | 3053.63 | ||||||
| France | 104 | 1.43 | 4761.88 | 5371.74 | 3596.94 | ||||||
| Sweden | 61 | 0.84 | 4303.43 | 5645.01 | 4217.01 | ||||||
| South Africa | 34 | 0.47 | 2452.22 | 2566.37 | 2911.00 | ||||||
| Argentina | 34 | 0.47 | 2964.71 | 2937.47 | 3625.66 | ||||||
| Romania | 24 | 0.33 | 3055.69 | 4124.33 | 3256.21 | ||||||
| Nobel prize | − 3.597*** | 0.000 | − 0.403 | 0.687 | − 3.808*** | 0.000 | |||||
| No | 3527 | 48.49 | 3553.65 | 3647.71 | 3570.10 | ||||||
| Yes | 3747 | 51.51 | 3716.42 | 3627.89 | 3700.95 | ||||||
| Characteristics of the institution | |||||||||||
| Number of institutions | 590.902*** | 0.000 | 240.253*** | 0.000 | 41.780*** | 0.000 | |||||
| ≤ 1 institution | 1903 | 26.16 | 3063.97 | 3294.53 | 3526.83 | ||||||
| 2–5 institutions | 3987 | 54.81 | 3545.27 | 3538.42 | 3615.46 | ||||||
| ≥ 6 institutions | 1384 | 19.03 | 4691.78 | 4394.51 | 3853.17 | ||||||
| Institutional type | 172.779*** | 0.000 | 275.008*** | 0.000 | 140.825*** | 0.000 | |||||
| University (REF) | 5726 | 78.72 | 3531.46 | 3506.45 | 3549.19 | ||||||
| Research Institute | 1128 | 15.51 | 4170.93 | 4439.32 | 4031.14 | ||||||
| Hospital | 296 | 4.07 | 4012.62 | 3471.44 | 4029.85 | ||||||
| Business or company | 45 | 0.62 | 4121.52 | 4811.80 | 3628.46 | ||||||
| Foundation | 79 | 1.08 | 2025.84 | 1640.30 | 2952.53 | ||||||
Statistics: Mann–Whitney U (2 samples) or Kruskal–Wallis 1-way ANOVA (k samples) tests
IQR inter-quartile range
***p < 0.001; **p < 0.01; *p < 0.05
In our sample, 41.61% of papers were published 10 years ago or earlier. The publication age of the papers (N = 7274) ranges from 0 to 40 (Mean ± SD: 14.71 ± 9.359). It can be seen that the younger the publication age of the paper, the higher the mean rank of APT (p < 0.001). Cited by Clin. variable also has significant differences in the group of publication age. A pairwise comparison shows that Cited by Clin. variable of group ≦ 10 is significantly smaller than that of other age groups (p < 0.05). However, there was no significant difference in the age groups of publication for TS.
Moreover, APT (p < 0.05), TS (p < 0.001), and Cited by Clin. (p < 0.001) of primary research papers are significantly lower than those of secondary research papers. We found that 28.20% of papers were published in journals in the “Multidisciplinary science” category defined by WOS. APT and Cited by Clin. scores of multidisciplinary papers were significantly higher than those of non-multidisciplinary papers (p < 0.001). However, there is no significant difference in TS score on whether the paper is multidisciplinary science or not. In this study, according to the data downloaded from the Web of Science, 67.95% of the papers belong to a single discipline. In addition, 32.05% of the papers belong to two or more disciplines. The number of disciplines in which papers are published varies from 1 to 6, with an average of 1.43 disciplines. The APT and TS of papers with 2 or more disciplines are significantly higher than those of papers with a single discipline (p < 0.001). But the number of disciplines the papers belong to does not affect Cited by Clin.
In our sample, 48.3% of papers had 2–5 authors; 32.8% of papers had 6 to 10 authors; Fewer papers had 11 or more authors (15.58%), and only 3.29% had a single author. The mean number of authors per paper was 6.88 ± 6.258. Significant differences were found between the different number of authors subgroups for APT, TS, and Cited by Clin (p < 0.001). Roughly speaking, the larger the number of authors, the higher the APT. To our surprise, the clinical translation intensity of papers published by a single author is higher than that of papers published by 2 to 5 authors.
In addition, 26.16% of papers are published by researchers from a single institution; 54.81% of papers were written by authors from 2 to 5 institutions. The mean number of collaborating institutions was 3.78 with a median of 3.00. We found that all three types of clinical translation intensity variables showed the same trend, that is, the “≧ 6 institutions” group was significantly larger than the “2–5 institution” group (p < 0.001), and the “2–5 institution” group was greater than “≦ 1 institution” group (p < 0.001).
Moreover, about 25.21% of papers in the sample were not supported, 35.89% of the papers were supported by 1–3 projects, and 38.90% of the papers were supported by 4 or more projects. The mean number of projects per paper was 3.29 with a median of 2.00. APT of papers with 4 or more funded projects is significantly higher than that of the other two groups (p < 0.001). For TS and Cited by Clin., 1–3 funded project groups are lower than the other two groups (p < 0.05).
The 56–65 age group of authors produced the most papers, accounting for 34.09%, followed by the 66–75 age group (23.79%) and the 46–55 age group (22.47%). Only 14.06% of papers were written by authors in the 75 or older age group. It is interesting to note that the APT and TS of papers published by authors aged 75 and above were significantly higher than that of papers published by authors aged 46–55 (p < 0.01), 56–65 (p < 0.001), and 66–75 (p < 0.001). Furthermore, authors in the 36–45 age group had the highest average Cited by Clin. for published papers.
The number of papers published by males is 7005, accounting for 96.3%, which is the absolute majority. The results show that Cited by Clin. of the papers published by female laureates is significantly higher than that of male laureates, but the gender difference between APT and TS is not significant (p < 0.001).
There is a significant difference in clinical translation intensity between the nationalities of the winners. The United States has the highest number of winners (65.51%), but the winners with the highest average APT are from France (p < 0.001); The winners with the highest average TS of papers are from Sweden and France (p < 0.001); The highest average Cited by Clin. for papers came from Switzerland and Australia (p < 0.001).
Winners affiliated with universities published the most, accounting for 78.72%, followed by research institutes (15.51%), hospitals (4.07%), foundations (1.08%), and businesses or companies (0.62%). The clinical translation intensity, whether APT, TS, or Cited by Clin., differed significantly in terms of the five institutional types. In this study, the APT of papers published by winners whose institution is a research institute is the highest. This is followed by businesses or companies, then hospitals, and universities, and the lowest is foundations. In a slightly different way, winners whose institutions were research institutes or hospitals received the highest Cited by Clin., followed by universities, companies, or businesses.
In our sample, the Lasker laureates who won the Nobel Prize produced 3747 papers, accounting for 51.51%. In contrast, the Lasker laureates who did not win the Nobel Prize later produced 3527 papers, accounting for 48.49%. There is no big difference between the two groups in the number of papers published. However, it is very interesting to find that the APT and Cited by Clin. of the papers published by the Lasker prize winners who also won the Nobel Prize was significantly higher than that of the papers published by the Lasker prize winners who did not win the Nobel Prize (p < 0.001). Unfortunately, TS values were not significantly related to a Nobel Prize (p > 0.1).
Spearman correlation
Spearman correlations were conducted among APT, TS, Cited by Clin., RCR, and all of the other continuous variables. As shown in Table 4, APT has a moderate positive correlation with TS (r = 0.549, p < 0.05), Cited by Clin. (r = 0.530, p < 0.05); TS is weakly correlated with Cited by Clin. (r = 0.383, p < 0.05); RCR was positively associated with clinical translation intensity indicators (APT: r = 0.553, p < 0.05; TS: r = 0.184, p < 0.05; Cited by Clin.: r = 0.381, p < 0.05). The correlation between RCR and TS is significant, but the correlation coefficient is less than 0.2, which can be considered as having no correlation.
Table 4.
Spearman’s Rho correlation matrix for continuous variables
| Publication age | Number of disciplines | Number of authors | Number of institutions | Number of funded projects | Length of title | Length of paper | Number of references | Physical age | APT | TS | Cited by clinical | RCR | |
|---|---|---|---|---|---|---|---|---|---|---|---|---|---|
| Publication age | 1.000 | 0.002 | − .419** | − .530** | − .545** | .103** | − .367** | − .253** | − .455** | − .131** | 0.013 | .096** | − 0.008 |
| Number of disciplines | 0.002 | 1.000 | .045** | .032** | − 0.006 | 0.003 | .218** | .076** | − .051** | .034** | .060** | 0.009 | − .035** |
| Number of authors | − .419** | .045** | 1.000 | .720** | .467** | .090** | .226** | .140** | .182** | .325** | .224** | .123** | .200** |
| Number of institutions | − .530** | .032** | .720** | 1.000 | .513** | 0.007 | .233** | .177** | .172** | .298** | .184** | .081** | .163** |
| Number of funded projects | − .545** | − 0.006 | .467** | .513** | 1.000 | − 0.004 | .249** | .198** | .291** | .170** | .070** | − 0.003 | .093** |
| Title length | .103** | 0.003 | .090** | 0.007 | − 0.004 | 1.000 | .078** | .057** | .025* | − 0.005 | .049** | 0.020 | − .062** |
| Paper length | − .367** | .218** | .226** | .233** | .249** | .078** | 1.000 | .588** | .138** | .039** | − .045** | − .084** | .042** |
| Number of references | − .253** | .076** | .140** | .177** | .198** | .057** | .588** | 1.000 | .125** | .096** | 0.000 | − 0.013 | .105** |
| Physical age | − .455** | − .051** | .182** | .172** | .291** | .025* | .138** | .125** | 1.000 | .025* | .055** | − .084** | − .174** |
| APT | − .131** | .034** | .325** | .298** | .170** | − 0.005 | .039** | .096** | .025* | 1.000 | .549** | .530** | .553** |
| TS | 0.013 | .060** | .224** | .184** | .070** | .049** | − .045** | 0.000 | .055** | .549** | 1.000 | .383** | .184** |
| Cited by clinical | .096** | 0.009 | .123** | .081** | − 0.003 | 0.020 | − .084** | − 0.013 | − .084** | .530** | .383** | 1.000 | .381** |
| RCR | − 0.008 | − .035** | .200** | .163** | .093** | − .062** | .042** | .105** | − .174** | .553** | .184** | .381** | 1.000 |
**p < 0.01, *p < 0.05
In addition, APT was positively correlated with the number of disciplines (r = 0.034, p < 0.01), number of authors (r = 0.325, p < 0.01), number of institutions (r = 0.298, p < 0.01), number of funded projects (r = 0.170, p < 0.01), length of papers (r = 0.039, p < 0.01) and number of references (r = 0.096, p < 0.01). APT was negatively correlated with publication age (r = − 0.131, p < 0.01).
TS has a significant positive relationship with the number of disciplines (r = 0.060, p < 0.01), number of authors (r = 0.224, p < 0.01), number of institutions (r = 0.184, p < 0.01), number of funded projects (r = 0.070, p < 0.01), length of title (r = 0.049, p < 0.01) and physical age (r = 0.055, p < 0.01) and significant negative relationship with the length of paper (r = − 0.045, p < 0.01).
Cited by Clin. showed positive and significant correlations with publication age (r = 0.096, p < 0.01), number of authors (r = 0.123, p < 0.01), and number of institutions (r = 0.081, p < 0.01). In contrast, Cited by Clin. was negatively correlated with the length of paper (r = − 0.084, p < 0.01) and physical age (r = − 0.084, p < 0.01).
OLS regression and quantile regression
Before conducting the regression, we performed a multicollinearity diagnosis (Table S1). The results indicated that there was no problem with multicollinearity. We used classical OLS regression to estimate the conditional mean of clinical translation intensity. We also estimated the effect of these factors on the range of variation in the explained variables and the shape of the conditional distribution.
In Table 5, we present the coefficients and associated standard errors for both OLS and quantile regression estimates. These results are pictured in Figs. 4 and 5 where we exhibit both APT and TS at the mean (OLS) and different points of the APT and TS distribution. We estimated APT and TS for the 25th, 50th, 75th, and 95th quantiles. The results have shown the variation in parameter estimates of both APT and TS across the OLS and quantiles. OLS estimates only provide a baseline of the conditional mean of effects. We will compare these with estimates of different quantiles in the APT and TS conditional distributions. We will analyze the different influencing factors one by one below.
Table 5.
OLS and quantile regression models, QR 0.25, 0.50, 0.75 and 0.95
| Variables | APT | TS | ||||||||||
|---|---|---|---|---|---|---|---|---|---|---|---|---|
| OLS | Quantile | OLS | Quantile | |||||||||
| B | β | 0.25 | 0.5 | 0.75 | 0.95 | B | β | 0.25 | 0.5 | 0.75 | 0.95 | |
| Paper-level characteristics | ||||||||||||
| Publication age | − 0.00181*** | − 0.066 | 0 | − 0.000562 | − 0.00163** | − 0.000547 | 0.00145*** | 0.0633 | 0.00148*** | 0.00166*** | 0.00137** | 0.00347*** |
| (0.000433) | (4.69e − 05) | (0.000495) | (0.000814) | (0.000934) | (0.000412) | (0.000330) | (0.000419) | (0.000643) | (0.000904) | |||
| Primary research paper | ||||||||||||
| No (REF) | ||||||||||||
| Yes | − 0.0787*** | − 0.0707 | − 0 | − 0.0750*** | − 0.148*** | − 0.0681** | − 0.125*** | − 0.134 | − 0.0873*** | − 0.161*** | − 0.181*** | − 0.132*** |
| (0.0138) | (0.00150) | (0.0158) | (0.0260) | (0.0298) | (0.0131) | (0.0105) | (0.0134) | (0.0206) | (0.0289) | |||
| Multidisciplinary science | 0.0389*** | 0.0683 | − 0 | 0.0200** | 0.0642*** | 0.0307* | − 0.0223*** | − 0.0469 | 0.00527 | − 0.00775 | − 0.0368*** | − 0.0795*** |
| (0.00723) | (0.000806) | (0.00851) | (0.0140) | (0.0160) | (0.00581) | (0.00566) | (0.00721) | (0.0110) | (0.0155) | |||
| Number of disciplines | 0.0125*** | 0.0351 | 0 | 0.00722 | 0.0143* | 0.00686 | 0.0172*** | 0.0577 | 0.00175 | 0.0142*** | 0.0249*** | 0.0251*** |
| (0.00409) | (0.000473) | (0.00500) | (0.00820) | (0.00942) | (0.00391) | (0.00332) | (0.00423) | (0.00648) | (0.00912) | |||
| Number of authors | 0.0101*** | 0.247 | 0 | 0.0107*** | 0.0173*** | 0.00880*** | 0.00370*** | 0.108 | 0.00551*** | 0.00529*** | 0.00244** | − 0.00197 |
| (0.00139) | (8.34e − 05) | (0.000881) | (0.00145) | (0.00166) | (0.00106) | (0.000586) | (0.000745) | (0.00114) | (0.00161) | |||
| Number of funded projects | 0.00448*** | 0.0641 | 0 | 0.00143 | 0.00179 | 0.00486** | 0.00224** | 0.0384 | 0.00297*** | 0.000989 | 0.000411 | 0.00133 |
| (0.00129) | (0.000110) | (0.00116) | (0.00191) | (0.00219) | (0.000984) | (0.000774) | (0.000984) | (0.00151) | (0.00212) | |||
| Title length | 0.000114 | 0.00199 | 0 | 0.000400 | 0.000475 | − 0.000552 | 0.00194*** | 0.0407 | 0.00125** | 0.00275*** | 0.00201** | − 0.000647 |
| (0.000654) | (7.41e − 05) | (0.000782) | (0.00128) | (0.00147) | (0.000557) | (0.000520) | (0.000662) | (0.00101) | (0.00143) | |||
| Paper length | − 0.00337*** | − 0.067 | − 0 | − 0.00206** | − 0.00459*** | − 0.00454*** | − 0.00334*** | − 0.0798 | − 0.00164*** | − 0.00340*** | − 0.00520*** | − 0.00654*** |
| (0.000734) | (7.86e − 05) | (0.000830) | (0.00136) | (0.00156) | (0.000546) | (0.000552) | (0.000702) | (0.00108) | (0.00151) | |||
| Number of references | 0.000933*** | 0.0761 | − 0 | 0.000598*** | 0.00145*** | 0.000847** | − 0.000184 | − 0.018 | 0.000314** | − 2.42e − 05 | − 0.000487** | − 0.000929*** |
| (0.000164) | (1.81e − 05) | (0.000191) | (0.000314) | (0.000361) | (0.000138) | (0.000127) | (0.000162) | (0.000249) | (0.000350) | |||
| Author-level characteristics | ||||||||||||
| Physical age | − 0.00145*** | − 0.0638 | 0 | − 9.53e − 06 | − 0.00121** | − 0.00131* | 0.00135*** | 0.0709 | 0.000863*** | 0.00174*** | 0.00181*** | 0.00182*** |
| (0.000324) | (3.49e − 05) | (0.000368) | (0.000605) | (0.000694) | (0.000289) | (0.000245) | (0.000312) | (0.000478) | (0.000672) | |||
| Gender | ||||||||||||
| Male (REF) | ||||||||||||
| Female | 0.0619*** | 0.0456 | − 0 | 0.00423 | 0.202*** | 0.159*** | 0.0292** | 0.0258 | 0.0246 | 0.0355* | 0.0557* | − 0.00412 |
| (0.0209) | (0.00224) | (0.0237) | (0.0389) | (0.0446) | (0.0139) | (0.0158) | (0.0201) | (0.0307) | (0.0432) | |||
| Nationality | ||||||||||||
| The U.S. (REF) | ||||||||||||
| Japan | − 0.00799 | − 0.00817 | − 0 | 0.00816 | − 0.00744 | − 0.0447* | 0.0328*** | 0.0401 | 0.0559*** | 0.0594*** | 0.0170 | − 0.0412* |
| (0.0104) | (0.00127) | (0.0134) | (0.0220) | (0.0253) | (0.00823) | (0.00892) | (0.0113) | (0.0174) | (0.0245) | |||
| United Kingdom | − 0.0417*** | − 0.0406 | 0 | − 0.0162 | − 0.0581** | − 0.0360 | 0.0442*** | 0.0516 | − 0.0105 | 0.0304** | 0.0649*** | 0.131*** |
| (0.0118) | (0.00141) | (0.0149) | (0.0244) | (0.0281) | (0.0128) | (0.00991) | (0.0126) | (0.0193) | (0.0272) | |||
| Australia | − 0.0137 | − 0.0113 | − 0 | − 0.00733 | − 0.101** | − 0.0315 | 0.00657 | 0.00651 | − 0.0213 | − 0.00890 | 0.00994 | 0.0538 |
| (0.0228) | (0.00235) | (0.0249) | (0.0408) | (0.0468) | (0.0146) | (0.0165) | (0.0210) | (0.0323) | (0.0454) | |||
| Germany | − 0.120*** | − 0.0998 | − 0 | − 0.0896*** | − 0.157*** | − 0.124*** | − 0.123*** | − 0.123 | − 0.0759*** | − 0.0918*** | − 0.149*** | − 0.184*** |
| (0.0129) | (0.00160) | (0.0169) | (0.0278) | (0.0319) | (0.00940) | (0.0113) | (0.0143) | (0.0220) | (0.0309) | |||
| Canada | − 0.0293** | − 0.0221 | 0 | − 0.0337* | − 0.0558* | − 0.00164 | 0.00651 | 0.00588 | − 0.0250** | − 0.0166 | 0.0128 | 0.0887*** |
| (0.0145) | (0.00169) | (0.0178) | (0.0292) | (0.0336) | (0.0148) | (0.0118) | (0.0151) | (0.0231) | (0.0325) | |||
| Switzerland | 0.119*** | 0.0675 | 0.200*** | 0.147*** | 0.173*** | 0.159*** | 0.155*** | 0.106 | 0.103*** | 0.115*** | 0.190*** | 0.278*** |
| (0.0231) | (0.00224) | (0.0237) | (0.0388) | (0.0446) | (0.0220) | (0.0157) | (0.0200) | (0.0307) | (0.0432) | |||
| Israel | − 0.160*** | − 0.0714 | − 0 | − 0.0746** | − 0.208*** | − 0.451*** | − 0.0407** | − 0.0218 | 0.00206 | − 0.0234 | − 0.0924** | − 0.128** |
| (0.0142) | (0.00282) | (0.0298) | (0.0489) | (0.0562) | (0.0162) | (0.0198) | (0.0252) | (0.0387) | (0.0544) | |||
| France | 0.0286 | 0.0132 | 0.200*** | − 0.00219 | − 0.0417 | 0.0406 | 0.0451** | 0.0251 | 0.0881*** | 0.0718*** | 0.0327 | 0.00904 |
| (0.0262) | (0.00288) | (0.0304) | (0.0499) | (0.0573) | (0.0216) | (0.0202) | (0.0257) | (0.0394) | (0.0555) | |||
| Sweden | 0.112*** | 0.04 | − 0 | 0.112*** | 0.227*** | 0.0880 | 0.283*** | 0.121 | 0.195*** | 0.263*** | 0.461*** | 0.337*** |
| (0.0386) | (0.00354) | (0.0373) | (0.0613) | (0.0704) | (0.0398) | (0.0248) | (0.0316) | (0.0485) | (0.0682) | |||
| South Africa | − 0.116*** | − 0.0308 | 0 | − 0.0295 | − 0.168** | − 0.460*** | − 0.118*** | − 0.0377 | − 0.0488 | − 0.0707* | − 0.154** | − 0.237*** |
| (0.0193) | (0.00468) | (0.0494) | (0.0812) | (0.0932) | (0.0224) | (0.0329) | (0.0418) | (0.0642) | (0.0902) | |||
| Argentina | − 0.118*** | − 0.0313 | − 0 | − 0.107** | − 0.185** | − 0.266*** | − 0.184*** | − 0.0587 | − 0.0936*** | − 0.163*** | − 0.258*** | − 0.283*** |
| (0.0277) | (0.00476) | (0.0502) | (0.0825) | (0.0947) | (0.0228) | (0.0334) | (0.0425) | (0.0652) | (0.0917) | |||
| Romania | 0.0243 | 0.00543 | 0 | 0.000780 | 0.00521 | 0.0663 | 0.0784 | 0.021 | 0.0183 | 0.0828* | 0.154** | 0.0942 |
| (0.0504) | (0.00558) | (0.0589) | (0.0967) | (0.111) | (0.0486) | (0.0392) | (0.0499) | (0.0765) | (0.108) | |||
| Nobel prize | ||||||||||||
| No (REF) | ||||||||||||
| Yes | 0.0370*** | 0.0722 | 0 | 0.0273*** | 0.0695*** | 0.0396*** | 0.00495 | 0.0116 | 0.00722 | 0.0102 | 0.00607 | − 0.0116 |
| (0.00603) | (0.000695) | (0.00733) | (0.0120) | (0.0138) | (0.00527) | (0.00488) | (0.00621) | (0.00952) | (0.0134) | |||
| Institution-level characteristics | ||||||||||||
| Number of institutions | 0.00187 | 0.0348 | − 0 | 0.00991*** | 0.0121*** | 0.00522** | 0.00287 | 0.064 | − 0.000368 | 0.00788*** | 0.0150*** | 0.0153*** |
| (0.00263) | (0.000103) | (0.00109) | (0.00179) | (0.00205) | (0.00220) | (0.000724) | (0.000921) | (0.00141) | (0.00199) | |||
| Institutional type | ||||||||||||
| University (REF) | ||||||||||||
| Research Institute | 0.0670*** | 0.0947 | 0 | 0.0986*** | 0.145*** | 0.0265 | 0.113*** | 0.191 | 0.0944*** | 0.121*** | 0.134*** | 0.0921*** |
| (0.00978) | (0.000988) | (0.0104) | (0.0171) | (0.0197) | (0.00791) | (0.00694) | (0.00883) | (0.0135) | (0.0190) | |||
| Hospital | 0.0280 | 0.0216 | 0 | 0.0536** | 0.119*** | − 0.0194 | − 0.0216* | − 0.02 | 0.0401*** | − 0.00279 | − 0.0650** | − 0.104** |
| (0.0219) | (0.00214) | (0.0226) | (0.0371) | (0.0426) | (0.0126) | (0.0150) | (0.0191) | (0.0294) | (0.0413) | |||
| Business or company | 0.0310 | 0.00947 | 0 | 0.0655 | 0.0599 | 0.0332 | 0.149*** | 0.0547 | 0.0737*** | 0.174*** | 0.174*** | 0.186** |
| (0.0364) | (0.00406) | (0.0429) | (0.0705) | (0.0809) | (0.0387) | (0.0286) | (0.0363) | (0.0557) | (0.0783) | |||
| Foundation | − 0.134*** | − 0.0542 | 0 | − 0.0369 | − 0.146** | − 0.575*** | − 0.171*** | − 0.0827 | − 0.0274 | − 0.140*** | − 0.262*** | − 0.327*** |
| (0.0133) | (0.00329) | (0.0347) | (0.0570) | (0.0654) | (0.0207) | (0.0231) | (0.0294) | (0.0450) | (0.0633) | |||
| Constant | 0.282*** | 0.0500*** | 0.0685* | 0.313*** | 0.780*** | 0.177*** | 0.00388 | 0.0966*** | 0.307*** | 0.594*** | ||
| (0.0299) | (0.00336) | (0.0355) | (0.0582) | (0.0668) | (0.0275) | (0.0236) | (0.0300) | (0.0460) | (0.0647) | |||
| Pseudo R2 | 0.162 | 0.0036 | 0.121 | 0.153 | 0.062 | 0.151 | 0.077 | 0.103 | 0.12 | 0.144 | ||
| Observations | 7274 | 7274 | 7274 | 7274 | 7274 | 7274 | 7274 | 7274 | 7274 | 7274 | ||
B unstandardized beta, β Standardized beta
Robust standard errors in parentheses
***p < 0.01, **p < 0.05, *p < 0.1; “REF” refers to “the reference category” being used in the analysis
Fig. 4.

Ordinary least squares and quantile regression trend estimates over the conditional quantiles of APT. The horizontal axis indicates the conditional quantile of APT and the vertical axis presents the estimated coefficients of the effect of variables. The horizontal dashed line indicates the OLS regression estimates. The area between the two dotted lines depicts the 95% confidence intervals for the OLS estimates. The green solid line is the quantile regression estimate for each explanatory variable, and the shaded grey area plots the 95% confidence band for the quantile regression estimates. The solid red line is the y = 0 reference line
Fig. 5.

Ordinary least squares and quantile regression trend estimates over the conditional quantiles of TS. The horizontal axis indicates the conditional quantile of TS, and the vertical axis presents the estimated coefficients of the effect of variables. The horizontal dashed line indicates the OLS regression estimates. The area between the two dotted lines depicts the 95% confidence intervals for the OLS estimates. The green solid line is the quantile regression estimate for each explanatory variable, and the shaded grey area plots the 95% confidence band for the quantile regression estimates. The solid red line is the y = 0 reference line
First, we analyze the results of OLS regression. In Table 5, we bold the estimated conditional mean values for the paper-level, author-level, and institution-level characteristics that have a significant impact on APT and TS. We can see that age of publication, primary research paper, length of paper, physical age, and foundation versus university have significant negative effects on APT. Multidisciplinary science, the number of disciplines, the number of authors, the number of funded projects, the number of references, females, Nobel prizes, and research institutions versus universities have significantly positive influences on APT. For TS, age of publication, number of disciplines, number of authors, number of funded projects, length of the title, physical age, female, research institution versus university, and business or company versus university have a significant positive effect. Primary research paper, multidisciplinary science, length of paper, hospital versus university, and foundation versus university have significant negative effects. Also, there are significant differences in APT or TS in some countries compared to the US (those beta in bold).
Next, we compared the quantile regression results with the OLS results. OLS regression results show that the estimate of the conditional mean of APT is negatively and significantly associated with publication age (β = − 0.066), but the estimate of the conditional mean of TS has a statistically positive relationship with publication age (β = 0.0633). The estimates of quantile regression show that the effect of publication age on TS is significant in all quantiles. However, the effect of publication age on APT is only significant in the 75th quantile. There is a clear positive effect of publication age on TS, which is increasing with the quantile. We observed that the effects of publication age on TS are approximately three times greater in the 95th quantile (0.00347) than in the 25th quantile (0.00148).
Under the OLS model, the APT and TS coefficient for primary research papers was negatively and statistically significant in almost all quartiles (except the 25th quartile of APT), indicating that primary research papers had a lower APT and TS coefficient than secondary research papers. The negative impact of being a primary research paper on both APT and TS was greatest in the 75th quartile, followed by the 50th quartile, and the 95th quartile. The effect of primary research on TS was nearly twice as large at the 75th quartile (− 0.181) as it was at the 25th quartile (− 0.0873). The negative effect of primary research papers on APT had an overall U-shaped distribution trend, decreasing from nearly the 25th quartile to the 80th quartile and then increasing around the 90th quartile. For TS, the U-shaped distribution curve decreased from the 10th quartile to the 70th quartile and then rose. This means that initially the negative effect of primary research papers on APT gradually increases as APT increases. This is when the APT of the paper is low or medium. As the APT of the papers reached higher levels, the negative impact of primary research papers on APT gradually diminished.
The OLS regression model showed that multidisciplinary was positively associated with estimates of the conditional mean of ATP and negatively associated with estimates of the conditional mean of TS. Quantile regression showed that this association differed significantly across quartiles of APT and TS. In particular, the effect of multidisciplinary on APT was stronger at the 75th quantile (0.0642) than at the 50th quantile (0.0200) and 95th quantile (0.0307). The negative effect of multidisciplinary categories on TS increased progressively as TS increased. OLS regression results showed that the number of disciplines had a significantly positive effect on APT, but only in the 75th quartile. In contrast, the number of disciplines showed a statistically positive impact on the estimates of the conditional mean of TS. This impact was in the 50th, 75th, and 95th quartiles of TS. The effect of the number of disciplines on TS was stronger at the 95th quartile (0.0251) than at the 75th quartile (0.0249) and the 50th quartile (0.0142).
Under the OLS model, the number of authors was positively correlated with APT at most quartiles, except the 25th quartile. Similarly, the number of authors had a positive effect on TS at the 25th, 50th, and 75th quartiles under the OLS model. While estimates of the conditional means of APT and TS were not significantly related to the number of institutions in the OLS model, the number of institutions was significantly and positively related to APT and TS at quartile 50, quartile 75, and quartile 95.
The number of references had a significant positive effect on APT in the OLS model and in most quartiles except the 25th quartile. However, the estimates of the effect of the number of references on TS in OLS were not significant. The quantile regression results showed that the effect of the number of references on TS was significantly positive at the 25th quantile. In contrast, the effect of the number of references on TS was significantly negative at the 75th and 95th quantiles.
As shown in Fig. 4, the effect of the number of authors, the number of institutions, and the number of references on APT was inversely U-shaped as APT increased, with OLS estimates lower than most quantile estimates. The number of grant projects had a significant positive effect on APT in the OLS model and at the 95th quantile. There is a statistically significant positive relationship between the number of funded projects and TS under the OLS model, only at quartile 25 in Fig. 5. The estimate of the conditional mean of APT under the OLS model is almost twice as large as the estimate of TS. As shown in the subplot on the impact of the number of funded projects on APT in Fig. 4, the horizontal dashed line representing the OLS regression estimates is higher than the majority of the solid green lines representing the APT quartiles. Thus, by using only OLS regressions, we may be overestimating the impact of the number of funded projects on APT.
The effect of the length of the title on APT was not significant in both OLS regression and quantile regression analysis. However, there was a significant positive effect of the length of the title on TS under both the OLS model and at quartiles 25, 50, and 75. For the length of the paper, the effect on APT and TS was estimated to be significantly negative in both the OLS model and at most quartiles. The effect of the length of the paper on APT tended to have a U-shaped distribution, while the negative effect of the length of the paper on TS increased with increasing TS.
Under the OLS model, physical age was negatively correlated with ATP at quartiles 75 and 95. In contrast, physical age had a positive effect on TS under both the OLS model and at all quartiles. For both APT and TS, the higher the quantile, the larger the absolute value of the estimated coefficient, i.e., the more effect of physical age on APT and TS.
According to the OLS model and the 75th and 95th quantiles, the APT for papers published by female laureates was higher than that of male laureates. The TS advantage of female winners was also demonstrated by OLS regression and 50-quantile and 75-quantile regression coefficients. We chose the United States as our reference. We found that the APT of papers published by the Lasker prize winners from Switzerland and Sweden was significantly higher than that of the United States. While the APT of Lasker prize winners from the United Kingdom, Germany, Canada, Israel, South Africa, and Argentina was significantly lower than that of the United States. We also observed that the TS of papers published by the Lasker prize winners from Switzerland, Sweden, Japan, the United Kingdom, and France are significantly higher than that of the United States, while the TS of papers published by the Lasker prize winners from Germany, Israel, South Africa, and Argentina are all lower than that of the United States. Depending on the quantile, nationality has a different influence on APT and TS.
There was a significant correlation between the institutional type and the clinical translation intensity of the Lasker Prize winners’ papers. The APT and TS of papers published by award winners from research institutes were significantly higher than those published by award winners from universities. The significance was based on the OLS model and the 50th and 75th quantiles of APT and all quantiles of TS.
Compared with universities, the advantage of the influence of research institutions on APT and TS is greater in the 75th percentile than in other quantiles. However, the APT and TS of papers published by winners from the foundations were significantly lower than those from universities under the OLS model. This was in the 75th and 95th quantiles of APT and in all of the quantiles of TS. The disadvantage of foundations versus universities in terms of impact on APT and TS is greater in higher quartiles than in lower quartiles.
A Nobel Prize has a significant impact on the APT of the winners’ published papers, but not on the TS. The estimates of the conditional mean of APT were significant by both OLS regression and quantile regression analysis. The effect of the Nobel Prize on APT is the largest in the 75th quantile.
Zero-inflated negative binomial regression
We found that Cited by Clin. exhibited over-dispersion and excess zeros. A zero-inflated negative binomial (ZINB) regression was used to assess the relationship of Cited by Clin. with characteristics of papers, authors, and institutions. ZINB regression model has better explanatory power in handling issues with many zero values. In ZINB, two models have been generated: the logit model (zero event occurrence) and the count model (number of events). A logit model was used to examine factors affecting zero events and a count model to reveal factors affecting the frequency of events. Table 6 shows the results of the ZINB regression model.
Table 6.
Zero-inflated negative binomial regression of the cited by Clin. (N = 7274)
| Count model | Logit model | |||||||||
|---|---|---|---|---|---|---|---|---|---|---|
| β | SE | z | p >|z| | 95% CI | β | SE | z | p >|z| | 95% CI | |
| Paper-level characteristics | ||||||||||
| Publication age | 0.059 | 0.012 | 4.61 | 0.000 | 0.033, 0.084 | 0.006 | 0.025 | 0.24 | 0.808 | − 0.043, 0.055 |
| Primary research paper | ||||||||||
| No (REF) | ||||||||||
| Yes | − 0.597 | 0.297 | − 2.01 | 0.045 | − 1.180, − 0.014 | 1.647 | 0.642 | 2.57 | 0.010 | 0.388, 2.905 |
| Multidisciplinary science | 0.278 | 0.149 | 1.87 | 0.062 | − 0.013, 0.571 | 0.026 | 0.299 | 0.09 | 0.929 | − 0.561, 0.614 |
| Number of disciplines | 0.009 | 0.078 | 0.13 | 0.899 | − 0.143, 0.162 | 0.088 | 0.163 | 0.54 | 0.590 | − 0.233, 0.409 |
| Number of authors | 0.021 | 0.010 | 1.99 | 0.047 | 0.000, 0.042 | − 0.221 | 0.051 | − 4.30 | 0.000 | − 0.322, − 0.120 |
| Number of funded projects | 0.003 | 0.013 | 0.24 | 0.814 | − 0.022, 0.028 | 0.010 | 0.046 | 0.21 | 0.831 | − 0.081, 0.101 |
| Title length | 0.004 | 0.010 | 0.39 | 0.699 | − 0.017, 0.025 | − 0.000 | 0.024 | − 0.04 | 0.968 | − 0.048, 0.046 |
| Paper length | − 0.038 | 0.011 | − 3.22 | 0.001 | − 0.061, − 0.015 | 0.031 | 0.043 | 0.72 | 0.469 | − 0.053, 0.115 |
| Number of references | 0.003 | 0.003 | 1.05 | 0.295 | − 0.002, 0.009 | − 0.003 | 0.007 | − 0.51 | 0.613 | − 0.017, 0.010 |
| Author-level characteristics | ||||||||||
| Physical age | − 0.007 | 0.006 | − 1.15 | 0.251 | − 0.019, 0.005 | − 0.004 | 0.010 | − 0.44 | 0.663 | − 0.025, 0.016 |
| Gender | ||||||||||
| Male (REF) | ||||||||||
| Female | 0.632 | 0.296 | 2.14 | 0.032 | 0.052, 1.213 | − 0.856 | 0.584 | − 1.47 | 0.143 | − 2.002, 0.289 |
| Nationality | ||||||||||
| The U.S. (REF) | ||||||||||
| Japan | − 0.299 | 0.299 | − 1.00 | 0.317 | − 0.886, 0.287 | 0.112 | 0.413 | 0.27 | 0.785 | − 0.697, 0.923 |
| United Kingdom | − 0.022 | 0.250 | − 0.09 | 0.930 | − 0.512, 0.468 | 0.374 | 0.399 | 0.94 | 0.349 | − 0.408, 1.157 |
| Australia | 0.369 | 0.294 | 1.25 | 0.210 | − 0.207, 0.946 | 0.123 | 0.568 | 0.22 | 0.827 | − 0.990, 1.238 |
| Germany | − 1.895 | 0.289 | − 6.54 | 0.000 | − 2.463, − 1.327 | − 15.020 | 0.975 | − 15.40 | 0.000 | − 16.933, − 13.108 |
| Canada | 0.082 | 0.233 | 0.35 | 0.724 | − 0.374, 0.539 | − 0.770 | 0.772 | − 1.00 | 0.319 | − 2.284, 0.744 |
| Switzerland | − 0.327 | 0.197 | − 1.66 | 0.097 | − 0.714, 0.059 | − 18.929 | 4.248 | − 4.46 | 0.000 | − 27.255, − 10.602 |
| Israel | − 2.426 | 0.560 | − 4.33 | 0.000 | − 3.524, − 1.328 | − 15.725 | 6.615 | − 2.38 | 0.017 | − 28.692, − 2.759 |
| France | − 0.393 | 0.286 | − 1.37 | 0.170 | − 0.955, 0.169 | − 11.593 | 1.787 | − 6.48 | 0.000 | − 15.097, − 8.089 |
| Sweden | 0.237 | 0.380 | 0.62 | 0.534 | − 0.509, 0.983 | − 1.449 | 1.164 | − 1.24 | 0.213 | − 3.731, 0.833 |
| South Africa | − 1006.618 | – | – | – | – | 13.798 | – | – | – | – |
| Argentina | − 2.075 | 0.412 | − 5.03 | 0.000 | − 2.884, − 1.266 | − 11.772 | 5.482 | − 2.15 | 0.032 | − 22.517, − 1.027 |
| Romania | 0.669 | 0.481 | 1.39 | 0.164 | − 0.273, 1.612 | 0.696 | 1.125 | 0.62 | 0.536 | − 1.509, 2.903 |
| Nobel prize | ||||||||||
| No (REF) | ||||||||||
| Yes | 0.365 | 0.145 | 2.51 | 0.012 | 0.079, 0.651 | 0.160 | 0.241 | 0.67 | 0.505 | − 0.311, 0.633 |
| Institution-level characteristics | ||||||||||
| Number of institutions | 0.029 | 0.012 | 2.25 | 0.024 | 0.003, 0.054 | − 0.271 | 0.090 | − 3.02 | 0.003 | − 0.448, − 0.095 |
| Institutional type | ||||||||||
| University (REF) | ||||||||||
| Research Institute | 0.207 | 0.131 | 1.58 | 0.115 | − 0.050, 0.466 | − 3.021 | 1.167 | − 2.59 | 0.010 | − 5.310, − 0.732 |
| Hospital | − 0.110 | 0.241 | − 0.46 | 0.646 | − 0.583, 0.361 | − 1.125 | 0.579 | − 1.94 | 0.052 | − 2.260, 0.009 |
| Business or company | − 0.138 | 0.474 | − 0.29 | 0.770 | − 1.068, 0.790 | 0.251 | 1.234 | 0.20 | 0.839 | − 2.168, 2.671 |
| Foundation | − 3.641 | 1.060 | − 3.43 | 0.001 | − 5.719, − 1.563 | − 1.306 | 1.983 | − 0.66 | 0.510 | − 5.195, 2.581 |
| Constant | − 0.525 | 0.807 | − 0.65 | 0.515 | − 2.107, 1.056 | 0.001 | 1.639 | 0.00 | 0.999 | − 3.210, 3.214 |
Bold values were significant
In the count model, older publication age (β = 0.059, p < 0.001), more authors (β = 0.021, p < 0.05), and more institutions (β = 0.029, p < 0.05) were associated with higher citations by clinical papers. Furthermore, primary research papers (β = − 0.597, p 0.001) and longer papers (β = − 0.038, p 0.05) showed a relationship with lower citations by clinical papers. The authors who were female (β = 0.632, p < 0.05) and the winners who have won the Nobel Prize exhibited a higher Cited by Clin. While, the winners whose nationality were German (β = − 1.895, p < 0.001), Israel (β = − 2.426, p < 0.001), and Argentina (β = − 2.075, p < 0.001) showed a lower Cited by Clin. compared to those who were U.S. In addition, winners whose affiliation was the foundation (β = − 3.641, p < 0.05) displayed lower citations by clinical papers compared to those affiliated with universities. Meanwhile, the results of the logit model showed that primary research (β = 1.647, p < 0.05) exhibited a decreased likelihood of being cited by clinical articles. On the contrary, papers that have more authors (β = − 0.221, p < 0.05) and more institutions (β = − 0.271, p < 0.05) had an increased likelihood of being referenced by clinical articles. The papers whose authors were Germany (β = − 15.020, p < 0.001), Switzerland (β = − 18.929, p < 0.001), Israel (β = − 15.725, p < 0.05), France (β = − 11.593, p < 0.001) and Argentina (β = − 11.772, p < 0.05) exhibited an increased likelihood of being cited by clinical articles when compared with those papers whose authors were the U.S. Moreover, the winners whose affiliation was research institute (β = − 3.021, p < 0.05) showed an increased likelihood of being cited by clinical articles when compared with the winners whose affiliation was university.
Discussion
In our study, we demonstrated that the correlation between translational-focused measures and traditional citation-based measures, such as the effects of factors of papers, authors, and institutions on clinical translation intensity can be generalized to even the highest level of basic biomedical research. This will be a significant contribution to both the scientometrics literature and the translational science literature.
Quantitative evaluation methods for the clinical translation of basic medical research papers have been developed for many years, such as the basic-clinical “Research Level” developed by Narin and its other versions improved by scholars, the “biomedical triangle” classification method based on MeSH terms, and the citation analysis between different types of publications. However, studies on APT, TS and Cited by Clin. indicators are indeed relatively lacking. We selected basic medical research papers published by outstanding scientists in the field of basic medicine (who have won the Lasker Prize for Basic Medicine) as our research samples because we assumed that this collection of papers had high academic value. This can be confirmed laterally by the RCR indicators of this group of papers: Mean ± SD:3.50 ± 8.29, Median (IQR): 1.60 (0.69–3.59). The Mean RCR of 3.50 reminds us that the average number of citations per year for this group of papers is 3.5 times the average for NIH-funded papers in this research area. In the following, we will discuss the unique contribution of this study compared with the previous literature.
Comparison of APT, TS, and cited by Clin.
Both APT and TS values are between 0 and 1. However, the value of the Cited by Clin. value is non-negative. We found that the mean of APT and TS was equal, but the median of TS was nearly 4 times that of APT. Their different connotations can be interpreted this way. APT is the estimated value of the potential of a paper to be referenced in clinical studies, clinical trials, and clinical guidelines after publication. However, TS is the ratio of a paper cited by clinical research journals to all journal citations after publication. Cited by Clin. value is an over-scattered variable with too many zeros. It measures the number of times a paper is mentioned as a reference in clinical research papers.
In spite of the fact that the TS of papers is more difficult to calculate than APT, which can easily be retrieved from the iCite platform, both TS and APT have their own characteristics and complement each other. APT is a prediction of the future use of the paper in clinical research, while TS is a retrospective measure of the clinical importance of a cited paper. APT is calculated based on the characteristics of the MeSH terms in the forward citation and backward citation and the number of citations per year. In short, APT is an indicator that focuses on MeSH terms. As a core method of predicting clinical translation intensity, it extracts characteristics of six categories of MeSH terms from papers, including Molecular/Cell, Animal, Human, Disease, Therapeutic/Diagnostic Approaches, and Chemical/Drug. In contrast, TS is an indicator based on citations, specifically measuring the disciplinary attribute of the journal. Generally speaking, MeSH terms are more fine-grained than subject attributes, so APT has a more detailed measurement perspective for clinical use than TS. However, TS has some attractive features. For example, TS is simpler and easier to understand, especially for non-bibliometrics, and it is easier to calculate and apply to other disciplines. Ke pointed out that only the proportion of different categories of MeSH words in the paper could not completely distinguish the degree to which a research paper is biased toward basic research or clinical application especially when it comes to research that focuses on humans (Ke, 2019). For example, a paper with the word “Human” MeSH might be a study about nursing research on patient care or a clinical study testing the safety and efficacy of a new drug in people. In terms of translation, the former is more basic than the latter. Nelson holds the view that the prediction model derived from the title, abstract, and metadata is a higher-dimensional, translational impact predictor, superior to the citation-based model (Nelson et al., 2022). Therefore, we emphasize that the evaluation of clinical translation intensity should take stability, operability, ease of understanding, scalability, and other factors into consideration.
Cited by Clin. is an indicator that was proposed much earlier than APT and TS. Logically, this indicator is the easiest to understand and use. However, this indicator has not been used in the evaluation of scientific research. First, this variable is a rare occurrence. It is estimated that 80% of the papers published by the world’s top basic medical scientists have not yet been referenced in clinical research. Some scholars (Thelwall & Kousha, 2016) have investigated the number of articles in the four high-level journals (the BMJ, JAMA, Lancet, NEJM) in the field of biomedicine that were referenced by ClinicalTrials. gov and found that 83.20–96.33% of the papers were not cited by clinical trials. All of these journals had a higher proportion of zero Cited by Clin. than the results in our sample. It can be roughly explained that the non-zero Cited by Clin. ratio of basic medical papers published by the world’s top basic medical scientists is higher than the average level of papers in the top biomedical journals. Second, the definition of clinical research papers is not unified. And the distinction between basic research and clinical research is not easy. For example, translational research acts as a bridge between basic research and clinical research and it has a lot in common with the other two. Therefore, the identification of clinical studies is difficult to precise. This is also a limitation of this study. We used the Cited by Clin. values automatically calculated by the iCite platform’s definition criteria for clinical research. As for TS, it is calculated based on Kim’s rough classification of biomedical journals into two groups: basic medicine and clinical medicine according to the WOS disciplines. The National Institutes of Health’s NCATS has divided the translation spectrum of scientific research into different stages (basic research, preclinical research, clinical research, clinical implementation, and public health) according to the time stream (NCATS, 2022), but there is no clear boundary to accurately distinguish which papers are in these stages.
Moreover, obtaining clinical citations is difficult. There is a global lack of a comprehensive database of clinical research citations. There are only a few clinical trial registry data platforms and clinical guideline databases such as NICE, SIGN, Clinical Evidence, and ClinicalTrial.org. A number of clinical trials and guideline databases are not available to foreigners. iCite is a platform that lets us access the number of citations for a paper that is referenced by clinical research based on an integrated retrieval system. In previous studies, either the number of times the paper was cited by clinical trials or clinical guidelines was selected as a research variable. This was done to evaluate the extent to which the paper is used in clinical research. The Cited by Clin. indicator used in this study can evaluate the degree to which the paper has been used by clinical trials and clinical guidelines. The Cited by Clin. has more comprehensive coverage for the types of clinical studies. The term TS refers to the ratio between the number of times that basic research papers are used by clinical research papers and the number of times that basic medical research papers are used by both basic and clinical research papers. Therefore, TS can only measure the clinical translation intensity of basic research. However, APT and Cited by Clin. can measure the clinical translation intensity of basic and clinical research papers.
Correlation among APT, TS, cited by Clin. and RCR
In our sample, we found that APT was moderately correlated with TS (r = 0.549), Cited by Clin. (r = 0.530) and RCR (r = 0.553). The correlation between TS and Cited by Clin. (r = 0.383), Cited by Clin. and RCR (r = 0.381) was weak, and the correlation between TS and RCR (r = 0.184) was extremely weak.
Our results provide some support for previous studies to a certain extent, but there are also some differences. Llewellyn and Weber et al. examined the relationship among citation and translational feature indicators for publications that acknowledged support from the Georgia CTSA grant (2007–2021) (Llewellyn et al., 2021). The Georgia CTSA project is a grant that specifically supports translational clinical research. The scientific outputs funded by the Georgia CTSA project, including basic research and clinical research, have an average RCR of 2.49 and an APT of 0.51, while our sample only includes basic research, with an average RCR of 3.38 and an APT of 0.24. The academic impact of our sample papers is significantly higher than that of CTSA, but the clinical translation intensity is significantly lower than that of CTSA. As a result, the correlation between APT and RCR in our study (r = 0.553) was significantly lower than that in CTSA (r = 0.78).
Kim examined the correlation between TS (calculated based on 4-year citations) and APT in 217 non-clinical papers published in 2003 and found a correlation of 0.37(p < 0.001) (Kim et al., 2020), smaller than our results (r = 0.549, p < 0.01). Both our samples and Kim’s are non-clinical studies, but Kim’s sample papers come from a CTSA club, which is biased to support translational research. Our results are also consistent with Kim’s. The difference in the correlation between APT and TS between the two studies may be caused by the difference in the sample and the difference in the selection of the citation time window of TS. Anyhow, we can confirm that APT, TS, and Cited by Clin. are significantly and positively correlated, and they may capture different characteristics of knowledge translation into clinical practice.
Relationship between the characteristics of the papers, the authors, and the institutions with the clinical translation intensity
The results of our OLS regression indicate that non-primary research, more authors, and shorter papers are associated with higher scores of APT, TS, and Cited by Clin. However, publication age has a significant positive effect on TS and Cited by Clin., but a significant negative effect on APT. The reason for this difference might be due to the difference in calculation principle. Both TS and Cited by Clin. are retrospective measures of the clinical importance of a referenced paper and are calculated based on the citations. However, APT scores are used as an early indicator of clinical citation based on MeSH terms of cited papers and citing papers, as well as the annual citation rate. From the quantile regression results shown in Fig. 4, it can be seen that when APT is below the 80th quantile, the APT value decreases with the increasing age of publication. However, only when APT is high enough to exceed the 80th quantile, the APT value increases with age. Hutchins et al. have suggested that the increase in APT over time was due to the change in the baseline odds of the paper being cited by clinical papers. This could be interpreted that the change in APT is caused by the addition of milestone event information of the paper entering the citation network over time. We consider that when the APT of the paper is below the 80th quantile, the negative correlation between the age of the paper and APT may be because the information of new milestone events entering the citation network becomes less and less over time, which triggers the decline of APT.
In this sample, APT, TS, and Cited by Clin. of papers published by the female winners are significantly higher than those published by the male winners. There have been many reports on gender bias in citations (Borrego et al., 2010; Long, 1992; Symonds et al., 2006). For example, publications written by females are cited more than those written by males but are less likely to be cited (Shukla et al., 2021). Some studies have shown that if a woman publishes a paper as the first author, the female researcher is more likely to be a female senior researcher (Puri et al., 2021). In a study of Norwegian scholars, Zhang et al. found that the usage impact (abstract views) of publications by female 1st authors was significantly higher than those by male 1st authors, which was explained by the fact that female scholars more frequently chose research aimed at societal progress, while male scholars paid more attention to research aimed at scientific progress (Zhang et al., 2021). Besides gender bias in the citation and usage impact, we add a gender bias in the clinical impact. It may also be related to women’s preference for topics with high social impact. This finding may have some policy implications for the selection of outstanding talents in basic medicine.
The results suggest that primary research papers have lower APT, TS, and Cited by Clin. than secondary research papers. According to iCite, a paper can be considered a primary research paper if its publication type includes at least one of 24 types, such as a Journal Article and Clinical Trial. The key difference between primary research and secondary research is that in primary research, researchers are directly involved in the data collection process, rather than relying on existing data (Driscoll, 2011). In terms of the timeline of the basic-to-clinical translation continuum, primary research precedes secondary research, so the clinical translation intensity of primary research is lower than secondary research.
Furthermore, multidisciplinary science, funded projects, and institutional types are associated with APT and TS, but not with Cited by Clin. We don’t yet have sufficient evidence to explain this phenomenon. The issue deserves further study in the future. The influencing factors that have not been explored in this study, such as author honor, institution ranking, and the overall level of basic medical research in the countries also need to be explored further in the future.
Moreover, on the basis of analyzing the characteristics of the data, this study adopted a more robust and reasonable regression model. In the past, linear regression models were often used to test the influencing factors of citations. Due to the lack of understanding of the advantages of quantile regression, scholars in scientometrics rarely applied it. Quantile regression can overcome the sharp peak and thick tail characteristics of data and structural changes in data. It is more robust than linear regression, so it has unique advantages. A quantile regression analysis can show that each influencing factor has a different impact on the dependent variable at different levels. For example, Nobel Prize winners, the number of authors, the number of institutions, whether the author’s institution is a research institute versus a university, and whether it is a primary research paper have significantly different effects on APT at different levels. These distributions are more suitable for quantile regression. Furthermore, in view of the over-dispersed Cited by Clin. value with 80.0% zero values, we chose the zero-inflated negative binomial regression model to assess Cited by Clin.’s influencing factors, and we found the fitting effect was significantly better than that of the negative binomial regression model. The ZINB model can not only predict the factors that influence Cited by Clin., but also analyze which factors affect Cited by Clin. value to be zero. This finding is also a novel aspect of this study.
Implications of the study for policy and practice
Our findings have profound implications for scholars in the field of scientometrics, translational scientists, talent managers, and fund committees. It is essential to keep in mind that the three evaluation indicators of clinical translation intensity have some similarities and some differences. They should be used carefully based on future evaluation needs. For policymakers or managers of scientific evaluation, APT is more suitable for evaluating newly published papers with insufficient citations. When evaluating old articles, TS and Cited by Clin. are considered more appropriate. When it is necessary to compare a paper’s contribution to basic medicine with its contribution to clinical medicine in activities such as funded project allocation or performance allocation, the TS is preferred. We measured the clinical translation intensity of papers published by the world’s top basic medical scientists to provide baseline data for future comparisons with the general population. Furthermore, for papers with high academic impact in the field of basic medicine, the high clinical impact of the paper is mainly reflected in the high frequency of being cited by clinical papers or the high likelihood of being cited by clinical papers in the future, but it does not mean a high share of citations by clinical papers (the contribution ratio of knowledge in the paper to clinical research and basic research). Therefore, the reference standards for the clinical impact of basic medical research should be carefully formulated in terms of supporting policies for future successful basic medical scientists. Moreover, when evaluating the clinical impact of outstanding basic medical scientists, it is necessary to fully consider factors such as the age of the paper, the interdisciplinary characteristics of the paper, the type of the author’s institution, and the stage of the author’s career, and establish stratified selection criteria. Finally, from the perspective of academic impact and clinical impact, a comprehensive and bi-dimensional evaluation of the papers published by outstanding basic medical scientists should be carried out.
Conclusion
The three indicators, APT, TS and Cited by Clin., measured the clinical translation intensity of the paper from different perspectives. They are both related to each other and have their own characteristics. In a sample of basic medical research papers published by the world’s top scientists in basic medical, characteristics at the paper, author, and institution level significantly correlated with the measures of clinical translation intensity. Gender effect on the clinical translation intensity of papers was confirmed. Traditional citation-based indicators and translational-focused indicators measure academic impact and clinical impact respectively. There is a certain degree of disconnect between them. A combination of two types of indicators should be used in future assessments of basic medical research.
Supplementary Information
Below is the link to the electronic supplementary material.
Acknowledgements
This work was supported by the Scientific Research Funds of Education Department of Liaoning Province in 2020 [QNRW2020004].
Author contributions
Conceptualization: CLL; Data collection: DYZ; Formal analysis: DYZ and CLL; Writing-original draft preparation: DYZ and CLL; Writing-draft revising: CLL and DYZ; Writing-review and editing: CLL; Funding acquisition: CLL; Supervision: CLL.
Data availability
All data is available upon request.
Declarations
Conflict of interest
The authors have no conflict of interest to declare that are relevant to the content of this article.
Footnotes
The original online version of this article was revised: In the original publication of the article, Fig. 3 was incorrectly published.
Change history
4/1/2023
A Correction to this paper has been published: 10.1007/s11192-023-04688-4
References
- Amara N, Landry R, Halilem N. What can university administrators do to increase the publication and citation scores of their faculty members. Scientometrics. 2015;103(2):489–530. doi: 10.1007/s11192-015-1537-2. [DOI] [Google Scholar]
- Andersen, J. P. (2013). Association between quality of clinical practice guidelines and citations given to their references. Retrieved June 9, 2022, from https://arxiv.org/abs/1301.5782
- Ayres I, Vars FE. Determinants of citations to articles in elite law reviews. The Journal of Legal Studies. 2000;29(S1):427–450. doi: 10.1086/468081. [DOI] [Google Scholar]
- Beierlein JM, Mcnamee LM, Ledley FD. As technologies for nucleotide therapeutics mature, products emerge. Molecular Therapy Nucleic Acids. 2017;9:379. doi: 10.1016/j.omtn.2017.10.017. [DOI] [PMC free article] [PubMed] [Google Scholar]
- Bordons M, Zulueta MA. Comparison of research team activity in two biomedical fields. Scientometrics. 1997;40(3):423–436. doi: 10.1007/BF02459290. [DOI] [Google Scholar]
- Bornmann L, Leydesdorff L. Does quality and content matter for citedness? A comparison with para-textual factors and over time. Journal of Informetrics. 2015;9(3):419–429. doi: 10.1016/j.joi.2015.03.001. [DOI] [Google Scholar]
- Borrego Á, Barrios M, Villarroya A, et al. Scientific output and impact of postdoctoral scientists: A gender perspective. Scientometrics. 2010;83(1):93–101. doi: 10.1007/s11192-009-0025-y. [DOI] [Google Scholar]
- Boyack KW, Patek M, Ungar LH, et al. Classification of individual articles from all of science by research level. Journal of Informetrics. 2014;8(1):1–12. doi: 10.1016/j.joi.2013.10.005. [DOI] [Google Scholar]
- Cameron AC, Trivedi PK. Regression analysis of count data. Cambridge University Press; 1998. [Google Scholar]
- Caplar N, Tacchella S, Birrer S. Quantitative evaluation of gender bias in astronomical publications from citation counts. Nature Astronomy. 2017;1(6):1–5. doi: 10.1038/s41550-017-0141. [DOI] [Google Scholar]
- Charlton BG. Measuring revolutionary biomedical science 1992–2006 using Nobel Prizes, Lasker (clinical medicine) awards and Gairdner Awards (NLG metric) Medical Hypotheses. 2007;69(1):1–5. doi: 10.1016/j.mehy.2007.01.001. [DOI] [PubMed] [Google Scholar]
- Charlton BG. Which are the best nations and institutions for revolutionary science 1987–2006? Analysis using a combined metric of Nobel Prizes, Fields Medals, Lasker Awards and Turing Awards (NFLT metric) Medical Hypotheses. 2007;68(6):1191–1194. doi: 10.1016/j.mehy.2006.12.007. [DOI] [PubMed] [Google Scholar]
- Choi DW. Bench to bedside: The glutamate connection. Science. 1992;258(5080):241–243. doi: 10.1126/science.1357748. [DOI] [PubMed] [Google Scholar]
- Collet F, Robertson DA, Lup D. When does brokerage matter? Citation impact of research teams in an emerging academic field. Strategic Organization. 2014;12(3):157–179. doi: 10.1177/1476127014530124. [DOI] [Google Scholar]
- Contopoulos-Ioannidis DG, Alexiou GA, Gouvias TC, et al. Life cycle of translational research for medical interventions. Science. 2008;321(5894):1298–1299. doi: 10.1126/science.1160622. [DOI] [PubMed] [Google Scholar]
- Contopoulos-Ioannidis DG, Ntzani E, Ioannidis JP. Translation of highly promising basic science research into clinical applications. The American Journal of Medicine. 2003;114(6):477–484. doi: 10.1016/S0002-9343(03)00013-5. [DOI] [PubMed] [Google Scholar]
- Costas R, Bordons M. Do age and professional rank influence the order of authorship in scientific publications? Some evidence from a micro-level perspective. Scientometrics. 2011;88(1):145–161. doi: 10.1007/s11192-011-0368-z. [DOI] [PMC free article] [PubMed] [Google Scholar]
- Costas R, van Leeuwen TN, Bordons M. Referencing patterns of individual researchers: Do top scientists rely on more extensive information sources. Journal of the American Society for Information Science and Technology. 2012;63(12):2433–2450. doi: 10.1002/asi.22662. [DOI] [Google Scholar]
- Di Vaio G, Waldenström D, Weisdorf J. Citation success: Evidence from economic history journal publications. Explorations in Economic History. 2012;49(1):92–104. doi: 10.1016/j.eeh.2011.10.002. [DOI] [Google Scholar]
- Didegah F, Thelwall M. Determinants of research citation impact in nanoscience and nanotechnology. Journal of the American Society for Information Science and Technology. 2013;64(5):1055–1064. doi: 10.1002/asi.22806. [DOI] [Google Scholar]
- Dougherty D, Conway PH. The “3T’s” road map to transform US health care: The “how” of high-quality care. JAMA. 2008;299(19):2319–2321. doi: 10.1001/jama.299.19.2319. [DOI] [PubMed] [Google Scholar]
- Driscoll, D. L. (2011). Introduction to primary research: Observations, surveys, and interviews. Writing spaces: Readings on writing (vol. 2, pp. 153–174). Retrieved June 9, 2022, from https://wac.colostate.edu/books/writingspaces2/driscoll--introduction-to-primary-research.pdf
- Eriksson M, Billhult A, Billhult T, et al. A new database of the references on international clinical practice guidelines: A facility for the evaluation of clinical research. Scientometrics. 2020;122(2):1221–1235. doi: 10.1007/s11192-019-03318-2. [DOI] [Google Scholar]
- Falagas ME, Zarkali A, Karageorgopoulos DE, et al. The impact of article length on the number of future citations: A bibliometric analysis of general medicine journals. PLoS ONE. 2013;8(2):e49476. doi: 10.1371/journal.pone.0049476. [DOI] [PMC free article] [PubMed] [Google Scholar]
- Fanelli D, Costas R, Larivière V. Misconduct policies, academic culture and career stage, not gender or pressures to publish, affect scientific integrity. PLoS ONE. 2015;10(6):e0127556. doi: 10.1371/journal.pone.0127556. [DOI] [PMC free article] [PubMed] [Google Scholar]
- Frandsen TF, Nicolaisen J. The ripple effect: Citation chain reactions of a nobel prize. Journal of the American Society for Information Science and Technology. 2013;64(3):437–447. doi: 10.1002/asi.22785. [DOI] [Google Scholar]
- Geraghty J. Adenomatous polyposis coli and translational medicine. The Lancet. 1996;348(9025):422. doi: 10.1016/S0140-6736(05)64535-7. [DOI] [PubMed] [Google Scholar]
- Grant J. Evaluating the outcomes of biomedical research on healthcare. Research Evaluation. 1999;8(1):33–38. doi: 10.3152/147154499781777658. [DOI] [Google Scholar]
- Grant J, Cottrell R, Cluzeau F, et al. Evaluating “payback” on biomedical research from papers cited in clinical guidelines: Applied bibliometric study. BMJ. 2000;320(7242):1107–1111. doi: 10.1136/bmj.320.7242.1107. [DOI] [PMC free article] [PubMed] [Google Scholar]
- Gray DHD, Vaux DL, Strasser A. The 2019 Lasker Award: T cells and B cells, whose life and death are essential for function of the immune system. Cell Death & Differentiation. 2019;26(12):2513–2515. doi: 10.1038/s41418-019-0432-4. [DOI] [PMC free article] [PubMed] [Google Scholar]
- Han X, Williams SR, Zuckerman BL. A snapshot of translational research funded by the National Institutes of Health (NIH): A case study using behavioral and social science research awards and Clinical and Translational Science Awards funded publications. PLoS ONE. 2018;13(5):e0196545. doi: 10.1371/journal.pone.0196545. [DOI] [PMC free article] [PubMed] [Google Scholar]
- Honey K. Translating medical science around the world. Journal of Clinical Investigation. 2007;117(10):2737. doi: 10.1172/JCI33749. [DOI] [PMC free article] [PubMed] [Google Scholar]
- Husemann M, Rogers R, Meyer S, et al. “Publicationism” and scientists’ satisfaction depend on gender, career stage and the wider academic system. Palgrave Communications. 2017;3(1):1–10. doi: 10.1057/palcomms.2017.32. [DOI] [Google Scholar]
- Hutchins BI, Davis MT, Meseroll RA, et al. Predicting translational progress in biomedical research. PLoS Biology. 2019;17(10):e3000416. doi: 10.1371/journal.pbio.3000416. [DOI] [PMC free article] [PubMed] [Google Scholar]
- Hutchins BI, Yuan X, Anderson JM, Santangelo GM. Relative citation ratio (RCR): A new metric that uses citation rates to measure influence at the article level. PLoS Biology. 2016;14(9):e1002541. doi: 10.1371/journal.pbio.1002541. [DOI] [PMC free article] [PubMed] [Google Scholar]
- Jackson JN, Cernich AN. National Institutes of Health Research plan on rehabilitation: Analysis and progress. Archives of Physical Medicine and Rehabilitation. 2020;101(8):1313–1321. doi: 10.1016/j.apmr.2020.04.005. [DOI] [PubMed] [Google Scholar]
- Ke Q. Identifying translational science through embeddings of controlled vocabularies. Journal of the American Medical Informatics Association. 2019;26(6):516–523. doi: 10.1093/jamia/ocy177. [DOI] [PMC free article] [PubMed] [Google Scholar]
- Ke Q. The citation disadvantage of clinical research. Journal of Informetrics. 2020;14(1):100998. doi: 10.1016/j.joi.2019.100998. [DOI] [Google Scholar]
- Khoury MJ, Gwinn M, Yoon PW, et al. The continuum of translation research in genomic medicine: How can we accelerate the appropriate integration of human genome discoveries into health care and disease prevention. Genetics in Medicine. 2007;9(10):665–674. doi: 10.1097/GIM.0b013e31815699d0. [DOI] [PubMed] [Google Scholar]
- Kim YH, Levine AD, Nehl EJ, et al. A bibliometric measure of translational science. Scientometrics. 2020;125(3):2349–2382. doi: 10.1007/s11192-020-03668-2. [DOI] [PMC free article] [PubMed] [Google Scholar]
- Koenker R, Bassett G. Regression quantiles. Econometrica: Journal of the Econometric Society. 1978;16:33–50. doi: 10.2307/1913643. [DOI] [Google Scholar]
- Kryl D, Allen L, Dolby K, et al. Tracking the impact of research on policy and practice: investigating the feasibility of using citations in clinical guidelines for research evaluation. BMJ Open. 2012;2(2):e000897. doi: 10.1136/bmjopen-2012-000897. [DOI] [PMC free article] [PubMed] [Google Scholar]
- Lecocq C, Van Looy B. The impact of collaboration on the technological performance of regions: Time invariant or driven by life cycle dynamics? An explorative investigation of European regions in the field of Biotechnology. Scientometrics. 2009;80(3):845–865. doi: 10.1007/s11192-009-2158-4. [DOI] [Google Scholar]
- Leimu R, Koricheva J. What determines the citation frequency of ecological papers? Trends in Ecology & Evolution. 2005;20(1):28–32. doi: 10.1016/j.tree.2004.10.010. [DOI] [PubMed] [Google Scholar]
- Lewison G, Paraje G. The classification of biomedical journals by research level. Scientometrics. 2004;60(2):145–157. doi: 10.1023/B:SCIE.0000027677.79173.b8. [DOI] [Google Scholar]
- Lewison G, Sullivan R. The impact of cancer research: How publications influence UK cancer clinical guidelines. British Journal of Cancer. 2008;98(12):1944–1950. doi: 10.1038/sj.bjc.6604405. [DOI] [PMC free article] [PubMed] [Google Scholar]
- Li X, Tang X. Characterizing interdisciplinarity in drug research: A translational science perspective. Journal of Informetrics. 2021;15(4):101216. doi: 10.1016/j.joi.2021.101216. [DOI] [Google Scholar]
- Liang G, Hou H, Ding Y, et al. Knowledge recency to the birth of nobel prize-winning articles: Gender, career stage, and country. Journal of Informetrics. 2020;14(3):101053. doi: 10.1016/j.joi.2020.101053. [DOI] [Google Scholar]
- Littman DR. Releasing the brakes on cancer immunotherapy. Cell. 2015;162(6):1186–1190. doi: 10.1016/j.cell.2015.08.038. [DOI] [PubMed] [Google Scholar]
- Llewellyn, N., Weber, A., Nehl, E. J. (2021). Making waves: The impact of the Georgia CTSA publication portfolio from 2007–2021 big splashes and ripple effects on translation. Retrieved June 9, 2022, from https://georgiactsa.org/_includes/documents/sections/about/georgia-ctsa-biblio-altmetrics-internal-report-web-final.pdf
- Long JS. Measures of sex differences in scientific productivity. Social Forces. 1992;71(1):159–178. doi: 10.1093/sf/71.1.159. [DOI] [Google Scholar]
- Lopez FG, Ramos K. An exploration of gender and career stage differences on a multidimensional measure of work meaningfulness. Journal of Career Assessment. 2017;25(3):423–433. doi: 10.1177/1069072716639851. [DOI] [Google Scholar]
- Meslin EM, Blasimme A, Cambon-Thomsen A. Mapping the translational science policy ‘valley of death’. Clinical and Translational Medicine. 2013;2(1):1–8. doi: 10.1186/2001-1326-2-14. [DOI] [PMC free article] [PubMed] [Google Scholar]
- Miller LH, Su X. Artemisinin: Discovery from the Chinese herbal garden. Cell. 2011;146(6):855–858. doi: 10.1016/j.cell.2011.08.024. [DOI] [PMC free article] [PubMed] [Google Scholar]
- Morris ZS, Wooding S, Grant J. The answer is 17 years, what is the question: Understanding time lags in translational research. Journal of the Royal Society of Medicine. 2011;104(12):510–520. doi: 10.1258/jrsm.2011.110180. [DOI] [PMC free article] [PubMed] [Google Scholar]
- Narin F, Hamilton K. Bibliometric performance measures. Scientometrics. 1996;36(3):293–310. doi: 10.1007/BF02129596. [DOI] [Google Scholar]
- Narin F, Pinski G, Gee HH. Structure of the biomedical literature. Journal of the American Society for Information Science. 1976;27(1):25–45. doi: 10.1002/asi.4630270104. [DOI] [Google Scholar]
- Narin F, Rozek RP. Bibliometric analysis of US pharmaceutical industry research performance. Research Policy. 1988;17(3):139–154. doi: 10.1016/0048-7333(88)90039-X. [DOI] [Google Scholar]
- National Center for Advancing Translational Sciences. Translational science spectrum. Retrieved November 10, 2022, from https://ncats.nih.gov/translation/spectrum
- Nelson APK, Gray RJ, Ruffle JK, et al. Deep forecasting of translational impact in medical research. Patterns. 2022 doi: 10.1016/j.patter.2022.100483. [DOI] [PMC free article] [PubMed] [Google Scholar]
- Pallari E, Lewison G, Ciani O, et al. The impacts of diabetes research from 31 European Countries in 2002 to 2013. Research Evaluation. 2018;27(3):270–282. doi: 10.1093/reseval/rvy006. [DOI] [Google Scholar]
- Park Y, West RA, Pathmendra P, et al. Identification of human gene research articles with wrongly identified nucleotide sequences. Life Science Alliance. 2022;5(4):e202101203. doi: 10.26508/lsa.202101203. [DOI] [PMC free article] [PubMed] [Google Scholar]
- Puri K, First LR, Kemper AR. Trends in gender distribution among authors of research studies in pediatrics: 2015–2019. Pediatrics. 2021;147(4):e2020040873. doi: 10.1542/peds.2020-040873. [DOI] [PubMed] [Google Scholar]
- Roberts SF, Fischhoff MA, Sakowski SA, et al. Perspective: Transforming science into medicine how clinician–scientists can build bridges across research’s “valley of death”. Academic Medicine. 2012;87(3):266–270. doi: 10.1097/ACM.0b013e3182446fa3. [DOI] [PubMed] [Google Scholar]
- Rosas SR, Schouten JT, Cope MT, et al. Modeling the dissemination and uptake of clinical trials results. Research Evaluation. 2013;22(3):179–186. doi: 10.1093/reseval/rvt005. [DOI] [PMC free article] [PubMed] [Google Scholar]
- Shukla DC, Simma-Chiang V, Kyprianou N, et al. Does gender matter in academic surgery? Author and mentor gender impact publication citations in surgical research. Urology. 2021;157:64–70. doi: 10.1016/j.urology.2021.04.049. [DOI] [PubMed] [Google Scholar]
- Sin SCJ. International coauthorship and citation impact: A bibliometric study of six LIS journals, 1980–2008. Journal of the American Society for Information Science and Technology. 2011;62(9):1770–1783. doi: 10.1002/asi.21572. [DOI] [Google Scholar]
- Spector JM, Harrison RS, Fishman MC. Fundamental science behind today’s important medicines. Science Translational Medicine. 2018;10(438):1787. doi: 10.1126/scitranslmed.aaq1787. [DOI] [PubMed] [Google Scholar]
- Sung NS, Crowley WF, Jr, Genel M, et al. Central challenges facing the national clinical research enterprise. JAMA. 2003;289(10):1278–1287. doi: 10.1001/jama.289.10.1278. [DOI] [PubMed] [Google Scholar]
- Surkis A, Hogle JA, DiazGranados D, et al. Classifying publications from the clinical and translational science award program along the translational research spectrum: A machine learning approach. Journal of Translational Medicine. 2016;14(1):235. doi: 10.1186/s12967-016-0992-8. [DOI] [PMC free article] [PubMed] [Google Scholar]
- Symonds MRE, Gemmell NJ, Braisher TL, et al. Gender differences in publication output: Towards an unbiased metric of research performance. PLoS ONE. 2006;1(1):e127. doi: 10.1371/journal.pone.0000127. [DOI] [PMC free article] [PubMed] [Google Scholar]
- Thelwall M, Kousha K. Are citations from clinical trials evidence of higher impact research? An analysis of ClinicalTrials.gov. Scientometrics. 2016;109(2):1341–1351. doi: 10.1007/s11192-016-2112-1. [DOI] [Google Scholar]
- Thelwall M, Maflahi N. Guideline references and academic citations as evidence of the clinical value of health research. Journal of the Association for Information Science and Technology. 2016;67(4):960–966. doi: 10.1002/asi.23432. [DOI] [Google Scholar]
- Vanclay JK. Factors affecting citation rates in environmental science. Journal of Informetrics. 2013;7(2):265–271. doi: 10.1016/j.joi.2012.11.009. [DOI] [Google Scholar]
- Weber GM. Identifying translational science within the triangle of biomedicine. Journal of Translational Medicine. 2013;11(1):1–10. doi: 10.1186/1479-5876-11-126. [DOI] [PMC free article] [PubMed] [Google Scholar]
- Webster GD, Jonason PK, Schember TO. Hot topics and popular papers in evolutionary psychology: Analyses of title words and citation counts in evolution and human behavior, 1979–2008. Evolutionary Psychology. 2009;7(3):348–362. doi: 10.1177/147470490900700301. [DOI] [Google Scholar]
- Westfall JM, Mold J, Fagnan L. Practice-based research—“Blue Highways” on the NIH roadmap. JAMA. 2007;297(4):403–406. doi: 10.1001/jama.297.4.403. [DOI] [PubMed] [Google Scholar]
- Woolf SH. The meaning of translational research and why it matters. JAMA. 2008;299(2):211–213. doi: 10.1001/jama.2007.26. [DOI] [PubMed] [Google Scholar]
- Yancopoulos GD. Clinical application of therapies targeting VEGF. Cell. 2010;143(1):13–16. doi: 10.1016/j.cell.2010.09.028. [DOI] [PubMed] [Google Scholar]
- Zerhouni E. The NIH roadmap. Science. 2003;302(5642):63–72. doi: 10.1126/science.1091867. [DOI] [PubMed] [Google Scholar]
- Zhang L, Sivertsen G, Du H, et al. Gender differences in the aims and impacts of research. Scientometrics. 2021;126(11):8861–8886. doi: 10.1007/s11192-021-04171-y. [DOI] [Google Scholar]
- Zuo Z, Zhao K. Understanding and predicting future research impact at different career stages—A social network perspective. Journal of the Association for Information Science and Technology. 2021;72(4):454–472. doi: 10.1002/asi.24415. [DOI] [Google Scholar]
Associated Data
This section collects any data citations, data availability statements, or supplementary materials included in this article.
Supplementary Materials
Data Availability Statement
All data is available upon request.