Abstract
Purpose
To develop an artificial intelligence (AI) solution for automated segmentation and analysis of joint cardiac MRI short-axis T1 and T2 mapping.
Materials and Methods
In this retrospective study, a joint T1 and T2 mapping sequence was used to acquire 4240 maps from 807 patients across two hospitals between March and November 2020. Five hundred nine maps from 94 consecutive patients were assigned to a holdout testing set. A convolutional neural network was trained to segment the endocardial and epicardial contours with use of an edge probability estimation approach. Training labels were segmented by an expert cardiologist. Predicted contours were processed to yield mapping values for each of the 16 American Heart Association segments. Network segmentation performance and segment-wise measurements on the testing set were compared with those of two experts on the holdout testing set. The AI model was fully integrated using open-source software to run on MRI scanners.
Results
A total of 3899 maps (92%) were deemed artifact-free and suitable for human segmentation. AI segmentation closely matched that of each expert (mean Dice coefficient, 0.82 ± 0.07 [SD] vs expert 1 and 0.86 ± 0.06 vs expert 2) and compared favorably with interexpert agreement (Dice coefficient, 0.84 ± 0.06 for expert 1 vs expert 2). AI-derived segment-wise values for native T1, postcontrast T1, and T2 mapping correlated with expert-derived values (R2 = 0.96, 0.98, and 0.87, respectively, vs expert 1, and 0.97, 0.99, and 0.92 vs expert 2) and fell within the range of interexpert reproducibility (R2 = 0.97, 0.99, and 0.90, respectively). The AI model has since been deployed at two hospitals, enabling automated inline analysis.
Conclusion
Automated inline analysis of joint T1 and T2 mapping allows accurate segment-wise tissue characterization, with performance equivalent to that of human experts.
Keywords: MRI, Neural Networks, Cardiac, Heart
Supplemental material is available for this article.
© RSNA, 2022
Keywords: MRI, Neural Networks, Cardiac, Heart
Summary
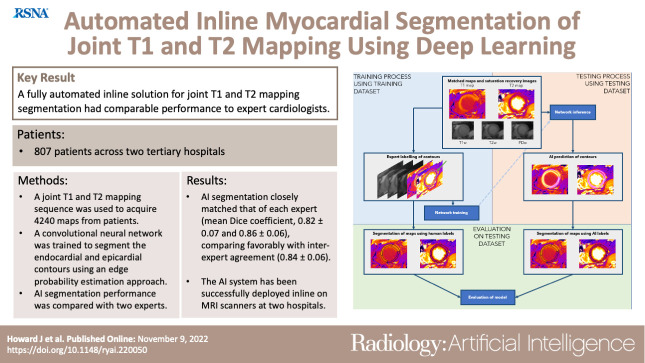
A fully automated inline solution for segmentation of joint T1 and T2 maps developed using a deep learning edge probability estimation approach had comparable performance with that of expert cardiologists.
Key Points
■ Automated segmentation of joint cardiac T1 and T2 maps with use of a deep learning edge probability estimation approach had comparable performance with interexpert agreement.
■ The artificial intelligence system has been successfully deployed inline on MRI scanners, and a video is provided that demonstrates this process in clinical practice.
Introduction
Parametric mapping allows quantitative cardiac tissue characterization through calculations of local T1 and T2 relaxation times (1,2). T1 mapping can be performed without the administration of a paramagnetic contrast agent (ie, native T1) or after contrast material administration. Elevated native T1 or T2 is an indication of edema, while reduced native T1 is an indication of iron storage or presence of fat (3). Postcontrast T1 mapping may be used to detect scar tissue or increased extracellular volume (4).
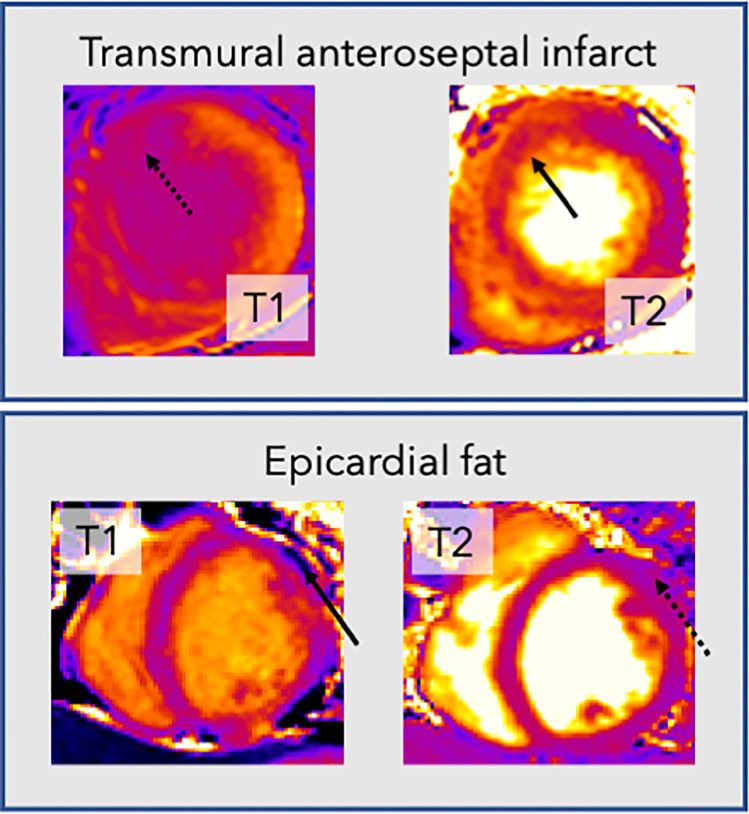
Current practice involves acquiring T1 and T2 maps in separate acquisitions, which may require breath holds and prove difficult for some patients. Furthermore, these images are often tedious and difficult for human experts to delineate, with indistinct borders between endocardial scar and blood pool on postcontrast T1 maps and between the epicardium and epicardial fat on T2 maps (Fig 1).
Figure 1:
Example cardiac MR T1 and T2 images demonstrate the rationale for joint analysis of T1 and T2 mapping. Top row: T1 map (left) in a patient with transmural anteroseptal infarct shows no endocardial definition between the myocardium and blood pool in the affected region (dotted arrow), making accurate segmentation difficult. In contrast, on the T2 map (right), the boundary (solid arrow) is clearer. Bottom row: Images in a different patient. There is an area on the T2 map (right) that is of similar mapping value to the myocardium (dotted arrow). However, this area clearly represents epicardial fat on the T1 map (left), with a very low T1 value (solid arrow).
Herein, we propose a deep learning solution to automatically analyze T1 and T2 maps acquired with a free-breathing multiparametric saturation-recovery single-shot acquisition (mSASHA) sequence (5). This sequence includes both saturation recovery (SR) and T2 preparation and uses motion correction to compensate for respiratory motion. It produces coregistered T1 and T2 maps without breath holding. We developed a processing pipeline using a convolutional neural network (CNN) to segment the endocardial and epicardial myocardial boundaries and compared the agreement with two human experts.
Materials and Methods
Study Design and Patients
The study involved the retrospective analysis of images acquired between March and November 2020. Consecutive adult patients were included from two tertiary centers in London, England (Fig 2). Images acquired during the final 3 weeks of the study were assigned to the holdout testing set. Ethical approval was granted by the Health Regulatory Agency (Integrated Research Application System identifier 243023), and the need for written informed consent was waived owing to use of fully de-identified patient data. Patient characteristics were therefore not available for analysis. However, the study sample comprises consecutive patients scanned across two hospitals, with a range of pathologic conditions reflecting normal clinical practice.
Figure 2:
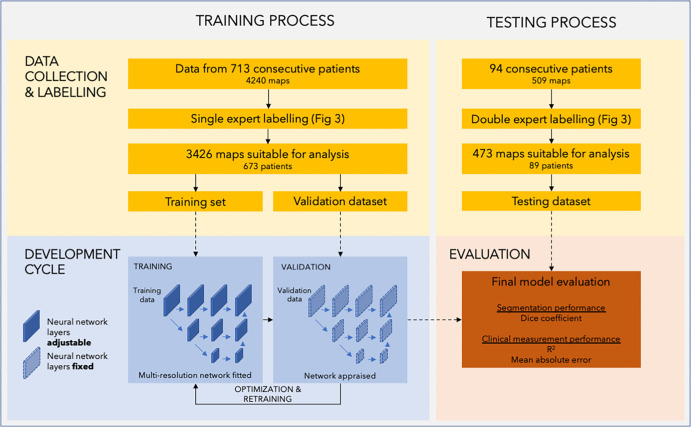
Diagram of the study process. The study comprises two separate datasets used in two stages. The training and validation datasets were used in model development. The training set was used to directly adjust the parameters of the neural network, while the validation dataset was used to continuously monitor performance during training and tune hyperparameters. The testing dataset was used in the testing process to evaluate the performance of the final model.
One author (K.C.) is an employee of Siemens Healthineers and was involved in the development of the cardiac MRI sequence. Neither he nor Siemens Healthineers were involved in the design or analysis of this study.
Image Acquisition: mSASHA Sequence
This study used an mSASHA sequence presented previously with high accuracy and precision both on phantoms and in vivo for T1 and T2 mapping (5,6). Further information on the sequence and its validation is provided in Appendix S1.
Basal, mid, and apical short-axis sections were acquired for each patient. Joint T1 and T2 maps were acquired both before and after gadolinium administration when clinically indicated. MRI was performed with 1.5-T scanners (Magnetom Aera; Siemens Healthineers).
When done, postcontrast scanning was performed approximately 15 minutes following the administration of gadobutrol (Gadovist; Bayer Healthcare) at a dose of 0.10 mmol per kilogram of body weight.
Data Processing and Labeling
Five input images were used from each mSASHA dataset: the T1 map, the T2 map, an SR T1-weighted image, an SR+T2p T2-weighted image, and a proton density–weighted image. Images were resampled to a pixel size of 1 mm2.
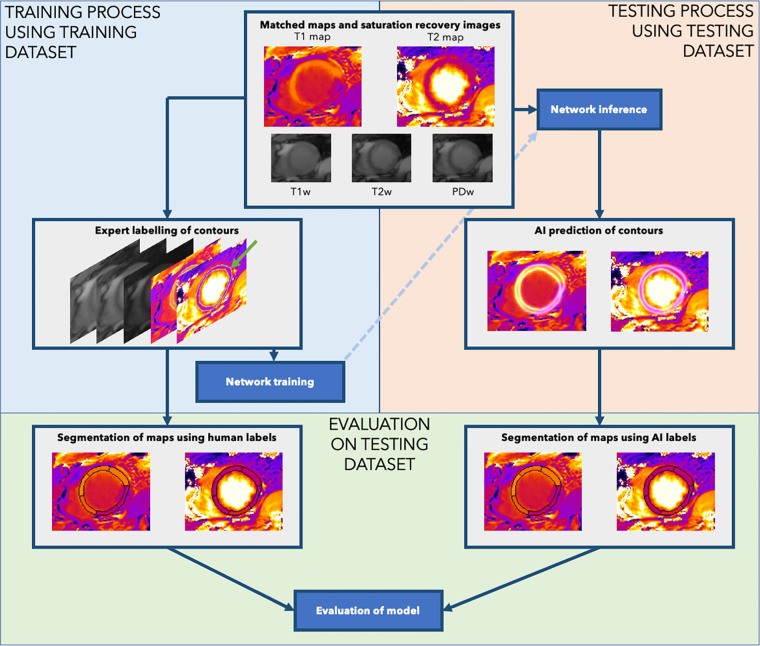
The images were then manually labeled using a custom-made labeling software (Qt [version 5]; Python [version 3.8; Python Software Foundation]) (7). Human experts delineated the endocardial boundary between the blood pool and left ventricular wall and the epicardial boundary between the left ventricular wall and epicardium, with their labels visualized simultaneously on the five input images. This allowed the endocardial border to be drawn on the T2 map and T2-weighted image (which typically demonstrate the best blood-endocardial contrast) and the epicardial border to be drawn on the T1-weighted image (which demonstrates excellent contrast between myocardium and epicardial fat). These labels were used to create heatmaps comprising ridges as the probability of a pixel lying on the boundary, decaying laterally following a Gaussian distribution, with an SD of two pixels (8). This process is outlined in Figure 3.
Figure 3:
Data processing in the study. Human experts performed labeling of the endocardial and epicardial contours using the joint T1 and T2 maps (green arrow). The neural network was then trained using labeled contours from the training dataset (upper left: Training). The trained model was applied to the test image to output the heatmaps of myocardial boundary probabilities, from which the endocardial and epicardial contours were extracted (upper right: Testing). Finally, we evaluated the performance of the system by using the human-labeled and artificial intelligence (AI)–predicted contours for each testing set case to predict segment-wise T1 and T2 mapping values (bottom: Evaluation). PDw = proton density–weighted image, T1w = T1-weighted saturation-recovery image, T2w = T2-weighted image.
The training dataset was labeled by a senior cardiologist (J.P.H.) with level 3 cardiac MRI certification. The testing dataset was also labeled by this cardiologist as well as by a cardiac MRI scientist (H.X.) with 8 years of cardiac MRI experience. Labeling took an average of 2.2 minutes per map.
Neural Network Design and Training
We posed the task of segmenting the maps as an edge estimation task (wherein the network works to identify the myocardial boundaries) rather than a typical semantic segmentation task (wherein pixels are classified as making up the left ventricular myocardium). The edge estimation approach resulted in more accurate boundary localization because minor differences in the position of contours (a few pixels) resulted in very small changes to the segmentation loss (only a few pixels out of thousands changed their identity) but much larger differences in the boundary loss (see Appendix S1 and Table S1 for these results).
We used a modified HigherHRNet architecture (9), which was originally designed for human pose estimation. Its design and hyperparameters are detailed in Appendix S1. It is a two-dimensional CNN that uses strided convolutions with multiresolution aggregation. We modified the network to have five input layers (one for each input: T1 map, T2 map, SR T1-weighted image, SR+T2p T2-weighted image, and proton density–weighted image) and two output layers (endocardial and epicardial boundaries). Full data preprocessing and augmentation strategies are outlined in Appendix S1.
The network was trained for 160 epochs using the AdamW optimizer (10), with an initial learning rate of 0.0001 and weight decay of 0.01. The network was trained to minimize the mean squared error between the expert and predicted boundary heatmaps. A OneCycle learning rate scheduler was used (11). Training was performed using two RTX Titan graphic processing units (NVIDIA).
Automatic Segmentation of Predictions
In accordance with American Heart Association guidelines (12), the contours (produced by the neural network or experts) were processed to allow segment-wise T1 and T2 mapping. Appendix S1 describes this process in detail. In summary, a landmark detection method (13) was adopted to automatically find the right ventricular insertion point from the short-axis T2 maps, allowing the basal and mid sections to be split into six segments and the apical level into four segments.
Model Deployment and Integration
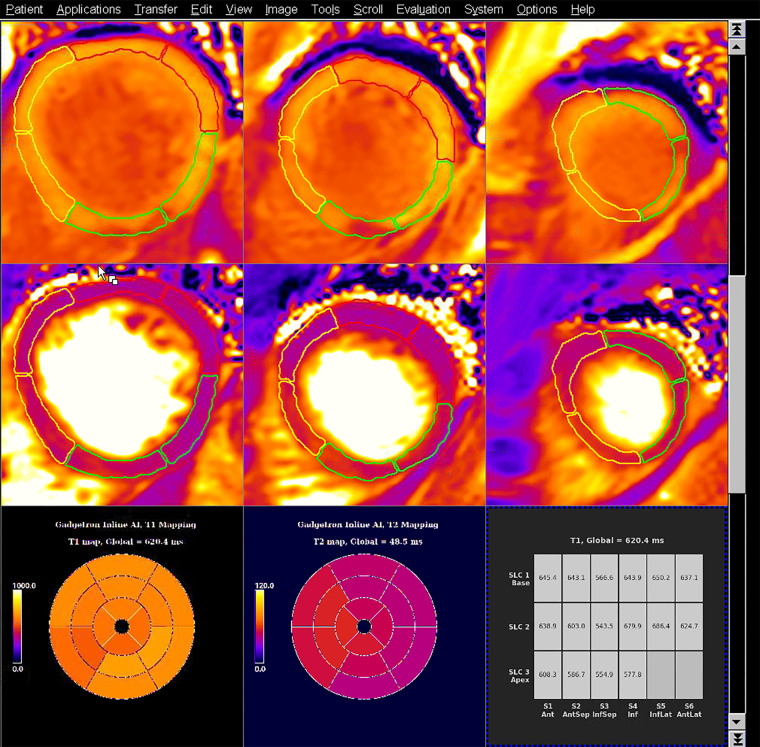
The trained models were integrated and deployed to the MRI scanner with use of the Gadgetron InlineAI toolbox (version 4.0.1) (14,15). Images were reconstructed, and T1 and T2 maps were computed with pixelwise curve fitting. The computed maps were input into the CNN for segmentation. The per-segment T1 and T2 measurements were computed and displayed as a tabular report on the scanner console. Figure 4 shows the artificial intelligence (AI) model’s predictions integrated on a 1.5-T Aera scanner. The Movie shows the scanning and inference process in full.
Figure 4:
Example T1 and T2 maps from a patient with an acute inferoseptal (InfSep) infarct, with model inference running on the scanner at Hammersmith Hospital on the 1.5-T Aera MRI scanner (Siemens Healthineers). The images show shortened postcontrast T1 relaxation times (top row) in the inferoseptum and septal edema (prolonged septal T2 relaxation times) (middle row). These data are summarized as bull’s-eye plots of median values for each of the 16 American Heart Association segments for T1 (bottom left) and T2 (bottom middle), as well as in tabular format (bottom right). The segmentation contours used in the calculations are overlaid on the T1 and T2 maps, as yellow lines (for septal segments), green lines (for inferior segments), and red lines (for anterior segments). This serves as explainable artificial intelligence (AI) and allows manual quality control by the reporter. Ant = anterior, AntLat = anterolateral, AntSep = anteroseptal, Inf = inferior, InfLat = inferolateral, SLC = section.
Movie:
A 48-second video shows joint T1 and T2 maps being acquired using the mSASHA sequence with a Siemens 1.5-T scanner. After acquisition is complete, the AI automatically analyzes the images, and segment-wise T1 and T2 mapping values are returned to the scanner for immediate review. AI = artificial intelligence, mSASHA = multiparametric saturation recovery single shot acquisition.
Statistical Analysis
The primary analysis was performed using the segment-wise T1 and T2 values of all testing set samples judged to be free of artifacts. With use of these data, the coefficient of determination (R2) was calculated separately for three sets of comparisons: (a) agreement between the AI model and the expert who trained the network (hereafter, R2 AI-E1); (b) agreement between the AI model and the second expert, who was not involved in network training (hereafter, R2 AI-E2); and (c) agreement between the two experts (hereafter, R2 E1-E2).
Significance testing was performed by comparing the Pearson correlation coefficients (r) with use of the method published by Eid et al (16).
Mean absolute error (MAE) and Spearman rho (ρ) were also calculated for the three agreements, and Bland-Altman plots were created with corresponding 95% limits of agreement.
To assess the improvement in segmentation performance afforded by training a network to jointly segment T1 and T2 maps, we further trained two networks with use of identical hyperparameters, but only inputting either the T1 map or T2 map.
Statistical analysis was performed with Python (version 3.8) and the statsmodels package (version 0.12.2) (17). P < .05 was considered indicative of a statistically significant difference.
Data Availability
Source code for the labeling software and the neural network training and assessment are published on the GitHub page of the first author under the MIT license (7,18). Data generated or analyzed during the study are available from the corresponding author by request.
Results
Patients and Images
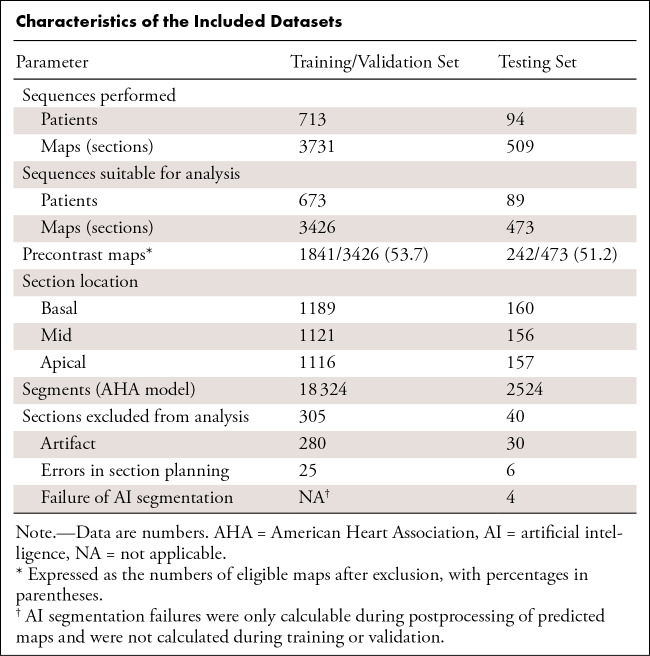
A total of 4240 maps were available from 807 patients (Table). There were 589 patients from Hammersmith Hospital, London, and 218 from Royal Free Hospital, London.
Characteristics of the Included Datasets
A total of 3731 maps from 713 consecutive patients were assigned to the training and validation dataset. A total of 3426 maps from 673 unique patients were labeled by one expert and used for model training; the other 305 maps (8.2%) could not be segmented (280 owing to artifact, 25 owing to errors in section planning). Of the 3426 included maps, 1841 (53.7%) were obtained before contrast material administration and the remaining 1585 were postcontrast maps.
A total of 509 maps across 94 consecutive patients were assigned to the testing dataset, with 473 maps across 89 unique patients dual-reported by the two experts. The other 36 maps (7.1%) were deemed unsuitable for segmentation, with agreement of the two experts (30 owing to artifact and six owing to errors in section planning). If experts disagreed on inclusion, consensus was sought through discussion (three maps [0.6%]). Of the 473 included maps, 242 (51.2%) were obtained before contrast material administration; the remaining 231 were postcontrast maps.
Segmentation Performance
AI segmentation of the maps closely matched that of the two experts (mean Dice coefficient, 0.82 ± 0.07 [SD] vs expert 1 and 0.86 ± 0.06 vs expert 2) and compared favorably with the interexpert segmentation agreement (mean Dice coefficient, 0.84 ± 0.06).
Four of 473 sections (0.8%) were excluded owing to boundary processing failures (see Appendix S1 for this process). In these sections, the traced epicardial contour ended up overlying, or even falling within, the endocardial contour, resulting in affected myocardial segments being of zero area.
T1 Mapping
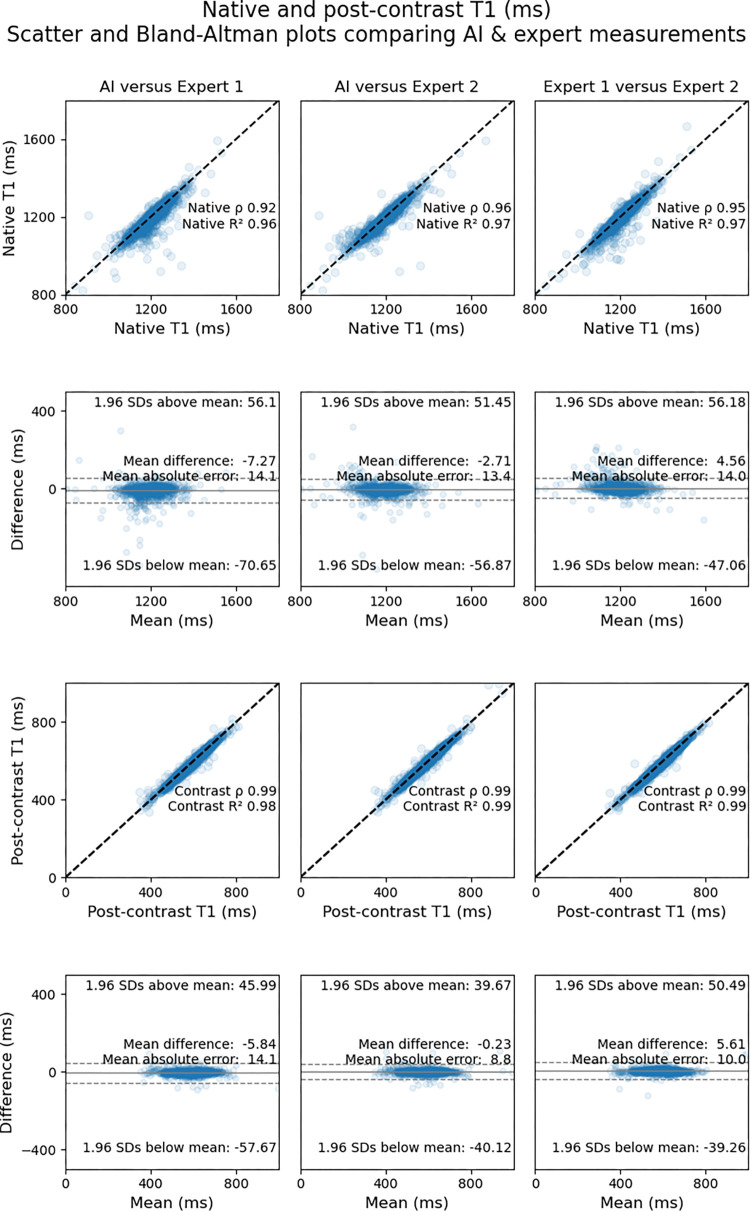
The mean segment-wise native T1 value, using labels by expert 2, was 1156 msec ± 162 (SD). AI-derived measurements correlated closely with those of expert 1 (R2AI-E1 = 0.96 [MAE = 14.1 msec]) and expert 2 (R2AI-E2 = 0.97 [MAE = 13.4 msec]). Interexpert agreement (ie, rE1-E2) was within the range of AI-expert agreement (rAI-E1 < rE1-E2 < rAI-E2; P < .001 and P = .33, respectively).
The mean segment-wise postcontrast T1 value, using labels by expert 2, was 640 msec ± 191. AI-derived measurements correlated closely with those of expert 1 (R2AI-E1 = 0.98 [MAE = 14.1 msec]) and expert 2 (R2AI-E2 = 0.99 [MAE = 8.8 msec]). Interexpert agreement in terms of correlation coefficients (rE1-E2) was within the range of AI-expert agreement (rAI-E1 < rE1-E2 < rAI-E2; P < .001 and P = .03, respectively).
Figure 5 shows scatterplots comparing segment-wise native and postcontrast T1 values for the AI model versus expert 1, the AI model versus expert 2, and expert 1 versus 2. Bland-Altman plots with corresponding 95% limits of agreement are also shown.
Figure 5:
Scatterplots (first and third rows) and Bland-Altman plots (second and fourth rows) show agreement between expert-measured segment-wise T1 values across the testing dataset and those measured by artificial intelligence (AI). Measurements for native T1 maps are shown in the top two rows, and measurements for postcontrast T1 maps are shown in the bottom two rows. The upper row of each pair of rows (ie, first and third rows) shows scatterplots for comparisons between the AI solution and the expert who trained the network (expert 1) (left), between the AI solution and the expert who was not involved in network training (expert 2) (middle), and between the two experts (right). The lower row of each pair (ie, second and fourth rows) shows the corresponding Bland-Altman plots for the respective comparisons with 95% limits of agreement (dotted lines).
Binary classification performance of the AI model across a range of cutoffs is reported in Appendix S1.
T2 Mapping
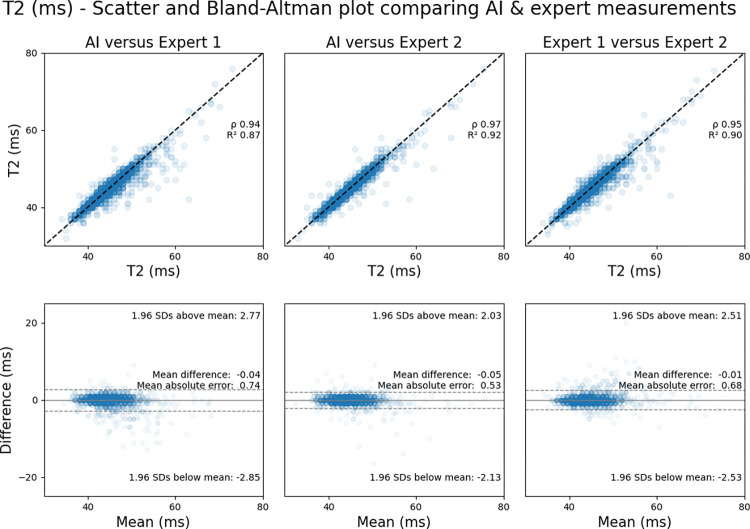
The mean segment-wise T2 value, using labels by the expert not involved in AI training (ie, expert 2), was 44.5 msec ± 3.9. AI-derived measurements correlated closely with those of the experts (R2AI-E1 = 0.87 [MAE = 0.74 msec]; R2AI-E2 = 0.92 [MAE = 0.53 msec]). Interexpert agreement (rE1-E2) was within the range of AI-expert agreement (rAI-E1 < rE1-E2 < rAI-E2; P < .001 and P = .33, respectively).
Figure 6 shows scatterplots comparing segment-wise T2 mapping values for the AI model versus expert 1, the AI model versus expert 2, and expert 1 versus 2, as well as corresponding Bland-Altman plots.
Figure 6:
Agreement between expert-measured segment-wise T2 values across the testing dataset and those measured by artificial intelligence (AI). Scatterplots (top row) show comparisons between the AI solution and the expert who trained the network (expert 1) (left), the AI solution and the independent expert not involved in network training (expert 2) (middle), and the two experts (right). The corresponding Bland-Altman plots (bottom row) show the comparisons with 95% limits of agreement (dotted lines).
Segmentation Performance Using T1 and T2 Maps Alone
To investigate the benefits of using joint T1 and T2 maps for segmentation, we trained two CNNs with identical hyperparameters, with either T1 or T2 maps alone as inputs.
The segmentation performance of these two networks was significantly worse than the model using joint maps (Dice coefficient vs experts 1 and 2 of 0.80 and 0.82, respectively, for T1 maps alone; 0.79 and 0.83 for T2 maps alone; and 0.82 and 0.86 for joint maps; P < .001 for both comparisons). Segmentation failures owing to errors in boundary processing were also higher with T1 (18 of 473 maps [3.8%]) and T2 maps alone (13 of 473 [2.7%]) than with a joint approach (four of 473 [0.8%]).
Discussion
This study presents an AI solution to automatically segment cardiac MRI T1 and T2 maps jointly acquired with a free-breathing multiparametric mapping sequence. AI-derived measurements correlated closely with those of two human experts for native T1 maps (R2 = 0.96 and 0.97 for experts 1 and 2, respectively), postcontrast T1 maps (R2 = 0.98 and 0.99), and T2 maps (R2 = 0.87 and 0.92). For each measure, the interexpert correlation coefficient was within the range of the AI-expert agreements. With use of simultaneously acquired T1 and T2 maps as the AI input, the segmentation failure rate was reduced from 3.8% with T1 maps alone to 0.8%.
While previous studies have investigated automated analysis of tissue characterization maps, this study differs in several important aspects (19,20). First, our system’s performance appears greatly improved by the ability of the mSASHA sequence to acquire simultaneous T1 and T2 maps. We believe this is because each of these maps provides useful information (contrast) at the left ventricular boundaries, particularly between the myocardium and blood pool in the case of T2 maps and myocardium and epicardial fat in the case of T1 maps. This highlights that in addition to AI model training, even the act of generating human expert ground truth labels for such AI tasks may be difficult with a traditional approach of segmenting T1 and T2 maps separately.
Second, we did not use a traditional approach of semantic segmentation wherein each pixel in an image is classified by what tissue it represents. We initially tried this approach, but we found the performance at the endocardial and epicardial boundaries to be poor, possibly because the network could effectively minimize loss by very confidently predicting the "obviously" left ventricular pixels deep within the muscle while having very low confidence at the boundary, where definition is most important. Instead, in this study, we used an edge probability estimation approach, which has been used previously in the field of human pose estimation. Instead of predicting the identity of each pixel, the neural network was trained to precisely delineate the myocardial borders. By tracing these borders at inference, segmentation could be accurately achieved. This has resulted in performance for segment-wise T1 and T2 map quantification that is equal to (native T1) or better than that of interexpert agreement (postcontrast T1 and T2). Our results compare favorably with those from other studies, which have reported Spearman ρ of between 0.82 (19) and 0.97 (20) (ie, R2 ≈ 0.94).
Third, this single-click multiparametric mapping works on a free-breathing acquisition to simultaneously analyze T1 and T2 maps, with inline integration and regional analysis.
T1 and T2 mapping allow quantitative tissue characterization. However, current approaches require clinicians to manually draw regions of interest in the myocardium in which measurements are made. This is time-consuming and prone to interoperator variation because tissue interfaces can prove difficult to delineate on certain maps. An AI system that can automate this process may not only save time but also improve precision. Our system is currently running inline at two hospitals. This allows for the creation of automated bull’s-eye plots during the scan. Not only can this assist clinicians in prompt interpretation, it can also highlight pathologic conditions to scanning staff, guiding further acquisitions.
This study shows that AI segmentations of T1 maps extend to both native and postcontrast conditions. This allows us to measure (a) the change in T1 and T2 relaxation times in the blood following the administration of gadolinium and (b) the analogous change in T1 relaxation time in the myocardium. Using these measurements, we can calculate the partition coefficient and measure the myocardial extracellular volume if the patient’s hematocrit level is known (or can be assumed). We plan to investigate this in future work. The postcontrast T1 and T2 maps allow generation of bright- and dark-blood synthetic late gadolinium enhancement (LGE) images for improved visualization of subendocardial myocardial infarction (6). This synthetic LGE calculation requires values of remote T1 in the case of bright-blood LGE and remote T1 and T2, as well as blood pool T1 and T2, for the dark-blood LGE. Therefore, automated segmentation is an essential step for the automatic calculation of synthetic LGE images.
Our study had limitations. First, although our study analyzed patients across three MRI scanners from two teaching hospitals, all were Siemens Aera 1.5-T scanners. Thus, this study cannot demonstrate if this system will generalize to different scanners and field strengths, which should be addressed in future work. Second, patient-level baseline characteristics were not available under current ethical restrictions, which may raise questions about generalizability and representativeness. However, this study recruited consecutive patients undergoing contrast-enhanced cardiac MRI across two hospitals and might therefore be viewed as representative of the clinical work at these centers. Third, only basal, mid, and apical short-axis maps were acquired. However, the workflow developed may be applicable to long-axis multiparametric mapping and will be a focus of future work. Fourth, the current analysis involves quantitative tissue characterization across 16 segments of the myocardium. However, much smaller areas of abnormal signal (ie, subsegments) may be underestimated. Therefore, it may be necessary to report heterogeneity within segments as a marker of disease in future research. Finally, the humans performing expert annotations in our study had access to the joint T1 and T2 maps, which were coregistered using custom labeling software (7). This allowed them to use information from both maps when deciding on the exact locations of the endocardial and epicardial borders. This is not representative of clinical practice, and, to our knowledge, no current reporting system has this facility. Thus, the human segmentation performance in this study may be above that achieved in routine clinical practice, setting a higher bar for the AI. A future prospective study in which test-retest measurements are performed would help quantify the relative contributions of interobserver, intraobserver, and biologic variability.
In conclusion, an AI solution using an edge probability estimation approach with a CNN allows automated quantitative tissue characterization using free-breathing T1 and T2 maps. The AI algorithm benefits from the use of mSASHA, where T1 and T2 maps are acquired simultaneously, and its performance is comparable with that of human experts. It is now implemented on clinical scanners at two tertiary hospitals, and a prospective clinical study could demonstrate its utility in both highlighting pathologic conditions to scanning staff and assisting clinicians in scan interpretation.
J.P.H. is funded by the British Heart Foundation (FS/ICRF/22/26039). This study was supported by the NIHR Imperial Biomedical Research Centre. Neither of these bodies played a role in the design of this study, nor the analysis or drafting of the manuscript. The views expressed are those of the author(s) and not necessarily those of the NIHR or the Department of Health and Social Care.
Disclosures of conflicts of interest: J.P.H. Radiology: Artificial Intelligence trainee editorial board member. K.C. Full-time employee of Siemens Medical Solutions, USA; stock in Siemens Medical Solutions, USA. L.C. No relevant relationships. M.F. No relevant relationships. G.D.C. No relevant relationships. P.K. No relevant relationships. H.X. No relevant relationships.
Abbreviations:
- AI
- artificial intelligence
- CNN
- convolutional neural network
- LGE
- late gadolinium enhancement
- MAE
- mean absolute error
- mSASHA
- multiparametric saturation-recovery single-shot acquisition
- SR
- saturation recovery
References
- 1. Moon JC , Messroghli DR , Kellman P , et al . Cardiovascular Magnetic Resonance Working Group of the European Society of Cardiology. Myocardial T1 mapping and extracellular volume quantification: a Society for Cardiovascular Magnetic Resonance (SCMR) and CMR Working Group of the European Society of Cardiology consensus statement . J Cardiovasc Magn Reson 2013. ; 15 ( 1 ): 92 . [DOI] [PMC free article] [PubMed] [Google Scholar]
- 2. Mavrogeni S , Apostolou D , Argyriou P , et al . T1 and T2 mapping in cardiology: “mapping the obscure object of desire” . Cardiology 2017. ; 138 ( 4 ): 207 – 217 . [DOI] [PubMed] [Google Scholar]
- 3. Kellman P , Hansen MS . T1-mapping in the heart: accuracy and precision . J Cardiovasc Magn Reson 2014. ; 16 ( 1 ): 2 . [DOI] [PMC free article] [PubMed] [Google Scholar]
- 4. Messroghli DR , Moon JC , Ferreira VM , et al . Clinical recommendations for cardiovascular magnetic resonance mapping of T1, T2, T2* and extracellular volume: a consensus statement by the Society for Cardiovascular Magnetic Resonance (SCMR) endorsed by the European Association for Cardiovascular Imaging (EACVI) . J Cardiovasc Magn Reson 2017. ; 19 ( 1 ): 75 [Published correction appears in J Cardiovasc Magn Reson 2018;20(1):9.] . [DOI] [PMC free article] [PubMed] [Google Scholar]
- 5. Chow K , Hayes G , Flewitt JA , et al . Improved accuracy and precision with three-parameter simultaneous myocardial T1 and T2 mapping using multiparametric SASHA . Magn Reson Med 2022. ; 87 ( 6 ): 2775 – 2791 . [DOI] [PubMed] [Google Scholar]
- 6. Kellman P , Xue H , Chow K , et al . Bright-blood and dark-blood phase sensitive inversion recovery late gadolinium enhancement and T1 and T2 maps in a single free-breathing scan: an all-in-one approach . J Cardiovasc Magn Reson 2021. ; 23 ( 1 ): 126 . [DOI] [PMC free article] [PubMed] [Google Scholar]
- 7. Howard JP . jphdotam/T1T2_labeller: Labelling software for joint T1 and T2 maps . https://github.com/jphdotam/T1T2_labeller. Accessed June 15, 2022 .
- 8. Bulat A , Tzimiropoulos G . Human Pose Estimation via Convolutional Part Heatmap Regression . In: Leibe B , Matas J , Sebe N , Welling M , eds. Computer Vision – ECCV 2016. ECCV 2016. Lecture Notes in Computer Science, vol 9911 . Cham, Switzerland: : Springer; , 2016. ; 717 – 732 . [Google Scholar]
- 9. Cheng B , Xiao B , Wang J , Shi H , Huang TS , Zhang L . HigherHRNet: Scale-Aware Representation Learning for Bottom-Up Human Pose Estimation . https://github.com/HRNet/HigherHRNet-Human-Pose-Estimation. Published 2020. Accessed July 8, 2020 .
- 10. Loshchilov I , Hutter F . Decoupled weight decay regularization . arXiv 1711.05101 [preprint] https://arxiv.org/abs/1711.05101. Posted November 14, 2017. Accessed February 21, 2021 .
- 11. Smith LN , Topin N . Super-convergence: very fast training of neural networks using large learning rates . arXiv 1708.07120 [preprint] https://arxiv.org/abs/1708.07120. Posted August 23, 2017. Accessed March 24, 2021 . [Google Scholar]
- 12. Ortiz-Pérez JT , Rodríguez J , Meyers SN , Lee DC , Davidson C , Wu E . Correspondence between the 17-segment model and coronary arterial anatomy using contrast-enhanced cardiac magnetic resonance imaging . JACC Cardiovasc Imaging 2008. ; 1 ( 3 ): 282 – 293 . [DOI] [PubMed] [Google Scholar]
- 13. Xue H , Artico J , Fontana M , Moon JC , Davies RH , Kellman P . Landmark detection in cardiac MRI by using a convolutional neural network . Radiol Artif Intell 2021. ; 3 ( 5 ): e200197 . [DOI] [PMC free article] [PubMed] [Google Scholar]
- 14. Hansen MS , Sørensen TS . Gadgetron: an open source framework for medical image reconstruction . Magn Reson Med 2013. ; 69 ( 6 ): 1768 – 1776 . [DOI] [PubMed] [Google Scholar]
- 15. Gadgetron - Medical Image Reconstruction Framework . https://github.com/gadgetron/gadgetron. Accessed August 17, 2022 .
- 16. Eid M , Gollwitzer M , Schmitt M . Statistik und Forschungsmethoden . Basel, Switzerland: : Beltz Verlag; , 2017. . https://www.beltz.de/fachmedien/psychologie/buecher/produkt_produktdetails/8413-statistik_und_forschungsmethoden.html Accessed March 25, 2021 . [Google Scholar]
- 17. Seabold S , Perktold J . Statsmodels: Econometric and Statistical Modeling with Python . 9th Python in Science Conference , 2010. . Published 2010. Accessed June 21, 2022 . [Google Scholar]
- 18. Howard JP . jphdotam/T1T2_training: Training and testing code for the T1T2 mapping paper . https://github.com/jphdotam/T1T2_training. Accessed August 17, 2022 .
- 19. Fahmy AS , El-Rewaidy H , Nezafat M , Nakamori S , Nezafat R . Automated analysis of cardiovascular magnetic resonance myocardial native T1 mapping images using fully convolutional neural networks . J Cardiovasc Magn Reson 2019. ; 21 ( 1 ): 7 . [DOI] [PMC free article] [PubMed] [Google Scholar]
- 20. Puyol-Antón E , Ruijsink B , Baumgartner CF , et al . Automated quantification of myocardial tissue characteristics from native T1 mapping using neural networks with uncertainty-based quality-control . J Cardiovasc Magn Reson 2020. ; 22 ( 1 ): 60 . [DOI] [PMC free article] [PubMed] [Google Scholar]
Associated Data
This section collects any data citations, data availability statements, or supplementary materials included in this article.
Data Availability Statement
Source code for the labeling software and the neural network training and assessment are published on the GitHub page of the first author under the MIT license (7,18). Data generated or analyzed during the study are available from the corresponding author by request.


