

OP‐268‐1‐YIA
High sensitivity C reactive protein and recurrence of arial fibrillation after catheter ablation: A meta‐analysis
Surachat Jaroonpipatkul 1; Angkawipa Trongtorsak2; Jakrin Kewcharoen3; Sittinun Thangjui4; Issaree Bunyawannukul5; Apichai Pokawattana1; Leenhapong Navaravong6
1 Rajavithi hospital, Bangkok, Thailand; 2St Francis hospital, Evanston, United States; 3Loma Linda university, Honolulu, United States; 4Bassett Healthcare, Cooperstown New York, United States; 5Knoh Kaen hospital, Knon kaen, Thailand; 6University of Utah Health, Salt lake City, United States
The recurrence after atrial fibrillation (AF) ablation is not uncommon. High sensitivity C reactive protein (hs‐CRP) is one of the widely used inflammatory markers. We conducted a meta‐analysis to find an association between hs‐CRP levels and AF recurrence after ablation.
Methods: We searched PubMed, Embase, and Wiley‐Cochrane library from inception to January 1, 2022. Overall and subgroup analyses were performed. Standardized mean difference (SMD) and 95% confidence interval (CI) were used to evaluate the associations between hs‐CRP levels and post‐ablation AF recurrence. Statistical analysis was performed with Stata 14.0. The primary endpoint of this study is to investigate the association between AF recurrence after catheter ablation and hs‐CRP levels.
Results: We identified 10 studies and total of 789 patients were included (299 recurrent vs 490 non‐recurrent patients). The mean age was 57.7 years (76.4% male). There was no difference in baseline hs‐CRP levels between AF recurrence and non‐recurrence groups (WMD = 0.05, 95% CI = −0.04–0.15, p = 0.045). However, higher follow‐up CRP levels after ablation were associated with higher AF recurrence (WMD = 0.09, 95% CI = 0.03–0.15, p < 0.001). (Figures 1 and 2).
Conclusion: Higher post‐ablation hs‐CRP level was associated with more AF recurrence. Hs‐CRP may play a role as a predictor of AF recurrence.
Supporting Documents

OP‐269‐1‐YIA
Catheter ablation in persistent atrial fibrillation: A randomized trial of Posterior Wall isolation (PWI)
David Chieng 1,2,3; Hariharan Sugumar1,2,3; Liang‐han Ling1,2,3; Louise Segan1,2,3; Ahmed Al‐Kaisey3,4; Joshua Hawson3,4; Sandeep Prabhu1,2,3; Aleksandr Voskoboinik1,2,3; Geoffrey Wong3,4; Joseph Morton3,4; Geoffrey Lee3,4; Alex McLellan3,4; Michael Wong4; Sue Finch3; Rajeev Pathak5; Deep Raja5; Laurence Sterns6; Matthew Ginks7; Christopher Reid8; Prashanthan Sanders9; Jonathan Kalman3,4; Peter Kistler1,2,3
1 Baker Heart and Diabetes Institute, Melbourne, Australia; 2Alfred Health, Melbourne, Australia; 3University of Melbourne, Melbourne, Australia; 4Royal Melbourne Hospital, Melbourne, Australia; 5Canberra Hospital, Canberra, Australia; 6Royal Jubilee Hospital, Vancouver Island, Canada; 7John Radcliffe Hospital, Oxford, United Kingdom; 8Curtin University, Perth, Australia; 9Royal Adelaide ospital, Adelaide, Australia
Objectives: Pulmonary vein isolation (PVI) alone is less effective in persistent atrial fibrillation (PsAF). Posterior wall isolation (PWI) is a common adjunctive strategy to PVI, as the posterior wall is an important trigger and substrate site. The efficacy of PWI has not been assessed in a randomized setting.
Materials and Methods: In this multi‐center, prospective, international randomized trial, 338 PsAF patients were randomized 1:1 to either PVI alone or PVI with PWI. Follow‐up was for a minimum of 12 months. The primary endpoint was freedom from any documented atrial arrhythmia of >30 seconds, after a single ablation procedure, off anti‐arrhythmic therapy (AAD) at 12 months.
Results: Median age was 65.6 (IQR 13.1) years, with 76.9% males. After 12 months, 53.9% of patients assigned to PVI alone were free from recurrent atrial arrhythmia off AAD from a single procedure, compared with 52.4% assigned to PVI with PWI (HR 1.01, CI 0.74–1.38, p = 0.96). There were no significant differences in the secondary endpoints, including freedom from AF off AAD after a single procedure (PVI 53.3% vs PVI with PWI 54.1%, p = 0.78), and freedom from atrial arrhythmia on/off AAD after multiple procedures (PVI 62.3% vs PVI with PWI 58.2%, p = 0.51). Procedural times (121 ± 57 minutes vs 142 ± 69 minutes, p < 0.01) and RF ablation times (28 ± 12 minutes vs 34 ± 21 minutes, p < 0.01) were significantly shorter for PVI alone. Complication rates were 2.9%.
Conclusions: The addition of empirical posterior wall isolation to pulmonary vein isolation did not improve freedom from AF in those undergoing catheter ablation for PsAF.
Supporting Documents

OP‐270‐2‐YIA
Randomized evaluation of the impact of catheter ablation on psychological distress in atrial fibrillation (REMEDIAL) study
Ahmed Al‐Kaisey 1,2,3; Ramanathan Parameswaran1,2; Christina Bryant4,5; Robert D. Anderson1,2; Joshua Hawson1,2; David Chieng3,6; Louise Segan3,6; Sue Finch7; Stephen Joseph1; Alex McLellan1; Liang‐Han Ling3,6; Prashanthan Sanders8; Geoffrey Lee1,2; Peter M. Kistler2,3,6; Jonathan M. Kalman1,2
1 Department of Cardiology, Royal Melbourne Hospital, Melbourne, Australia; 2Department of Medicine, University of Melbourne, Melbourne, Australia; 3Heart Centre, Alfred Hospital, Melbourne, Australia; 4Melbourne School of Psychological Sciences, University of Melbourne, Melbourne, Australia; 5Clinical Psychology, Royal Women's Hospital, Melbourne, Australia; 6Baker Heart and Diabetes Institute, Melbourne, Australia; 7School of Mathematics and Statistics, University of Melbourne, Melbourne, Australia; 8Centre for Heart Rhythm Disorders, South Australian Health and Medical Research Institute, University of Adelaide and Royal Adelaide Hospital, Adelaide, Australia
Objective: Assess the impact of atrial fibrillation (AF) catheter ablation (CA) on markers of psychological distress.
Methods: Randomised multicentre study of 100 patients with symptomatic AF comparing the impact of CA versus continued medical therapy during 12 months follow‐up on: (1) Markers of psychological distress (mean HADS [Hospital Anxiety and Depression Scale] and prevalence of severe psychological distress [HADS >15]); (2) Health‐Related Quality of Life measures (HRQOL: assessed by SF‐36); (3) AF burden (monitored using AliveCor or Loop recorders); and (4) antiarrhythmic drugs (AAD) use.
Results: Mean age of the study cohort was 59 ± 12 years (30% females). Compared to baseline, significant improvements in the mean HADS and prevalence of severe psychological distress were observed in the ablation group at 6 months (12 vs 8, p < 0.001 and 28% vs 15%, p = 0.03), and 12 months (12 vs 7, p < 0.001 and 28% vs 11%, p = 0.01) but not in the medical group at 6 months (12 vs 12, p = 0.2 and 32% vs 34%, p = 0.7) or 12 months (12 vs 11, p = 0.1 and 32% vs 30%, p = 0.7). At 12 months, compared to a medical group, the ablation arm reported improvements in the 8 SF‐36 health domains (7/8 vs 0/7), a reduction in the median AF burden (0 vs 16%, p < 0.001), and a reduction in AAD use (32 vs 89%, p < 0.001).
Conclusion: CA for AF was associated with significant improvement in psychological distress, anxiety, and depression compared with medical therapy. These findings support the role of CA in targeting the psychological symptoms of AF.
Supporting Documents


OP‐271‐2‐YIA
Peak frequency module accurately identifies the residual gaps in AF patients after PV isolation
Ming‐jen Kuo 1; Li‐Wei Lo1; Yenn‐Jiang Lin1; Shih‐Lin Chang1; Yu‐Feng Hu1; Fa‐Po Chung1; Tze‐Fan Chao1; Ta‐Chuan Tuan1; Jo‐Nan Liao1; Chin‐Yu Lin1; Ting‐Yung Chang1; Steven Kim3; Shih‐Ann Chen2
1 Taipei Veterans General Hospital, Taiwan; 2Taichung Veterans General Hospital, Taiwan; 3Abbott, Advanced applications department, USA
Objective: The conduction gap identified by peak‐to‐peak voltage after pulmonary vein isolation (PVI) has several limitations during atrial fibrillation (AF) ablation. This study tried to investigate whether the peak frequency (PF) module could identify conduction gaps and predict future AF recurrence.
Methods: One hundred and twelve paroxysmal AF patients who underwent PVI were enrolled retrospectively. The left atrium 3D electroanatomical maps were constructed by HD grid catheter. After PVI, conduction gaps were defined as sites on the prior PVI line from which the activation propagated into the PV (Figure, Panel A). Each gap and non‐gap areas were exported and analyzed by bipolar and omnipolar voltage Vmax, and bipolar and omnipolar PF modules.
Results: Fifty conduction gaps were identified from the initial 29 patients. The cut‐off value for PF to detect conduction gap was 190 Hz and 222 Hz for bipolar and omnipolar electrogram, respectively, and both had better AUC values than voltage criteria (Figure, panel B). Applying these cut‐off values in the subsequent 83 patients, there was a significantly higher AF recurrence rate for the presence of high PF over the PV antrum at the end of the procedure (96.0% vs. 4.0%, p < 0.001; 90.9% vs. 9.1%, p < 0.001, for bipolar and omnipolar, respectively) at 12 months follow‐up, which had a better prediction than voltage criteria (Figure, panels C and D).
Conclusion: Compared to voltage criteria, PF is better at identifying residual conduction gaps. Besides, the presence of high PF over the PV antrum was of value to predict future AF recurrence.
Supporting Documents

OP‐272‐1‐YIA
Atrial Cardiopathy markers in recurrent stroke—A prospective observational study
Saikiran Kakarla 1; Athira Rajendran2; Sapna Erat Sreedharan2; Narayanan Namboodiri1
1 Sree Chitra Tirunal Institue For Medical Sciences And Technology, Cardiology departement, Thiruvananthapuram, India; 2Sree Chitra Tirunal Institue For Medical Sciences And Technology,Neurology departement, Thiruvananthapuram, India
Introduction: Atrial Cardiopathy (AC) is one of the presumed mechanisms of recurrent strokes.
Objective: To evaluate the static markers of atrial dysfunction (Atrial Cardiopathy) apart from atrial fibrillation (AF) and assess their ability to predict recurrent non‐lacunar strokes.
Materials and Methods: This is a single‐center prospective observational study of all ischemic strokes of non‐lacunar etiology admitted from May 2021 to March 2022. Clinical profiles of patients, neuroimaging, and cardiac parameters (NT‐proBNP, ECG, and TTE markers) were collected. The data were analyzed with univariate and multivariate regression models to determine the predictors of recurrent stroke.
Results: We included 107 subjects with a mean age of 63.9 (±12) years in the study. 50% of patients had cryptogenic strokes and 25% had recurrent strokes at admission. Female gender, diabetes, dyslipidemia (LDL p ~ 0.022), hypertriglyceridemia (p 0.009), elevated creatinine (p‐0.03), coronary artery disease, and paroxysmal AF were significant predictors of recurrent strokes. Univariate analysis showed that wall motion abnormality and LA Volume (by TTE) > 34 ml/sq.m (p ~ 0.001) were associated with recurrent strokes. We did not find any association between ECG markers of atrial dysfunction, LA diameter, and Nt‐pro BNP with the recurrence of stroke.
Conclusion: High LA volume had a significant association with the risk of recurrence. The current study implies that cardiac substrate is a possible contributing factor to the risk of recurrence. Left atrial volume is a highly promising simple, easily accessible, and stable marker of atrial dysfunction and can very well be predicting variable for further stroke events.
OP‐273‐1‐YIA
Patients‐specific human induced pluripotent stem cell‐derived atrial cardiomyocytes demonstrate electrical remodeling in LMNA‐related atrial fibrillation
Yike Zhang; Chang Cui; Minglong Chen
Department of Cardiology, The First Affiliated Hospital of Nanjing Medical University, Nanjing, China
Objectives: To explore the molecular mechanisms of atrial involvement in laminopathy.
Materials and Methods: Human‐induced pluripotent stem cell (hiPSC) was derived from a 46‐year‐old male with familial atrial fibrillation and dilated cardiomyopathy carrying LMNA p.R335W heterozygous variant. Atrial cardiomyocytes (ACMs) were induced using a commercial differentiation kit and cultured for over 6 weeks for the following study. Functional tests and RNA sequencing were performed to test the electrical phenotypes in mutant and control cardiomyocytes.
Results: Patient‐specific iPSCs carrying LMNA p.R335W variant were differentiated into atrial cardiomyocytes which beat spontaneously and express cardiac troponin T and myosin light chain‐2a. The mutant hiPSC‐ACMs showed abnormal calcium handling and electrical activity compared with wildtype control using Ca2+ and voltage dye (FluoVolt). Bulk RNA‐seq revealed differential expressed genes. SCN5A, which encodes the α‐unit of the NaV1.5 channel, was downregulated in the LMNA‐mutant ACMs.
Conclusion: Atrial cardiomyocytes carrying the LMNA variant show abnormal expressions of ion channels, which can offer insight into the mechanism of atrial electrical remodeling in laminopathy.
OP‐274‐2‐YIA
Clinical outcomes of conduction system pacing
Yu Hang Rodney Soh 1; Siang Joo Eugene Tan1; Elaine Boey2; Jie Ying Lee1; Toon Wei Lim1; Wee Tiong Yeo1; Swee Chong Seow1; Pipin Kojodjojo2
1 Department of Cardiology, National University Heart Centre, Singapore; 2Department of Cardiology, Ng Teng Fong General Hospital, Singapore
Objectives: Conduction system pacing (CSP) comprising left bundle branch (LBBP) and His‐bundle pacing (HBP) provide physiological ventricular activation. We compare pacing performances and clinical outcomes of CSP in bradycardia and heart failure (HF) patients to propensity‐matched non‐CSP controls.
Materials and Methods: Consecutive patients from 2 affiliated hospitals undergoing cardiovascular implantable electronic device implantation for guideline‐directed indications were enrolled in a prospective registry with linkages to electronic medical records. The impact of CSP was assessed.
Results: Of 910 patients, CSP was attempted in 338 patients (191 LBBP, 147 HBP) (mean age 74 ± 11 years, 41% female, mean left ventricular ejection fraction 54 ± 14%) and successful in 282 (81% LBBP vs 78% HBP, p = 0.58). LBBP, compared to HBP, was associated with increased optimal device performance, defined as pacing thresholds <2.5 V at ≤1 ms, R‐wave amplitude ≥5 mV, and absence of CSP‐related complications (adjusted odds ratio 9.21, 95%CI 5.08–16.70, p < 0.001). Extendable helix leads for CSP were associated with worse lead handling and increased loss of conduction system capture (p < 0.05). For bradycardia (628 right ventricular pacings and 213 CSP), CSP reduced composite outcome of HF hospitalization, biventricular pacing upgrade, or all‐cause mortality when ventricular pacing was >20% (adjusted Hazard Ratio (aHR) 0.53, p = 0.04). For HF, broad QRS, and non‐LBB block (48 CSP propensity‐matched to biventricular cardiac resynchronization therapy), CSP‐reduced HF hospitalizations or all‐cause mortality (aHR 0.42, p = 0.01).
Conclusion: For bradycardia and heart failure patients fulfilling indications for device therapy, CSP especially LBBP reduces adverse events compared to conventional pacing in Asian patients. CSP should be the default pacing modality of choice.
OP‐275‐2‐YIA
The HARMS2‐AF score to predict incident AF: Development and external validation in the UKB and FHS
Louise Segan 1; Rodrigo Canovas2; Shane Nanayakkara1,2; David Chieng1,2,3; Hariharan Sugumar1,2,3; Sandeep Prabhu1,2,3; Aleksandr Voskoboinik1,2,3; Han‐Liang Ling1,2,3; Andre LaGerche1,2; Jonathan Kalman3,4; Peter Kistler1,2,3
1 Alfred Health, Prahran, Australia; 2Baker Heart and Diabetes Institute, Melbourne, Australia; 3University of Melbourne, Melbourne, Australia; 4Royal Melbourne Hospital, Melbourne, Australia
Objectives: Lifestyle risk factors are a modifiable target in atrial fibrillation (AF) management. However, the relative contribution of individual lifestyle RFs to AF incidence has not been described. We developed and validated a novel AF‐lifestyle risk score to determine the risk of AF development in the general population.
Materials and Methods: The UK Biobank (UKB) is a large prospective cohort with outcomes measured >10 years. Lifestyle risk factors underwent multivariable regression analysis in the UKB and a weighted score was developed, which was externally validated in the Framingham Heart Study (FHS). Kaplan–Meier estimates ascertained the 10‐year risk of AF development per 1‐point increase in risk score.
Results: In the UKB, AF incidence was 5.3% among 302,926 participants, with a median time to AF of 7.3 years (IQR 4.3–9.8).
Hypertension, sleep apnoea, male sex, age, obesity (BMI > 30 kg/m2), alcohol, and smoking were predictive variables (all p < 0.001); physical inactivity (OR 1.02, 95%CI 0.97–1.10, p = 0.3), diabetes (OR 0.98, 95%CI 0.91–1.06, p = 0.2) and BMI 27–30 kg/m2 (OR 1.02, 95%CI 0.97–1.07, p = 0.424) were not significant.
The HARMS2‐AF score (Figure 1) had a similar predictive performance (AUC = 0.782, LogLoss 0.178, Brier Score 0.046) to the unweighted regression model (AUC 0.808) in UKB. Validation in the FHS (AF incidence 6.7% of 7206 participants) demonstrated an AUC of 0.747 (95% CI 0.724–0.769). A higher HARMS2‐AF score (>5 points) was associated with heightened 10‐year AF risk (score 5–9: OR 9.35, score 10–14: OR 33.34).
Conclusion: The HARMS2‐AF score is a novel lifestyle risk score that may help identify individuals at risk of AF and assist in general population screening.
Supporting Documents

OP‐009‐1‐AT (TRACK 9 ‐ AT 1)
Irrigated Temperature‐Controlled radiofrequency ablation: Lesion characteristics using a high thermal diffusivity catheter
Omar Yasin 1; Tatsuhiko Hirao2; Naoto Otsuka2; Megan Schmidt3; Maryam Rettmann2; Alexa Miller; Laura Hammel2; Narayan (Guru) Kowlgi2; Douglas Packer2
1 UCLA, Los Angeles, United States; 2Mayo Clinic, Rochester, United States; 3Medtronic, Minneapolis, United States
Objective: Assess the efficacy of temperature‐controlled, irrigated radiofrequency (RF) ablation in left ventricle (LV) using a high thermal diffusivity catheter tip.
Materials and Methods: In vivo experiments were performed in a canine animal model after approval by the Institutional Animal Care and Use Committee. Temperature‐controlled RF ablation with normal saline irrigation at 8 cc/min was performed in the LV using the DiamondTemp ablation system (Medtronic, Inc., Minneapolis, Minnesota). After ablation, animals received 8–10% triphenyl tetrazolium chloride solution followed by same‐day animal sacrifice for gross pathology examination. Statistical associations were judged using the Pearson correlation coefficient (ρ) and R^2 using multivariate regression.
Results: Data from 4 animal experiments were included in our analysis (19 total LV ablations). On average, the catheter‐tissue interface temperature was 3 ± 6.1°C less than the set temperature. for ablations longer than 15 s. Average lesion depth, maximum width, and volume were 7 ± 2.9 mm, 9 ± 3.7 mm, and 257 ± 312.0〖mm〗^3, respectively. The higher temperature was associated with increased lesion depth, max width, and volume even after adjusting for duration of ablation and set power (ρ = 0.74, 0.80, 0.72, respectively and adjusted R^2 0.64, 0.62, 0.57. p‐value<0.01 for all parameters). The maximum temperature was associated with a higher percentage impedance drop and local signal amplitude drop (ρ = 0.85, 0.52, respectively, p‐value<0.05). Larger impedance and signal amplitude drop also correlated with larger lesion volume (ρ = 0.84, 0.52 p‐value<0.05).
Conclusion: Temperature‐controlled, irrigated RF ablation is effective in LV ablation using a novel high thermal diffusivity catheter. Catheter‐tissue interface temperature is a reliable marker that correlates with ablation lesion size in LV.
OP‐010‐1‐AT (TRACK 9 ‐ AT 1)
A single‐Centre experience with open window mapping for ablation of accessory pathways
Chea Chin Yung; Sofian Johar
Gleneagles Jerudong Park Medical Centre, Jerudong, Brunei Darussalam
Objectives: The use of three‐dimensional electroanatomic mapping for localization of accessory pathways (AP) improves the accuracy of substrate prediction, and reduces fluoroscopy time and radiation dose. Mapping of accessory pathways (AP) typically involves the identification of the earliest ventricular or atrial signals during retrograde or anterograde AP conduction by the operator which is time‐consuming and limits its efficacy. We report our initial experience in using Open‐window mapping (OWM) strategy for the ablation of APs using the CARTO 3 System (Version 7) and ThermoCool SmartTouch catheter for ablation (Biosense Webster, Inc).
Material and Methods: High‐density mapping with OWM strategy utilizes an automated detection algorithm that annotates the sharpest local bipolar electrogram deflections (absolute dV/dt) regardless of their chamber of origin, thus, being less dependent on operators in the interpretation of signals. OWM was performed with windows of interest parameters set to include both atrial and ventricular signals.
Results: Five consecutive patients underwent OWM for ablation of AP. Mapping was performed in both anterograde and retrograde conduction in 4 patients. Median mapping time was 25 ± 18 min with a median fluoroscopy time of 301 ± 151 seconds. OWM, when compared to manual point‐by‐point mapping, resulted in a more accurate identification of the pathway location. Ablation was successful in all five patients with a mean procedure time of 115 ± 80 minutes.
Conclusion: OWM is a useful tool that complements traditional mapping techniques and may be invaluable particularly in challenging AP cases. It has the potential to reduce ablation/procedural time and to improve outcomes for our patients.
OP‐011‐1‐AT (TRACK 9 ‐ AT 1)
Safety and efficacy of atrioventricular nodal reentry tachycardia ablation using an irrigated contact force catheter
Jonathan Lipton 1; Andrei Catanchin2; Han Lim2; Hari Sugamar3; Peter Kistler3
1 Royal Hobart Hospital, Hobart, Australia; 2Epworth Hospital, Melbourne, Australia; 3Alfred Hospital, Melbourne, Australia
Background: Atrioventricular Nodal Reentry Tachycardia (AVNRT) ablation is a common procedure in contemporary electrophysiology practice. Traditionally, ablation for AVNRT has been performed with non‐irrigated catheters, guided by fluoroscopy and intracardiac electrograms. Increasingly electroanatomic mapping systems are utilized to allow for low or zero fluoroscopy procedures. Contact force catheters can provide information on tissue contact and stability that can be helpful in patients with challenging anatomy. Available contact force catheters are irrigated and concern has existed about using irrigated tip ablation catheters for AVNRT ablation because of the potential to create lesions that are too deep and could increase the risk for AV block.
Methods: Review of procedural data from patients undergoing radiofrequency ablation for AVNRT using electroanatomical mapping combined with irrigated contact force catheter.
Results: In total, 50 patients from 4 regions across Australia were included. Procedures were performed by 9 experienced electrophysiologists. No periprocedural complications occurred. Procedural success was achieved in 96%. The median lesion contact force (25–75 centile) was 4.0 (2–6) g. Peak power was set at 50 W, median baseline irrigation was at 2 ml/min and 6 ml/min during ablation. Median number of lesions was 9 (4.5–17.5); with total ablation time of 203 (95–366) seconds. 60% of the cases were performed without fluoroscopy.
Conclusion: ablation of AVNRT using an irrigated contact force catheter on a low irrigation setting is safe and effective. Contact force catheters using low irrigation settings may safely improve success rates in AVNRT with challenging anatomy or ablation of other substrates in close proximity to vital structures.
OP‐012‐1‐AT (TRACK 9 ‐ AT 1)
Redo radiofrequency catheter ablation of idiopathic premature ventricular contractions from the right ventricular outflow tract
Mark John Sabando 1; Michael‐Joseph Agbayani2; Giselle Gervacio2; Jhobeleen De Leon2; Marie Kirk Patrich Maramara2
1 Division of Cardiovascular Medicine, Department of Medicine, University of The Philippines‐Philippine General Hospital, Manila, Philippines; 2Section of Electrophysiology, Division of Cardiovascular Medicine, Department of Medicine, University Of The Philippines‐Philippine General Hospital, Manila, Philippines
Objectives: We present a case of a young female with high‐frequency monomorphic premature ventricular contractions who underwent redo radiofrequency catheter ablation of the right ventricular outflow tract because of PVC recurrence.
Results: A 24‐year‐old female with no underlying structural heart disease presented with frequent palpitations and progressive dyspnea. There was no history of syncope nor a family history of sudden cardiac death. The PVCs had a left bundle branch block morphology with an inferior axis, qS in aVL, and transition at V3. Holter showed a high PVC burden (30%) with symptom correlation. The echocardiogram showed normal‐sized chambers with adequate left ventricular systolic function. Reversible causes were sought and ruled out. She was initially started on metoprolol and amiodarone but was unable to tolerate these. She underwent successful RF ablation of the posteroseptal RVOT and right coronary cusp of the aortic valve. Three weeks later, she had a recurrence of symptoms and PVCs with the same morphology, necessitating a redo procedure. During the redo, no PVCs were noted after catheter placement and terbutaline infusion. Decreasing the heart rate using Esmolol resulted in several PVCs. Activation mapping, pace mapping, and 3D mapping were performed. RF ablation was done at the posterior RVOT with no recurrence of PVC during the observation period. A reassessment of systolic LV function and Holter monitoring is planned after 3 months.
Conclusion: Ablation is recommended as first‐line therapy for idiopathic RVOT PVCs. Recurrence of PVC can occur in 15% of patients and can be addressed with a redo ablation.
OP‐013‐1‐AT (TRACK 9 ‐ AT 1)
Dual reversal of tachycardia‐induced cardiomyopathy and sinus node dysfunction by rhythm control approach
Raja Ahmad Anzali 1; Sunu Budhi Raharjo2; Dony Yugo Herdanto2; Dicky Armein Hanafy2; Yoga Yuniadi2
1 Department of Cardiology And Vascular Medicine Faculty of Medicine Universitas Indonesia, Jakarta, Indonesia; 2National Cardiovascular Center Harapan Kita, Jakarta, Indonesia
Background: Tachycardia‐induced cardiomyopathy (TICM) is a subform of reversible dilated cardiomyopathy (DCM). Early recognition and prompt treatment of the arrhythmia results in symptom resolution and recovery of ventricular function.
Case Illustration: A 13‐year‐old girl was referred to NCC Harapan Kita with dyspnoea during activity, palpitation, and a history of fainting. On admission, BP 95/59 mmHg, HR 170 bpm with NYHA III functional class. ECG showed atrial tachycardia. Echocardiography showed dilated all chambers with LVEF 32%, and moderate mitral regurgitation. The patient was initially diagnosed as DCM because of myocarditis. Cardiac MRI revealed no evidence of edema and fibrosis in the myocardium. Holter monitoring revealed 590 episodes of sinus arrest with the longest duration of >5.6 seconds. A sinus node dysfunction (SND) was diagnosed, and treated with AAI permanent pacemaker (PPM) implantation. After PPM, the patient still had complaints of palpitation and readmission 4 times a year despite optimal medication. Therefore, AT ablation was performed as definitive therapy. Soon after ablation, the LVEF improved to 63%, then increased to 75% at the last follow‐up. The sinus node function also improved as indicated by decreasing in the pacing percentage from 50% to 15%. Medication was rationalized after obtaining good reverse remodeling of the LVEF and sinus node function after ablation.
Summary: We describe a case of a 13‐year‐old girl with TICM initially diagnosed as DCM. The definite diagnoses were AT‐induced cardiomyopathy and SND, then treated with AAI PPM and AT ablation. After ablation, there was a good reverse remodeling of the LVEF and sinus node function.
Supporting Documents

OP‐014‐1‐AT (TRACK 9 ‐ AT 1)
Ablation therapies for paroxysmal atrial fibrillation: A systematic review and patient‐level network meta‐analysis
Khi Yung Fong 1; Joseph Zhao1; Yiong Huak Chan2; Yue Wang3; Colin Yeo3; Vern Hsen Tan3
1 Yong Loo Lin School of Medicine, National University of Singapore; 2Biostatistics Unit, Yong Loo Lin School of Medicine, National University of Singapore; 3Department of Cardiology, Changi General Hospital, Singapore
Objective(s): Despite promising trials, catheter ablation is still regarded as an adjunct to antiarrhythmic drugs (AAD) in the treatment of paroxysmal atrial fibrillation (PAF). This study aimed to compare the effectiveness of various ablation therapies against each other, and versus AAD.
Materials and Methods: Randomized controlled trials or propensity score‐matched studies comparing atrial tachyarrhythmia recurrence among any combination of ablation modalities or AAD were retrieved. Kaplan–Meier curves and risk tables for this outcome were graphically reconstructed to extract patient‐level data. Frequentist network meta‐analysis (NMA) using derived hazard ratios (HRs), as well as two restricted mean survival time (RMST) NMAs, were conducted. Treatment strategies were ranked using P‐scores.
Result(s): Across 24 studies comparing six ablation therapies (5132 patients), Frequentist NMA‐derived HRs of AF recurrence compared to AAD were 0.35 (95%CI = 0.25–0.48) for cryoballoon ablation (CBA), 0.34 (95%CI = 0.25–0.47) for radiofrequency ablation (RFA), 0.14 (95%CI = 0.07–0.30) for combined CBA and RFA, 0.20 (95%CI = 0.10–0.41) for hot‐balloon ablation (HBA), 0.43 (95%CI = 0.15–1.26) for laser‐balloon ablation (LBA), and 0.33 (95%CI = 0.18–0.62) for pulmonary vein ablation catheter. RMST‐based NMAs similarly showed significant benefit of all ablation therapies over AAD. The combination of CBA + RFA showed promising long‐term superiority over CBA and RFA, while LBA showed favorable short‐term efficacy.
Conclusion: The advantage of ablation therapies over AAD in preventing atrial tachyarrhythmia recurrence suggests that ablation should be considered as the first‐line treatment for PAF in patients fit for the procedure. The promising nature of several specific therapies warrants further trials to elicit their long‐term efficacy and perform a cost–benefit analysis.
Supporting Documents

OP‐015‐1‐AT (TRACK 9 ‐ AT 2)
Impact of catheter stability on ablation using local impedance sensing catheter with high‐power short‐duration setting
Tetsuro Takase; Yoshio Furukawa; Akira Shinoda; Yoshiki Hikosaka; Hisashi Okada; Masato Fujii; Daichi Tsudura; Kei Ichihashi; Kazuhiro Dan; Kazuhiro Maeda; Nobukiyo Tanaka
Ichinomiya Nishi Hospital, Ichinomiya, Japan
Objectives: Local impedance (LI) measurement during atrial fibrillation (AF) ablation has emerged as a novel indicator of tissue characteristics and the consequent durability of lesions created. We investigated the impact of catheter stability on lesion creation in pulmonary vein isolation (PVI) using high‐power short‐duration (HPSD) strategy with a novel catheter capable of LI and contact force (CF) measurement.
Materials and Methods: Forty consecutive patients who underwent PVI using HPSD (50 W) were divided into two groups. Twenty‐eight patients in a high stability group (CF >5 g for >90% of time, HS‐G) were compared with 12 controls in the low stability group (CF >5 g for >25% of time, LS‐G). In both groups, the target CF was 5–40 g, and the target, impedance drop was set to be 15% within 15 sec and 17% within 20 sec for the posterior wall and anterior wall respectively. PVI ablation circles were divided into 12 anatomic segments for the localization of gaps.
Results: A total of 2200 RF applications were analyzed. After PVI we found gaps in 5/331 segments (1%) in HS‐G, which is significantly lower than 8/136 segments (6%) in LS‐G (p = 0.03). Gaps were more common in carinal sites than non‐carinal sites in both groups (6% vs 1%, p = 0.01). There were no significant differences among blood impedance, initial LI, ablation time, or epicardial connection (9 vs 10%, p = 0.66) in both groups. But HS‐G had higher CF, LI drop (ΔLID), and ΔLID/initial LI (p < 0.001).
Conclusion: Catheter stability leads to acute successful lesion creation during PVI when guided by percentage local impedance drop in the HPSD setting.
OP‐016‐1‐AT (TRACK 9 ‐ AT 2)
Soft but strong—Pericardial collection during RVOT VT mapping using advisor HD grid catheter
Varsha Rakshitha Prakash; Amira Shaik; Prakash Vadagenalli Sathyanarayanarao
M S Ramaiah Medical College, Bangalore, India
Objective: The Advisor HD Grid mapping catheter has had a significant impact on the practice of 3D Electroanatomic mapping during Cardiac Electrophysiological studies. The catheter is soft, flexible, and atraumatic designed allowing better maneuverability in difficult anatomical sites. However, it can be potentially traumatic in areas of reduced thickness.
Methodology: We are describing a case of a 60‐year‐old female with frequent ill‐sustained wide complex tachycardia having LBBB morphology and an inferior axis on surface ECG. The region of earliest activation could be mapped using the HD Advisor Grid catheter at the right anterolateral free wall of RVOT. Post mapping she developed early features of cardiac tamponade. After pericardiocentesis, repeated attempts at ablation at that site failed to terminate the tachycardia. Hence the Epicardial surface of RVOT was mapped via Intrapericardial Access using the ablation catheter. The burst of RF is applied at the point of earliest activation on the epicardial surface of RVOT, carefully monitoring the left coronary system, resulting in the termination of tachycardia. The pericardial drainage catheter was left in situ.
Results: RVOT VT was successfully ablated via the epicardial approach. 105 ml of pericardial fluid was drained in a period of 72 hours post‐procedure. The pericardial drainage catheter was removed on day 3 post‐procedure and the patient was discharged. She had no recurrence of VT or pericardial effusion at follow‐up.
Conclusion: Although the Advisor HD Grid catheter is having an excellent safety profile, caution is required at areas of reduced thickness in the Heart like the atrial appendage, RV apex, and RVOT.
Supporting Documents


OP‐017‐1‐AT (TRACK 9 ‐ AT 2)
Zero‐fluoroscopy ablation for ventricular arrhythmias originating from the right ventricular outflow tract
van Ba Vu 1; Cong Thuc Luong2; Dinh Phong Phan3; Trung Kien Hoang1; Duc Thinh Do1; Manh Hung Nguyen1; Tien Dung Le1
1 E Hospital Hanoi, Vietnam; 2Vietnam Military Medical University, Vietnam; 3Hanoi Medical University, Vietnam
Objectives: Zero‐fluoroscopy (ZF) ablations using a 3D mapping system applied to various types of arrhythmias are trending and practiced in many centers over the world, but are rarely done in Vietnam. The objective of this study was to evaluate the efficacy and safety of zero‐fluoroscopy ablation for RVOT VAs, compared with the conventional fluoroscopy approach.
Methods and Results: We conducted a prospective single‐center study including 114 patients with RVOT VAs, electrocardiographic features of typical left bundle branch block, inferior axis QRS morphology, and a precordial transition ≥ V3, from May 2020 to July 2022. The patients were assigned to 2 different approaches of either ZF or fluoroscopy (F) group in a 1:1 ratio. After the period of follow‐up for 2 groups of patients of ZF and F approach 5.0 ± 4.9 (months) and 6.9 ± 9.3 (months), respectively, the results showed a higher success rate in the conventional fluoroscopy approach group than in the complete zero‐fluoroscopy group (87.3% versus 86.8%), but the difference was not statistically significant. No major complication was noted in both group.
Conclusion: ZF ablation for RVOT VAs can be done safely and effectively using the 3D electroanatomic mapping system. The results of the ZF approach are comparable to that of the conventional F approach.
Supporting Documents
TABLE 1 Demographic and clinical characteristics of the study population
| Baseline characteristics of patients | ZF (n = 53) | F (n = 55) | p‐Value |
|---|---|---|---|
| Age (mean ± sd) | 52.6 ± 13.4 | 48.8 ± 14.1 | 0.15 |
| Female (%) | 73.6% | 80.0% | 0.43 |
| Symptoms | |||
| Chest pain (%) | 60.4% | 51.9% | 0.39 |
| Dyspnea (%) | 39.6% | 40.4% | 0.93 |
| Palpitation (%) | 72.9% | 76.9% | 0.64 |
| Syncope/near‐syncope (%) | 13.2% | 20.4% | 0.32 |
| Holter recordings | |||
| PVC only (%) | 77.4% | 70.4% | 0.41 |
| Nonsustained VT (%) | 15.7% | 26.4% | 0.18 |
| Sustained VT (%) | 0.0% | 5.5% | 0.09 |
| PVC/24 h (mean ± sd) | 23849.3 ± 12551.7 | 22481.0 ± 10414.5 | 0.55 |
| Echo findings | |||
| LVEF (%) | 63.4 ± 10.2 | 64.7 ± 9.4 | 0.48 |
ZF = zero‐fluoroscopy, F = fluoroscopy, PVC = premature ventricular complex, VT = ventricular tachycardia, LVEF = left ventricular ejection fraction.
TABLE 2 Procedural parameters and ablation outcomes
| Characteristics | ZF (n = 53) | F (n = 55) | p‐Value |
|---|---|---|---|
| Ablation catheter | |||
| Irrigated (n, %) | (27/53) 50.9% | (27/55) 49.1% | 0.85 |
| Procedural results | |||
| Total procedure time (minutes) (mean ± sd) | 67.9 ± 22.2 | 62.9 ± 31.1 | 0.34 |
| Fluoroscopy time (minutes) (mean ± sd) | 00.0 ± 00.0 | 718.5 ± 465.1 | 0.000 |
| DAP (mean ± sd) | 00.0 ± 00.0 | 26493.6 ± 69499.1 | 0.007 |
| Total RF ablation time (seconds) (mean ± sd) | 503.4 ± 263.5 | 656.0 ± 465.8 | 0.01 |
| Number of lesions (mean ± sd) | 6.2 ± 3.6 | 8.7 ± 6.0 | 0.012 |
| Local EAT (ms) (mean ± sd) | 28.8 ± 6.4 | 24.8 ± 4.4 | 0.000 |
| Major complication (n, %) | 0 (0.00%) | 0 (0.00%) | ‐ |
| Period of follow‐up (month) (mean ± sd) | 5.0 ± 4.9 | 6.9 ± 9.3 | 0.21 |
| Acute success rate (%) | (53/53) 100% | (54/55) 98.2% | 0.32 |
| Success rate (%) | (46/53) 86.8% | (48/55) 87.3% | 0.94 |
ZF = zero‐fluoroscopy, F = fluoroscopy, DAP = dose area product, RF = radio‐frequency, EAT = earliest activation time.
TABLE 3 Parameter of the zero‐fluoroscopy procedure with different arrhythmogenic foci in the RVOT
| Sites of foci in the RVOT | No. patients | Procedure time (minutes) | RF ablation time (seconds) | Recurrence rate (%) |
|---|---|---|---|---|
| (1) Free‐wall, right, and proximal side (n, %) | 6 (11.3%) | 76.67 ± 24.8 | 476.0 ± 226.9 | (1/6) 16.7% |
| (2) Free‐wall, right, and distal side (n, %) | 3 (5.7%) | 55.0 ± 8.66 | 444.0 ± 56.7 | (0/3) 0% |
| (3) Free‐wall, left, and proximal side (n, %) | 8 (15.1%) | 68.8 ± 23.6 | 567.3 ± 281.2 | (1/8) 12.5% |
| (4) Free‐wall, left, and distal side (n, %) | 2 (3.8%) | 87.5 ± 46.0 | 382.5 ± 81.3 | (0/2) 0% |
| (5) Septal, right, and proximal side (n, %) | 3 (5.7%) | 55.0 ± 20.0 | 435.0 ± 117.3 | (2/3) 66.7% |
| (6) Septal, right, and distal side (n, %) | 4 (7.5%) | 62.5 ± 29.6 | 516.0 ± 341.7 | (1/4) 25% |
| (7) Septal, left, and proximal side (n, %) | 20 (37.7%) | 68.8 ± 17.1 | 495.7 ± 309.0 | (0/20) 0% |
| (8) Septal, left, and distal side (n, %) | 7 (13.2%) | 65.4 ± 28.9 | 558.1 ± 283.3 | (2/7) 28.6% |
RVOT, right ventricular outflow tract.

FIGURE 1 Utility of non‐steerable decapolar catheter for activation mapping of RVOT VAs.

FIGURE 2 The acute success rate and follow‐up outcomes.

FIGURE 3 The learning curve for zero‐fluoroscopy procedure.
OP‐018‐1‐AT (TRACK 9 ‐ AT 2)
Comparison of 3D ablation with conventional ablation on the duration of fluoroscopy and radiation dose
Muhammad Rizky Putra Adri; Agung Fabian Chandranegara
General Regional Hospital Of Pasar Rebo, East Jakarta, Indonesia
Objectives: Radiofrequency catheter ablation is a widely used procedure for cardiac arrhythmias. This procedure has been traditionally performed under fluoroscopy guidance and requires high radiation exposure for patients and medical staff. Nowadays, this issue becomes increasingly important, even the ALARA principles is a routine in cathlab. Therefore, 3D navigation mapping has developed and this technology will reduce the procedure time and use of fluoroscopy. This study investigated whether ablation with a 3D mapping system has any impact on radiation exposure to the patients and medical staff.
Materials and Methods: Twenty‐two (47.7 ± 13.3 years; 4 male and 18 female) consecutive patients who underwent ablation in General Regional Hospital Pasar Rebo between January 2021 and June 2022 were included. The design study is a retrospective cohort. Variable is presented as Total Dose Area Product (DAP) dan fluoroscopy time.
Results: Twenty‐two ablation were performed. 13 patients underwent conventional ablation and 9 patients underwent 3D ablation. There was a difference between the meantime of fluoroscopy and total DAP between 3D ablation and conventional ablation. 3D ablation has a lower fluoroscopy time (17.28 ± 17.47 vs 39.93 ± 33.70 minutes; p = 0.021) and lower total DAP (41.41 ± 46.90 vs 67.59 ± 40.37 mGycm2; p = 0.036) compared to conventional ablation.
Conclusion: This study shows that statistically, 3D ablation is an option to reduce radiation exposure to patients and medical staff because of the lower total DAP and fluoroscopy time compared to conventional ablation.
OP‐019‐1‐AT (TRACK 9 ‐ AT 2)
Safety and efficacy of intracoronary chilled‐saline infusion during Epicardial ablation in the left ventricular summit
Bharatraj Banavalikar; Darshan Krishnappa; Deepak Padmanabhan; Jayaprakash Shenthar
Sri Jayadeva Institute Of Cardiovascular Sciences And Research, Bengaluru, India
Introduction: Catheter ablation in the left ventricular summit (LVS) is challenging owing to its intimate relationship with the proximal coronaries.
Objectives: To determine the safety and efficacy of intracoronary chilled saline infusion during ablation in the LVS.
Methods: Patients with symptomatic PVC from the LVS formed the study population. Patients with significant coronary artery disease (coronary stenosis >50%) were excluded from the study. Irrigated ablation was performed in the epicardium either percutaneously or transvenously via the distal great cardiac vein (GCV). Chilled saline (5–10 degrees Celsius) was administered into the left main coronary artery (LMCA) at 50 ml/min throughout the entire duration of ablation. A coronary angiogram was always performed to delineate the distance of the ablation catheter from the proximal coronaries before and after ablation.
Results: Between January 2020 and October 2021, 27 patients (mean age 46.2 ± 10.8 years; 14 females; mean LVEF 46.6 ± 7.9%) underwent epicardial ablation in the LVS. Fourteen patients had LVEF<50% (PVC‐induced cardiomyopathy). Epicardial ablation was percutaneously achieved in six patients, whereas in 21 patients, it was performed transvenously in the distal GCV. Chilled saline was infused into the LMCA throughout the entire duration of RFA in all the patients without any untoward effect. Acute procedural success was achieved in 25 out of the 27 patients (92.6%). At a mean follow‐up of 19 ± 7.9 months, 24 patients (88.9%) were asymptomatic and free from clinical arrhythmia.
Conclusions: Intracoronary chilled saline administered during epicardial ablation in the LV summit is safe and effective in preventing collateral damage to the proximal coronaries.
OP‐020‐1‐AT (TRACK 9 ‐ AT 2)
Temporal influence of operator fatigue on atrial fibrillation ablations: A Single‐Center analysis with Cartonet data
Donald Mehlhorn; Sankalp Patel; Dhiran Verghese; Dinesh Sharma
Naples Community Hospital, Naples, United States
Supporting Documents
Background: The relationship between procedure time‐of‐day and operator fatigue has yet to be determined. Therefore, we sought to utilize the data from the Cartonet system to understand the temporal influence on catheter stability and lesion characteristics during the procedure, which could be a surrogate for operator fatigue.
Methods: We performed a retrospective analysis of early (before 12 p.m.) versus late (after 3 p.m.) CAAF for the outcome of catheter stability and ablation lesion characteristics compared using a two‐sided t‐test.
Results: Of 162 ablations, the mean age of patients was 71.3 ± 10.2 years; 67% were male, 33% were female, 17% (n = 28) were late, and 83% (n = 134) were early. The primary outcome of mean catheter stability in the early group was 0.96 + 0.64 mm vs. 0.80 + 0.57 mm in the late group (p = 0.62). Early vs late metrics for secondary outcomes demonstrated; average ablation time 31.3 + 10.5 minutes vs 28.2 + 11.6 minutes (p = 0.22), average number of ablations per procedure of 145 + 52 vs 132 + 44 (p = 0.19), average ablation index 355 + 59 vs 345 + 104 (p = 0.66); average impedance drop −622 + 430 Ω vs −788+ 485 Ω (p = 0.12); average maximum power 40.0 + 3.7 W vs 41.5 + 3.9 W (p = 0.10) and mean average force 11.1 + 6.3 g vs 9.5 + 15.5 g (p = 0.62).
Conclusion: Our retrospective analysis demonstrated no difference in catheter stability, a surrogate for operator fatigue, compared to late‐in‐day procedures. Ablation lesion characteristics are thus likely independent of the time the procedures are performed in a day. However, future data from prospective studies should define the temporal impact of the procedure start time on the ablation lesions.
TABLE 1 Primary outcome and secondary outcomes from Cartonet data comparing early versus late‐in‐day procedures
| Outcome analyzed | Early | Late | p‐Value |
|---|---|---|---|
| Catheter Stability | 0.96 ± 0.64 mm | 0.80 ± 1.57 mm | 0.62 |
| Ablation Time | 31.3 ± 10.5 minutes | 28.2 ± 11.6 minutes | 0.22 |
| Number of Ablations | 145 ± 52 | 132 ± 44 | 0.19 |
| Ablation Index | 355 ± 59 | 345 ± 104 | 0.66 |
| Impedance Drop | −622 ± 430 Ω | −788 ± 485 Ω | 0.12 |
| Max Power | 40.0 ± 3.7 W | 41.5 ± 3.9 W | 0.10 |
| Force | 11.1 ± 6.3 g | 9.5 ± 15.5 g | 0.62 |
OP‐021‐1‐AT (TRACK 9 ‐ AT 3)
Novel approach for PVI utilizing the third‐generation laser‐balloon system in patients with atrial fibrillation
Christian Heeger; HuongLan Phan; Julia Vogler; Charlotte Eitel; Marcel Feher; Bettina Kirstein; Roland Tilz
Uksh Lübeck, Luebeck, Germany
Abstract
Background: The visually guided laser balloon ablation system (LB) offers a unique technology for PVI. The novel third‐generation LB (LB3) provides a new feature. The rapid mode offers the possibility to apply an automated continuous 360° lesion, which enables effective and fast PVI. After a learning curve of 15 cases, we implemented a novel approach utilizing a single transseptal puncture.
Methods: A total of 30 consecutive patients with symptomatic AF were enrolled. 15 patients were treated via a conventional approach with two transseptal punctures and 3D mapping (control). Patients 16–30 were treated utilizing a slenderer approach (Fast).
Results: All patients underwent PVI, using the LB3 ablation system. All 114 (100%) pulmonary veins could be successfully isolated. The median procedure time was 60.5 (IQR 53, 77) min (control: 77 (IQR 68, 87) min, fast: 52 (IQR 43, 60) min, p < 0.001). The percentage of rapid mode was 98 (IQR 94, 100) % (control: 97 (IQR 91, 99) min, fast: 100 (IQR 95, 100) min, p = 0.134). The rapid mode only was achieved in 54% of PVs. Single sweep PVI was achieved in 40% of PVs.
Severe adverse events occurred in a total of 1 out of 30 patients (3%): one case of pericardial tamponade requiring pericardiocentesis, which was successfully performed. This occurred during the 6th case.
Conclusion: The fast PVI approach utilizing the LB3 offers an effective and safe as well as significantly faster PVI compared to the standard approach.
OP‐022‐1‐AT (TRACK 9 ‐ AT 3)
Epicardial fat volume and outcomes of Posterior Wall isolation in patients with persistent atrial fibrillation
Daehoon Kim; Hee Tae Yu; Oh‐Seok Kwon; Tae‐Hoon Kim; Jae‐Sun Uhm; Boyoung Joung; Moon‐Hyoung Lee; Hui‐Nam Pak
Yonsei University College Of Medicine, South Korea
Objectives: Increased epicardial adipose tissue (EAT) is associated with higher recurrences after atrial fibrillation catheter ablation (AFCA). We investigated the effects of posterior wall box isolation (POBI) in addition to circumferential pulmonary vein isolation (CPVI) on rhythm outcomes with varying epicardial adipose tissue (EAT) volumes in patients with persistent atrial fibrillation (PeAF).
Materials and Methods: We included 1187 patients with PeAF undergoing a de novo AFCA including those receiving CPVI alone (n = 687) and those receiving additional POBI (n = 500). The rhythm outcomes at two years post‐AFCA were compared in subgroups stratified by the EAT volume using propensity overlap weighting.
Results: A reduced EAT volume was linearly associated with more favorable rhythm outcomes for additional POBI than for CPVI alone (p for interaction = 0.002). Among the patients with smaller EAT volumes (<=116.23 ml, the median value, n = 594), additional POBI was associated with a reduced AF recurrence risk as compared to CPVI only (weighted HR [hazard ratio] 0.74, 95% CI [confidence interval] 0.56–0.99). In contrast, among the remaining 593 patients with greater EAT volumes (>116.23 ml), there was no difference in the recurrence risk between the additional POBI and CPVI alone groups (weighted HR 1.13, 95% CI 0.84–1.52). Among 205 patients with repeat ablations, the POBI reconnection rate was significantly higher in the large EAT group (77.4%) than in the small EAT group (56.7%, p = 0.034).
Conclusion: While PeAF patients with a smaller EAT volume averted AF recurrence by additional POBI after CPVI, no benefit of the POBI was observed in those with a greater EAT volume.
Supporting Documents

OP‐023‐1‐AT (TRACK 9 ‐ AT 3)
First experience of pulse field ablation for AF ablation in Singapore
Julian Cheong Kiat Tay 1; Eric Lim1; Wee Siong Teo1,2; Daniel Chong1; Kelvin Chua1; Paul Lim1; Boon Yew Tan1; Kah Leng Ho1; Vern Hsen Tan3; Colin Yeo3; Chi Keong Ching1
1 NHCS, Singapore; 2Mount Elizabeth Hospital, Singapore; 3Changi General Hospital, Singapore
Pulsed‐field ablation (PFA) using the Farapulse system was introduced in September 2022 in Singapore. We describe here this initial experience.
Methods: Patients with paroxysmal or persistent atrial fibrillation were included, but only PFA pulmonary vein isolation was allowed. Procedures were performed under conscious sedation, with or without intracardiac echocardiography/CT coronary angiography/pulmonary vein angiography/pre‐ or post‐ablation electroanatomic mapping at the operators' discretion. Ablation protocol mandated 8 ablation lesions per vein (2.5 s pulses, 4 in basket configuration, 4 in flower configuration), as per manufacturer recommendations.
Results: Ten patients underwent PFA for AF by 6 different operators (9 paroxysmal, 1 persistent, all de‐novo procedures). The mean procedure time was 141 minutes. The mean time from insertion of the Farawave catheter to completion of PVI was 56 minutes. Post‐ablation mapping was performed in 6 cases (4 with Rhythmia Orion, 2 with Ensite X HD Grid). All mapped veins were confirmed acutely isolated at the antral level. Conscious sedation with midazolam, fentanyl, and propofol was used (9 continuous, 1 bolus; 0.7 mg, mean dose of 127mcg and 323 mg, respectively). The mean and median post‐procedure day 1 pain score recalled by the patient was 2.75 and 2 out of 10, respectively. There were no acute complications during the case or at post‐op day 1.
Conclusion: PFA was effective for pulmonary vein isolation in paroxysmal AF patients. The time for completion of PVI was low even for new operators. Significant pain occurs during PFA–conscious sedation using propofol and fentanyl was successful in dealing with PFA‐induced pain.
OP‐024‐V‐AT
Wave speed mapping for rapid termination of atrial flutter with new Omnipolar technology
Antonio Dello Russo 1; Michela Casella1; Quintino Parisi1; Laura Cipolletta1; Sergio Castrejòn2; Marcel Martìnez‐Cossiani2; Leonardo Ciulli2; Jose Merino2
1 Ospedale Riuniti Torrette, Ancona, Italy; 2University Hospital La Paz, Madrid, Spain
Background: Omnipolar Technology (OT) provides information on conduction velocity, activation direction, and voltage irrespective of catheter orientation by leveraging unipolar and bipolar signals measured from Advisor™ HD Grid (HD Grid, Abbott) mapping catheter. Whether conduction velocity aids in the characterization of atrial flutter (AFL) circuits is currently unknown.
Objective: To assess the use of OT Wave Speed (WS) in delineating areas of AFL critical isthmuses as compared to traditional local activation time (LAT) mapping.
Methods: We report 18 cases (15 atypical, 3 typical; mean age: 70.5 ± 9 years) presenting with symptomatic AFL. Patients underwent atrial mapping with HD Grid. We compared LAT maps of the critical isthmus to the slowest conduction zone identified by WS; 12 retrospectives on EnSite Precision™ system and 6 prospective on EnSite™ X system. WS values of 0.9 ± 0.6 mm/ms were found to discriminate critical areas of the AFL circuit. Continuous variables were checked for normality with Shapiro–Wilk test and statistical comparisons were made with t or Wilcoxon rank‐sum tests.
Results: Slowest conduction area identified by WS was significantly smaller than that identified by LAT (0.4 cm2 and 1.2 cm2, respectively; p = 0.02). In Figures A and B below, a single radiofrequency delivery at this latter point corresponded to arrhythmia termination. In the data set, slow WS areas correlated to termination in 100% of patients.
Conclusion: Identifying smaller areas of interest with WS mapping could facilitate an understanding of AFL circuitry and drive more specificity in CA. WS mapping is a promising tool that should be further explored.
Supporting Documents

FIGURE (A) Standard LAT map of atrial flutter circuit, (B) Wave speed map of atrial flutter circuit.
OP‐025‐V‐AT
Impact of PV isolation with third‐generation laser balloon ablation system combined with coated balloon
Moritoshi Funasako 1; Jan Petru1; Pieter Koopman2; Boris Schmidt3; D. Q. Nguyen4; Petr Neuzil1
1 Na Homolce Hospital, Prague, Czech Republic; 2Heart Centre Hasselt, Jesse Hospital, Hasselt, Belgium; 3Cardioangiologisches Centrum Bethanien, Frankfurt, Germany; 4St. Vinzenz‐Hospital Cologne, Cologne, Germany
Supporting Documents
Objectives: The third‐generation laser balloon ablation system (X3) with an automated laser rotation mechanism, namely RAPID mode has been widely introduced for pulmonary vein (PV) isolation as a safe and effective treatment tool for atrial fibrillation (AF). However, pinholes because of conductive heating were to be improved to maximize the benefit of RAPID mode. In this study, the acute X3 procedural results with a newly developed robust‐coated balloons were analyzed.
Materials and Methods: We analyzed 148 patients from 4 EU centers treated with coated‐balloon X3. LA procedure was limited to PV isolation and PVs were checked with a multielectrode ring catheter. Procedure time and % of RAPID mode ablation were all measured.
Results: The average patient age was 66+/−11 years old, 40.5% (60/148) were female, and 66.9% (99/148) were paroxysmal AF. All patients underwent PV isolation with X3 without RF touch‐up. The mean skin‐to‐skin procedure time was 57.8+/−17.6 min, the LA dwell time including PV isolation was 44.8+/−16.0 min, and the fluoroscopy time was 5.3+/−4.3 min. RAPID mode was utilized in all of the treated PVs and 80.7% of the total ablation time per vein. Of all the treated PVs, 207 out of 574 veins (36.1%) were isolated in a single sweep with RAPID Mode. The first pass PV isolation was achieved in 96.5% (553/573 veins). No pinholes were reported and only one transient phrenic nerve palsy was observed.
Conclusion: Newly established X3 with coated balloon demonstrated a safety profile and short procedure time to maximize RAPID mode laser balloon ablation.
OP‐026‐V‐AT
WPW syndrome and Preexcitation‐Induced cardiomyopathy: Is it a causal or casual relationship?
Muhammad Rizky Felani 1; Dicky Armein Hanafy2; Sunu Budhi Raharjo2; Dony Yugo Hermanto2; Yoga Yuniadi2
1 Resident of Cardiology and Vascular Department, National Cardiovascular Center Harapan Kita (NCCHK), Palembang, Indonesia; 2Staff of Arrhythmia Division, Cardiology and Vascular Department, National Cardiovascular Center Harapan Kita (NCCHK), Jakarta, Indonesia
Supporting Documents
Background: In patients with Wolff‐Parkinson‐White (WPW) syndrome, the presence of an accessory pathway (AP), results in palpitation symptoms most commonly because of Atrioventricular Reentrant Tachycardia (AVRT). The mechanism for the development of left ventricular dysfunction in patients with the pre‐excitation syndrome has not yet been fully elucidated, and its prevalency in Indonesia is not well known. The eccentric ventricular activation via AP, may arise in right‐sided AP, could result in an asynchronous spread of ventricular depolarization, then leads to LV dyssynchrony and worsening LV dysfunction, defines as Preexcitation‐Induced Cardiomyopathy (PIC).
Objective: To review the magnitude of the impact of Right AP of Pre‐excitation Syndrome resulting in PIC and to discuss the result of successful Right AP ablation for LV systolic function improvement of our patient in NCCHK.
Case Illustration: A 12‐year‐old female patient with WPW Syndrome and congestive heart failure because of Non‐Ischaemic Cardiomyopathy with 18% of LV ejection fraction (EF). During the radiofrequency ablation (RFA), the AP was found in the right anterior location, in accordance with the 12‐lead ECG analysis. The RFA for the AP procedure was done successfully. Six months after successful AP ablation, her LVEF increased significantly to 35%.
Summary: The cardiomyopathy in this patient was presumably because of LV dyssynchrony from marked ventricular preexcitation. The right anterior AP of the patient had successfully ablated, and no more complaints of palpitations were recognized by the patient. Long‐term follow‐up, especially on clinical and echocardiographic results, still needs to be done. By far, her LVEF's improvement has been excellent without remaining symptoms.
OP‐027‐V‐AT
Comparison of Omnipolar voltage by Omnipolar technology and conventional bipolar voltage
Takanao Mine; Miho Sugitani; Takehiro Kougame; Ryo Kitagaki; Eiji Fukuhara; Masaharu Ishihara
Hyogo Medical University, Nishinomiya, Japan
Objective: We compared the Omnipolar voltage detected using EnSite™ Omnipolar Technology (OT), which improves underestimation of voltage because of the mismatch between potential direction and catheter placement direction, with the conventional Bipolar voltage.
Method: In 18 patients with atrial fibrillation ablation, left atrial mapping was performed with Advisor™ HD Grid Mapping Catheter under atrial pacing after pulmonary vein isolation. The voltage within a 1 cm diameter circle was measured at each site (Roof, Anterior, Posterior, Septal, Lateral) and evaluated by two methods.
Result: The Omnipolar voltage was higher than the bipolar voltage in the entire left atrium (2.32 ± 1.84 vs. 2.16 ± 1.72 mV, p = 0.0080), meanwhile, the bipolar potential was more elevated in some regions (Figure).
Conclusion: The Omnipolar voltage is not always higher than the Bipolar potential, and Further attention should be paid to its evaluation.
Supporting Documents

OP‐029‐1‐AF (TRACK 6 ‐ AF 1)
Clinical outcomes of Taiwan patients with atrial fibrillation treated with edoxaban in the global ETNA‐AF program
Tze‐Fan Chao
Taipei Veterans General Hospital, Taiwan
Objectives: The direct oral anticoagulant, edoxaban, is now available in many Asian countries. Nonetheless, data about the use of edoxaban in routine clinical practice in Taiwan is still limited. This analysis describes the baseline and one‐year clinical outcomes from the ETNA‐AF Global database to better understand edoxaban therapy in Taiwan patients with atrial fibrillation (AF) compared to those in Japan and Europe.
Materials and Methods: The ongoing ETNA‐AF Global program integrates the data about baseline characteristics, treatments, and clinical outcomes of over 30,000 AF patients treated with edoxaban enrolled from Europe, Japan, and East Asian countries into a single database. In this analysis, AF patients treated with edoxaban in Taiwan (N = 983), were compared with those from Europe and Japan regarding the baseline characteristics and 1‐year risks of clinical outcomes.
Results: More patients in Taiwan were older than 75 years old and had an eGFR<50 ml/min than those in Japan and Europe. The prescription rates of recommended 60 mg and recommended 30 mg edoxaban in Taiwan were 32.0% and 37.9%, respectively. The prescriptions of non‐recommended 30 mg (18.1%) and 60 mg (18.1%) doses were more common in Taiwan than in Japan and Europe. The 1‐year risk of all‐cause mortality (2.19%) was numerically lower, while the risk of major bleeding (1.37%) was higher for Taiwan AF patients compared to those in Japan and Europe.
Conclusion: Although some differences in baseline characteristics and dosing patterns were noted between Taiwan and Europe, the ETNA‐AF data support the effectiveness and safety of edoxaban for Taiwan AF patients.
Supporting Documents
| Demographics and other baseline characteristics | |||
|---|---|---|---|
| No. (annual incidence,%) | EU | Japan | Taiwan |
| Total [N = 13,133] | Total [N = 11,330] | Total [N = 983] | |
|
Age [years], n (%) < 65 [65, 74] [75, 84] ≥ 85 |
1995 (15.2) 4449 (33.9) 5313 (40.5) 1375 (10.5) |
1666 (14.7) 3710 (32.7) 4354 (38.4) 1600 (14.1) |
159 (16.2) 381 (38.8) 312 (31.7) 131 (13.3) |
|
Recalc. eGFR (CG formula) [ml/min/1.73m2], n (%) ≥ 80 (50; 79) [30; 49] [15; 29] < 15 |
4127 (36.1) 4914 (43.0) 2107 (18.4) 289 (2.5) 3 (0.0) |
2417 (21.9) 5072 (46.0) 2990 (27.1) 542 (4.9) 6 (0.1) |
156 (16.6) 439 (46.9) 244 (26.0) 97 (10.4) 1 (0.1) |
|
Edoxaban dose at baseline, n (%) 60 mg Recommended Non‐Recommended 30 mg Recommended Non‐recommended |
10,036 (76.4) 8916 (67.9) 1120 (8.5) 3097 (23.6) 1992 (15.2) 1105 (8.4) |
3123 (27.6) 2866 (25.3) 257 (2.3) 8207 (72.4) 6777 (59.8) 1430 (12.6) |
432 (43.9) 315 (32.0) 117 (11.9) 551 (56.1) 373 (37.9) 178 (18.1) |
| Comparison with 1‐year outcome for EU, Japan and Taiwan | |||
|---|---|---|---|
|
No. (annual incidence,%) [95% CI] |
EU | Japan | Taiwan |
|
All‐cause mortality |
464 (3.62) [3.30; 3.96] |
277 (2.85) [2.54; 3.21] |
21 (2.19) [1.43; 3.36] |
|
Major bleeding |
135 (1.06) [0.89; 1.25] |
123 (1.27) [1.06; 1.52] |
13 (1.37) [0.79; 2.35] |
|
Intracranial hemorrhage (ICH) |
31 (0.24) [0.21; 0.65] |
38 (0.39) [0.29; 0.54] |
4 (0.42) [0.16; 1.11] |
|
Major GI bleeding |
53 (0.41) [0.32; 0.54] |
85 (0.88) [0.71; 1.09] |
5 (0.52) [0.22; 1.26] |
|
Any stroke |
92 (0.72) [0.59; 0.88] |
156 (1.61) [1.38; 1.89] |
13 (1.37) [0.79; 2.35] |
|
Stroke (ischemic) |
70 (0.55) [0.43; 0.69] |
121 (1.25) [1.05; 1.49] |
11 (1.16) [0.64; 2.09] |
OP‐030‐1‐AF (TRACK 6 ‐ AF 1)
Update of outcomes in edoxaban‐treated Asian atrial fibrillation patients in the global ETNA‐AF program
Chun Chieh Wang
Chang Gung Memorial Hospital, Taiwan
Objectives: Direct anticoagulant edoxaban is available in many Asian countries. Nonetheless, routine clinical use evidence is still scant. This analysis updates clinical outcomes from the ETNA‐AF Global database to better understand edoxaban therapy in patients of 4 Asian countries (South Korea, Taiwan, Hong Kong, and Thailand).
Materials and Methods: A total of 3359 patients from South Korea (1887), Taiwan (983), Thailand (299), and Hong Kong (190) were enrolled and followed for 2 years until April 2022. Baseline characteristics and 2‐year clinical outcomes were analyzed and compared with the European and Japanese populations.
Results: Baseline patient body weights were lower in the 4 Asian countries than in Europe. The patient ratio of those ≥85 years was lower in 4 countries than in Japan and Europe. The patient ratio of eGFR ≥80 ml/min was lower in the 4 countries and Japan than in Europe. The patient ratio of recommended 60 mg and 30 mg edoxaban doses in 4 countries were 38.5% and 32.4%, respectively. The non‐recommended 30 mg and 60 mg doses were higher in 4 countries than in Europe and Japan. At the Congress, the 2‐year clinical outcomes data will be presented, including ischemic stroke, major bleeding, intracranial hemorrhage, and total mortality.
Conclusion: The 2‐year large‐size prospective follow‐up is expected to provide valuable information to understand better the effectiveness and safety of edoxaban in the real‐world setting for the Asian population per se and the perspective of other regions.
Supporting Documents
| Demographics and other baseline characteristics | |||
|---|---|---|---|
| EU | Japan |
4 Countries (KR/TW/HK/TH) |
|
|
Total [N = 13,133] |
Total [N = 11,330] |
Total [N = 3359] |
|
| Weight [kg], mean (SD) | 81.0 ± 17.3 | 60.0 ± 12.8 | 65.9 ± 12.4 |
| Age [years], mean (SD) | 73.6 ± 9.5 | 74.2 ± 10.1 | 71.7 ± 9.6 |
| Age [years], n (%) | |||
| < 65 | 1995 (15.2) | 1666 (14.7) | 678 (20.2) |
| [65, 74] | 4449 (33.9) | 3710 (32.7) | 1296 (38.6) |
| [75, 84] | 5313 (40.5) | 4354 (38.4) | 1122 (33.4) |
| ≥ 85 | 1375 (10.5) | 1600 (14.1) | 263 (7.8) |
| Calc. eGFR (CG formula) [ml/min/1.73m2], n (%) | |||
| ≥ 80 | 4127 (36.1) | 2417 (21.9) | 621 (20.7) |
| (50; 79) | 4914 (43.0) | 5072 (46.0) | 1435 (47.8) |
| [30; 49] | 2107 (18.4) | 2990 (27.1) | 755 (25.1) |
| [15; 29] | 289 (2.5) | 542 (4.9) | 190 (6.3) |
| < 15 | 3 (0.0) | 6 (0.1) | 2 (0.1) |
| Edoxaban dose at baseline, n (%) | |||
| 60 mg | 10,036 (76.4) | 3123 (27.6) | 1670 (49.7) |
| Recommended | 8916 (67.9) | 2866 (25.3) | 1293 (38.5) |
| Non‐Recommended | 1120 (8.5) | 257 (2.3) | 377 (11.2) |
| 30 mg | 3097 (23.6) | 8207 (72.4) | 1689 (50.3) |
| Recommended | 1992 (15.2) | 6777 (59.8) | 1088 (32.4) |
| Non‐recommended | 1105 (8.4) | 1430 (12.6) | 601 (17.9) |
Calc, calculated; CG, Cockcroft Gault; eGFR, estimated glomerular filtration rate; EU, Europe; HK, Hong Kong; n, number; TH, Thailand; TW, Taiwan; SD, standard deviation.
OP‐031‐1‐AF (TRACK 6 ‐ AF 1)
Real‐world sex differences in healthcare utilization after cryoballoon ablation: 2‐year outcomes from Cryo global registry
Surinder Kaur 1; Kyoung Ryul Julian Chun2; Christian Drephal3; Fernando Scazzuso4; Fred Kueffer5; Kelly van Bragt1; Thorsten Lawrenz6; Derick Todd7; Paweł Ptaszyński8; Csaba Földesi9
1 Institut Jantung, Negara ‐ National Heart Institute, Kuala Lumpur, Malaysia; 2Cardioangiologisches Centrum Bethanien, Frankfurt am Main, Germany; 3Sana Klinikum Lichtenberg, Berlin, Germany; 4Institituo Cardiovascular Buenos Aires (ICBA), Buenos Aires, Argentina; 5Medtronic, Inc, Mounds View, Minneapolis, United States; 6Städtische Kliniken Bielefeld gem. GmbH ‐ Klinikum Mitte, Bielefeld, Germany; 7Liverpool Heart and Chest Hospital, Liverpool, UK; 8Centralny Szpital Kliniczny Uniwersytetu Medycznego w Łodzi, Łódź, Poland; 9Gottsegen György Országos Kardiovaszkuláris Intézet, Budapest, Hungary
Objective(s): For patients with atrial fibrillation (AF), females have been underrepresented in larger randomized trials evaluating cryoballoon ablation (CBA). This real‐world analysis aims to describe the healthcare utilization of female versus male patients after CBA.
Materials and Methods: This registry is an ongoing, global evaluation of CBA procedures in standard‐of‐care practice. Females undergoing CBA were compared to males at baseline, 12, and 24 months post‐ablation. Healthcare utilization was assessed by freedom from repeat ablation, hospitalization, and rate of cardioversion.
Result(s): Of 3089 patients with 12‐month follow‐up, 1136 (36.8%) were female; a subset of 1105 patients were followed through 24 months. Females were on average older than males (64 vs. 59 years, p < 0.01), more often presented with paroxysmal AF (84.4% vs. 80.0%, p < 0.01), and more often experienced ≥1 symptom(s) (94.5% vs. 87.4%, p < 0.01) at baseline. The rate of serious procedure‐related adverse events was low overall in females (3.9%) and males (2.7%, p = 0.06). After 24 months of follow‐up, there was not a statistical difference between females and males in the rate of atrial arrhythmias (25.0% vs. 22.1%, p = 0.38), repeat ablations (10.7% vs. 9.9%, p = 0.75), and cardioversions (6.0% vs. 4.1%, p = 0.12). However, females versus males had a significantly higher rate of all‐cause (20.8% vs. 16.2%, p < 0.01) and cardiovascular‐related (18.1% vs. 14.0%, p < 0.01) hospitalizations at 24 months.
Conclusion: CBA is safe and effective in both sexes, but females had a higher risk of being hospitalized within 24 months after CBA. Reasons for more hospitalizations might be the higher symptom burden, older age, and more co‐morbidities in females.
OP‐032‐1‐AF (TRACK 6 ‐ AF 1)
Outcomes of On‐Label Reduced‐Dose edoxaban in patients with atrial fibrillation: The LEDIOS registry
Ju‐Youn Kim; Young Keun On
Samsung Medical Center, Seoul, South Korea
Background: Non‐vitamin K antagonist oral anticoagulants (NOACs) are effective in preventing thromboembolisms and reduce the risk of bleeding compared with warfarin. There are few reports on the outcomes of on‐label reduced‐dose NOACs. The aim of this study was to assess the safety and efficacy of on‐label reduced‐dose edoxaban in patients with atrial fibrillation (AF).
Methods: This study is a multi‐center, prospective, non‐interventional study to evaluate the safety and efficacy of on‐label reduced‐dose edoxaban in patients with AF. We evaluated outcomes of major bleeding, stroke or systemic embolism, all‐cause death, and composite clinical outcomes.
Results: A total of 2448 patients (mean age 75.0 ± 8.3 years, 801 [32.7%] males) was included in the present study. The mean CHA2DS2‐VASc score was 3.7 ± 1.5. Major bleeding events occurred at a rate of 1.34%/yr. The event rate of strokes and systemic embolisms was 1.13%/yr. The overall net clinical outcomes occurred at a rate of 3.19%/yr. There were no significant differences according to the number of dose reduction criteria, renal dysfunction, or body weight. A higher HAS‐BLED score and higher combination of CHA2DS2‐VASc and HAS‐BLED score was associated with an increased risk of composite clinical outcomes compared to the lower score groups.
Conclusions: This study was the largest prospective real‐world study to investigate the safety and efficacy of on‐label low‐dose edoxaban in an Asian population. Reduced‐dose edoxaban can be used safely in patients with severe renal dysfunction or extremely low body weight. Our observation suggests that physicians should consider bleeding risk even in a low‐dose regimen.
Supporting Documents
Keywords: Atrial fibrillation, reduced dose, oral anticoagulants, safety, efficacy

FIGURE 1 Kaplan–Meier Curves of the primary outcome. (A) Freedom from major bleeding, (B) Freedom from ischemic strokes or systemic embolisms, (C) Freedom from all‐cause death, and (D) Freedom from composite clinical outcomes.
TABLE 1 Baseline Characteristics
| Total (n = 2448) | Criteria = 1 (n = 1520) | Criteria> = 2 (n = 928) | p‐Value | |
|---|---|---|---|---|
| Age [years], mean (SD) | 75.0 ± 8.3 | 72.7 ± 8.4 | 78.9 ± 6.6 | <0.001 |
| Gender, male (%) | 801 (32.7) | 542 (35.7) | 259 (27.9) | <0.001 |
| Body weight [kg], mean (SD) | 55.4 ± 8.2 | 57.7 ± 8.4 | 51.7 ± 6.1 | <0.001 |
| BMI, mean (SD) | 22.9 ± 3.0 | 23.5 ± 3.0 | 21.9 ± 2.7 | <0.001 |
| CrCl [mL/min], mean (SD) | 51.4 ± 18.8 | 59.1 ± 18.5 | 39.1 ± 11.3 | <0.001 |
| CHA2DS2‐VASc, mean (SD) | 3.7 ± 1.5 | 3.4 ± 1.4 | 4.2 ± 1.4 | <0.001 |
| HAS‐BLED, mean (SD) | 2.1 ± 1.0 | 2.0 ± 1.0 | 2.3 ± 1.0 | <0.001 |
| Medical history, n (%) | ||||
| Hypertension | 1757 (71.8) | 1070 (70.4) | 687 (74.0) | 0.053 |
| Stroke | 272 (11.1) | 144 (9.5) | 128 (13.8) | 0.001 |
| Diabetes | 649 (26.5) | 387 (25.5) | 262 (28.2) | 0.143 |
| Heart failure | 647 (26.4) | 342 (22.5) | 305 (32.9) | <0.001 |
| Dose reduction criteria, n (%) | ||||
| Body weight ≤ 60 kg | 2095 (85.6) | 1170 (77.0) | 925 (99.7) | <0.001 |
| CrCl 15–50 mL/min | 1171 (47.8) | 284 (18.7) | 887 (95.6) | <0.001 |
| Concomitant use of P‐gp inhibitors | 128 (5.2) | 66 (4.3) | 62 (6.7) | 0.015 |
| Number of dose reduction criteria = 1 | 1520 (62.1) | |||
| Number of dose reduction criteria = 2 | 914 (37.3) | |||
| Number of dose reduction criteria = 3 | 14 (0.6) |
BMI: body mass index, CrCl: creatinine clearance, P‐gp: P‐glycoprotein.
TABLE 2 Event rates according to dose reduction criteria
| Outcomes | Event rate per 100 person‐years | ||
|---|---|---|---|
| Total (n = 2448) | Weight ≤ 60 (n = 2095) | CrCl 30–50 ml/min (n = 1171) | |
| Stroke/SEE | 1.13 | 0.96 | 1.84 |
| Major bleeding | 1.34 | 1.47 | 1.28 |
| All‐cause mortality | 1.00 | 1.01 | 1.28 |
| Composite clinical outcomes | 3.19 | 3.11 | 3.78 |
CrCl: creatinine clearance, SEE: systemic embolic event.
OP‐033‐1‐AF (TRACK 6 ‐ AF 1)
Development and qualitative validation of a patient‐reported outcome measure for AF‐specific health literacy
Rajiv Mahajan; Gai McMichael; Lynette Cusack; Dian Andina Munawar; Mark Boyd; Lyle Palmer
University of Adelaide And Lyell Mcewin Hospital, Adelaide, Australia
Background: The health literacy of people living with AF is thus a key enabler of effective behavioral modification to slow or prevent complications and AF progression. There are currently no clinical and research patient‐reported outcome measures (PROM) to assess AF‐specific health literacy that incorporates knowledge of the risk factors of AF. We discuss the development and qualitative validation of the Atrial Fibrillation Health Literacy Questionnaire (AFHLQ), an AF‐specific PROM of interactive and critical health literacy of people living with AF.
Methods: This was a qualitative research design to develop and validate the AFHLQ. A 47‐item questionnaire was developed through expert consensus. The questionnaire consists of 5 domains: (1) what is AF, (2) what are the symptoms of AF, (3) why do people get AF, (4) management of AF, and (5) what measures can slow or prevent the progression of AF? This was then qualitatively validated through clinical expert and consumer opinion.
Results: Seven clinical experts and seven consumers participated in separate advisory groups. Recommendations resulted in several changes to the original 47‐item list during the qualitative validation process: 13 original items were removed, and 13 new items were added. The response categories were also simplified from a Likert scale to “yes,” “no,” or “unsure.”
Conclusion: A 47‐item AFHLQ instrument was developed and validated with modifications made through clinical expert and consumer opinion. This tool can be used to evaluate and guide interventions at a clinical and population level to improve AF health literacy and outcomes.
OP‐034‐1‐AF (TRACK 6 ‐ AF 3)
Posterior Wall isolation in persistent atrial fibrillation and heart failure with reduced ejection fraction (HFrEF)
David Chieng 1; Hariharan Sugumar1,2,3; Liang‐Han Ling1,2,3; Louise Segan1,2,3; Ahmed Al‐Kaisey3,4; Joshua Hawson3,4; Sandeep Prabhu1,2,3; Aleksandr Voskoboinik1,2,3; Geoffrey Wong3,4; Joseph Morton3,4; Geoffrey Lee3,4; Alex McLellan3,4; Michael Wong4; Sue Finch3; Rajeev Pathak5; Deep Raja5; Laurence Sterns6; Matthew Ginks7; Christopher Reid8; Prashanthan Sanders9; Jonathan Kalman3,4,10; Peter Kistler1,2,3,10
1 Baker Heart and Diabetes Institute, Melbourne, Australia; 2Alfred Hospital, Melbourne, Australia; 3University of Melbourne, Melbourne, Australia; 4Royal Melbourne Hospital, Melbourne, Australia; 5Canberra Hospital, Canberra, Australia; 6Royal Jubilee Hospital, Vancouver Island, Canada; 7John Radcliffe Hospital, Oxford, United Kingdom; 8Curtin University, Perth, Australia; 9Royal Adelaide Hospital, Adelaide, Australia; 10Monash University, Melbourne, Australia
Objectives: Catheter ablation (CA) in AF and heart failure with reduced ejection fraction (HFrEF) is associated with improved left ventricular ejection fraction (LVEF) and survival compared with medical therapy. Previous non‐randomized studies have shown high success rates with posterior wall isolation (PWI). The objective of this randomized study is to examine differences in outcomes between pulmonary vein isolation (PVI) alone and PVI with PWI.
Materials and Methods: CAPLA was a multi‐center, prospective, randomized trial involving PsAF patients assigned to PVI alone or PVI with PWI. This substudy included patients with HFrEF (LVEF<50%). The primary endpoint was freedom from any documented atrial arrhythmia of>30 seconds, after a single ablation procedure, off anti‐arrhythmic therapy (AAD) at 12 months.
Results: 98 patients with PsAF and HFrEF (mean age 62.1+/−9.8 years, 79.5% males, median LVEF 35+/−13%). 46.9% underwent PVI with PWI. After 12 months, 61.5% of patients with PVI alone were free from recurrent atrial arrhythmia off AAD vs 58.7% with PVI and PWI (HR1.02, CI0.54–1.91, p = 0.96). There were no significant differences in freedom from atrial arrhythmia on/off AAD after multiple procedures (PVI 65.4% vs PVI with PWI 60.9%, p = 0.73) or AF burden (median 0%, p = 0.78). Median LVEF improved in PVI alone (∆LVEF 18.2+/−14%, p < 0.01), and PVI with PWI (19.3+/−12.9%, p < 0.01), with no difference between groups (p = 0.71). Normalization of LV function (≥50%) occurred in 59.1% with PVI alone, and 71.4% in PVI with PWI (p = 0.26).
Conclusions: CA is associated with significant LVEF improvements in PsAF and HFrEF. However, adding PWI to PVI did not improve freedom from arrhythmia recurrence nor recovery of LVEF.
Supporting Documents

OP‐035‐1‐AF (TRACK 6 ‐ AF 3)
Long‐term results of MCG Map‐Guide AF surgery in Long‐Standing persistent AF and structural heart disease
Doosang Kim
Veterans Health Service Medical Center, Seoul, South Korea
Objective: To report the long‐term (more than 10 years) follow‐up results of the feasibility study of magnetocardiography action potential activity map‐guide minimal AF surgery in patients who have long‐standing persistent AF and structural heart diseases.
Materials and Methods: From June 2006 to June 2008, eight patients had been enrolled. The mean age is 63 years old and the AF burden is 1.0. Their LA size is 60 mm. MCG AMAP was prepared and underwent concomitant structural heart surgery with MCG map‐guide minimal AF lesion set. AF recurrence was defined as any single episode in ECG follow‐up (not 30 seconds rule).
Results: There were no sick sinus syndrome and no permanent pacemaker insertion. The median AF recur‐free time is 12.030 years and 10‐year AF free rate is 87.5%. The mean AF‐free time is 10.003 years (95% C.I. 6.644 to 13.363).
Conclusion: We report the long‐term results of the feasibility study of MCG map‐guide minimal AF surgery and its results are acceptable.
Supporting Documents

OP‐036‐V‐AF
Silent cerebral embolism after surgical and percutaneous left atrial appendage intervention
Kexin Wang
The First Affiliated Hospital Of Nanjing Medical University, Nanjing, 中国
Supporting Documents
Objective(s): Left atrial appendage (LAA) intervention is an alternative to oral anticoagulation therapy for thromboprophylaxis in atrial fibrillation (AF). There is limited data on procedure‐related silent cerebral embolisms (SCE) among different LAA interventions. The aim of our study is to assess the incidence and risk factors of the new SCE after percutaneous LAA occlusion (LAAO) and mini‐invasive thoracoscopic LAA excision (LAAE) in AF patients.
Materials and Methods: Consecutive AF patients referred for either LAAO or LAAE between September 2018 and December 2020 were included. All patients underwent cerebral magnetic resonance imaging before and within 7 days after the procedure. The incidence, size, and location of SCE, as well as risk factors, were analyzed.
Result(s): Out of 74 patients who met the analyzing criteria (42 males, aged 68.4 ± 7.4 years), 42 underwent LAAO and 32 LAAE. A significantly higher incidence of new SCE was seen in the LAAO group compared to LAAE (54.8% vs. 6.3%, p < 0.001). 71.4% of SCE is located in the cortex. In the LAAO group, patients developing SCE had significantly higher CHA2DS2‐VASc scores (OR 2.172; 95% CI 1.149–4.104; p = 0.017), longer LAAO placement time (OR 1.067; 95% CI 1.018–1.118; p = 0.006), and lower peak activated clotting time (ACT) level (OR 0.976; 95% CI 0.954–0.998; p = 0.035).
Conclusions: The incidence of procedure‐related SCE was much higher in patients with percutaneous LAAO than in LAAE patients. More cardiovascular co‐morbidities, longer LAAO placement time, and lower ACT levels were significantly associated with the development of SCE during the LAAO procedure.
OP‐037‐1‐AF (TRACK 6 ‐ AF 3)
High‐density or circular catheter for vein reconnection in redo atrial fibrillation after the index procedure
Nicola Bottoni; Fabio Quartieri; Matteo Iori; Antonella Battista
Arcispedale Sant Maria Nuova, Reggio Emilia, Italy
Objectives: Despite the use of a contact force (CF) sensing catheters, the creation of durable transmural lesions in the left atrium (LA) remains the main challenge in atrial fibrillation ablation (AF) procedures. We aimed to evaluate pulmonary vein (PV) reconnection in redo AF procedures after index PV isolation (PVI) with spring‐based CF radiofrequency (RF) ablation.
Methods: We retrospectively enrolled 28 patients who received a redo AF ablation procedures between 2016 and 2021. All patients underwent index PVI procedures by means of RF spring‐based CF ablation technology between 2012 and 2020. At the redo procedure, PV conduction gaps were mapped either with circular mapping catheter Advisor FLTM (CMC) or AdvisorTM HD Grid (HDG) (Abbott, Minneapolis, MN). Ablation was performed with a fiberoptic CF RF ablation catheter.
Results: A total of 28 patients (age: 60 [54–65] years, 21 male) received a redo procedure at 36 [12–69] months after the index procedure. All patients had PV reconnected (average of 2.75). The number of reconnected PV (77/112, 69%) was driven by significantly more reconnected left (89%) and right (68%) superior PV. The reconnection rate was higher with HDG (54/72, 75%) compared to CMC (23/40, 58%) in a comparable patient population. HDG mapping identified more reconnection sites in the left inferior (61% vs 10%) and right superior (50% vs 20%) anterior vein segments.
Conclusion: After a median 3 years after the index PVI procedure no patients had no reconnected PV. Most reconnected veins were superior veins. HD Grid mapping revealed a higher rate of conduction gap in the redo PVI procedure if compared with CMC mapping.
Supporting Documents

FIGURE 1 Regional distribution of pulmonary vein reconnection. A comparison between high‐density mapping catheter (HDM) and circular mapping catheter (CMC).
OP‐038‐1‐AF (TRACK 6 ‐ AF 3)
Stroke risk stratification for atrial fibrillation: Evaluating left atrial appendage with fluid–structure interaction analysis
Zidun Wang
The First Affiliated Hospital with Nanjing Medical University, Nanjing, China
Objectives and Methods: The majority of cardioembolic strokes in patients with non‐valvular atrial fibrillation (NVAF) have resulted from clot formation in the left atrial appendage (LAA). Current stroke risk stratification is based on the overall risks estimated from demographic and clinical profiles but not on individual anatomy or physiology. We aim to explore the differences in LAA morphological and hemodynamic parameters by comparing patients with and without a stroke history.
Results: Thirty‐nine patients with persistent NVAF were included. Of these, 17 patients without a stroke history (non‐stroke group) were compared with 22 patients with a history of stroke (stroke group). Their LAA geometric models were first reconstructed, and the morphological parameters were then measured. Furthermore, their LAA hemodynamic parameters were calculated with fluid–structure interaction analysis. Moreover, particle residual rates (PRR) and blood renewal rates (BRR) analyses were employed to characterize the thrombogenesis dynamics. Compared to the non‐stroke group, the stroke group had significantly smaller LAA tortuosity and LAA orifice area. The hemodynamic analysis shows that the stroke group had significantly lower LAA orifice velocities (0.30 ± 0.13 vs 0.39 ± 0.14 cm/s; p = 0.044), but higher PRR (14.58 ± 9.43 vs 9.25 ± 4.67; p = 0.040) and BRR (52.41 ± 18.11 vs 38.36 ± 24.07; p = 0.044), than the non‐stroke group.
Conclusion: These LAA morphological and hemodynamic parameters may be used to assess stroke risk in patients with NVAF.
Supporting Documents

FIGURE 1 Fluid–structure model and boundary conditions in simulation.

FIGURE 2 Example of the difference in morphology (a), particle residence rate (PRR) (b), and blood renewal rate (BRR) (c).
OP‐039‐V‐AF
Atrial fibrillation registry in tertiary heart Centre in Malaysia
Mohammad Ihab Ismail 1; Nor Halwani Habizal1; Wardati Mazlan‐Kepli2; Abid Nordin3; Yee Yin Hoo1; Yeng Pooi Wong1; Sahimi Mohamed1; Abdul Raqib Abd Ghani1; Hartini Mohd Yusof1; Datuk Abdul Kahar Abdul Ghapar1; Dato' Asri Ranga Abdullah Ramaiah1; Kamaraj Selvaraj1; Abdul Muizz Abd Malek1; Nur Athirah Elias1
1 Serdang Hospital, Kajang, Malaysia; 2University of Malaya, Petaling Jaya, Malaysia; 3Universiti Kebangsaan Malaysia, Cheras, Malaysia
Objective: To study the demographic data of patients with atrial fibrillation (AF) in Serdang Hospital Malaysia (HSDG), assess their cardiovascular (CV), bleeding, and mortality outcomes in 1 year, and determine the associated factors.
Materials and Methods: This retrospective cohort study included patients aged ≥18 years and diagnosed with AF between 01/01/2018 and 31/12/2020. Patient's data were collected from electronic hospital records. CV events (acute coronary syndrome and stroke), bleeding events (major and minor bleeding), and overall mortality outcomes were assessed at 1‐year.
Results: In total, 1006 patients were included (59.2% male, median age 66.0 ± 15.0 years). Race distributions were primarily Malays (51.0%), followed by Chinese (41.3%) and Indian (7.1%). 95.3% of patients have at least one comorbidity, the commonest being hypertension (70.2%) followed by diabetes mellitus (DM)(39.8%) and ischaemic heart disease (IHD)(27.6%). The majority were on anticoagulants (83.7%), mostly warfarin (45.9%) and dabigatran (25.2%). Bisoprolol was the commonest rate‐control therapy (61.2%) followed by digoxin (10.2%). The median CHA2DS2‐VASc score was 3.00 ± 2.00 and the HAS‐BLED score was 1.00 ± 1.00. Occurrence of the CV, bleeding, and death events at 1 year were 11.6%, 7.1%, and 2.8%, respectively. IHD independently predicted CV outcomes (RR 3.8;95% CI, 1.3–11.1; p = 0.015). Associations with 1‐year mortality was seen in diabetics (RR 2.7;95% CI, 1.2–5.7; p = 0.014) and age‐group 65–74 years (RR 0.3.8;95% CI, 0.1–0.78; p = 0.015).
Conclusion: Among AF patients in HSDG, IHD was an independent predictor for CV events. At 1‐year follow‐up, patients with DM have a greater rate of death while the age group of 65–74 years has a better chance of survival.
OP‐040‐1‐AF (TRACK 6 ‐ AF 5)
Age does not impact AF recurrence or LV recovery following catheter ablation in AF‐mediated cardiomyopathy
Louise Segan 1,2,3; David Chieng1,2,3; Hariharan Sugumar1,2,3; Aleksandr Voskoboinik1,2,3,4; Han‐Liang Ling1,2,3; Andrew Taylor1,2; Shane Nanayakkara1,2; Ahmed Al‐Kaisey3,5; Joshua Hawson3,5; Manuja Premaratne6; Stephen Joseph4; Geoffrey Lee3,5; Ramanathan Parameswaran5,7; Benedict Costello1,2,4; Jonathan Kalman3,5; Peter Kistler1,2,3; Sandeep Prabhu1,2,3
1 Alfred Health, Prahran, Australia; 2Baker Heart and Diabetes Institute, Melbourne, Australia; 3University of Melbourne, Melbourne, Australia; 4Western Health, Melbourne, Australia; 5Royal Melbourne Hospital, Melbourne, Australia; 6Peninsula Health, Frankston, Australia; 7University Hospital Geelong, Geelong, Australia
Objectives: The absence of ventricular scar in patients with AF and systolic HF predicts left ventricular (LV) recovery following AF ablation. It is unknown whether age impacts the degree of LV recovery.
Materials and Methods: Consecutive patients undergoing catheter ablation (CA) between 2013–2021 with LVEF<45% and absence of LV fibrosis on baseline cardiac MRI (CMR) were stratified by age (<65 vs >65 years) and underwent repeat CMR at >6 months with rhythm monitoring using daily single‐lead ECGs.
Results: Sixty patients met inclusion criteria (11.7% female, mean LVEF 33 ± 9%) and 67% (n = 40) were < 65 years (53.5 ± 8 vs 70.3 ± 3 years in age > 65 group). Baseline comorbidities, left ventricular ejection fraction (LVEF 33 ± 9 vs 32 ± 9 > 65 years, p = 0.761), atrial and ventricular dimensions (LAVI 57 ± 21 vs 57 ± 15 ml/m2 age > 65, p = 0.994; LVEDVi 110 ± 41 vs 101 ± 25 ml/m2, p = 0.366), pharmacotherapy and ablation strategy (PVI in all; PWI in 30% vs 20% age > 65 cohort, p = 0.409; CTI 10% both groups) were comparable (all p > 0.05) albeit a higher CHADS2VASc score in the older cohort (2.8 ± 0.9 vs 1.6 ± 0.6 age < 65, p < 0.001).
Following 13 ± 12 months, there was no significant difference in LV recovery (ΔLVEF 21.7 ± 14% in younger vs 18.7 ± 17% in older,p = 0.466), symptoms (SF‐36 ΔPCS p = 0.483/ΔMCS, p = 0.841), NYHA class (p = 0.759), BNP (ΔBNP ‐179 ± 348 vs −170 ± 177 age > 65, p = 0.922), 6‐minute‐walk‐distance (Δ6MWD 49.8 ± 63 vs 101.7 ± 150.2 meters in age > 65, p = 0.064) and AF recurrence (32.5% vs 35% age > 65, p = 0.850; AF burden 6 ± 18% vs 5 ± 13%, p = 0.733).
Conclusion: In patients undergoing CA for AF with systolic HF in the absence of ventricular scar, comparable improvements in ventricular function, symptoms, and freedom from AF are achieved irrespective of age.
OP‐041‐1‐AF (TRACK 6 ‐ AF 5)
Clinical risk prediction for left atrial appendage thrombus among patients with atrial fibrillation
Louise Segan 1,2,3; Shane Nanayakkara1,2; Ella Spear4; Anita Shirwaiker1; David Chieng1,2,3; Hariharan Sugumar1,2,3; Han‐Liang Ling1,2,3; Sandeep Prabhu1,2,3; Geoffrey Lee3,5; Joseph Morton3,5; Jonathan Kalman3,5; Aleksandr Voskoboinik1,2,3; Peter Kistler1,2,3
1 Alfred Health, Prahran, Australia; 2Baker Heart and Diabetes Institute, Melbourne, Australia; 3University of Melbourne, Melbourne, Australia; 4Monash Health, Melbourne, Australia; 5Royal Melbourne Hospital, Melbourne, Australia
Objectives: Left atrial appendage thrombus (LAAT) risk factors in atrial fibrillation/flutter (AF/AFL) patients undergoing direct cardioversion (DCR) or catheter ablation (CA) remain poorly defined. We evaluated LAAT predictors in this population.
Materials and Methods: We evaluated available clinical and transthoracic echocardiographic (TTE) parameters in patients undergoing TOE prior to DCR or CA between 1999–2022 in our institution. Regression analysis identified LAAT predictors and a weighted risk score was developed in the derivation cohort (70%) and validated in the remaining (30%) test cohort.
Results: Of 627 patients (age 62 ± 12 years,27% female, AF 84%, AFL 16%, left ventricular ejection fraction (LVEF) 44 ± 20%), 24% had LAAT and 13.8% dense spontaneous echo contrast precluding DCR/CA. Anticoagulation was NOAC at 56.5%, warfarin at 32.1%, and none at 11.4%.
Diabetes (p = 0.004), prior stroke (p = 0.009), coronary disease (p = 0.015), renal impairment (p < 0.001) and CHADS2VASc >2 (73% vs. 55%, p < 0.001) were higher in the LAAT cohort. Age (p = 0.093), gender (p = 0.689), BMI (p = 0.828), anticoagulant type (p = 0.316), and diabetes (p = 0.107) were not univariate predictors, whereas anticoagulation duration (<30 days), creatinine and TTE markers of remodeling (LVEF, LAVI, RVSP, and TAPSE) were independent predictors on univariate and multivariate regression; CHADS2VASc was not significant after adjustment (p = 0.090).
The weighted risk model included continuous (age, creatinine, LVEF, LAVI, TAPSE, and RVSP) and categorical (anticoagulation duration) variables with excellent predictive performance: AUC 0.872 (95%CI 0.798–0.946), PPV 91%, NPV 70%, and accuracy 80%.
In the LAAT cohort, thrombus resolution occurred in 39% on serial TOE imaging with a median time to resolution of 131 days (IQR 54–398).
Conclusion: A novel LAAT risk model comprising non‐invasive clinical and echocardiographic parameters enhances risk prediction over CHADS2VASc in AF/AFL and may guide the need for pre‐procedural TOE imaging.
Supporting Documents

OP‐042‐1‐AF (TRACK 6 ‐ AF 5)
Shorter duration of anticoagulation is safe In low‐risk patients undergoing atrial fibrillation ablation with Cryoballoon
Sri Sundaram 1; David Bailey2; Layth Saleh2; Parth Makker2; Ganesh Venkataraman2
1 South Denver Cardiology, Littleton, United States; 2Colorado Heart and Vascular, Lakewood, USA
Objective: The duration of anticoagulation (OAC) after atrial fibrillation (AF) ablation remains unclear. Current guidelines recommend 2 months of OAC after AF ablation, even among low‐risk patients. AF ablation with Cryoballoon (CB) may cause less endothelial damage compared with radiofrequency and thus may require a shorter duration of anticoagulation. We evaluated the safety of a shorter duration (1 month) of OAC after AF ablation with CB in a low‐risk subset of male patients with a CHA2DS2‐VASc score of 0 and female patients with a CHA2DS2‐VASc score of 1.
Methods: This was a multi‐center prospective observational study. Twenty‐seven consecutive patients with CHA2DS2‐VASc score of 0 (male) and 1 (female) undergoing AF ablation with CB were treated with 1 month of OAC, followed by aspirin 81 mg. Baseline neurologic function was assessed pre‐procedure, and at 1, 3, and 6 months post‐procedure. Complications, including transient ischemic attacks and strokes, were recorded.
Results: Mean age and BMI were 52.0 +/− 8.7 years and 28.2 +/− 4.9 kg/m2, respectively. Four patients (15%) were female with a CHA2DS2‐VASc score 1. Mean LVEF and LA volume index were 58 +/− 6% and 26.7 +/− 7.3 ml/m2, respectively. OAC was discontinued at 1 month in all 27 patients. At 1, 3, and 6 months follow‐up, there were no clinical neurological events noted.
Conclusion: A shorter duration (1 month) of oral anticoagulation may be safe in a low‐risk subset of patients with CHA2DS2‐VASc score 0 (male) or 1 (female) undergoing AF ablation with CB. Future studies are warranted to confirm this finding.
OP‐043‐1‐AF (TRACK 6 ‐ AF 5)
Role of heart rate variability in predicting new‐onset atrial fibrillation after coronary artery bypass graft
Son Pham Truong1; Thanh Ngo Van2; Hinh Nguyen Van 1
1 108 Military Central Hospital, Hanoi, Vietnam; 2Hanoi Heart Hospital, Hanoi, Vietnam
Objectives: To investigate the association between heart rate variability (HRV) and new‐onset atrial fibrillation (AF) in patients undergoing coronary artery bypass graft (CABG) during a 6‐month follow‐up.
Materials and Methods: This cross‐sectional study involved 119 consecutive patients undergoing off‐pump CABG. All patients were assessed with 24‐hour Holter recordings 2 days before CABG and 1 week, 3 months, and 6 months postoperatively. HRV was analyzed, and AF was detected from its recordings.
Results: In patients undergoing CABG, New York Heart Association ≥ III increased the AF rate at 7 days, and advanced age and diabetes were associated with AF at 6 months postoperatively. A reduction in time‐domain measurements before surgery was significantly associated with a higher risk of developing AF at 7 days postoperatively, no association between preoperative HRV and AF was found at 6 months. Reduced preoperative HRV (SDNN <50 ms) was the independent predictor of AF at 3 months (AUC = 0.65) and 6 months (AUC = 0.62) following surgery.
Conclusion: A reduction in time domain before CABG was associated with a higher risk of new‐onset AF at 7 days postoperatively but not at 6 months. SDNN <50 ms was an independent predictor of a higher incidence of AF at 3 and 6 months after surgery.
Supporting Documents
TABLE 1 Univariate variables comparisons between patients with and without postoperative AF during follow‐up
| Timing variables | AF at 7 days | AF at 3 months | AF at 6 months | |||||||
|---|---|---|---|---|---|---|---|---|---|---|
| Yes (n = 16) | No (n = 101) | p | Yes (n = 16) | No (n = 100) | p | Yes (n = 20) | No (n = 96) | p | ||
| Age | 65.94 ± 10.45 | 64.62 ± 6.77 | > 0.05 | 67.50 ± 8.53 | 64.27 ± 7.04 | > 0.05 |
68.35 ± 7.10 |
63.96 ± 7.15 |
<0.05* | |
| BMI | 23.41 ± 3.23 | 22.94 ± 2.83 | >0.05 | 23.63 ± 3.21 | 22.90 ± 2.84 | > 0.05 |
23.49 ± 2.68 |
22.90 ± 2.93 |
>0.05 | |
| eGFR | 67.88 ± 22.40 | 63.30 ± 18.82 | > 0.05 | 64.19 ± 28.40 | 64.34 ± 17.11 | > 0.05 | 57.85 ± 16.53 |
65.67 ± 19.16 |
>0.05 | |
| Sex | Male | 13 (13.4) | 84 (86.6) | >0.05 | 13 (13.4) | 84 (86.6) | > 0.05 | 18 (18.6) | 79 (81.4) | > 0.05 |
| Female | 3 (15.0) | 17 (85.0) | 3 (15.8) | 16 (84.2) | 2 (10.5) | 17 (89.5) | ||||
| Diabetes | Yes | 3 (7.7) | 36 (92.3) | >0.05 | 4 (10.5) | 34 (89.5) | > 0.05 | 2 (5.3) | 36 (94.7) | <0.05* |
| No | 13 (16.7) | 65 (83.3) | 12 (15.4) | 66 (84.6) | 18 (23.1) | 60 (76.9) | ||||
| Smoking | Yes | 8 (14.8) | 46 (85.2) | >0.05 | 7 (13.0) | 47 (87) | > 0.05 | 7 (13.0) | 47 (87.0) | > 0.05 |
| No | 8 (12.7) | 55 (87.3) | 9 (14.5) | 53 (85.5) | 13 (21.0) | 49 (79.0) | ||||
| Hypertension | Yes | 14 (14) | 87 (86.1) | > 0.05 | 14 (14.0) | 86 (86) | >0.05 | 19 (19.0) | 81 (81.0) | >0.05 |
| No | 2 (12.5) | 14 (87.5) | 2 (12.5) | 14 (87.5) | 1 (6.2) | 15 (93.8) | ||||
| PAD | Yes | 3 (21.4) | 11 (78.6) | > 0.05 | 2 (14.3) | 12 (85.7) | >0.05 | 3 (21.4) | 11 (78.6) | >0.05 |
| No | 13 (12.6) | 90 (87.4) | 14 (13.7) | 88 (86.3) | 17 (16.7) | 85 (83.3) | ||||
| Previous MI | Yes | 0 (0.0) | 10 (100) | >0.05 | 1 (10.0) | 9 (90) | > 0.05 | 2 (20.0) | 8 (80.0) | > 0.05 |
| No | 16 (15.0) | 91 (85.0) | 15 (14.2) | 91 (85.8) | 18 (17.0) | 88 (83.0) | ||||
| NYHA (≥ 3) | Yes | 3 (42.9) | 4 (57.1) | <0.05* | 3 (42.9) | 4 (57.1) | >0.05 | 1 (14.3) | 6 (85.7) | >0.05 |
| No | 12 (11.0) | 97 (89.0) | 13 (11.9) | 96 (88.1) | 19 (17.4) | 90 (82.6) | ||||
| Chronic kidney failure ≥ stage 4 | Yes | 6 (10.7) | 50 (89.3) | > 0.05 | 9 (16.4) | 46 (83.6) | >0.05 | 12 (21.8) | 43 (78.2) | > 0.05 |
| No | 10 (16.4) | 51 (83.6) | 7 (11.5) | 54 (88.5) | 8 (13.1) | 53 (86.9) | ||||
| Euro score ≥3% | Yes | 2 (28.6) | 5 (71.4) | >0.05 | 4 (57.1) | 3 (42.9) | >0.05 | 3 (42.9) | 4 (57.1) | >0.05 |
| No | 14 (12.7) | 96 (87.3) | 12 (11.0) | 97 (89.0) | 17 (15.6) | 92 (84.4) | ||||
| Preoperative EF | 66.75 ± 8.31 | 63.38 ± 12.05 | >0.05 | 65.56 ± 10.56 | 63.6 ± 11.88 | > 0.05 |
65.2 ± 9.53 |
63.59 ± 12.11 | >0.05 | |
| CPB duration (min) |
93.15 ± 29.55 |
94.05 ± 26.25 | >0.05 | 95.25 ± 29.05 | 94.0 ± 26.15 | >0.05 | 94.25 ± 27.35 |
94.05 ± 26.5 |
>0.05 | |
| Aortic clamp time (min) |
72.05 ± 24.50 |
74.05 ± 23.45 | > 0.05 | 73.05 ± 25.50 | 74.05 ± 23.95 | >0.05 | 73.05 ± 24.10 | 74.05 ± 23.15 | >0.05 | |
Entries are means±SD or numbers of patients. p‐values are nominal. AF = atrial fibrillation, BMI = body mass index, GFR: Glomerular Filtration Rate, NYHA: New York Heart Association, PAD: Peripheral artery disease, MI: Myocardial infarction, CPB: Cardiopulmonary bypass. *: Statistically significant difference.
TABLE 2 Results of preoperative HRV analysis in patients with and without postoperative AF during the follow‐up
| Timing preoperative HRV | AF at 7 days postoperatively | p | AF at 3 months postoperatively | p | AF at 6 months postoperatively | p | |||
|---|---|---|---|---|---|---|---|---|---|
| Yes (n = 16) | No (n = 101) | Yes (n = 16) | No (n = 100) | Yes (n = 20) | No (n = 96) | ||||
|
ASDNN (ms) |
38.44 ± 25.24 | 46.27 ± 18.97 | >0.05 | 40.44 ± 30.12 | 46.27 ± 17.79 | >0.05 | 41.75 ± 25.80 | 46.24 ± 18.47 | >0.05 |
|
rMSSD (ms2) |
19.63 ± 8.14 | 28.02 ± 12.30 | <0.05* | 24.25 ± 12.35 | 27.47 ± 12.04 | >0.05 | 23.30 ± 11.43 | 27.80 ± 12.13 | >0.05 |
|
pNN 50 (%) |
3.23 ± 3.30 | 7.48 ± 7.57 | <0.05* | 5.88 ± 6.55 | 7.13 ± 7.40 | >0.05 | 4.58 ± 5.44 | 7. ± 7.53 | >0.05 |
|
SDNN (ms) |
85.94 ± 40.95 | 104.50 ± 32.06 | <0.05* | 85.13 ± 45.23 | 105.23 ± 30.66 | >0.05 | 91.50 ± 42.81 | 104.74 ± 31.05 | >0.05 |
|
SDANN (ms) |
74.00 ± 34.02 | 90.69 ± 31.02 | >0.05 | 73.31 ± 36.57 | 91.29 ± 30.28 | <0.05* | 81.25 ± 39.12 | 90.38 ± 29.88 | >0.05 |
|
VLF (ms2) |
23.37 ± 19.32 | 25.74 ± 10.76 | >0.05 | 23.26 ± 21.63 | 25.93 ± 9.96 | >0.05 | 23.92 ± 18.23 | 25.90 ± 10.55 | >0.05 |
|
LF (ms2) |
15.43 ± 19.53 | 16.55 ± 10.94 | >0.05 | 15.19 ± 19.77 | 16.73 ± 10.83 | >0.05 | 16.24 ± 17.48 | 16.58 ± 11.10 | >0.05 |
|
HF (ms2) |
9.42 ± 8.74 | 11.75 ± 6.95 | >0.05 | 10.62 ± 9.15 | 11.65 ± 6.89 | >0.05 | 10.49 ± 8.40 | 11.72 ± 6.96 | >0.05 |
| LF/HF | 1.45 ± 0.55 | 1.44 ± 0.37 | >0.05 | 1.30 ± 0.51 | 1.47 ± 0.37 | >0.05 | 1.48 ± 0.53 | 1.44 ± 0.36 | >0.05 |
Entries are means±SD, p‐values are nominal. Student's unequal variance unpaired t‐tests were used. *Statistically significant difference.
TABLE 3 Results of reduced pre‐operative HRV analysis in patients with and without postoperative AF during the follow‐up
| Timing reduced pre‐operative HRV | 7 days after operation | p (CI) | 3 months after operation | p (CI) | 6 months after operation | p (CI) | ||||
|---|---|---|---|---|---|---|---|---|---|---|
| AF (+) (n = 16) | AF (−) (n = 101) | AF (+) (n = 16) | AF (−) (n = 100) | AF (+) (n = 20) | AF (−) (n = 96) | |||||
|
ASDNN (n,%) |
< 30 ms |
5 (22.70) |
17 (77.30) |
> 0.05 (0.69–7.29) |
8 (38.10) | 13 (61.90) |
<0.05* (2.14 – 20.92) |
7 (33.30) | 14 (66.70) |
< 0.05* (1.0–9.28) |
| ≥ 30 ms |
11 (11.60) |
84 (88.40) |
8 (8.40) | 87 (91.60) | 13 (13.70) | 82 (86.30) | ||||
|
rMSSD (n,%) |
< 15 ms |
7 (41.20) |
10 (58.80) |
<0.05* (2.16–23.12) |
5 (31.20) | 11 (68.80) |
<0.05* (1.07–12.56) |
4 (25.00) | 12 (75.00) |
>0.05 (0.50–6.11) |
| ≥ 15 ms |
9 (9.00) |
91 (91.00) |
11 (11.00) | 89 (89.00) | 16 (16.00) | 84 (84.00) | ||||
|
pNN 50 (n,%) |
< 0.75% | 7 (28.00) | 18 (72.00) |
<0.05* (1.18–10.89) |
5 (20.80) | 19 (79.20) |
> 0.05 0.60–6.23 |
6 (25.00) | 18 (75.00) |
>0.05 (0.62–5.49) |
| ≥ 0.75% |
9 (9.80) |
83 (90.2) | 11 (12.00) | 81 (88.00) | 14 (15.20) | 78 (84.80) | ||||
|
SDNN (n,%) |
< 50 ms | 4 (44.40) | 5 (55.60) |
<0.05* (1.50–27.15) |
6 (75.00) | 2 (25.00) |
< 0.01* (5.22 – 16.4) |
4 (50.00) | 4 (50.00) |
< 0.05* (1.30–25.36) |
| ≥ 50 ms | 12 (11.1) | 96 (88.9) | 10 (9.30) | 98 (90.70) | 16 (14.80) | 92 (85.20) | ||||
|
SDNN (n,%) |
≥ 93 ms | 11 (20.8) | 42 (79.2) |
<0.05* (1.0–9.56) |
10 (19.2) | 42 (80.8) |
>0.05 (0.77–6.82) |
12 (23.1) | 40 (76.9) |
>0.05 (0.78–5.60) |
| < 93 ms |
5 (7.8) |
59 (92.2) |
6 (9.4) |
58 (90.6) |
8 (12.5) |
56 (87.5) | ||||
|
SDANN (n,%) |
< 40 ms | 3 (60.00) | 2 (40.00) |
<0.05* (1.74–74.88) |
2 (40.00) | 3 (60.00) |
>0.05 (0.70–30.11) |
2 (40.00) | 3 (60.00) |
>0.05 (0.53–2210) |
| ≥ 40 ms | 13 (11.60) | 99 (88.40) | 14 (12.60) | 97 (87.40) | 18 (16.20) | 93 (83.80) | ||||
Entries are numbers of patients. p‐values are nominal. CI: confidence of interval. The cut‐off for each index of reduced HRV time domain as recommended. * Statistically significant difference.
TABLE 4 Hazard Ratios for Association Between Variables and Postoperative Atrial Fibrillation
| Timing reduced HRV | RR | p (CI) | RR | p (CI) | RR | p (CI) |
|---|---|---|---|---|---|---|
| At 7 days | At 3 months | At 6 months | ||||
| SDNN ≤ 50 ms | 3.502 |
>0.05 (0.708–17.322) |
30.882 |
< 0.001 * (4.503–211.777) |
5.404 |
<0.05 * (1.078–27.087) |
| rMSSD ≤ 15 ms | 3.444 |
>0.05 (0.987–12.015) |
0.906 |
> 0.05 (0.170–4.835) |
1.138 |
> 0.05 (0.304–4.259) |
Multivariate was used to find the predictor of postoperative AF, CI: CI: confidence of interval. * Statistically significant difference.
TABLE 5 Results of HRV analysis at 7 days post‐surgery in patients with and without postoperative AF during the follow‐up
| Timing HRV at 7 days postoperatively | AF at 3 months | AF at 6 months | ||||
|---|---|---|---|---|---|---|
| Yes (n = 12) | No (n = 97) | p | Yes (n = 16) | No (n = 93) | p | |
| ASDNN (ms) | 29.75 ± 19.32 | 35.34 ± 21.49 | > 0.05 | 35.56 ± 23.48 | 34.58 ± 20.97 | > 0.05 |
| rMSSD (ms2) | 19.92 ± 7.93 | 22.40 ± 13.37 | > 0.05 | 24.56 ± 15.92 | 21.71 ± 12.34 | > 0.05 |
| pNN 50 (%) | 3.08 ± 3.49 | 5.16 ± 9.25 | > 0.05 | 7.07 ± 10.06 | 4.56 ± 8.60 | > 0.05 |
| SDNN (ms) | 66.17 ± 38.97 | 78.48 ± 34.27 | > 0.05 | 80.75 ± 39.22 | 76.51 ± 34.22 | > 0.05 |
| SDANN (ms) | 58.08 ± 35.49 | 65.42 ± 28.63 | >0.05 | 68.81 ± 33.84 | 63.89 ± 28.67 | >0.05 |
| VLF (ms2) | 15.66 ± 12.17 | 18.81 ± 11.80 | > 0.05 | 17.69 ± 13.29 | 18.60 ± 11.63 | > 0.05 |
| LF (ms2) | 10.45 ± 9.11 | 13.37 ± 12.25 | >0.05 | 11.82 ± 10.84 | 13.26 ± 12.17 | >0.05 |
| HF (ms2) | 7.06 ± 3.69 | 8.98 ± 6.43 | > 0.05 | 9.14 ± 8.24 | 8.71 ± 5.84 | > 0.05 |
| LF/HF | 1.40 ± 0.86 | 1.50 ± 0.60 | >0.05 | 1.41 ± 0.74 | 1.50 ± 0.61 | >0.05 |
Entries are means±SD, p‐values are nominal. Student's unequal variance unpaired t‐tests were used. *Statistically significant difference.
FIGURE 1 New onset AF rate during the follow‐up.


FIGURE 2 ROC curves for predicting atrial fibrillation at 3 months (A) and 6 months (B) postoperatively. ROC: Receiver operator characteristic; AUC: area under curve; CI: confidence interval.
OP‐044‐1‐AF (TRACK 6 ‐ AF 5)
Prognostic implication and the effect of catheter ablation between the type of atrial fibrillation
Hiroshi Miyama; Seiji Takatsuki; Koki Yamaoka; Shuhei Yamashita; Susumu Ibe; Yuta Seki; Kenji Hashimoto; Terumasa Yamashita; Yoshinori Katsumata; Takehiro Kimura; Shun Kohsaka; Keiichi Fukuda
Keio University Hospital Department of Cardiology, Tokyo, Japan
Objectives: Little is known about the prognostic implication and the efficacy of catheter ablation (CA) by the type of atrial fibrillation (AF).
Methods: We analyzed data from a multicenter registry‐based cohort study of patients with AF. Patients were categorized as paroxysmal AF (PAF) or persistent AF (PersAF) according to the duration of AF (lasting less, or more than 1 week, respectively). The composite of all‐cause death, heart failure hospitalization, stroke, and bleeding events during two‐year follow‐up was compared between the groups. Additionally, propensity score (PS)‐matching analysis was performed for each type of AF to compare the clinical outcomes between those who underwent CA or medication alone.
Results: Among 2788 patients (median age; 69 years, male; 68.4%), there were 1439 (51.6%) and 1349 (48.4%) PAF and PersAF patients, respectively. The incidence of primary outcome was higher in patients with PersAF than in those with PAF (12.8% vs. 7.2%, p < 0.001). After adjustments, PersAF was an independent predictor of adverse outcomes (adjusted HR 1.35, 95%CI 1.30–1.78, p = 0.031). PS‐matching analysis showed significantly fewer events in the CA group compared with the medication group among those with PAF (HR 0.32, 95% CI 0.17–0.61, p < 0.001). A similar trend was observed in patients with PersAF, although it did not reach statistical significance (HR 0.65, 95% CI 0.36–1.17, p = 0.15).
Conclusion: PersAF was a strong and independent risk factor for adverse clinical outcomes. CA improved the prognosis of patients with PAF, and also suggested the potential for positive effects toward those with PersAF.
OP‐045‐1‐AF (TRACK 6 ‐ AF 5)
More effort might require to complete isolated lesions in paroxysmal atrial fibrillation than in non‐paroxysmal
Shun Kikuchi; Kazuo Kato; Hiroki Yabuta; Makito Kaneshiro; Yukihiro Uehara; Shin Hasegawa; Nobuo Ishiguro; Akimitsu Tanaka; Miyuki Ando; Hidekazu Aoyama; Hiroko Gotoh; Ryosuke Kametani
Nagoya Tokushukai General Hospital, Kasugai, Japan
Objective: Left atrial diameter (LAd) is one of the simple parameters that can be obtained in virtually all atrial fibrillation (AF) patients. LAd is often larger in chronic atrial fibrillation (CAF) than in paroxysmal atrial fibrillation (PAF), so we should perform PAF ablation more easily than persistent AF (PeAF) and CAF. However, we sometimes have difficulty ablating PAF more than PeAF and CAF.
Materials and Methods: We divided into three groups depending on the AF severity and investigated the following parameters stated in the table in 400 patients (PAF: 160, PeAF: 128, CAF: 112) to whom we could perform the first pass Box PVI.
Results: In the univariate analyses in AF of different severity, there were significant differences in several parameters, including the LAd. On the contrary, in the multivariate analyses, only TnI on the next day after the ablation and the LAd showed significant differences. In the group of PAF, the LAD was the smallest, and the TnI on the next day after the ablation was the largest. In contrast, in the group of CAF, the LAd was the largest but the TnI on the next day after the ablation was the smallest.
Conclusion: These results suggested that the atrial myocardium in PAF may require more ablation energy to complete first pass Box PVI than in CAF and PeAF.
Supporting Documents

OP‐046‐1‐AF (TRACK 6 ‐ AF 7)
Using computed tomogram atrial myocardial thickness maps in high‐power short‐duration radiofrequency pulmonary vein isolation
Taehyun Hwang; Oh Seok Kwon; Song‐Yi Yang; Daehoon Kim; Hee Tae Yu; Tae‐Hoon Kim; Jae‐Sun Uhm; Boyoung Joung; Moon‐Hyoung Lee; Hui‐Nam Pak
Yonsei University Health System, Seoul, Republic of Korea, Seoul, South Korea
Introduction: Catheter ablation is the most effective rhythm control strategy for patients with atrial fibrillation (AF), but continuous long‐term recurrence is common after the procedure. Pulmonary vein (PV) isolation (PVI) is the cornerstone of AF catheter ablation (AFCA), and PV reconnection is one of the most common mechanisms of AF recurrence after the procedure. PVI durability could be affected by various factors such as the type of catheter, energy source, radiofrequency (RF) power, duration of energy delivery, contact force, and the stability of catheter or objective physical parameters including ablation index or lesion index. In addition, patient‐specific atrial wall thickness (WT) may be a factor that must be considered for appropriate transmural lesion generation. The consideration of atrial WT is important in terms of evaluating the safety as well as efficacy and durability of PVI. The risk of procedure‐related complications, including hemopericardium, increases in elderly ladies and patients with malnutrition with relatively thinner PV antrums than healthy young males. Recently, higher‐power short‐duration (HPSD) RF‐PVI has been widely used, and plenty of studies evaluating its efficacy and safety comparative are emerging.
Therefore, we explored the efficacy and safety of PV antral WT‐guided HPSD RF‐PVI by titrating the duration of 60 W energy delivery to each point. Based on our previous studies and experience, 15 seconds of 60 W HPSD using FlexAbility was considered the control treatment. We compared the control treatment with the WT‐guided ablation, which reduces RF delivery time in the thin LAWT areas, in this prospective single‐center randomized clinical trial. We measured and utilized LAWT using automated customized software (AMBER, LaonMed, Korea) in real‐time during AFCA procedures.
Methods: Study population and randomization
The study protocol adhered to the Declaration of Helsinki and was approved by the institutional review board of Yonsei University. Written informed consent was obtained from all participants before the study began (ClinicalTrials.gov; NCT03912324). The study cohort initially included 200 patients with PAF (70.0% males, 59.6 ± 11.8‐years‐of‐age) who underwent AFCA for symptomatic and drug‐refractory non‐valvular AF. The exclusion criteria were as follows: (1) persistent or permanent AF, (2) AF with severe cardiac malformation or structural heart disease, (3) severe renal impairment or CT imaging difficulty using contrast media, (4) a history of AF ablation or cardiac surgery, and (5) valvular AF (mitral stenosis >grade 2, mechanical valve, and mitral valvuloplasty).
Before all ablation procedures, we defined the anatomy of the LAs and PVs using three‐dimensional (3D) computed tomography (CT) scans (64‐channel, light speed volume CT, Philips, Brilliance 63, Amsterdam, Netherlands). All patients discontinued all anti‐arrhythmic drugs (AADs) for at least five half‐lives, and amiodarone was stopped more than 1 month before the procedure. This study was performed under a prospective single‐center randomized clinical study protocol. We conducted randomization using computer‐generated random permutation sequences to avoid any potential bias. The patients were blinded to the initial allocation, and the rhythm outcomes were determined by the research coordinators based on Holter and electrocardiogram (ECG) monitoring. Except for three patients whose follow‐up duration was less than 3 months, of the 197 enrolled patients, 104 and 93 were assigned to the WT‐guided PVI (WT group) and conventional PVI (Control group) groups, respectively (Figure 1).
Preparing left atrial wall thickness maps using CT
We used the previously developed automated customized software (AMBER, LaonMed, Korea) to measure myocardial thickness from cardiac CT images. This software has been validated with 3D‐printed LA phantom models, over 120 AF patients, and through 12 other previously published studies. The day before the procedure, experienced investigators measured a 3D LAWT map from CT images of the patient acquired before the ablation procedure and then delivered it to the clinical procedure team (taking approximately 20 min per patient). As a summary of AMBER software, obtaining myocardial wall thickness consists of three steps. First, we divided the boundaries of the myocardium with thresholds of cardiac tissues obtained from CT histograms and guidelines drawn by investigators. Next, we extracted the myocardial wall based on the morphological and intersection operations. In the third stage, we calculated the WT of the streamlines connecting the endo‐ and epicardium by applying Laplace's equation and Euler's method. This approach is reported as a robust method for WT measurement because it considers both endo‐ and epicardial surfaces despite the complex morphology of the atria.
Electrophysiological mapping and AF catheter ablation
Intracardiac electrograms were recorded using the Prucka CardioLab™ Electrophysiology system (General Electric Medical Systems, Inc., Milwaukee, WI, USA). After the transseptal puncture, multi‐view pulmonary venograms were obtained. Details of the AFCA technique and strategy have been reported in our previous studies. Systemic anticoagulation was performed using intravenous heparin to maintain an activated clotting time of 350–400 seconds during the procedure. The esophageal temperature was monitored in all patients, and the luminal esophageal cut‐off temperature was 38.4C for AFCA.
The AFCA was performed using a 3D electro‐anatomical mapping system (NavX; St. Jude Medical, USA.) merged with 3D spiral CT. In the WT group, we merged the spatiotemporal information of each electrogram with a previously analyzed LAWT map (merging time, 15 min). In both groups, we used a FlexAbility catheter (St. Jude Medical, Inc., Minnetonka, MN) without contact force monitoring. In the Control group, we delivered 60 W (for a target temperature of 45°C) to the anterior part of the LA and a constant 50 W RF to the posterior part of the LA for 15 seconds. However, in the WT group, we used the same catheter but delivered RF for 15 s at each point with LAWT>2.1 mm, 13 s at points with LAWT around 1.4–2.1 mm, and 11 s at areas with LAWT <1.4 mm. Cavotricuspid isthmus ablation and SVC‐RA isolation were carried out in the majority of patients in both groups.
Ablation endpoint and repeat ablation
After the completion of the protocol‐based ablation, we conducted an isoproterenol provocation test to induce extra‐PV triggers in both groups. We observed extra‐PV foci within 10 min after cardioversion with an isoproterenol infusion (5–10 μg/min depending on the ß‐blocker use with a target sinus heart rate of 120 bpm). After careful mapping, any extra‐PV triggers were ablated as much as possible.
Post‐ablation management and follow‐up
We tried to discharge all patients without AADs except for those who had recurrent extra‐PV triggers after the AFCA procedure, symptomatic frequent atrial premature beats, non‐sustained atrial tachycardia (AT), or early AF recurrence on telemetry during the admission period. Patients visited the outpatient clinic regularly at 1, 3, 6, and 12 months postoperatively and then every 6 months thereafter or whenever symptoms occurred after the AFCA. All patients underwent ECGs during every visit and 24‐h Holter recordings at 3 and 6 months postoperatively and then every 6 months thereafter according to the 2012 HRS/EHRA/ECAS Expert Consensus Statement guidelines. Holter monitoring or event monitor recordings were obtained when the patients reported symptoms of palpitations suggestive of an arrhythmia recurrence. Holter analysis and adjudication were performed by an individual blinded to the study group assignments. AF recurrence was defined as any episode of AF or AT lasting at least 30 seconds. Any ECG documentation of AF recurrence within a 3‐month blanking period was diagnosed as early recurrence, while any AF recurrence that took place more than 3 months after the procedure was diagnosed as a clinical recurrence. The primary study endpoint was freedom from documented episodes of AF or AT lasting longer than 30 seconds and occurring after a 3‐month blanking period following a single ablation procedure. The secondary endpoints were the peri‐procedural complication rate and the response to AADs or the electrical cardioversion rates after post‐procedural recurrences.
Data analysis
The sample size was estimated from the recurrence rate derived from our previous AF ablation data. The AF recurrence rates were presumed to be 20% in the WT group and 40% in the control group. An overall sample size of more than 162 was expected to have an 80% power to detect a statistical difference between the two groups at a two‐sided alpha of 0.05. We performed all statistical analyses using R version 3.6.0 (R Foundation for Statistical Computing, Boston, Massachusetts, United States).
Application
Patient characteristics
Table 1 summarizes the baseline clinical characteristics of the WT group (n = 104) and the Control group (n = 93). Both ablation groups were well‐balanced in terms of baseline demographics. The mean age of the participants was 59.8 ± 11.7 years, and 138 patients (70.1%) were men. The mean CHA2DS2‐VASc score was 1.5 ± 1.3. Of the 197 study participants, 15.2% (30) had a history of heart failure, 29.9% (59) had hypertension, and 15.2% (30) had diabetes mellitus. We found no significant difference in the comorbidities between the two groups (p = NS). The mean LA dimension was 38.4 ± 5.8 mm, and the mean LAVI was 34.8 ± 9.7 ml/m2. We found no significant difference in the echocardiographic parameters between the two groups (p = NS).
Procedural characteristics
We summarized the procedural results and clinical outcomes in Tables 2 and 3. There was no significant difference in the total procedure time (102.5 ± 15.7 vs. 104.4 ± 23.8 min; p = 0.517) or the total ablation time (1858.8 ± 293.5 vs. 1857.5 ± 393.2 s; p = 0.980). The first‐pass PVI rate did not differ between the two groups (49.5% in the WT group vs. 57.1% in the C group, p = 0.358). Post‐PVI isoproterenol provoked extra‐PV triggers in both groups (8.7% in the WT group vs. 12.8% in the Control group; p = 0.494), and the locations of the extra‐PV triggers are summarized in Table 2.
Primary outcome
During the mean 9.7 ± 4.8 months of follow‐up, neither the early recurrence rate within 3 months of the AFCA (21.4% vs. 12.8%; p = 0.160) nor the clinical recurrence rate (9.7% vs. 6.4%; p = 0.554) significantly differed between the WT and Control groups. (Table 3). A Kaplan–Meier analysis revealed no significant difference in the overall AF recurrence (log‐rank; p = 0.326; Figure 3A), or AAD‐free AF recurrence (excluding patients treated with an AAD at the 3rd month from the AFCA) (log‐rank; p = 0.866; Figure 3B) between the two groups. Upon a multivariate Cox regression analysis, the LVMI (HR: 1.03 [1.00–1.05], p = 0.032) and the presence of extra‐PV trigger (HR: 8.29 [2.27–30.33], p = 0.001) were independently associated with the clinical recurrence of AF, but the WT‐guided ablation was not (Table 4). The major complication rates did not significantly differ between the two groups (6.8% vs. 4.3%; p = 0.642).
Secondary outcome
The AAD prescription rates did not differ between the two groups at discharge (17.5% vs. 14.9%; p = 0.766), at 3 months after the procedure (28.2% vs. 19.1%; p = 0.189), nor the final follow‐up (22.3% vs. 14.9%; p = 0.249, Table 3). Finally, the freedom rates from documented AF after the cessation of AADs were 67.0% and 76.6% in the WT and Control groups, respectively (p = 0.182). Of 16 patients with clinical recurrence, AF recurred in 14 patients, and AT recurred in two patients (Table 3). Among the patients with clinical recurrence, the proportion of AT (10% [1/10] vs. 16.7% [1/6]; p = NS) and the cardioversion rate (10% [1/10] vs. 0% [0/6]; p = NS) did not differ between the WT and Control groups.
Future
Durable PVI is the cornerstone of ablation procedures to prevent atrial arrhythmias and AF recurrence. In our study, we first evaluated the efficacy and safety of WT‐guided PVI using HPSD ablation. However, WT‐guided energy titration did not affect the clinical outcomes of HPSD‐PVI. There are several potential explanations for this result. First, we designed this study using homogenous 15 seconds ablation for the Control group and downward RF energy titration in the WT group to focus on the evaluation of safety. Second, the superficial confluent lesion formation by the current HPSD ablation protocol may create transmural lesions and overcome the limitation of WT. Third, there is a possibility that the HPSD 15 s ablation energy was excessive for PV‐LA transmural lesion formation. The cardiac tamponade rate was slightly higher in this study than in previous studies. Therefore, it is important to find an optimal RF titer for durable PVI satisfying both safety and effectiveness.
Supporting Documents


OP‐047‐1‐AF (TRACK 6 ‐ AF 7)
Early prediction of paroxysmal atrial fibrillation through an artificial intelligence (AI) prediction algorithm
Yeji Kim 1; Gihun Joo2; Bo‐Kyung Jeon1; Dong‐Hyeok Kim1; Moo‐Nyun Jin1; Hyeonseung Im2; Junbeom Park1
1 Ewha Womans University Medical Center, Seoul, South Korea; 2Kangwon National University, Chuncheon‐si, South Korea
Objective: This study aims to develop a precise predictive AI model for screening PAF using normal sinus rhythm (NSR) ECG within 1 month.
Materials and Methods: This retrograde cohort study included patients with age between 18 and 99 with NSR ECG on 12 lead standard ECG (10 seconds) in Ewha Womans University Medical Center between May 23, 2017 and Sep 2, 2020. The data were preprocessed into three window periods (which were defined with the duration from NSR to PAF detection)—1 week, 2 weeks, and 4 weeks from the AF detection prospectively. For the experiment, we adopted the residual neural network based on 1D‐CNN proposed in [1]. Our model consists of four layers with skip connections.
Results: We used 7595 NSR ECGs with window periods of 1 week, 2 weeks, and 4 weeks for analysis; 5488, 6555, and 7595 ECGs, respectively. The algorithm was verified by internal validation using test data and it showed an AUC of 0.812 and an accuracy of 0.75 (F1‐score of 0.74) in the 1:1 matched group of 1 week window period. For the 1:1 matched group of 2 weeks window period, it showed an AUC of 0.813 and an accuracy of 0.75 (F1‐score of 0.74). Finally, for the 1:1 matched group of 4 weeks window period, it showed an AUC of 0.803 and accuracy of 0.74 (F1‐score of 0.74).
Conclusion: The AI‐prediction algorithm showed the possibility of risk stratification for early detection of PAF. Unlike previous ones, this study showed that a short window period is also sufficient to detect PAF.
[1] Nature communications 11.1 (2020): 1–9.
Supporting Documents

OP‐048‐1‐AF (TRACK 6 ‐ AF 7)
High power strategy at sites adjacent to the esophagus during laser balloon‐based pulmonary vein isolation
Haruta Kato; Yoshihisa Naruse; Yutaro Kaneko; Taro Narumi; Makoto Sano; Tsuyoshi Urushida; Yuichiro Maekawa
Division of Cardiology, Internal Medicine Iii, Hamamatsu University School Of Medicine, Hamamatsu‐shi, Japan
Objectives: Laser balloon‐based pulmonary vein isolation is an established therapeutic option in patients with atrial fibrillation. However, suddenly elevated esophageal temperature is sometimes problematic that increases the risk of esophageal collateral damage. This study aims to evaluate the efficacy and safety among different power settings at the points documented by sudden esophageal temperature increase.
Materials and Methods: We enrolled 50 points in 11 patients where the esophageal temperature reached 39°C within 5 seconds after the ablation. We allocated four power settings (12 W, 10 W, 8.5 W, and 5.5 W), and ablation was immediately stopped when the esophageal temperature reached 39°C. The efficacy outcomes were ablation time and total energy calculated by the product of power and ablation time. The safety outcomes were maximal temperature and the integral value of esophageal temperature over 39°C.
Results: Although the ablation time required for the esophageal temperature to reach 39°C was shortest in the 12 W group (12 W: 3.1 ± 2.1 seconds, 10 W: 3.6 ± 2.7 seconds, 8.5 W: 4.7 ± 3.9 seconds, 5.5 W: 8.0 ± 7.2 seconds; p < 0.001), total energy did not differ among the four groups (40 ± 35 J, 35 ± 26 J, 38 ± 31 J, 40 ± 39 J; p = 0.864). There were no significant differences in maximal esophageal temperature (40.2 ± 1.7 °C, 40.3 ± 1.9 °C, 40.1 ± 1.5 °C, 39.8 ± 1.1 °C; p = 0.532) and the integral value of esophageal temperature over 39°C (16 ± 49 °C·t, 18 ± 57 °C·t, 12 ± 29 °C·t, 7 ± 14 °C·t; p = 0.564) among the four groups.
Conclusion: A high power short duration strategy could give a comparable energy application without excessive esophageal collateral damage estimated by esophageal temperature.
OP‐049‐1‐AF (TRACK 6 ‐ AF 7)
Quantitative comparison of ablation lesion between the third‐ and first‐generation visually guided laser balloon
Takashi Yamasaki; Tetsuhisa Hattori; Misen Pak; Ken Kakita
Kouseikai Takeda Hospital, Kyoto, Japan
Objective: The third‐generation laser balloon (LB3) is equipped with a more compliant balloon, compared with the first‐generation laser balloon (LB1). Because of the balloon development, the LB3 inflated to a larger size may isolate wider‐area circumferential PV antrum. However, the difference in isolation area between larger‐sized LB3 and larger‐sized LB1 remains to be elucidated. The aim of this study is to compare the isolation area after PV isolation using larger‐sized LB3 with larger‐sized LB1 in the acute phase.
Methods: Thirty‐nine patients with atrial fibrillation (AF) who underwent LB3 ablation were matched to 39 patients who were treated with LB1 ablation by propensity scores. All PVs were electrically isolated only by laser balloon, and the isolation area was extended by a larger‐sized balloon. After the ablation, voltage maps were created with the PENTARAY catheter, and isolation areas were calculated with the CARTO‐3 system. The isolation area was defined as the low voltage area (<0.1 mV) around the PV antrum.
Result: In the LB3 group, the left‐ and right‐sided isolation area was 12.1 ± 3.4 and 18.9 ± 4.4 cm2, respectively. The total isolation area was 31.0 ± 6.6 cm2. On the contrary, those of the LB1 group were 11.4 ± 2.9, 16.2 ± 5.2, and 27.2 ± 6.8 cm2. These results revealed that larger‐sized LB3 ablation yield statistically greater isolated areas of right‐sided (p = 0.014) and total (p = 0.016) PV antrum than those of larger‐sized LB1 ablation.
Conclusion: The ultra‐compliant balloon of the LB3 may contribute to create a wider isolation area than the LB1.
OP‐050‐1‐AF (TRACK 6 ‐ AF 7)
Early rhythm control on the risk of dementia in atrial fibrillation patients with prior stroke
So‐Ryoung Lee1; Eue‐Keun Choi1; Seung‐Woo Lee2; Kyung‐Do Han3; Seil Oh1; Gregory Y. H. Lip4; Soonil Kwon 1
1 Seoul National University Hospital, Seoul, South Korea; 2Department of Medical Statistics, College of Medicine, Catholic University of Korea, Seoul, South Korea; 3Statistics and Actuarial Science, Soongsil University, Seoul, South Korea; 4Liverpool Centre for Cardiovascular Science, University of Liverpool and Liverpool Chest & Heart Hospital, Liverpool, United Kingdom
Objective: To evaluate whether early rhythm control (ERC) reduces the risk of developing dementia in patients with atrial fibrillation (AF) and prior stroke.
Methods: Using the Korean nationwide claims database, we identified patients who were newly diagnosed as AF and had a prior stroke. Patients who received rhythm control therapy, including antiarrhythmic drug, cardioversion, or AF catheter ablation, within 1 year after the incident AF were defined as the ERC group, otherwise as to the usual care group. Propensity score weighting was used to balance baseline characteristics between the two groups. The incidence of all dementia, Alzheimer's dementia, and vascular dementia were evaluated during follow‐up.
Results: A total of 41,370 patients were included (mean age, 70 ± 11 years; mean CHA2DS2‐VASc score 5.3 ± 1.6): 10,213 were in the ERC group and 31,157 in the usual care group. During a median of 2.7 years of follow‐up, 6414 patients developed incident dementia (4.9 per 100 person‐years). Compared to usual care, ERC was associated with lower risks of all dementia, Alzheimer's dementia, and vascular dementia (hazard ratio [95% confidence interval], 0.825 [0.776–0.876], 0.831 [0.774–0.893], and 0.800 [0.702–0.913], respectively, all p < 0.001) (Figure). The beneficial effect of ERC on the risk of dementia was consistent regardless of the characteristics of prior strokes, such as recent stroke, disabling stroke, and severe stroke.
Conclusion: ERC within 1 year after AF diagnosis might be beneficial to prevent dementia in patients with incident AF and a history of stroke. To prevent the progression of further cognitive dysfunction, ERC would be considered in these patients.
Supporting Documents

OP‐051‐1‐AF (TRACK 6 ‐ AF 7)
Machine learning prediction for the recurrence after electrical cardioversion of atrial fibrillation
Soonil Kwon 1; Eunjung Lee2; So‐Ryoung Lee1; Eue‐Keun Choi1; Seil Oh1; Wonjong Rhee2
1 Seoul National University Hospital, Seoul, South Korea; 2Seoul National University, Seoul, South Korea
Objectives: There is limited evidence regarding machine learning prediction for the recurrence after electrical cardioversion (ECV) of patients with atrial fibrillation (AF). This study aimed to predict the recurrence of AF after ECG using machine learning of electrocardiogram (ECG) and clinical parameters.
Materials and Methods: We analyzed the patients who received successful ECV for AF. Machine learning was designed to classify those with a 1‐month recurrence or not. Individual 12‐lead ECGs both before and after the ECV and various clinical parameters were collected to train the XGBoost‐based model. Ten‐fold cross‐validation was used to evaluate the model's performance. The model's performance was compared to the C‐statistics of selected clinical parameters.
Results: Among a total of 718 patients (mean age 63.5 ± 9.3 years, male 78.8%), AF recurred in 435 (60.6%) patients at 1 month. With the XGBoost‐based model, the AUROCs were 0.57, 0.60, and 0.63 if the model was trained by clinical parameters, ECGs, and both (the final model), respectively. For the final model, sensitivity, specificity, and F1‐score were 84.7%, 28.2%, and 0.73, respectively. Although AF duration showed the best predictive performance (AUROC 0.58 [0.54–0.62]) among the clinical parameters (Figure 1), it was significantly lower than that of the final machine learning model (AUROC 0.63 [0.61–0.64]) (Figure 2). Additional training of 15‐min single‐lead ECG and photoplethysmography monitoring in selected patients (N = 261) did not significantly improve the model's performance (Figure 3).
Conclusion: Machine learning of both ECG and clinical parameters showed a synergistic effect to predict the recurrence after ECV among AF patients.
Supporting Documents


OP‐053‐2‐AF (TRACK 6 ‐ AF 8)
Initial clinical experience using Forward‐Solution computational ECG mapping for adjunctive atrial fibrillation driver ablation
Sutton Fox 1; Avinash Toomu1; Gordon Ho2; Fred Han1; Kurt Hoffmayer1; Kevin Sung1; Jonathan Hsu1; Farshad Raissi1; Christopher Villongco3; Gregory Feld1; Andrew McCulloch1; David Krummen1
1 University of California San Diego, San Diego, United States; 2VA San Diego Healthcare System, San Diego, United States; 3Vektor Medical, Carlsbad, United States
Objective: Forward‐solution ECG mapping has demonstrated accurate atrial fibrillation (AF) driver localization in a blinded, retrospective study, but its effectiveness during AF ablation is unknown. We hypothesized that the forward‐solution algorithm provides effective mapping to facilitate adjunctive AF driver ablation in the electrophysiology laboratory setting.
Materials and Methods: Consecutive patients with refractory AF undergoing adjunctive AF driver ablation after pulmonary vein isolation (PVI) at a tertiary medical center were enrolled. Baseline demographic, electrocardiographic, echocardiographic data, and procedural outcomes were recorded. Procedural duration and fluoroscopy use were obtained from laboratory records.
Results: Ten patients (male = 4 [40%], age 71 years [65–76], EF 61% [52–69], left atrial (LA) volume 32 ml/m2 [25–36]) with AF (persistent = 9 [90%]) were studied according to an IRB‐approved protocol. The procedure duration was 205 minutes [192–226]; fluoroscopy use was 11.3 minutes [6.2–15.6]. An average of 1.3 ± 0.5 AF driver sites were ablated following PVI. 12 of 13 sites (92%) were in the LA, the most common site was the anterior base of the LA appendage (4/13, 31%). Four patients had driver site ablation during ongoing AF or focal AT, resulting in arrhythmia termination in 3 of 4 (75%) cases. Nine of 10 patients were non‐inducible with rapid pacing after ablation; the remaining patient spontaneously converted to sinus rhythm after the procedure and remained AF‐free.
Conclusion: Forward‐solution ECG mapping is a noninvasive, rapid, and effective strategy to facilitate adjunctive driver site ablation in refractory AF patients. Future studies will examine spatial accuracy, long‐term outcome, and cost implications associated with this approach.
OP‐054‐2‐AF (TRACK 6 ‐ AF 8)
Cryoballoon‐based left atrial appendage isolation for the treatment of persistent atrial fibrillation
Christian Heeger; Julia Vogler; Charlotte Eitel; Samuel Reincke; Roland Tilz
Uksh Lübeck, Germany
Background: Although PVI is an effective treatment strategy for patients with paroxysmal atrial fibrillation (AF), it is associated with limited success rates in patients with persistent AF (PersAF). The LAA was recently identified as a target of catheter ablation, especially in PVI non‐responders. Yet, this strategy was assumed to be associated with an increased risk of thromboembolism despite oral anticoagulation (OAC). Cryoballoon‐ (CB) based LAAI might offer a valuable option to achieve safe and durable LAAI.
Objective: To assess safety, efficacy, and 1‐year follow‐up on CB‐based LAAI.
Methods: CB‐based PVI and LAAI were performed in 31 patients with PersAF. LAAI was performed by utilizing a bonus freeze protocol. After LAAI all patients received endocardial LAA closure.
Results: Stable LAAI was achieved after a mean of 2.1 +/− 1.4 CB applications with a mean minimal temperature of −55 (−49, −55) °C. Unless one phrenic nerve palsy (3.2%) of the left phrenic nerve and one hematoma (3.2%) no further complications occurred. Successful LAAI was performed on 28/31 (90%). Transesophageal echocardiography was performed after a median of 49 (47, 56) days and detected LAA‐thrombus in 6/31 (19.3%) patients. Successful LAA closure was performed in all patients after a median of 50 (47, 91) days. The LAA was durable and isolated in 22/31 patients (71%). After a follow‐up of 12.5+/−3.6 months, 68% of patients showed stable Sinusrhyhtm.
Conclusions: LAAI was successfully isolated in the majority of patients. However, a relatively high rate of LAA‐Thrombus was detected after LAAI. Therefore, LAA closure is mandatory in this population.
OP‐055‐2‐AF (TRACK 6 ‐ AF 8)
A comparison of the anticoagulation therapy and prognosis in patients with atrial fibrillation: Data from APHRS‐AF and EORP‐AF
Alena Shantsila 1,2; Tommaso Bucci1,3; Hung‐Fat Tse4; Wee‐Siong Teo5; Tze‐Fan Chao6,7; Hyung‐Wook Park8; Wataru Shimizu9; Gregory Y. H. Lip1,2,10
1 Liverpool Centre for Cardiovascular Science ‐ University of Liverpool, Liverpool, United Kingdom; 2Liverpool Heart & Chest Hospital, Liverpool, UK; 3Department of General Surgery and Surgical Specialties “Paride Stefanini”, Sapienza University of Rome, Rome, Italy; 4Department of Medicine, Queen Mary Hospital, the University of Hong Kong, Hong Kong SAR, China; 5Department of Cardiology, National Heart Centre, Singapore; 6Division of Cardiology, Department of Medicine, Taipei Veterans General Hospital, Taipei, Taiwan; 7Institute of Clinical Medicine, and Cardiovascular Research Center, National Yang Ming Chiao Tung University, Taipei, Taiwan; 8Department of Cardiovascular Medicine, Chonnam National University Hospital, Gwangju, Korea; 9Department of Cardiovascular Medicine, Nippon Medical School, Tokyo, Japan; 10Department of Clinical Medicine, Aalborg University, Aalborg, Denmark
Objective: To compare the adherence to the current guidelines for stroke prevention and to evaluate the 1‐year prognosis between the European and Asian‐Pacific atrial fibrillation (AF) patients, participating in the APHRS‐AF Registry and EORP‐AF Registry.
Materials and methods: The analyses used individual‐level data from a common protocol and case records from 4664 patients in APHRS‐AF and 11,096 from EORP‐AF. The clinical endpoints were 1‐year mortality and major bleeding.
Results: APHRS‐AF patients were younger (68.5 ± 12.0vs69.2 ± 11.4, p < 0.001), had a lower prevalence of females (34.1% vs 40.7%, p < 0.001) and a lower mean (±SD) CHA2DS2‐VASc (2.7 ± 1.7 vs 3.1 ± 1.8, p < 0.001) and HAS‐BLED (1.6 ± 1.1 vs 1.4 ± 1.0, p < 0.001) score then EORP‐AF.
Overall oral anticoagulation (OAC) usage was higher in European than Asian patients (84.1%vs77.1%, p < 0.001). No significant differences were found for OAC use in the high‐risk patients (CHA2DS2‐VASc≥2) between the two registries. The most used type of OAC was the non‐vitamin K antagonist OACs (NOACs) in APHRS‐AF (61.7%vs35.0%, p < 0.001) and VKA in EORP‐AF (50.1%vs20.2%, p < 0.001). EORP‐AF patients were more frequently treated with antiplatelet drugs alone or in combination with OAC.
After 1‐year follow‐up in APHRS‐AF and EORP‐AF registries, the following events were recorded: 118 (2.5%) and 478 (4.3%) deaths for any causes, 47 (1.0%) and 124 (1.1%) major bleedings, respectively. Cardiovascular causes of death were more prevalent in EORP (44.1%vs22%, p < 0.001) while extracranial hemorrhage was the main cause of major bleedings in APHRS (45.4%vs64.5%, p = 0.008).
Conclusion: There are significant clinical differences between European and Asian AF patients in age, sex, comorbidities, and antithrombotic treatments, as well as clinical outcomes. These differences should be accounted for in optimization of AF management.
Supporting Documents

FIGURE 1 COOL‐AF score for death (PANEL A) and its comparison with CHA2DS2‐VASC (PANEL B) in APHRS.

FIGURE 2 COOL‐AF score for major bleeding (PANEL A) and its comparison with HAS‐BLED (PANEL B) in APHRS.

FIGURE 3 COOL‐AF score for thromboembolic events (PANEL A) and its comparison with CHA2DS2VASC in APHRS (PANEL B).
OP‐056‐2‐AF (TRACK 6 ‐ AF 8)
Validation of COOL‐AF score in APHRS‐AF registry and comparison of its performance in EORP‐AF registry
Tommaso Bucci 1,2; Alena Shantsila1,3; Hung‐Fat Tse4; Wee‐Siong Teo5; Tze‐Fan Chao6,7; Hyung‐Wook Park8; Wataru Shimizu9; Gregory Y. H. Lip1,3,10; Rungroj Krittayaphong11
1 Liverpool Centre for Cardiovascular Science ‐ University of Liverpool, Liverpool, United Kingdom; 2Department of General Surgery and Surgical Specialties “Paride Stefanini”, Sapienza University of Rome, Rome, Italy; 3Liverpool Heart & Chest Hospital, Liverpool, UK; 4Department of Medicine, Queen Mary Hospital, the University of Hong Kong, Hong Kong SAR, China; 5Department of Cardiology, National Heart Centre, Singapore; 6Division of Cardiology, Department of Medicine, Taipei Veterans General Hospital, Taipei, Taiwan; 7Institute of Clinical Medicine, and Cardiovascular Research Center, National Yang Ming Chiao Tung University, Taipei, Taiwan; 8Department of Cardiovascular Medicine, Chonnam National University Hospital, Gwangju, Korea; 9Department of Cardiovascular Medicine, Nippon Medical School, Tokyo, Japan; 10Department of Clinical Medicine, Aalborg University, Aalborg, Denmark; 11Division of Cardiology, Department of Medicine, Faculty of Medicine Siriraj Hospital, Mahidol University, Bangkok, Thailand
Objective. To validate the COOL‐AF score in the APHRS‐AF and to compare its performance in the EORP‐AF.
Materials and methods. The analyses included 4664 patients from the APHRS‐AF and 11,096 from the EORP‐AF registry. ROC curve analyses were utilized to test the predictive value of the COOL‐AF score and to compare it with CHA2DS2‐VASc and HAS‐BLED scores.
Results. EORP‐AF patients were older (69.2 ± 11.4 vs 68.5 ± 12.0, p < 0.001) and had a lower prevalence of male sex (59.3% vs 65.9%, p < 0.001) than APHRS. After 1‐year follow‐up in APHRS and EORP‐AF registries, the following events were recorded: 118 (2.5%) and 478 (4.3%) death for any causes, 47 (1.0%) and 124 (1.1%) major bleeding, and 29 (0.6%) and 118 (1.0%) thromboembolic events, respectively. In APHRS, COOL‐AF score showed a good predictive value for all‐cause mortality (AUC 0.75; 95% Confidence Interval (CI) 0.73–0.76, p < 0.001) and major bleeding (AUC 0.68; 95% CI 0.67–0.70, p < 0.001), and was not inferior to CHA2DS2‐VASc and HAS‐BLED scores. In EORP‐AF, the predictive value of COOL‐AF score for all‐cause mortality (AUC 0.66; 95% CI 0.65–0.67, p < 0.001) and major bleeding (AUC 0.59; 95% CI 0.58–0.60, p < 0.001) was lower than APHRS. COOL‐AF score was not predictive of thromboembolic events and its performance was inferior to CHA2DS2‐VASc in both registries.
Conclusion. COOL‐AF scores may be an easy tool to identify Asian AF patients at risk for death and major bleeding and seems to perform better in APHRS‐AF than in the EORP‐AF registry. Its utility in identifying AF patients at risk for thromboembolic events needs further validation.
Supporting Documents

FIGURE 1 COOL‐AF score for death (PANEL A) and its comparison with CHA2DS2‐VASC (PANEL B) in APHRS.

FIGURE 2 COOL‐AF score for major bleeding (PANEL A) and its comparison with HAS‐BLED (PANEL B) in APHRS.

FIGURE 3 COOL‐AF score for thromboembolic events (PANEL A) and its comparison with CHA2DS2VASC in APHRS (PANEL B).
OP‐057‐2‐AF (TRACK 6 ‐ AF 8)
TTR‐INR guided warfarin adjustment protocol: Strategy to improve TTR in patients with AF receiving VKA
Paisit Kosum; Noppachai Siranart; Voravut Rungpradubvong
King Chulalongkorn Memorial Hospital, Bangkok, Thailand
Objectives: To study the association of change of TTR after implementation of TTR‐INR guided warfarin adjustment protocol in patients with atrial fibrillation receiving warfarin.
Materials and Methods: This is a prospective study of patients with nonvalvular AF at the warfarin clinic of King Chulalongkorn Memorial Hospital. TTR was calculated at baseline and 6 months after protocol implementation. Patient characteristics, risk scores, bleeding risk scores, treatments, and outcomes including TTR improvement, embolic and bleeding events, hospitalization, and mortality were collected. McNemar's Chi‐square test and paired t‐test were used to evaluate outcomes.
Results: A total of 95 patients were screened with 56 patients enrolled. Hence, over 56 patients were analyzed, (mean age of 72 ± 12 years, 47.3% females), of which the historical records of ischemic heart diseases, ischemic stroke, and diabetes were reported at 24.3%, 22.6%, and 40.5%, respectively. The baseline risk scores were 3.84 ± 1.7 for the CHA2DS2‐VASc scores, 2.20 ± 1.01 for the HAS‐BLED scores, and 3.32 ± 0.74 for the SAMe‐TT2R2 scores. The TTR at baseline was 61.92 ± 21.6% (59% of patients had TTR less than 65%). After 6 months of protocol implementation, TTR was significantly improved (77.96 ± 19.4%) (p < 0.001). Significant improvement in the proportion of patients with TTR ≥65% was shown after protocol implementation (from 41% to 78%) (p < 0.001). No ischemic or major bleeding events have occurred during the follow‐up in the first 6 months.
Conclusion: The TTR was significantly improved after 6 months of protocol implementation. This strategy may offer additional value in TTR improvement and good outcomes in patients with AF receiving warfarin.
Supporting Documents

OP‐057‐2‐AF (TRACK 6 ‐ AF 8)
Cryoballoon pulmonary vein ablation lesions mapped during repeat procedures for recurred atrial fibrillation
Tung Pham; Pak Hui‐Nam; Pham Le Tra
1 Severance Hospital, Seoul, South Korea
Background: The lesion set of cryoballoon pulmonary vein (PV) isolation differs from radiofrequency (RF)‐PV isolation (PVI), but the quantitative comparison has not been done in patients with atrial fibrillation (AF). We compare the pattern of the remnant potential of PV antrum in patients who had undergone repeat procedures after cryoballoon PVI (Cryo‐PVI).
Methods: Among 613 consecutive AF patients who underwent cryo‐PVI, we evaluated the voltage map (NavX) acquired at the 2nd procedure after recurrence in 14 patients (mean age: 56.6 ± 12.1 years, male 71.4%, Paroxysmal AF 64.3%). The PV antrum was defined by connecting a straight line from top to bottom on the left atrium (LA) posterior side at the maximal inflection point of round surface LA outside the PV ostium. We evaluated remnant PV antral potential (PVAP) with or without PV potential (PVP) at 224 segments of 56 PVs.
Results: 1. PVP reconnections were found in 16 (28.6%) of PVs of 8 (57.1%) patients.
2. Time between de novo and repeat procedures was significantly longer in patients in the PVP‐ group (20.5 ± 10.8 months) than in the PVP+ group (10.5 ± 3.9 months, p = 0.044).
3. There were no preferential PVP+ veins 18.8% in left superior [LS] PV, 18.8% in left inferior (LI) PV, 31.3% in right superior (RS) PV, and 31.3% in right inferior [RI] PV. Time to isolation (p = 0.28), nadir temperature (p = 0.49), thawing time (p = 0.80), and single shot isolation rate (p = 0.52) did not differ between PVP+ veins and PVP‐ veins.
4. By logistic regression analysis, paroxysmal AF (OR 0.3, 95% CI 0.09–0.94, p = 0.047), left ventricular ejection fraction (EF) (OR 0.91, 95% CI 0.86–0.97, p = 0.03), second ablation timing since de novo procedure (OR 0.83, 95% CI 0.72–0.97, p = 0.016) were associated with PVP+ reconnections in univariate analyses.
Supporting Documents
5. PVAP was found in 34.2% of LSPV, 31.6% of RSPV, 18.4% of LIPV, and 15.8% of RIPV (p‐for trends =0.009). The sites where the PVAP was most commonly observed were the anterior segment of LSPV (9.8%) and RSPV (9.8%), the superior segments of LSPV (9.1%) and RSPV (9.1%).
6. Among PVP‐ patients, PVAP was more commonly found in LSPV (90.0%) and RSPV (77.8%) than in the LIPV (45.4%) or RIPV (22.2%, p = 0.008).
Conclusions: In the repeat ablation procedure after Cryo‐PVI, PVP was found in 57% of patients, especially with shorter ablation time between de novo and second procedures. PVAP is commonly found in LSPV and RSPV, suggesting Cryo‐PVI lesion differs from the RF‐PVI lesion.
Keywords: Atrial fibrillation, Catheter ablation, Cryoablation, Antral potential, Pulmonary vein

FIGURE 1 Division of the antrum of each pulmonary vein into four segments
TABLE 1 Clinical, echocardiographic parameters, de novo procedure according to recurrence of electrical PV reconnection
| Patient (n = 14) | PVP+ (n = 8) | PVP‐ (n = 6) | p | |
|---|---|---|---|---|
| Male Gender (n,%) | 10 (71.4%) | 7 (87.5%) | 3 (50%) | 0.25 |
| Age (years) | 56.64 ± 12.11 | 56.17 ± 13.21 | 57.0 ± 12.14 | 0.92 |
|
PAF (n,%) |
9 (64.3%) | 4 (50%) | 5 (83.3%) | 0.30 |
|
BMI (kg/m 2 ) |
23.77 ± 3.29 | 23.37 ± 4.16 | 24.07 ± 2.74 | 0.76 |
|
AF duration (months) |
70.29 ± 47.90 | 48.0 ± 44.07 | 87.0 ± 46.1 | 0.06 |
| Second ablation timing since de novo procedure (months) | 14.79 ± 8.90 | 10.50 ± 3.93 | 20.50 ± 10.77 | 0.044 |
| LVEDD (mm) | 49.07 ± 5.01 | 49.0 ± 4.05 | 49.13 ± 5.91 | 0.88 |
| LVEF (%) | 59.50 ± 11.18 | 56.67 ± 13.20 | 61.63 ± 9.78 | 0.60 |
| E/Em | 8.48 ± 1.97 | 9.83 ± 1.86 | 7.52 ± 1.50 | 0.07 |
| LA volume index (mL/m 2 ) | 41.54 ± 9.42 | 40.20 ± 10.45 | 42.54 ± 9.16 | 0.66 |
| LA dimension (mm) | 40.43 ± 6.02 | 40.83 ± 6.74 | 40.13 ± 5.90 | 0.84 |
| Tricuspid regurgitation jet | 2.13 ± 0.3 | 2.1 ± 0.3 | 2.2 ± 0.3 | 0.30 |
| RVSP (mmHg) | 24.4 ± 5.5 | 22.0 ± 5.2 | 26.8 ± 5.2 | 0.14 |
| De novo procedure | PVs (n = 44) | PVP+(=13) | PVP‐(n = 31) | p |
| Time to isolation (s) | 330.6 ± 128.9 | 378.1 ± 169.1 | 310.7 ± 104.9 | 0.28 |
| Thawing time (s) | 10.9 ± 6.3 | 10.0 ± 4.6 | 11.4 ± 6.9 | 0.8 |
| Times (n) | 2.1 ± 1.1 | 2.2 ± 1.2 | 2.0 ± 1.0 | 0.5 |
|
Nadir temperature (°C) |
−50.1 ± 7.9 | −48.8 ± 6.0 | −50.7 ± 8.7 | 0.49 |
|
Single‐shot (n,%) |
29 (65.9%) | 9 (69.2%) | 20 (64.5%) | 0.98 |
| Ostium long (mm) | 19.6 ± 3.2 | 19.5 ± 2.4 | 19.7 ± 3.6 | 0.82 |
| Ostium short (mm) | 13.6 ± 3.4 | 13.4 ± 4.1 | 13.7 ± 3.2 | 0.44 |
| Antrum long (mm) | 21.2 ± 3.3 | 21.5 ± 2.7 | 21.1 ± 3.5 | 0.59 |
| Antrum short (mm) | 16.0 ± 4.5 | 16.2 ± 4.0 | 16.0 ± 4.8 | 0.94 |
TABLE 2 PV potential and atrial potential for each PVs
| Compare for each PVs | Total (n = 56) | PVP+(n = 16) | PVP‐(n = 40) | p |
|---|---|---|---|---|
| LSPV | 14 | 3 (18.8%) | 11 (27.5%) | 0.77 |
| LIPV | 14 | 3 (18.8%) | 11 (27.5) | |
| RSPV | 14 | 5 (31.3%) | 9 (22.5%) | |
| RIPV | 14 | 5 (31.3%) | 9 (22.5%) | |
| PVAP+(n = 38) | PVAP‐(n = 18) | p | ||
| LSPV | 14 | 13 (34.2%) | 1 (5.6%) | 0.009 |
| LIPV | 14 | 7 (18.4%) | 7 (38.9%) | |
| RSPV | 14 | 12 (31.6%) | 2 (11.1%) | |
| RIPV | 14 | 6 (15.8%) | 8 (44.4%) |
TABLE 3 Logistic regression analysis of clinical and procedure variables predictive of PVP reconnection
| PVP+ | Univariate analysis | Multivariate analysis | ||
|---|---|---|---|---|
| OR (95%) | p | OR (95%) | p | |
| Age (years) | 0.99 (0.94 – 1.04) | 0.62 | 1.01 (0.90–1.12) | 0.90 |
| Gender (n,%) | 0.93 (0.82 – 1.05) | 0.22 | 2.06 (0.11–40.34) | 0.63 |
| BMI (kg/m 2 ) | 0.98 (0.81 – 1.17) | 0.79 | ||
| PAF (n,%) | 0.30 (0.09 – 0.94) | 0.047 | 5.72 (0.16–207.6) | 0.34 |
| LA volume index (mL/m 2 ) | 1.01 (0.94 – 1.07) | 0.85 | ||
| LA dimention (mm) | 1.02 (0.92 – 1.13) | 0.68 | ||
| LVEDD (mm) | 1.06 (0.94 – 1.20) | 0.34 | ||
| LVEF (%) | 0.91 (0.86 – 0.97) | 0.003 | 0.91 (0.81–1.03) | 0.09 |
| E/Em | 1.36 (0.95 – 1.94) | 0.09 | 1.61 (0.92–2.38) | 0.09 |
| LVMI (g/m 2 ) | 1.0 (0.98 – 1.03) | 0.75 | ||
| Tricuspid regurgitation jet | 1.29 (0.11 – 14.92) | 0.84 | ||
| RVSP (mmHg) | 0.96 (0.94 – 1.09) | 0.52 | ||
| Second ablation timing since de novo procedure (months) | 0.83 (0.72–0.97) | 0.016 | 0.87 (0.60–1.24) | 0.43 |
| Times (n) | 1.25 (0.69–2.25) | 0.46 | ||
| Time to isolation (s) | 1.0 (0.99–1.01) | 0.13 | ||
| Single shot (n) | 1.24 (0.31–4.96) | 0.76 | ||
| Thwing time (s) | 0.96 (0.86–1.08) | 0.52 | ||
|
Nadir temperature (°C) |
1.03 (0.94–1.13) | 0.51 | ||
OP‐058‐2‐AF (TRACK 6 ‐ AF11)
The usefulness of auto‐quantified Epicardial adipose tissue in predicting atrial fibrillation recurrence after catheter ablation
Ling Kuo 1; Guan‐Jie Wang2; Chih‐Ming Liu1; Li‐Wei Lo1; Shih‐Lin Chang1; Yu‐Feng Hu1; Fa‐Po Chung1; Yenn‐Jiang Lin1; Chia‐Feng Lu2; Shih‐Ann Chen3
1 Taipei Veterans General Hospital, Taipei, Taiwan; 2National Yang Ming Chiao Tung University, Taipei, Taiwan; 3Taichung Veterans General Hospital, Taichung, Taiwan
Objectives: Left atrial (LA) volume and epicardial adipose tissue (EAT) have been associated with recurrence after catheter ablation (CA) in atrial fibrillation (AF). The interactive effect has not been tested. We aim to examine the co‐impact of atrial and EAT volumes on the prognostic significance of AF.
Materials and Methods: This is a single‐center, retrospective study of 334 patients between 2015 and 2017 with AF referred for CA. Atrial and EAT volumes were auto‐segmented and quantified by a 3D U‐Net model from computed tomography images and indexed to body surface area to calculate atrial and EAT volume indices. EAT was allocated to LA or right atrium (RA). We performed cox regression analysis adjusting for factors associated with AF to examine the predictors of AF recurrence.
Results: The mean age was 56 ± 11 years, 251 (75%) were men, the mean CHA2DS2‐VASc score was 1.4 ± 1.2, and 79 (24%) had persistent AF. The mean volume index of LA, RA, LA EAT, RA EAT, and total EAT was 68 ± 20, 65 ± 20, 8 ± 4, 12 ± 4, and 47 ± 19 ml/m2, respectively. Over 2 years, 139 (42%) had AF recurrence. In univariate analysis, diabetes mellitus, persistent AF, larger volume index of LA, RA, LA EAT, and RA EAT were predictors of AF recurrence; After multivariate adjustment, persistent AF (Hazard ratios [HR]:1.6, 95% confidence interval [CI]:1.1–2.3, p = 0.01) and larger LA EAT volume index (HR:1.1, 95% CI:1.0–1.1, p = 0.04) were independent predictors.
Conclusions: LA EAT volume measured by auto‐segmented and auto‐quantified 3D U‐Net model could be useful in predicting AF recurrence after CA.
Supporting Documents

OP‐060‐2‐AF (TRACK 6 ‐ AF11)
Characteristics of spatial distribution of rotors in pulmonary vein isolation refractory non‐paroxysmal atrial fibrillation patients
Yusuke Okuyama 1; Tomoya Ozawa1; Takuma Nishikawa1; Yusuke Fujii1; Koichi Kato1; Yoshihisa Sugimoto2; Yoshihisa Nakagawa1; Takashi Ashihara2
1 Department of Cardiovascular Medicine, Shiga University of Medical Science, Seta‐Tsukinowa cho, Otsu city, Japan; 2Department of Medical Informatics and Biomedical Engineering, Shiga University of Medical Science, Seta‐Tsukinowa cho, Otsu city, Japan
Objectives: Non‐paroxysmal atrial fibrillation (non‐PAF) rotors, detected by an online real‐time phase‐mapping system (ExTRa Mapping), are always meandering, and the rotor distributions varied among patients. We tried to find the characteristics of the distribution of non‐passively‐activated areas (NPAs), which reflect a high probability of rotor existence.
Materials and Methods: Fifty‐one non‐PAF patients refractory to pulmonary vein isolation were enrolled and a non‐passive ratio (%NP) reflecting rotor existence probability was obtained by ExTRa Mapping in each mapping area. Then, the left atrium (LA) was divided into seven regions and NPAs showing above 40% (NPA₄₀)were counted in each region.
Results: Two‐hundred‐fifteen NPA₄₀s were obtained in 51 patients. NPAs tended to form a cluster. The number of NPA clusters varied from 1 to 5 in each patient and 88% of patients had at least one cluster. Patients with only one cluster were the most common. When the number of NPA clusters was 1 and 2, the mean number of NPAs forming clusters was 3.5 ± 1.6 and 2.6 ± 0.5, respectively. The numbers of NPA₄₀s and NPA₄₀s in anterior, inferior, and septum were significantly larger in patients with clustered NPA. However, age, gender, and factors included in the CHA₂DS₂‐VASc score showed no statistical differences. (Figure Right).
Conclusion: The fact NPAs formed clusters with non‐uniform spatial distribution suggests non‐PAF rotors meandered within the limited areas. However, the existence of clustered NPAs was revealed only by ExTRa Mapping. To know the maintenance mechanisms of non‐PAF, phase mapping with ExTRa Mapping in LA is very important and helps us to find and select NPAs which can be therapeutic targets.
Supporting Documents

OP‐061‐2‐AF (TRACK 6 ‐ AF11)
Polysaccharide peptide of Ganoderma lucidum reduces inflammatory process In atrial fibrillation: Randomized clinical trial
Muhamad Rizki Fadlan; Ardian Rizal; Djanggan Sargowo
Universitas Brawijaya, Malang, Indonesia
Objective: The objective of this study was to evaluate the role of Ganoderma lucidum in controlling the rate, rhythm, inflammatory process, and oxidative stress in patients with AF.
Material and Method: A randomized, single‐blind, placebo‐controlled clinical trial was conducted on 44 patients with atrial fibrillation. Ganoderma lucidum extracts 750 mg was given to intervention group (IG) in three divided doses for 90 days and a placebo was given to controlled group (CG). The parameters were inflammatory marker (HsCRP, IL‐1,IL‐6, and TNF‐α) and oxidative stress marker (superoxide dimustase (SOD), malondialdehyde (MDA), transthoracic echocardiography (focused on LAVi), ECG (focused on P wave duration and dispersion) measured at baseline and after 90 days of treatment).
Results: The change in heart rate was significant in IG compared with placebo (−6.13 ± 9.6/min vs. 1.43 ± 3.04/min; p = 0.021) Ganoderma lucidum significantly reduce tnf‐α level compared with placebo (−185.34 ± 164.9 pg/ml vs −21 ± 87.12 pg/ml; p = 0.001). il‐6 and il‐1 concentration was significantly lower compared with placebo (−23.03 ± 107.3 pg/ml vs. 58.53 ± 134.64 pg/ml; p = 0.000; −23.03 ± 19.46 pg/ml vs. 15.7 ± 28.65 pg/ml; p = 0.025, respectively). Sod level in IG significantly increased compared with placebo, p = 0.021. MDA concentration significantly reduced in IG compared with placebo,p = 0.002. P wave dispersion and P wave maximal duration in IG significantly decrease, p = 0.046, p = 0.004, respectively.
Conclusion: Ganoderma lucidum can reduce inflammatory cytokine and oxidative process resulting in the maintenance of sinus rhythm is significantly improved.
Supporting Documents
TABLE 1 Baseline characteristics
| Variable | IG, N = 20 | CG, N = 18 | p |
|---|---|---|---|
| Age | 63.61 ± 8.5 | 62.5 ± 10.5 | 0.65 |
| Sex (male) | 29.0% | 30.6% | 0.89 |
| Body Mass Index (BMI) | 26.3 ± 5.4 | 26.4 ± 4.06 | 0.62 |
| Systolic Blood Pressure (SBP) | 138.8 ± 18.7 | 132.2 ± 16.4 | 0.068 |
| Diastolic Blood Pressure (DBP) | 86.51 ± 14.02 | 87.97 ± 10.2 | 0.63 |
| Heart Rate (HR) | 80.4.95 ± 14.7 | 75.83 ± 12.25 | 0.18 |
| Smoker | 23.8% | 25% | 0.93 |
| Diabetes Mellitus | 30% | 22.2% | 0.82 |
| Hypertension | 55% | 55.5% | 0.96 |
| History of CVA | 10% | 5.55% | 0.28 |
| CAD | 25% | 33.3% | 0.46 |
| Ace Inhibitor/ARB | 80% | 94% | 0.16 |
| CCB | 25% | 22.2% | 0.86 |
| Β Blocker | 90% | 94.4% | 0.88 |
| Statin | 75% | 77.78% | 0.98 |
| Digoxin | 10% | 5.6% | 0.64 |
| Warfarin | 80% | 88.8 | 0.68 |
| P Wave dispersion | 40.18 ± 24.28 | 40.7 ± 23.6 | 0.88 |
| P max | 119.3 ± 14.8 mm | 118.3 ± 9 mm | 0.84 |
| LAVI | 26.45 ± 2.85 | 24.48 ± 1.76 | 0.52 |
| Nytric Oxide | 33.7 ± 12.61 | 36.5 ± 14.34 | 0.35 |
| MDA | 1.53 ± 0.56 | 1.66 ± 0.43 | 0.28 |
| HsCRP | 2.99 ± 0.86 | 2.83 ± 1.13 | 0.49 |
| TNFα | 14.79 ± 1.98 | 13.28 ± 2.40 | 0.14 |
| IL‐1 | 14.82 ± 1.88 | 13.74 ± 1.26 | 0.14 |
| IL‐6 | 15.60 ± 2.17 | 14.46 ± 1.71 | 0.11 |
| PT | 12.20 ± 3.17 | 13.46 ± 2.41 | 0.61 |
| APTT | 23.20 ± 4.47 | 24.26 ± 3.61 | 0.62 |
| INR | 2.04 ± 1.17 | 2.26 ± 1.21 | 0.81 |
| Physical Functioning | 90.22 ± 9.79 | 88.11 ± 17.9 | 0.82 |
| Limitation To Physical Health | 86.5 ± 20.5 | 85.7 ± 34.5 | 0.64 |
| Limitation To Emotional Problem | 80.5 ± 27.72 | 80.95 ± 35.4 | 0.71 |
| Energy Fatigue | 78.78 ± 15.9 | 75.3 ± 19.69 | 0.68 |
| Emotional Well‐being | 82.77 ± 15.5 | 78.9 ± 16.15 | 0.165 |
| Social Functioning | 88.75 ± 15.1 | 83.6 ± 28.5 | 0.179 |
| Pain | 86.08 ± 24.1 | 83.19 ± 28.5 | 0.522 |
| General Health | 77.54 ± 14.3 | 79.55 ± 16.26 | 0.83 |
| Physical_Limitation | 79.25 ± 18.39 | 76.3 ± 19.9 | 0.176 |
TABLE 2 Clinical characteristics post‐intervention
| Variable | Controlled Group | Intervention Group | p |
|---|---|---|---|
| SBP | −10.5 ± 15.03 | −22.5 ± 17.6 | 0.002 |
| DBP | −3.3864 ± 11.3 | −7.7429 ± 10.9 | 0.109 |
| BMI | −0.04 ± 1.00 | −0.01 ± 0.78 | 0.76 |
| MAP | −12.77 ± 11.35 | −5.8 ± 11.60 | 0.01 |
| HR | −2.027 ± 5.5 | −4.97 ± 10.5 | 0.15 |
| NO | 2.26 ± 2.4 | 4.54 ± 10.5 | 0.125 |
| SOD | −0.31 ± 0.22 | 0.19 ± 0.11 | 0.021 |
| MDA | 0.045 ± 0.24 | −0.296 ± 0.52 | 0.002 |
| HSCRP | −0.39 ± 0.69 | −1.62 ± 0.9 | 0.038 |
| TNF | −0.87 ± 1.1 | −2.59 ± 1.75 | 0.013 |
| IL‐1 | −0.804 ± 1.2 | −2.63 ± 1.69 | 0.001 |
| IL‐6 | −1.08 | −3.27 ± 1.80 | 0.006 |
| PT | 1.32 ± 1.26 | 1.22 ± 1.42 | 0.64 |
| APTT | 2.20 ± 1.47 | 2.26 ± 2.61 | 0.82 |
| INR | 0.04 ± 1.17 | 0.16 ± 1.21 | 0.68 |
TABLE 3 Atrial remodelling after intervention
| Variable | IG, N = 20 | CG, N = 18 | p |
|---|---|---|---|
| P Wave dispersion | −4.7 ± 23.6 | −1.18 ± 24.28 | 0.046 |
| P max | −10.8 ± 4 mm | −1.3 ± 10.8 mm | 0.004 |
| LAVI | −2.38 ± 2.04 | −1.08 ± 3.46 | 0.15 |
TABLE 4 Quality of life after intervention
| Physical functioning | 3.02 ± 2.73 | −3.98 ± 2.73 | 0.00 |
| Limitation to physical health | 4.78 ± 11.09 | 0.22 ± 13.9 | 0.03 |
| Limitation to emotionalproblem | 2.75 ± 3.76 | 1.71 ± 13.4 | 0.18 |
| Energy fatigue | 4.38 ± 13.46 | −2.71 ± 13.4 | 0.044 |
| Emotional well being | 3.81 ± 17.15 | 2.41 ± 3.92 | 0.48 |
| Social functioning | 2.28 ± 7.7 | 0.2 ± 4.8 | 0.86 |
| Pain | 4.61 ± 13.09 | 0.6 ± 7.66 | 0.026 |
| General health | 2.95 ± 7.58 | −2.54 ± 4.60 | 0.16 |
| Health change | 4.46 ± 10.54 | −2.66 ± 7.80 | 0.008 |

FIGURE 1 Kaplan–Meier plot of survival free from AF rehospitalization after the treatment.
OP‐062‐2‐AF (TRACK 6 ‐ AF11)
Validity of MENARI plus (self‐pulse assessment and ClinicalScoring) Mobile apps for detecting atrial fibrillation
Muhamad Rizki Fadlan; Ardian Rizal; Cik Kahadi
Departement of Cardiology and Vascular Medicine, Faculty of Medicine, Universitas Brawijaya ‐ Dr. Saiful Anwar General Hospital, Malang, Indonesia
Objective: The aim of this study is to validate AF screening using self‐pulse assessment and clinical scoring (MENARI PLUS) based on android apps compared with an ECG recording conducted at the same time.
Methods: We collected from a total of 1385 subjects with CHA2DS2‐VASc Score ≥2, age > 50 years attending 8 primary care centers (PCCs) in Malang were invited to take part in AF screening. Every participant evaluates self‐pulse assessment, then evaluate MENARI plus Score. After that, Every participant performed an electrocardiography examination and was classified into AF and sinus rhythm groups.
Results: In this study, the mean age of these patients was 61.5 ± 6.9 years old and 76% of subjects were female. We found 11%patient's with AF. The average age of the atrial fibrillation group was 63.6 ± 5.1 years with an average CHA2DS2‐VASc score of 2.9 and 68/156 (43.5%) new cases of AF were detected. Anticoagulants (ACs) could be initiated in 65/68 (95.5%) of these cases. The sensitivity for self‐pulse palpation was 73.1% (95% CI 68%–76%) and specificity was 68.3% (95% CI 65%–72%). MENARI PLUS had an area under the receiver operating curve (AUC) of 0.86 (95% CI 0.82 to 0.89) with sensitivity per measurement occasion was (84%, 95% CI 82%–88%) and specificity was (87.9%, 95% CI 82%–90%). The positive predictive value for MENARI PLUS was (46.8%, 95% CI 42%–54%).
Conclusion: In this study, we suggested that MENARI PLUS has high sensitivity and specificity for atrial fibrillation. It may also be a useful screen to apply opportunistically for previously undetected atrial fibrillation.
Supporting Documents
TABLE 1 Baseline Characteristics
| Variables | AF | Non‐AF | p |
|---|---|---|---|
| Age | 63.6 ± 5.0 | 61.2 ± 7.1 | 0.000 |
| Female | 72.4% | 76.4% | 0.27 |
| SBP | 133 ± 17.7 | 122.8 ± 16.7 | 0.000 |
| DBP | 80.8 ± 10.3 | 79 ± 12.8 | 0.37 |
| Weight | 62.7 ± 11.3 | 61.6 ± 9.6 | 0.33 |
| BMI | 26.9 ± 4.6 | 26.7 ± 3.3 | 0.26 |
| CHA2DS2‐VASc Score | 3.92 ± 0.48 | 2.5 ± 0.78 | 0.000 |
| Age > 65 | 43.4% | 26.8% | 0.03 |
| BMI > 26 | 9.3% | 8.8% | 0.45 |
| Hypertension | 67.9% | 32.8% | 0.000 |
| Diabetes Mellitus | 44% | 40.4% | 0.43 |
| Stroke/TIA | 7.6% | 4.2% | 0.18 |
| PAD | 13.5% | 11.1% | 0.39 |
| Dyspneu | 10.3% | 9.4% | 0.74 |
| Palpitation | 68.6% | 51% | 0.000 |
| Chest pain | 1.9% | 1.1% | 0.34 |
| Syncope | 8.3% | 4.8% | 0.09 |
| Fatigue | 53.2% | 40.8% | 0.003 |
| Irregular self‐pulse palpation | 71.3% | 31.7% | 0.000 |
| MENARI PLUS score ≥7 | 84% | 12.1% | 0.000 |
TABLE 2 MENARI PLUS Clinical Scoring
| Predictors | Multiplying factor |
|---|---|
| Irregular MENARI | +4 |
| Palpitation | +2 |
| Age > 65 | +2 |
| Hypertension | +2 |
| Fatigue | +1 |
| TOTAL SCORE | 11 |

PICTURE 1 MENARI Plus Mobile Apps.

PICTURE 2 MENARI PLUS had an area under the receiver operating curve (AUC) of 0.86 (95% CI 0.82 to 0.89).
OP‐064‐1‐AF (TRACK 7 ‐ AF)
Comparison of persistent atrial fibrillation ablation acute procedural endpoints for AcQMap guided vs conventional systems
Simon James; Darragh Twomey; Matthew Bates; Andrew Thornley
James Cook University Hospital, Middlesbrough, United Kingdom
Objective: To compare procedural endpoints in patients undergoing catheter ablation (RFA) of persistent AF using the AcQMap system compared to a control group using conventional mapping systems.
Methods: Clinical/procedural data were collected for consecutive patients undergoing persistent AF RFA during a 2‐year period. System choice for RFA was by operator preference/not randomized.
Results: Thirty‐eight patients underwent AcQMap‐guided ablation (PVI only =1) and 51 underwent ablation using standard mapping systems (PVI only =18). PVI‐only cases were excluded from further analysis.
Eleven patients (29.7%) converted to sinus rhythm with RFA alone in the AcQMap group compared to 1 (3%) of the conventional group (p = 0.004).
The conventional group was on average younger than AcQMap (58+/−9.6 vs 62.7+/− 8 years) and had fewer previous RFA procedures (1.8+/− 0.6 vs 2.3+/− 0.8). Other demographics were well matched (table 1).
The duration of RF energy was lower in the AcQMap group (23 v 33 min, p = 0.0103).
AcQMap‐guided RFA was delivered specifically to sites of abnormal activation as directed by global activation mapping.
Conventional RFA strategies used were:
• Box isolation 55%,
• Roof line 33%
• LPV‐Mitral line 36.%
• RPV‐Mitral line 12.1%
• Cavo‐tricuspid isthmus 12%
• Fractionation Sites 36.4%
Force‐sensing RFA catheters were used in all cases.
Conclusion: A patient‐specific‐targeted AcQMap‐based substrate approach for persistent AF ablation is associated with a significantly higher rate of acute conversion to sinus rhythm, and reduced ablation delivery but at the expense of longer procedure times.
Supporting Documents

OP‐065‐1‐AF (TRACK 7 ‐ AF)
Spontaneous cardioversion of persistent atrial fibrillation following AcQMap‐Guided ablation compared to conventional mapping‐based cases
Simon James; Darragh Twomey; Matthew Bates; Andrew Thornley
James Cook University Hospital, Middlesbrough, United Kingdom
Objective: The AcQMap system highlights areas of abnormal conduction during AF. Sites of local rotational, irregular, and focal activation are targeted during AcQMap‐based AF ablation procedures.
This study examines the rate of post‐procedural spontaneous cardioversion in patients undergoing persistent AF ablation using the AcQMap system in comparison with a control group using standard mapping systems.
Methods: Clinical and procedural data were collected from consecutive patients undergoing persistent AF ablation. Patients receiving PVI only were excluded. Patients who remained in AF at the procedure end were included. Short‐term outcomes following AcQMap‐based ablation were compared with procedures using Carto or Precision mapping systems.
Results: 15 patients underwent AcQMap‐based ablation and 15 underwent ablation using standard mapping systems. Lesion sets were delivered according to operator preference.
The groups were well matched; demographic data are presented in table 1.
In the 6 weeks post‐procedure, 7/15 patients (47%) reverted to sinus rhythm spontaneously in the AcQMap group. In comparison, only 1/15 patients (3%) in the Carto/Precision group reverted spontaneously over the same period (p = 0.035).
AcQMap procedures were significantly longer than those using standard mapping systems (p < 0.0001) (table 1). There were no complications.
Conclusion: AcQMap‐guided ablation for persistent AF is associated with a significantly higher rate of post‐procedural spontaneous cardioversion to sinus rhythm than for standard ablation cases using conventional mapping approaches.
Supporting Documents

OP‐066‐1‐AF (TRACK 7 ‐ AF)
Ivabradine for rate control in rheumatic atrial fibrillation and left atrial strain dynamics
Aditya Kapoor; Kamlesh Raut; Ankit Sahu; Roopali Khanna; Naveen Garg; Satyendra Tewari
Sanjay Gandhi PGIMS, Lucknow, Lucknow, India
Supporting Documents
Objectives: Role of Ivabradine for rate control in rheumatic AF and effect on the left atrial strain.
Methods: Eighty patients, with chronic rheumatic AF, HR >80 bpm (48 ± 12 yrs, 28% males, AF duration 6.2 ± 3.2 years, mean rate 136 ± 14 bpm) randomized to Ivabradine or placebo in the background of ongoing beta blocker/calcium channel blockers. LA strain and NT Pro BNP levels were also assessed. Ivabradine started @ 2.5 mg BD and in those with an inadequate response at 1 week (failure to decrease HR < 10% vs baseline), the dose was titrated to 5 mg BD. After Holter at 1 month, dose‐escalated to 7.5 mg BD if needed.
Results: Those on Ivabradine had lower HR (81 ± 10 vs 99 ± 9) at 3 months and 6 months (79 ± 8 vs 94 ± 8, p < 0.001). Reduction in HR was 56 ± 15 vs 31 ± 14, and % change in HR was 41 ± 7 vs 24 ± 9%, both p < 0.00001, in Ivabradine group.
At 6 months, Ivabradine group had:
Significantly better day‐time and night‐time Holter rate control.
Lower NT Pro BNP (1368 vs 1607 pg/ml)
Higher 6 minute walk distance (410 ± 47 vs 349 ± 54 m, all p < 0.001)
Asymptomatic (EHRA score 1) 80% vs 37.5%
Improvement of >1 EHRA class from baseline 60% vs 17%
Better LA Strain (22.8 ± 2.8% vs 20.6 ± 2.5%)
Ivabradine was well tolerated and no patient needed drug withdrawal.
Conclusion: Ivabradine can be a good option for rate control in patients with rheumatic AF.

OP‐068‐1‐AF (TRACK 7 ‐ AF 2)
Subclinical atrial fibrillation in haemodialysis patients: A systematic review & meta‐analysis
Rakesh Agarwal 1; Yash Giri1; Kyle Franke1; Nitesh Rao2; Rajiv Mahajan1
1 University of Adelaide, Adelaide, Australia; 2Flinders Medical Centre, Adelaide, Australia
Objectives: Individuals with chronic kidney disease have a high risk of developing atrial fibrillation. Patients with chronic kidney disease (CKD) on hemodialysis (HD) may suffer from previously unrecognized episodes of silent/subclinical atrial fibrillation (SCAF). This systematic review sought to study the risk of subclinical atrial fibrillation in participants with end‐stage renal failure undergoing hemodialysis.
Materials and Methods: We included observational studies, clinical studies, clinical trials, and randomized controlled trials reporting SCAF in CKD patients on HD. PubMed, Embase, and SCOPUS databases were systematically searched from inception until May 31, 2022. Prevalence of SCAF was studied using pooled population data. The Egger test was done to assess the risk of publication bias.
Results: Five studies reporting on SCAF, with a total of 431 participants, were found to be eligible. SCAF screening was performed by 12‐lead ECG (1 study), Holter/ECG patch (2 studies), or implantable loop recorder (2 studies). On screening, the prevalence of AF was found to be 10% (95% CI; [3–17]) at baseline. A further 26% (95% CI; [12–39]) of patients were detected to have SCAF after initiation of hemodialysis. One study reported the mean CHA2DS2VaSc in patients with hemodialysis‐related SCAF to be 3.2. The risk of publication bias was low.
Conclusion: The incidence of SCAF is high in patients undergoing hemodialysis. Incremental detection of SCAF was noted during follow‐up. This data have implications on the stroke risk in hemodialysis patients.
OP‐069‐1‐AF (TRACK 7 ‐ AF 2)
An external validation of simplified warfarin dosing formula for atrial fibrillation patients in Thailand
Anunya Ujjin 1; Chatree Chai‐Adisaksopha2; Wanwarang Wongcharoen3; Arisara Suwanagool4
1 Sakaeo Crown Prince Hospital, Sakaeo, Thailand, Sakaeo, Thailand; 2Division of Hematology, Department of Internal Medicine, Faculty of Medicine, Chiang Mai University, Chiang Mai, Thailand; 3Division of Cardiology, Department of Internal Medicine, Faculty of Medicine, Chiang Mai University, Chiang Mai, Thailand; 4Division of Cardiology, Department of Internal Medicine, Faculty of Medicine, Siriraj Hospital, Thailand
Objective: To externally validate the simplified warfarin dosing formula for preventing stroke and systemic embolism in Thai patients with atrial fibrillation.
Material and Methods: Among 1207 patients visiting the outpatient clinic between October 01, 2011 and September 30, 2021. We identified 531 patients with atrial fibrillation who had been receiving warfarin with a target INR of 2.0 to 3.0 for at least two consecutive follow‐ups after initiation. The actual warfarin dose was defined as a warfarin dose that results in an INR of 2.0 to 3.0. The simplified warfarin dosing formula was 3.2‐ (0.03 x age (years)) + (0.02 x body weight (kg)) (10% dose reduction if presence of heart failure (HF) and/or stroke). The optimal dosage was defined as the difference from the actual dose within 20%.
Results: The mean age was 68 ± 11 years, and men accounted for 44.4% of the population. Mean body weight was 61.6+ 14 kg. Non‐valvular AF was presented in 416 (78.34%). The mean CHA2DS2‐VASc Score was 3.65 ± 1.27. The mean difference in warfarin dose between the actual and simplified formular dose is 0.408 + 1.07 mg/day (Min, Max −2.51 to 4.63). The disagreement was more apparent in patients requiring a higher dose of warfarin. The warfarin dosing formula resulted in optimal dosing in 37% and overdosing in 24% of cases, whereas the 3‐mg dose resulted in optimal dosing in 39% and overdosing in 43% of patients.
Conclusion: A simplified warfarin dosing formula appeared to be safer than a 3‐mg dose. Inappropriate overdose after using the warfarin formula was less prevalent than using a 3‐mg dose.
OP‐070‐1‐AF (TRACK 7 ‐ AF 2)
Quality‐of‐Life and renal function improvement after his bundle pacing and AV‐Nodal ablation for permanent AF
Sutra Khalishaputri; Giky Karwiky; Chaerul Achmad; Mohammad Iqbal
Department Of Cardiology And Vascular Medicine, Universitas Padjadjaran, Dr. Hasan Sadikin General Hospital, Bandung, Indonesia
Background: Permanent atrial fibrillation (AF) can increase the risk of heart failure, sudden death, and stroke. In such cases, rate control is recommended over rhythm control. In this report, we present a case of permanent AF uncontrolled with medications, that underwent HIS bundle pacing and AV‐nodal ablation showing improvement of quality of life (QoL) and renal function.
Case Illustration: A 53‐year‐old female, known to have an AF‐RVR since 2 years prior, came to our institution with a complaint of palpitations when doing her daily activities despite her compliant to her medications. On physical examination, the patient was fully alert, with BP of 130/80 mmHg, HR of 120x/mins irregular, PR 100x/mins irregular, and physical exam findings were unremarkable. ECG showed AF‐RVR. Holter examination was done showing atrial fibrillation as the basic rhythm average heart rate of 120 bpm. The patient was then planned for the HIS bundle pacing and AV‐nodal ablation. Upon follow‐up, the heart rate became completely dependent on the pacemaker making it slower and more regular at 80 bpm. The QoL was improved from 56.25 to 100 score (Aquarel questionnaire) and from 69.4 to 100 score (SF‐36 questionnaire). Renal function also improved from eGFR of 20 to 26 ml/min/1.73 m2 within 2 weeks.
Conclusion: In cases of permanent AF in which the rate cannot be controlled with medications, it is recommended for the patient to have CRT and AV‐nodal ablation with his bundle pacing as an alternative. In this case, the patient showed improvement in QoL and renal function on follow‐up visit after the procedure.
Supporting Documents

FIGURE 1 ECG pre‐procedural.

FIGURE 2 ECG on Follow‐up post‐HIS bundle pacing.

FIGURE 3 ECG on follow‐up post‐HIS bundle pacing.
OP‐072‐1‐AF (TRACK 7 ‐ AF 2)
Safety and efficacy of hybrid Epicardial and endocardial PVI in longstanding persistent atrial fibrillation
Robert Puchalski 1; Stuart Healy1; David Adam1; Logan Bittinger1; Jeff Alison1; Emily Kotschet1; Adrian Pick2
1 Monash Heart, Melbourne, Australia; 2Department of Cardiac Surgery, Monash Health, Melbourne, Australia
Objectives: To assess the safety and efficacy of hybrid approach pulmonary vein isolation in longstanding persistent AF patients.
Materials and Methods: We performed a retrospective analysis of 20 consecutive longstanding persistent AF patients who underwent a totally thorascopic epicardial PVI (plus roof and floor line), followed by endocardial remapping and ablation where required. During remapping, the location of ablation gaps was described. Ablation was targeted to ensure PVI, and ideally posterior wall isolation. Safety and efficacy data were collected.
Results: Follow‐up was complete for 19/20 patients (90%). The mean age of the patients was 60 ± 7 years, the mean time to remapping procedure was 5.5 months, and the mean follow‐up time was 2.7 years. There was only one minor complication of post‐operative mild pneumonia. There were no major complications. During remapping, only 5% of the left‐sided veins had reconnected. Ten percent of the RIPVs had reconnected, whereas 25% of RSPVs were reconnected. At remap, 25% of posterior walls were durably blocked. Post endocardial ablation all veins showed entrance and exit blocks, and 16 patients has posterior wall isolation. Eighteen patients were in sinus rhythm at the last follow‐up. Only four patients (20%) had any AF during follow‐up, and two of those patients maintained sinus rhythm after cardioversion. There were 3 cases of atypical left‐sided flutter, one case of atypical right atrial appendage flutter, and two cases of CTI‐dependent flutter.
Conclusion: Hybrid epicardial and endocardial PVI appears safe. In this exploratory data, there is a low recurrence of AF in a traditionally difficult patient population group.
OP‐073‐1‐AF (TRACK 7 ‐ AF 2)
Reduced cardiorespiratory fitness in atrial fibrillation associated with abnormal invasive Haemodynamics and left atrial Remodeling
Jonathan Ariyaratnam 1; Ricardo Mishima1; Olivia McNamee1; Mehrdad Emami1; Kadhim Kadhim1; Celine Gallagher1; Prashanthan Sanders1; Adrian Elliott1
1 Centre for Heart Rhythm Disorders, Adelaide, Australia
Objective: To evaluate the association between cardiorespiratory fitness (CRF) and left atrial (LA) remodeling in patients with atrial fibrillation (AF), using invasive and non‐invasive stress testing.
Materials and Methods: Consecutive patients with paroxysmal or persistent AF and preserved left ventricular ejection fraction >50% were recruited. Participants underwent cardiorespiratory pulmonary exercise testing (CPET) for assessment of peak oxygen uptake (VO2PEAK). Participants also underwent resting and exercise transthoracic echocardiography (TTE) focussed on left ventricular (LV) and LA function. At AF ablation, participants underwent invasive assessment of LA pressures and LA electrical function using high‐density electroanatomical maps. The association between VO2PEAK and atrial parameters was determined using multivariable linear regression models adjusted for age and sex.
Results: In total, one hundred participants were recruited. The mean age of the cohort was 63.6 ± 11.6 and 23% of the cohort was female. In age‐ and gender‐adjusted analyses, VO2PEAK was not associated with LV function at rest (p = 0.22) or during exercise (p = 0.50). However, VO2PEAK was positively associated with LA emptying fraction at rest (p < 0.01) and during exercise (p < 0.01) as well as a reservoir (p < 0.01), booster (p = 0.05), and conduit strain (p = 0.04). On invasive testing, Supporting Documentswe observed an inverse relationship between VO2PEAK and mean LA pressure (p < 0.01). On electrical analysis, there was no association between CRF and LA voltage (p = 0.23), and conduction velocity.
| Age‐ and Gender‐Adjusted Model | |||
|---|---|---|---|
| ß (95% CI) | R2 | p | |
| Resting LVEF | 0.1 (−0.1 to 0.4) | 0.24 | 0.22 |
| Resting Average E/e′ | −0.6 (−1.1 to − 0.2) | −0.31 | <0.01 |
| LV Mass Index | −0.01 (−0.08 to 0.04) | 0.25 | 0.55 |
| LA Max | −0.1 (−0.2 to 0.1) | 0.27 | 0.27 |
| LA Min | −0.3 (−0.4 to − 0.1) | 0.33 | <0.01 |
| Resting LAEF | 0.2 (0.1–0.3) | 0.35 | <0.01 |
| Reservoir Strain | 0.3 (0.2 to 0.5) | 0.41 | <0.01 |
| Booster Strain | 0.3 (0.0 to 0.6) | 0.38 | 0.05 |
| Conduit Strain | 0.3 (0.0 to 0.7) | 0.36 | 0.04 |
| Exercise LVEF | 0.07 (−0.13 to 0.27) | 0.23 | 0.50 |
| Exercise E/e′ | −0.2 (−0.6 to 0.2) | 0.25 | 0.44 |
| Exercise LAEF | 0.2 (0.1 to 0.3) | 0.36 | <0.01 |
| Mean LAP | −0.6 (−0.9 to − 0.3) | 0.36 | <0.01 |
| LA Voltage | 0.8 (−0.5 to 2.1) | 0.15 | 0.23 |
| LA Conduction Velocity | 9.1 (−6.5 to 24.7) | 0.24 | 0.24 |
| LA Fractionated Points | 0.1 (−0.2 to 0.4) | −0.0008 | 0.33 |
(p = 0.24) or fractionation (p = 0.33).
Conclusion: Reduced CRF in patients with symptomatic AF is associated with LA remodeling involving abnormal LA hemodynamics and mechanical function at rest and during exercise. Improving CRF may improve LA function in patients with AF.
OP‐074‐1‐AF (TRACK 7 ‐ AF 4)
Long‐term outcome of lesion index‐guided high power ablation for PVI
Ming‐jen Kuo 1; Shih‐Lin Chang1; Li‐Wei Lo1; Yenn‐Jiang Lin1; Yu‐Feng Hu1; Fa‐Po Chung1; Tze‐Fan Chao1; Jo‐Nan Liao1; Ta‐Chuan Tuan1; Chin‐Yu Lin1; Ting‐Yung Chang1; Shih‐Ann Chen2
1 Taipei Veterans General Hospital, Taiwan; 2Taichung Veterans General Hospital, Taiwan
Objective: Lesion index (LSI) is useful to complete pulmonary vein isolation (PVI) for atrial fibrillation (AF). High‐power application with LSI guided ablation strategy (HP‐LSI) may shorten the time to complete PVI. However, the long‐term outcome for HP‐LSI was limited.
Methods: 147 paroxysmal AF patients who underwent PVI by TactiCath ablation catheter were enrolled retrospectively. The first 80 patients were assigned to high power short duration ablation strategy (HPSD, anterior wall 50 W, posterior wall 40 W, 10 seconds for each lesion), and the subsequent 67 patients were applied with HP‐LSI strategy (anterior wall 50 W/LSI at least 5.0, posterior wall 40 W/LSI 4.0 to 4.5, with 20 seconds limited for each lesion). The primary outcome was AF recurrence between groups. PVI time and first‐pass isolation rate were considered secondary outcomes.
Results: Over 12 months of follow‐up, there was a significantly lower rate of AF recurrence in the HP‐LSI group compared to the HPSD group (14.9% vs. 32.5%, p = 0.020) (Figure, Panel A). The PVI time was shorter (63.7 minutes vs. 87.7 minutes, p < 0.001), and the first‐pass isolation rate was higher for both PVs (RPV: 42.2% vs. 13.7%, p = 0.003; LPV: 66.7% vs. 31.4%, p = 0.001) in HP‐LSI group than HPSD group. Besides, there were fewer gaps found in several PV segments in the HP‐LSI group after the first pass PV circumferential ablation (Figure, Panel B).
Conclusion: HP‐LSI ablation strategy can result in durable PVI outcome and shorten PVI time with a high first‐pass isolation rate in both PVs.
Supporting Documents

OP‐075‐1‐AF (TRACK 7 ‐ AF 4)
Prevalence of amyloidosis in patients with non‐valvular atrial arrhythmias
Krishna Prasad Nevali 1; Darshan Krishnappa1; Deepak Padmanabhan1; Prathap HJ1; Manjunath CN1; Venkat Tholakanahalli2; Abhinav Anand3
1 Sri Jayadeva Institute of Cardiovascular Research, Bangalore, India; 2University of Minnesota, Minneapolis, USA; 3KEM Medical College, Mumbai, India
Introduction: Wild‐type ATTR amyloidosis (WAA) is a disease of the elderly and predominantly affects the heart. The prevalence of WAA in patients with atrial arrhythmias (AA), remains underevaluated.
Purpose of the study: To determine the prevalence and predictors of WAA in patients with non‐valvular AA.
Materials and Methods: Patients older than 55 years with nonvalvular AA were recruited. All patients underwent Technetium pyrophosphate scan. Rhythm control was considered in all patients.
Results: Eighty‐nine patients were included in the study. The mean age was 65.82 ± 10.07 years, 53 (59.6%) were males, 34 patients (38.2%) had diabetes, 59 (66.3%) patients had hypertension, and 3 (3.4%) patients had a history of stroke. The mean ejection fraction was 52.08 ± 8.8%. while the mean CHADSVAS2 score was 2.63 ± 1.54. Rhythm control was attempted in all patients but was unsuccessful in 32 (36.8%) patients. Technetium pyrophosphate scan was positive in 27 (30.3%) patients indicative of WAA. Concentric LVH was more common in patients with WAA (40% vs 18.5%), the mean LV wall thickness being greater in patients with WAA as compared to patients without (11.5 ± 2.5 mm vs 9.7 ± 2.4 mm). Multinomial regression analysis odds of WAA were higher among male patients (OR = 7.54, p = 0.03) and patients with diabetes (OR = 8.85, p = 0.05).
Conclusion: A significant proportion of patients with AA have WAA. Male and diabetic patients with AA have higher odds of WAA. Further studies are required to assess the outcomes of rhythm control in patients with WAA and atrial arrhythmias.
Supporting Documents
TABLE 1 Characteristics of patients with and without WAA
| WAA positive | WAA negative | |
|---|---|---|
| Age | 61.9 ± 10.1 | 60.3 ± 12.3 |
| Diabetes | 66.7% | 26.5% |
| Hypertension | 76.2% | 64.7% |
| EF | 52.5 ± 9.7% | 51.4 ± 9.7% |
| LA Size | 42.1 ± 7.5 mm | 41.2 ± 7.1 mm |
| Septal Thickness | 11.5 ± 2.5 mm | 9.7 ± 2.4 mm |
| Concentric LVH | 40% | 18.5% |
| Biatrial enlargement | 38.1% | 37.1% |
WAA: Wild ATTR Amyloidosis, LVH: Left ventricular hypertrophy, EF; Ejection fraction, LA: Left atrium.
TABLE 2 Logistic regression model identifying the independent predictors of WAA
| OR (CI) | p‐Value | |
|---|---|---|
| Sex | 0.03 (1.1–49.2) | 0.18 |
| Age | 1.06 (0.2–5.4) | 0.94 |
| Diabetes | 8.8 (1.8–42.6) | 0.01 |
| Hypertension | 0.70 (0.2–8.9) | 0.70 |
| Septal Thickness | 0.91 (0.7–1.3) | 0.91 |
| Low voltage QRS in Limb leads | 0.3 (0.06–2.3) | 0.31 |
| Low Voltage QRS in precordial leads | 2.6 (0.16–43.7) | 0.49 |
OP‐076‐1‐AF (TRACK 7 ‐ AF 4)
Individual risk prediction of anticoagulation in patients with cirrhosis and atrial fibrillation
In‐Soo Kim 1; Hye Won Lee2; Jiwon Seo1; Eui‐Young Choi1; Beom Kyung Kim2; Jong‐Youn Kim1
1 Gangnam Severance Hospital, Seoul, South Korea; 2Institute of Gastroenterology, Yonsei University College of Medicine, Seoul, South Korea
Background: We aimed to assess the absolute risk and benefit from OAC therapies in individual AF patients with liver cirrhosis (LC), and to develop the optimal dose‐selecting risk calculator for each patient.
Methods: We derived and validated a prediction model for major bleeding (MB) and stroke/systemic thromboembolism (SSTE) in AF patients with LC from a two‐center observational cohort (n = 420 in the derivation cohort, n = 180 in the validation cohort) with four treatment options (standard‐, low‐dose NOACs, warfarin, and no OACs). Readily available clinical variables were included in machine learning‐based ensembled risk calculation models.
Results: Model calibration and discrimination were adequate with c‐statistics of 0.77[0.66–0.87] for MB and 0.74[0.74–0.84] for SSTE. Three‐year absolute risk increases (ARIs) for MB with standard‐dose NOACs ranged from <10% in 37% of patients to >30% in 18% of patients, with low‐dose, NOACs ranging from <10% in 47% of patients to >30% in 12% of patients compared without OACs. Three‐year absolute risk reductions (ARRs) for SSTE with standard‐dose NOACs ranged from <7% in 48% of patients to >15% in 22% of patients, with low‐dose, NOACs ranging from <7% in 57% of patients to >15% in 17% of patients compared without OACs. The ARI cutoff for MB and ARR cutoff for SSTE with OAC were shown as >2.4%/year and >1.2%/year (c‐statistics 0.81[0.78–0.83], 0.75[0.72–0.79]).
Conclusions: Artificial intelligence combining clinical variables was found to predict individual patient's bleeding and stroke/systemic embolism risks well and it can also guide each patient's appropriate OAC dose in AF patients with LC (web‐calculator can be accessed at: https://riskcalc.shinyapps.io/AFLC/).
Supporting Documents

OP‐077‐1‐AF (TRACK 7 ‐ AF 4)
Hypothyroidism shows a causal association with atrial drivers during catheter ablation of atrial fibrillation
Jose Antonio Bautista 1,2; Ahliah Ibrahim1,2; Li‐Wei Lo1,3; Fa‐Po Chung1,3; Yu‐Feng Hu1,3; Shih‐Lin Chang1,3; Yenn‐Jiang Lin1,3; Chin‐Yu Lin1,3; Ting‐Yung Chang1,3; Ling Kuo1,3; Chih‐Min Liu1,3; Shin‐Huei Liu1,3; Wen‐Han Cheng1; Wei‐Tso Chen1; Pei‐Heng Kao1; Ming‐Jen Kuo1; Thien Chuong Nguyen Khac1; Guan‐Yi Li1; Chih‐Hsien Lin1; Shih‐Ann Chen1,3
1 Division of cardiology, Department of Medicine, Taipei veterans general hospital, Taipei, Taiwan; 2Section of clinical cardiac electrophysiology, heart institute, St. Luke's medical center ‐ Global City, Taguig City, Philippines; 3Institute of clinical medicine and cardiovascular research center, National Yang‐Ming University, Taipei, Taiwan
Supporting Documents


OP‐078‐1‐AF (TRACK 7 ‐ AF 4)
Ablation of the electrical activity in the “blind spot” of Lasso‐Verified PVI reduces early recurrences
Guenter Stix 1; Nadir Saoudi; Hannah Kastinger2; Joachim Kueng2; Irene Lang1; Laura Stix1
1 Medical University of Vienna, Vienna, Austria; 2Technical University of Vienna, Vienna, Austria
Background: A lasso in the PV‐ostium is standard to verify PVI. But circumferential isolating lines are placed in the much thicker myocardium of the antrum or atrium, i.e., distant to the lasso. Therefore, a substantial part of the myocardium might escape the control of the lasso.
Objectives: A potential “blind spot” of the lasso was examined by separating the control of the isolation of the PVs with the lasso from the examination of the antral line with UHDM.
Methods: Isolation of the PVs was verified with a lasso by exit‐block, entry‐block, negative adenosine test, and unexcitability along the ablation line. Then, the area between the position of the lasso in the PV‐ostium and the antral ablation line was examined using UHDM. Any electrical activity in this “blind spot” was ablated. Patients were followed for 3 months for ERs.
Results: Lasso‐verified PVI was achieved in 50 consecutive patients. UHDM also revealed isolated PVs in 100%. But residual electrical activity in the supposed “blind spot” was found in 36 patients (72%). These potentials could be traced in 12/36 patients (33%) into one region and in 24/36 patients (66%) into several regions. ERs were found in 5% of patients with paroxysmal AF and 50% of those with persistent AF. Potential myocardial volumes of the “blind spot” were calculated using a mathematical model.
Conclusion: UHDM is able to trace electrical potentials into a “blind spot” of lasso‐verified PVI. Ablation of these residual antral potentials results in a very low ER rate in paroxysmal AF.
OP‐079‐1‐AF (TRACK 7 ‐ AF 4)
Left atrial thrombus exclusion before atrial fibrillation ablation: Reconsidering the role of cardiac computed tomography
Hendrianus Hendrianus 1,2; Elen Elen1,2; Celly Anantaria Atmadikoesoemah1,2; I Made Adi Satria Darma2,3; Ghina Shabirina1,2; Eldwin Prayudha Widya2,4; Sony Hilal Wicaksono1,2; Manoefris KASIM1,2
1 Department of Cardiology and Vascular Medicine, Faculty of Medicine Universitas Indonesia, National Cardiovascular Center Harapan Kita, West Jakarta City, Indonesia; 2Indonesian Heart Association, West Jakarta City, Indonesia; 3Department of Cardiology and Vascular Medicine, Faculty of Medicine Universitas Udayana, Denpasar, Indonesia; 4Department of Cardiology and Vascular Medicine, Faculty of Medicine Universitas Sam Ratulangi, Manado, Indonesia
Objectives: Considering the risk of aerosolization during the COVID‐19 pandemic associated with transesophageal echocardiography (TEE), we evaluated the diagnostic performance of cardiac computed tomography (CCT) before pulmonary vein isolation (PVI) in comparison to semi‐invasive TEE in excluding left atrial (LA)/LA appendage (LAA) thrombus, limiting the need for TEE to only patients with possible thrombus on CCT.
Materials and Methods: We included a total of 145 consecutive patients with atrial fibrillation (AF) (age 52.4 ± 10.3 years; 63% males; 89 paroxysmal AF) referred for radiofrequency ablation in National Cardiovascular Center Harapan Kita, Jakarta, Indonesia. All patients underwent preprocedural single‐phase 128‐slice multidetector CT and subsequent TEE as the reference standard with a mean time interval of 6.5 ± 5.3 days between the two procedures.
Results: CCT identified 30 patients (20.7%) with a filling defect in the LA/LAA, 8 of which were confirmed by TEE as thrombi (22 false positives and 8 true positives), whereas 9 true thrombi (6.2%) were detected by TEE (1 false negative by CCT). The sensitivity and specificity of CCT were 88.9% and 83.8%, respectively, with a positive predictive value of 26.8% and a negative predictive value of 99.1%. The overall accuracy was 84.1%.
Conclusion: Apart from being a planned preparation modality before PVI, CCT is sufficient and could be used as an initial step to exclude the presence of LA/LAA thrombus, limiting the invasive TEE only for confirmation of the thrombus if detected by CCT.
Supporting Documents
TABLE 1 Clinical characteristics of the patient population (n = 145)
| Age, years | 52.4 ± 10.3 |
| Male sex | 91 (63%) |
| Paroxysmal AF | 89 (61%) |
| Time interval between procedures, days | 6.5 ± 5.3 |
| LA/LAA thrombus | 9 (6.2%) |
TABLE 2 Results of TEE and CCT for detection of LAA thrombus
| TEE | ||||
|---|---|---|---|---|
| Thrombus | No thrombus | Total | ||
| CCT | Thrombus | 8 | 22 | 30 |
| No thrombus | 1 | 114 | 115 | |
| Total | 9 | 136 | 145 | |
TABLE 3 Diagnostic accuracy of CCT compared to TEE for detection of LAA thrombus
|
Sensitivity, % (95% CI) Specificity, % (95% CI) NPV, % (95% CI) PPV, % (95% CI) Accuracy, % (95% CI) |
88.9 (51.8–99.7) 83.8 (76.5–89.6) 99.1 (94.7–99.9) 26.8 (19.0–36.4) 84.1 (77.2–89.7) |
OP‐080‐1‐AF (TRACK 7 ‐ AF 6)
Abnormal left‐ventricular global longitudinal strain is associated with a diagnosis of atrial fibrillation in embolic‐stroke‐of‐undetermined source
Tony Li 1; Yiliang Zheng1; Fang Qin Goh2; Chloe Hui Xuan Low3; Jamie Si Pin Ong3; Jamie Ho1; Swee Chong Seow1; Leonard Yeo2; Benjamin Tan2; Ching Hui Sia1
1 National University Heart Center, Singapore; 2National University Hospital, Singapore; 3Yong Loo Lin School of Medicine, National University of Singapore
Patients with embolic‐stroke‐of‐undetermined‐source (ESUS) have no immediate attributable cause despite evaluation. Undiagnosed atrial fibrillation (AF) is often diagnosed after prolonged monitoring. Left‐ventricular‐global‐longitudinal‐strain (LVGLS) is a sensitive marker of myocardial dysfunction and atrial reservoir function, but its role in ESUS is unknown. We sought to evaluate the role of LVGLS in predicting AF diagnosis in ESUS.
This study examined consecutive patients diagnosed with ESUS between October 2014 and October 2017 who were offered an implantable loop recorder (ILR). They were followed for new‐onset AF and ischemic stroke recurrence. All patients had a transthoracic echocardiogram performed during the index admission. Post‐hoc analysis was performed for two‐dimensional (2D) speckle tracking deformation parameters including LVGLS. An abnormal LVGLS was defined as less than −18.0%.
157 ESUS patients were followed up for a median duration of 3.50 (interquartile range 3.29) years. They were predominantly male (72.6%) with a mean age of 61.0 ± 11.6 years old. 27 (17.2%) patients were eventually diagnosed with AF and 27 (17.2%) patients developed recurrent stroke. Among the patients with newly‐diagnosed AF, 24 were started on oral anticoagulation while 3 had medical contraindications such as clinical bleeding or frailty. An abnormal LVGLS was associated with AF detection but not recurrent stroke. This association persisted on multivariable analysis adjusting for age, sex, hypertension, hyperlipidemia, diabetes mellitus, left ventricular ejection fraction (LVEF), and left atrial volume index (LAVI).
LVGLS may be a potential marker for risk stratification where patients with an abnormal GLS can be followed more closely and stronger consideration given for ILR implantation.
OP‐081‐1‐AF (TRACK 7 ‐ AF 6)
Revisiting of pulmonary vein stenosis after high‐power short‐duration radiofrequency ablation in patients with atrial fibrillation
Joongmin Kim; Daehoon Kim; Je‐Wook Park; Hee Tae Yu; Tae‐Hoon Kim; Jae‐Sun Uhm; Boyoung Joung; Moon‐Hyoung Lee; Hui‐Nam Park
Severance Cardiovscular Hospital, Yonsei University College of Medicine, Yonsei University Health System, Seoul, South Korea
Objectives: Pulmonary vein isolation (PVI) by high‐power short‐duration (HPSD) radiofrequency (RF) energy reduces procedure time without a difference in efficacy compared to conventional RF‐PVI (Conv‐PVI). We compared the frequency of symptomatic PV stenosis as long‐term complications in Conv‐PVI and HPSD‐PVI.
Materials and Methods: Among 4540 consecutive patients (male 74.9%, 59.5 ± 12.0 years old, paroxysmal AF 64.2%, repeated procedure 11.7%) who underwent AF ablation, we compared those who showed PV stenosis after Conv‐PVI and HPSD‐PVI (50 ~ 60 W). We evaluated the characteristics of patients diagnosed with clinically significant PV stenosis by computed tomogram (CT).
Results: Symptomatic PV stenosis was diagnosed in 12 of the patients (male 75%, 50.8 ± 15.4 years old, paroxysmal AF 100%, repeat procedure 33.3%) 355.5 ± 155.2 days after the procedure (HPSD‐PVI n = 6, 0.5% vs. Conv‐PVI n = 6, 0.2%, p = 0.085). Common symptoms were hemoptysis (58.3%) and dyspnea (33.3%). Stenotic PV was right inferior PV in 50%, left inferior PV in 33.3%, left superior PV in 33.3%, right superior PV in 16.7%, and multiple PVs in 41.7%. 58.3% of patients required surgical or endovascular interventions. In the multivariate logistic regression analysis, HPSD‐PVI (OR 3.45[1.04–11.40], p = 0.042), left atrial diameter (OR 0.89[0.81–0.99], p = 0.030) and the number of ablation procedures (OR 2.53[1.10–5.82], p = 0.029) was independently associated with PV stenosis after AF ablations.
Conclusion: We observed symptomatic PV stenosis (58% requiring PV interventions) after median of 11.17 months in 0.5% of patients after HPSD‐PVI. HPSD‐PVI reduces the procedure time, but caution is required for the risk of stenosis, especially in inferior PVs.
OP‐082‐1‐AF (TRACK 7 ‐ AF 6)
Coarse atrial fibrillation in complete atrioventricular block: Rare presentation of staphylococcus Hemolyticus mitral valve endocarditis
Nigel Jeronimo Santos; Sonny Sendon; Michelle Marie Pipo; John Christopher Pilapil; Celia Catherine Uy; Aiza‐Meriam Tahil; Michael‐Joseph Agbayani
University of the Philippines‐ Philippine General Hospital, Manila, Philippines
Staphylococcus hemolyticus which are usually commensal organisms rarely present with native valve endocarditis (NVE), with only 8 documented cases in the literature. Concomitant atrioventricular (AV) conduction abnormalities complicating S. hemolyticus infective endocarditis are rare. Here we present a 43‐year‐old, Filipino, female with end‐stage renal disease on chronic hemodialysis presenting with a 1‐month history of exertional dyspnea, orthopnea, and eventually consulting for worsening dyspnea and dizziness. Workup revealed coarse atrial fibrillation in complete AV block on electrocardiogram. Echocardiography showed severe mitral regurgitation with multiple oscillating vegetations in the posterior mitral leaflet. Risk factors identified for developing NVE were prolonged central line use and predisposing valvular lesions. Although mitral valve endocarditis may be complicated by AV conduction abnormalities, the non‐coronary aortic cusp and the anterior mitral leaflet are believed to be more commonly involved because of their close anatomic relationship with the AV node. We present the first documented case of aggressive S. hemolyticus posterior mitral valve leaflet endocarditis further complicated by coarse atrial fibrillation in complete heart block.
OP‐083‐1‐AF (TRACK 7 ‐ AF 6)
Association of left atrial reverse remodeling after atrial fibrillation catheter ablation depending on H2FPEF score
Moon‐Hyun Kim; Hee Tae Yu; Tae‐Hoon Kim; Boyoung Joung; Moon‐Hyoung Lee; Hui‐Nam Pak
Yonsei University College of Medicine, Yonsei University Health System, Seoul, South Korea
Background: There is growing evidence of the association between heart failure with a preserved ejection fraction (HFpEF) and atrial fibrillation (AF), diastolic function, and atrial myopathy. In this study, we hypothesized that changes in the H2FPEF score would be associated with a left atrial (LA) dimension % reduction one‐year post‐AF catheter ablation (AFCA).
Methods: Among 2756 consecutive patients with AFCA, 1672 (69.3% male, 60.2 ± 10.5 years old, 66.1% paroxysmal AF) with a de novo AFCA, both baseline and 1‐year echocardiograms, available baseline and 1‐year H2FPEF scores, and protocol‐based regular rhythm follow‐up were included. We divided the patients into three groups according to the baseline H2FPEF or delta‐H2FPEF score and their relationship to the percent reduction in the left atrial dimension (% delta‐LA) one‐year post‐AFCA.
Results: AF patients with high H2FPEF scores (≥6 score, n = 450) had larger LA dimensions, higher LA peak pressures, low LA voltages, and larger epicardial adipose tissue volumes (p < 0.001) than those with H2FPEF scores<6 (n = 1222). Patients with decreased 1‐year H2FPEF scores were independently associated with the % delta‐LA (OR 1.034 [1.019–1.050], p < 0.001), ejection fraction (OR 1.036 [1.011–1.161], p = 0.004), left ventricular mass index (OR 1.007 [1.000–1.015], p = 0.049), and epicardial adipose tissue volume (OR 0.996 [0.993–0.999], p = 0.016). Throughout a 63.9 ± 36.6 month follow‐up, AF recurrence one‐year post‐procedure was significantly less in patients with a reduced one‐year H2FPEF score than their counterparts (log‐rank p = 0.007).
Conclusions: Patients with a decreased H2FPEF score one‐year post‐AFCA were independently associated with a significant LA reduction, low epicardial adipose tissue volume, and lower long‐term AF recurrence.
Supporting Documents

OP‐084‐1‐AF (TRACK 7 ‐ AF 6)
Blunted atrial reverse remodeling after catheter ablation of atrial fibrillation and the long‐term rhythm outcome
Moon‐Hyun Kim; Inseok Hwang; Je‐Wook Park; Hee Tae Yu; Tae‐Hoon Kim; Jae‐Sun Uhm; Boyoung Joung; Moon‐Hyoung Lee; Hui‐Nam Pak
Yonsei University College of Medicine, Yonsei University Health System, Seoul, South Korea
Background: Although active rhythm control by AFCA reduces the left atrial (LA) dimension, blunted atrial reverse remodeling can be observed in patients with atrial myopathy. We explored the characteristics and long‐term outcomes in atrial fibrillation (AF) patients who had blunted atrial reverse remodeling despite the absence of AF recurrence within a year after atrial fibrillation catheter ablation (AFCA).
Methods: We included 1685 patients who underwent both baseline and 1‐year follow‐up echocardiograms, had a baseline LA diameter > 40 mm, and did not recur AF within a year. We divided them into tertile groups (T1–T3) based on the LA dimension 1‐year percent change after propensity score matching. We investigated the genetic characteristics of patients using a genome‐wide association study (GWAS).
Results: Blunted LA reverse remodeling (T1, n = 424) was independently associated with LA peak pressure (OR 1.010 [1.002–1.019], p = 0.019), LA wall thickness (OR 0.448 [0.252–0.789], p = 0.006), LA voltage (OR 0.651 [0.463–0.907], p = 0.012), and epicardial adipose tissue volume (OR 1.004 [1.001–1.008], p = 0.014). Throughout 65.9 ± 37.4 months of follow‐up, the incidence of an AF recurrence a year after the procedure was significantly higher in the T1 group (log‐rank p < 0.001). Among 894 patients with a GWAS, the polygenic risk scores were associated with blunted LA reverse remodeling.
Conclusions: Blunted LA reverse remodeling after AFCA was independently associated with a low LA voltage, thin wall thickness, high LA pressure, and epicardial adipose tissue, and it had a genetic background. Long‐term clinical recurrence a year after AFCA was higher in the group with suspected atrial myopathy.
OP‐085‐1‐AF (TRACK 7 ‐ AF 6)
Racial differences and similarities in atrial fibrillation epidemiology, risk factors, and mortality in community cohorts
Moon‐Hyun Kim 1; Daehoon Kim1; Eunsun Jang1; Hee Tae Yu1; Tae‐Hoon Kim1; Jung‐Hoon Sung2; Hui‐Nam Pak1; Moon‐Hyoung Lee1; Pil‐Sung Yang2; Boyoung Joung1
1 Division of Cardiology, Department of Internal Medicine, Yonsei University College of Medicine, Seoul, South Korea; 2Division of Cardiology, CHA Bundang Medical Center, CHA University, Seongnam, South Korea
Objective: Atrial fibrillation (AF) is the most common arrhythmia that occurs clinically and is associated with mortality, morbidity, and medical costs. However, most of the AF studies included predominantly white populations. In this study, we aimed to compare established associations between risk factors and AF in UK Biobank, a study with the Western population, against Korean NHIS‐HealS, a study with the Asian.
Methods: We included 402,229 and 484,406 populations not diagnosed with non‐valvular AF from the National Health Insurance Service‐Health Screening (NHIS‐HealS) cohort in Korea and UK biobank, respectively.
Results: Although the subjects in Korean NHIS‐HealS had a high proportion of males, were younger, and had a lower BMI, cardiovascular disease was more prevalent in Korean NHIS‐HealS. Fewer AF cases were observed in Korean NHIS‐HealS (N = 9182; 2.3%), than in the UK biobank (N = 25,312; 5.2%). Multivariable‐adjusted models showed cohort differences for the association of body mass index and AF (hazard ratio per standard deviation increase, 1.34; 95% confidence interval [CI], 1.32–1.36 in UK biobank versus 1.05; 95% CI 0.95–1.17 in Korean NHIS‐HealS; interaction p‐value of 0.074). The relationship between systolic blood pressure and AF showed similar results (hazard ratio per standard deviation increase, 1.03; 95% confidence interval [CI], 1.01–1.04 in UK biobank versus 1.04; 95% CI 0.93–1.17 in Korean NHIS‐HealS; interaction p‐value of 0.308).
Conclusions: In a comparison of findings between the UK biobank and Korean NHIS‐HealS, we found a close agreement for a series of well‐established risk factors for atrial fibrillation according to race difference.
Supporting Documents

OP‐086‐2‐AF (TRACK 7 ‐ AF 9)
Conduction system pacing post‐Atrio‐Ventricular nodal ablation in drug‐refractory atrial fibrillation with heart failure
Anand Yadav Pasula; Anindya Ghosh; Ulhas M. Pandurangi
The Madras Medical Mission, Chennai, India
Objective: The aim is to study the feasibility, efficacy, and short‐term outcomes of conduction system pacing (CSP) +/−(CRT) cardiac resynchronization therapy in post‐AV nodal ablation.
Methods: Patients who were candidates for AVN ablation (Drug refractory atrial fibrillation (AF) with the fast ventricular rate (FVR) and heart failure were prospectively selected and implanted with a CSP lead +/− coronary sinus lead).
Results: A total of 15 patients were included in the study (males‐9, mean age‐ 69 + 9.2 y, ischemic cardiomyopathy: 3, sick sinus syndrome: 5, rheumatic heart disease: 2, and other etiology: 5). Patients were broadly divided into AV node ablation with CSP + CRT: 4 patients, AV node ablation with CSP + Daul chamber (DC) pacemaker: 11 patients. Six patients underwent HBP and 9 patients underwent LBBAP. The mean QRS duration at baseline was 139 ± 20 ms which narrowed to 109 ± 11 ms post‐CSP. The mean CSP threshold in CRT arm was 1.0 V (HBP) and 0.75 V (LBBAP) compared to 1.8 V (HBP) and 1 V (LBBAP)in the DC pacemaker arm. Significant QT prolongation was noted in 4 out of 15 patients (Mean QTc = 531 ms). One patient with a QTc of 480 ms post‐LBBAP assisted CRT had an episode of ventricular arrhythmia within 3 days post‐procedure. Ejection fraction improved from 40 ± 13% at baseline to 45 ± 15% at 6 months follow‐up. Functional class improved from NYHA class III‐IV during baseline to NYHA class II during follow‐up in 9/15 patients.
Conclusion: In patients with drug‐refractory AF and heart failure, AVN ablation coupled with CSP +/− CRT is associated with improvement in symptoms and quality of life.
OP‐086a‐2‐AF (TRACK 7 ‐ AF 9)
Dementia risk of direct oral anticoagulants versus warfarin for atrial fibrillation: Systematic review and meta‐analysis
Khi Yung Fong 1; Yiong Huak Chan2; Yue Wang3; Colin Yeo3; Barbara Helen Rosario4; Vern Hsen Tan3
1 National University of Singapore; 2Biostatistics Unit, Yong Loo Lin School of Medicine, National University of Singapore; 3Department of Cardiology, Changi General Hospital, Singapore; 4Department of Geriatric Medicine, Changi General Hospital, Singapore
Objective(s): To evaluate the relative risks of dementia in direct oral anticoagulants (DOAC) versus warfarin in patients with atrial fibrillation (AF).
Materials and Methods: An electronic literature search was conducted to retrieve studies reporting comparisons of dementia incidence between patients treated with DOAC versus warfarin for AF. Hazard ratios (HRs) and their 95% confidence intervals (95%CI) were pooled in a random‐effects meta‐analysis. Where studies provided both raw and corrected HR estimates, the corrected HR was used. Subgroup analyses of HR were also performed for studies reporting stratified outcomes for patients ≥ 75 years of age, and propensity score‐matched (PSM) studies. Numbers of dementia diagnoses and person‐years of follow‐up were also pooled to determine incidence rate ratios (IRR). Finally, meta‐regression was performed to identify variables influencing the results of the meta‐analysis.
Result(s): Ten studies and 342,624 patients were retrieved. DOAC was associated with a significantly lower risk of developing dementia compared to warfarin (HR = 0.88, 95%CI = 0.80–0.98, p = 0.017, I2 = 75%; IRR = 0.87, 95%CI = 0.76–1.00, p = 0.045, I2 = 87%). Similar significance was seen in the subgroup of PSM studies, but not for patients aged ≥ 75 years. Meta‐regression found that a lower mean age corresponded to a significantly greater favoring of DOAC over warfarin.
Conclusion: The use of DOAC in AF appears to significantly reduce dementia risk compared to warfarin. Nonetheless, a suggestion of reversal of this effect with increasing age merits further research in the form of randomized trials with long‐term follow‐up, given that the underlying pathophysiological associations of AF and dementia have yet to be fully elucidated.
Supporting Documents

OP‐086a‐2‐AF (TRACK 7 ‐ AF 9)
Biomarkers and CHA2DS2VASC accuracy for stroke risk in atrial fibrillation: A systematic review and meta‐analysis
Shreyans Sinhal 1; Timothy Lathlean1,2,3; Isaac Hoe1; Rajiv Mahajan1,2,3,4
1 Adelaide Medical School, Faculty of Health and Medical Sciences, University Of Adelaide, Adelaide, Australia; 2South Australian Health and Medical Research Institute (SAHMRI), Adelaide, Australia; 3Commonwealth Science and Industrial Research Organisation (CSIRO), Adelaide, Australia; 4Lyell McEwin Hospital, Northern Adelaide Local Health Network, Adelaide, Australia
Objectives: To determine whether the addition of biomarkers can yield improvements in discriminatory performance beyond the current accuracy for CHA2DS2VASC alone (c‐statistic = 63.5–65.3%) (https://academic.oup.com/europace/advance‐article/doi/10.1093/europace/euac096/6650663?login=false).
Materials and Methods: Searches were carried out according to four databases (MEDLINE, EMBASE, Web of Science, SCOPUS) alongside gray literature (Google Scholar) and citation searching. Studies were included based on population (atrial fibrillation), reference test (CHA2DS2‐Vasc score), index test (CHA2DS2‐Vasc score + one or more quantifiable biomarkers) and outcome (evaluation of stroke risk or similar), while non‐English articles and secondary articles were excluded. A standardized extraction tool will be used with studies being synthesized using the best evidence. Bias risk will be performed using QUADAS‐2 with the Grading of Recommendations, Assessment, Development, and Evaluation approach (GRADE) being used to assess the overall quality of evidence.
Results: A total of 2568 articles were identified for screening, with 16 articles included. Of these, six included an individual biomarker (e.g. high sensitivity troponin, N‐terminal pro‐B‐type natriuretic peptide, IL‐6, von Willebrand factor, abnormal uric acid metabolism), six included a multi‐panel of biomarkers and four included either imaging specific or composite risk score. The accuracy (c‐statistic) across these studies was 71.76 ± 10.20% (95% CI 66.3–77.2), with a range of 58% (high sensitivity troponin) to 98.2% (multi‐panel of CRP, fibrinogen, and troponin I).
Supporting Documents
Conclusion: This review helps to define the improved diagnostic accuracy when adding biomarkers to the existing CHADVASC2 score in evaluating the risk of stroke in those with AF and aims to contribute to improved clinical decision making.

OP‐087‐2‐AF (TRACK 7 ‐ AF 9)
Statin is associated with a lower risk of heart failure in patients with atrial fibrillation
Jia‐Yi Huang1; Yap‐Hang Chan1; Yi‐Kei Tse1; Si‐Yeung Yu1; Hang‐Long Li1; Hung‐Fat Tse1; Gregory Y. H. Lip2
1 The University Of Hong Kong, Hong Kong, Hong Kong; 2University of Liverpool, Liverpool, United Kingdom
Objectives To evaluate the association between statin use and heart failure (HF) in patients with atrial fibrillation (AF).
Materials and Methods: Patients with newly diagnosed AF (n = 52,490) from 2010–2018 were included. An inverse probability of treatment weighting was used to balance baseline covariates between statin users (n = 23,239) and statin nonusers (n = 29,251). The primary outcome was incident HF. Cox proportional hazard models with competing risk regression were used to evaluate the risk of HF between statin users and nonusers.
Results: The median age of the cohort was 74.7 years and 47.3% were female. Over a median follow‐up of 5.1 years, incident HF occurred in 3673 (15.8%) statin users and 5595 (19.1%) statin nonusers. Statin use was associated with a 19% lower risk of HF (adjusted subdistribution hazard ratio [SHR] = 0.81, 95% CI [confidence interval]: 0.78–0.85, p < 0.001). Compared to short‐term use (3 months to <2 years), there was a stepwise reduction in the risk of incident HF among those with 2 to <4 years of statin use (SHR 0.86, 95%CI: 0.84–0.88, p < 0.001), 4 to <6 years of statin use (SHR 0.74, 95%CI: 0.72–0.76, p < 0.001) and ≥6 years of statin use (SHR 0.71, 95%CI: 0.69–0.74, p < 0.001). Subgroup analysis showed consistent reductions in the risk of HF with statin use.
Conclusion: Statin use was associated with a decreased risk of incident HF in a duration‐dependent manner among AF patients.
OP‐088‐2‐AF (TRACK 7 ‐ AF 9)
Association of discontinuing oral anticoagulants with clinical outcomes after atrial fibrillation catheter ablation
Daehoon Kim 1; Pil‐Sung Yang2; Eunsun Jang1; Hee Tae Yu1; Tae‐Hoon Kim1; Hui‐Nam Pak1; Moon‐Hyoung Lee1; Gregory Lip3; Jung‐Hoon Sung2; Boyoung Joung1
1 Yonsei University College Of Medicine, Seoul, South Korea; 2CHA Bundang Medical Center, CHA University, Seongnam, South Korea; 3University of Liverpool and Liverpool Heart & Chest Hospital, Seoul, South Korea
Objective: To evaluate associations between oral anticoagulant (OAC) discontinuation after atrial fibrillation (AF) catheter ablation and the risk of thromboembolic and bleeding complications.
Materials and Methods: This population‐based cohort study included AF patients with a CHA2DS2‐VASc score ≥2 receiving ≥8 weeks of anticoagulation after ablation in 2005–2015. The primary outcome was a net adverse clinical event (NACE), defined as a composite of ischemic stroke and major bleeding. Propensity overlap weighting was used to balance characteristics.
Results: Of 5583 included, 4398 (78.8%) discontinued OACs temporarily or permanently. During a median follow‐up of 3.8 years, a total of 309 NACEs occurred with weighted incidence rates of 1.37 and 2.00 per 100 person‐years among OAC nonusers and users, respectively. The HR was 0.85 (95% CI 0.66–1.10) for NACE when comparing no OAC use with OAC use. Among those without evidence of AF recurrence during follow‐up, no OAC use, compared with OAC use, was associated with lower risks of NACE (weighted HR 0.65, 95% CI 0.47–0.90) and major bleeding (weighted HR 0.58, 95% CI 0.37–0.89). Among those with AF recurrences, there were non‐significant trends toward an increased risk of NACE for OAC use compared with no OAC use (weighted HR 1.30, 95% CI 0.81–2.08).
Conclusion: Among patients with AF undergoing catheter ablation, there were no differences in risks of adverse outcomes between long‐term OAC use and nonuse. As long as there was no evidence of recurrence, OAC nonuse was associated with a positive net clinical outcome, driven by a decreased risk for major bleeding.
Supporting Documents

OP‐089‐2‐AF (TRACK 7 ‐ AF 9)
Cryo‐balloon pulmonary vein isolation vs high‐power, short‐duration vs conventional radiofrequency catheter ablation of atrial fibrillation
Hanjin Park; Je‐Wook Park; Daehoon Kim; Hee Tae Yu; Tae‐Hoon Kim; Jae‐Sun Uhm; Boyoung Joung; Moon‐Hyoung Lee; Hui‐Nam Pak
Yonsei University, College Of Medicine, Seoul, South Korea
Objectives: We examined the comparative efficacy and safety of cryo‐balloon pulmonary vein isolation (Cryo‐PVI), high‐power, short‐duration (HPSD) radiofrequency catheter ablation (RFCA), and conventional RFCA in patients with atrial fibrillation (AF).
Methods: This propensity‐score weighted study included 3036 participants who underwent their first AF ablation without empirical left atrial (LA) ablation. We compared procedural factors, early and late recurrence rates, complication rates, and post‐procedural heart rate variability (HRV) between the Cryo‐PVI (n = 527), HPSD‐RFCA (n = 653), and conventional RFCA (n = 1856).
Results: The procedural time was shortest in the Cryo‐PVI (73 min Cryo‐PVI vs 110 min HPSD vs 154 min conventional RFCA, p < 0.001), and the early recurrence was lowest in the HPSD‐RFCA (26.3% HPSD‐RFCA vs 30.4% Cryo‐PVI vs 29.9% conventional RFCA, p < 0.001). Major complication rates (Cryo‐PVI 3.4% vs HPSD‐RFCA 2.1% vs Conventional RFCA 2.5%, p = 0.203) and late recurrence did not significantly differ (log‐rank, p = 0.120) between groups. In subgroup analysis, HPSD‐RFCA revealed better rhythm outcomes compared to conventional RFCA among those with low mean heart rate (<77 bpm, weighted hazard ratio [HR] 0.58, 95% CI 0.38–0.90, p = 0.027), high rMSSD (≥26, weighted HR 0.55, 95CI: 0.27–0.93, p = 0.027), high LF component (≥13, weighted HR 0.46, 95CI 9.24–0.89, p = 0.021), and high LF/HF ratio (≥1.40, adjusted HR 0.55, 95% CI 0.31–0.96, p = 0.037).
Conclusion: Among participants who underwent first AF ablation without empirical LA ablation, Cryo‐PVI and HPSD‐RFCA showed shorter procedure time with similar major complication rates and overall rhythm outcome compared to conventional RFCA. HPSD‐RFCA showed the possibility for improved rhythm control compared to conventional RFCA in subgroups with high cardiac autonomic activity.
OP‐090‐2‐AF (TRACK 7 ‐ AF 9)
Lifetime risk of atrial fibrillation according to optimal, borderline, or elevated levels of risk factors
Hanjin Park 1; Daehoon Kim1; Eunsun Jang1; Hee Tae Yu1; Tae‐Hoon Kim1; Dong‐min Kim2; Jung‐Hoon Sung3; Hui‐Nam Pak1; Moon‐Hyoung Lee1; Pil‐Sung Yang3; Boyoung Joung1
1 Yonsei University, College Of Medicine, Seoul, South Korea; 2Dankook University, College of Medicine, Seoul, South Korea; 3CHA Bundang Medical Center, Seoul, South Korea
Objective: We aimed to examine the association between lifestyle risk factor burden and lifetime risk of AF using longitudinal data from the Korea NHIS‐HealS cohort and UK biobank.
Methods: A cluster of lifestyle risk factors including blood pressure, body mass index, smoking status, diabetes, alcohol consumption, and physical activity were assessed and classified as optimal, borderline, and elevated risk factor profiles. We estimated the lifetime risk of AF at index age 45 years to 85 years, accounting for the competing risk of death.
Results: There were 383,048 Korean and 292,499 UK White participants. The overall lifetime risk of AF in Korea and UK White was 16.5% vs 19.0%. The lifetime risk of AF among those with optimal risk factors in Korea and UK White were similar (UK White vs Korea; 9.1% vs 9.6%, p = 0.773). However, the lifetime of AF in UK White individuals became greater than Korean individuals among those with any elevated risk factor profile (UK White vs Korea; 20.6% vs 17.1%, p < 0.001). We found a greater difference in lifetime risk of AF between Korea and UK White with an increasing number of elevated risk factors (≥3 elevated risk factors; UK vs Korea, 27.2% vs 18.9%, p < 0.001).
Conclusions: The overall higher lifetime risk of AF in UK White might be related to a dramatic increased risk of incident AF in those with elevated risk factors compared to Korea. Our results potentially explain the observed higher incident AF in Western countries and emphasize the importance of risk factor management for the prevention of AF.
Supporting Documents

OP‐093‐V‐AF
Impact of health literacy and its interventions on health outcomes: A systematic review and Meta‐Analysis
Timothy Lathlean1,2,3; Don Kieu1; Kyle Franke1; Nathan O'Callaghan3; Mark Boyd1,2,4; Rajiv Mahajan 1,2,4
1 Adelaide Medical School, Faculty of Health and Medical Sciences, University Of Adelaide, Adelaide, Australia; 2South Australian Health and Medical Research Institute (SAHMRI), Adelaide, Australia; 3Commonwealth Science and Industrial Research Organisation (CSIRO), Adelaide, Australia; 4Lyell McEwin Hospital, Northern Adelaide Local Health Network, Adelaide, Australia
Objectives: To determine how the addition of health literacy interventions may generate additional benefits and impact quality of life and health outcomes for those with atrial fibrillation (AF).
Materials and Methods: Searches were carried out according to six databases (MEDLINE, EMBASE, Web of Science, CINAHL, Emcare, Cochrane library) alongside gray literature (Google Scholar). Studies were included if their evaluated interventions improved any dimension, typology, or aspect of health literacy. Citations were exported into Covidence for duplicate removal, and article screening. Extraction will occur using a standardized extraction tool and studies will be synthesized using best evidence synthesis. The Downs and Black's checklist will be used for the risk of bias and the assessment of the overall quality of evidence will utilize the Grading of Recommendations, Assessment, Development, and Evaluation approach (GRADE).
Results: A total of 2851 articles were identified for screening, with 59 included for quality assessment according to the Downs and Black checklist. The majority of articles involved randomized controlled trials or pre‐post studies. Health literacy interventions included brochures (n = 3), web‐ (n = 12), visual‐ (n = 10), and smartphone‐based (n = 14), to group sessions (n = 8) and specific integrated AF clinics (n = 12). General themes from these articles involved mostly improvements in AF knowledge, adherence/activation, and quality of life/clinical outcomes.
Conclusion: This review extends the concept of precision health to also include health literacy interventions. Further research with aims to clarify the impact of specific modes of interventions will greatly assist in the application of health literacy interventions in conjunction with precision health in those with AF.
OP‐095‐V‐AF
Clinical outcome of lesion size Index‐Guided High‐Power catheter ablation in patients with atrial fibrillation
Chi Cai; Jing Wang; Yan Yao; Wei Hua; Shu Zhang
Cardiac Arrhythmia Center, Fuwai Hospital, National Center for Cardiovascular Diseases, Chinese Academy of Medical Sciences and Peking Union Medical College, Beijing, China
Objectives: Our study sought to assess the clinical efficacy of high‐power (50 W) ablation guided by lesion size index (LSI‐guided HP) for pulmonary vein isolation (PVI) in atrial fibrillation (AF) patients and explore the potential predictors related to clinical outcome.
Materials and Methods: We consecutively included 186 AF patients who received LSI‐guided HP ablation for PVI at Fuwai hospital from June 2019 to October 2021. Baseline clinical characteristics, ablation data as well as long‐term clinical outcomes were evaluated.
Results: The incidence of overall first‐pass PVI was 83.9% (156/186) and PVI was achieved in all patients. A total of 11,883 lesions were analyzed, compared with ablation parameters of posterior walls, anterior walls had significantly lower contact force, longer ablation duration, larger Δ‐Imp, longer ILD, and higher LSI and FTI. The overall incidence of complications was 3.8%. During a mean follow‐up of 24.0 ± 8.4 months, freedom from AF recurrence off AADs was 87.1%. After adjusting for known factors, LSI and paroxysmal AF were significantly associated with decreased AF recurrence. The best cut‐off value of LSI for predicting AF recurrence was 4.69. Atrial arrhythmia‐free survival was greatest (96.6%) among paroxysmal AF and LSI ≥4.69 subjects, intermediate in persistent AF and LSI ≥4.69 (92.9%) and paroxysmal AF and LSI <4.69 (85.2%) patients, and worst (73.3%) in persistent AF and LSI <4.69 patients.
Conclusion: LSI‐guided HP ablation for PVI was efficient with relatively lower peri‐procedure complications and a favorable 2‐year arrhythmia‐free rate in AF patients. LSI ≥4.69 and paroxysmal AF are independently associated with decreased AF recurrence.
Supporting Documents

OP‐096‐V‐AF
Iterative computer simulation using personalized heart models based on LGE‐MRI enables minimal ablation for non‐paroxysmal atrial fibrillation
Kensuke Sakata; Ryan P. Bradley; Carolyna A. P. Yamamoto; Syed Yusuf Ali; Shane Loeffler; Adityo Prakosa; Eugene G. Kholmovski; Natalia A. Trayanova
Johns Hopkins University, Baltimore, United States
Objectives: Although pulmonary‐vein‐isolation (PVI) is often insufficient for termination of non‐paroxysmal atrial fibrillation (Non‐PAF), recently rotor modulation targeting AF drivers or substrates using LGE‐MRI‐based computer simulations has been described to improve a clinical outcome of Non‐PAF ablation. However, how to create optimal ablation lesions is still not well established because of ablation‐scar‐related iatrogenic‐atrial tachycardia (AT), often requiring additional linear ablation. Our goal is to establish the optimal method for rotor modulation.
Materials and Methods: Personalized computational modeling of AF ablation was performed in 12 Non‐PAF patient models based on fibrosis data from LGE‐MRI. All rotors induced after PVI were modulated with (1) substrate‐elimination strategy mimicking normal‐power ablation, creating transmural island‐like lesions and (2) substrate‐modification “trap” strategy, creating subtransmural or non‐island‐like lesions mimicking low‐power minimal‐ablation (figure). In each bi‐atrial model, inducibility and the difference between the two strategies were investigated by burst pacing from the same 40 atrial sites in both strategies.
Results: Nine patients had a total of 27 rotors after PVI. Ablations in both strategies were successful in rotor elimination. However, the incidence of iatrogenic‐AT was significantly higher in normal ablation than minimal ablation (63% vs. 26%; p = 0.004). All these iatrogenic‐ATs were eliminated by adding linear ablation connecting ablated lesion to a non‐conductive zone. Moreover, adding linear ablation occasionally induced a new rotor or eliminated another rotor.
Conclusions: Minimal ablation might be effective for both modifying rotor substrate and avoiding iatrogenic‐AT. Iterative computer simulation of ablation leads to the non‐excessive optimal strategy by not only reducing unnecessary additional linear ablation but achieving effective minimal ablation.
Supporting Documents

OP‐097‐V‐AF
Real‐world utilization of non–vitamin K antagonist Oral anticoagulants in Asian patients with atrial fibrillation
Rosa Wang 1; Chia‐Jui Chang2; Xin Ye1; Fang‐Ju Lin2
1 Daiichi Sankyo, Inc., Basking Ridge, United States of America; 2National Taiwan University, Taipei, Taiwan
Supporting Documents
Objectives: This study examined the real‐world utilization of non‐vitamin K antagonist oral anticoagulants (NOACs) in Asian patients with atrial fibrillation (AF) to understand prescribing patterns of treatment for stroke prevention in clinical practice.
Materials and Methods: Using a large Taiwan national insurance database, adults with AF and ≥1 pharmacy claim for edoxaban, apixaban, rivaroxaban, or dabigatran between June 2012 and June 2019 were identified. The first NOAC pharmacy claim was designated the index claim. Baseline patient characteristics were input into multinomial logistic regression models to identify factors associated with different NOAC use; dabigatran was the reference treatment as it was the first approved NOAC.
Results: A total of 95,417 patients were eligible, including 10,087 edoxaban, 13,468 apixaban, 38,515 rivaroxaban, and 33,347 dabigatran‐treated patients. Patients prescribed edoxaban or apixaban were more likely to be 85 years of age and older (OR [95% CI]: 1.20 [1.10–1.30] and 1.47 [1.37–1.59], respectively), have a bleeding history or predisposition (OR [95% CI]: 1.22 [1.13–1.32] and 1.20 [1.12–1.28]), renal disease (OR [95% CI]: 1.59 [1.47–1.73] and 1.77 [1.65–1.90]), or diabetes with chronic complications (OR [95% CI]: 1.23 [1.12–1.34] and 1.29 [1.19–1.39]) compared with patients prescribed dabigatran (Table).
Conclusion: In real‐world practice, there are notable differences in prescribing patterns of NOACs for stroke prevention among patients with AF in Taiwan. These differences may affect the effectiveness and safety profile of NOACs, although further research on other Asian countries and clinical outcomes is needed.
TABLE Determinants of NOAC use relative to dabigatran from multinomial logistic regression.
| Edoxaban, OR (95% CI) | Apixaban, OR (95% CI) | Rivaroxaban, OR (95% CI) | |||||
|---|---|---|---|---|---|---|---|
| Age | |||||||
| 18–64 | Reference | Reference | Reference | ||||
| 65–74 | 0.87† | (0.82–0.93) | 0.95 | (0.89–1.01) | 0.91† | (0.87–0.95) | |
| 75–79 | 0.79† | (0.73–0.86) | 0.92† | (0.86–0.99) | 0.90† | (0.86–0.95) | |
| 80–84 | 0.81† | (0.75–0.88) | 1.06 | (0.99–1.14) | 0.96 | (0.91–1.01) | |
| ≥85 | 1.20* | (1.10–1.30) | 1.47* | (1.37–1.59) | 1.19* | (1.13–1.26) | |
| Female | 1.05 | (1.00–1.10) | 1.11* | (1.06–1.16) | 1.10* | (1.06–1.13) | |
| Selective key comorbidities | |||||||
| Myocardial infarction | 1.05 | (0.86–1.28) | 1.11 | (0.94–1.32) | 1.25* | (1.11–1.42) | |
| Congestive heart failure | 0.87† | (0.82–0.92) | 0.94† | (0.90–0.99) | 1.04* | (1.00–1.08) | |
| Cerebral vascular disease | 0.67† | (0.61–0.74) | 0.81† | (0.74–0.88) | 0.82† | (0.77–0.87) | |
| Dementia | 1.07 | (0.96–1.18) | 1.09 | (1.00–1.19) | 1.08* | (1.01–1.15) | |
| Rheumatic disease | 1.63* | (1.44–1.84) | 1.42* | (1.27–1.59) | 1.09 | (1.00–1.20) | |
| Peptic ulcer | 0.82† | (0.76–0.88) | 0.88† | (0.82–0.93) | 0.97 | (0.92–1.01) | |
| Mild liver disease | 1.12* | (1.03–1.22) | 1.05 | (0.97–1.13) | 1.04 | (0.98–1.10) | |
| Diabetes without chronic complication | 0.88† | (0.83–0.93) | 0.95† | (0.90–1.00) | 0.95 | (0.91–0.98) | |
| Diabetes with chronic complication | 1.23* | (1.12–1.34) | 1.29* | (1.19–1.39) | 1.05 | (0.99–1.12) | |
| Hemiplegia or paraplegia | 0.78† | (0.66–0.91) | 0.93 | (0.82–1.05) | 1.01 | (0.93–1.11) | |
| Renal disease | 1.59* | (1.47–1.73) | 1.77* | (1.65–1.90) | 1.29* | (1.21–1.36) | |
| Cancer | 1.10* | (1.01–1.21) | 1.10* | (1.02–1.19) | 1.05 | (0.99–1.12) | |
| Severe liver disease | 2.09* | (1.30–3.35) | 1.54 | (0.97–2.43) | 1.53* | (1.06–2.21) | |
| Metastatic cancer | 1.17 | (0.90–1.52) | 1.17 | (0.93–1.47) | 1.22* | (1.02–1.46) | |
| Hypertension | 0.92† | (0.87–0.97) | 0.98 | (0.94–1.03) | 0.98 | (0.94–1.01) | |
| Stroke/TIA | 0.90 | (0.81–1.00) | 0.90† | (0.82–0.98) | 0.85† | (0.79–0.90) | |
| Bleeding history or predisposition | 1.22* | (1.13–1.32) | 1.20* | (1.12–1.28) | 1.05 | (0.99–1.10) | |
Less likely with dabigatran; †More likely with dabigatran; CI, confidence interval; NOAC, non–vitamin K antagonist oral anticoagulant; OR, odds ratio; TIA, transient ischemic attack.
OP‐098‐V‐AF
Electrophysiological findings of recurrent Tachyarrhythmias after trans‐thoracoscopic left atrial appendage excision plus atrial fibrillation ablation
Mingfang Li 1; Jimeng Yang1; Weidong Gu2; Buqing Ni2; Jiaxi Gu2; Yongfeng Shao2; Minglong Chen1
1 Division Of Cardiology, The First Affiliated Hospital Of Nanjing Medical University, Nanjing, 中国; 2Division Of Cardiac Surgery, The First Affiliated Hospital Of Nanjing Medical University, Nanjing, 中国
Objectives: This study aimed to describe the electrophysiological findings of recurrent atrial tachyarrhythmias (ATAs) after trans‐thoracoscopic left atrial appendage excision (LAAE) plus atrial fibrillation (AF) ablation.
Materials and Methods: This single‐center prospective observational study enrolled non‐valvular AF patients aged 18–80 years who underwent trans‐thoracoscopic LAAE plus AF ablation, and received the re‐do radiofrequency catheter ablation (RFCA) because of recurrence of ATAs.
Results: Between 2014 and 2021, 22 patients (11 males, age 60 ± 9 years) were included in the analysis. In 12 of them, reconnected conduction was identified along with the previous ablation lesions. Reconduction of right PV, left PV, and bilateral PVs was found in 1, 4, and 7 patients, respectively. In total, 27 PV gaps were identified. Eighteen PV gaps were located on the roof or at the bottom of the PV antrum. The residual PV gaps were eliminated with an additional ablation. Thirteen sustained ATs were mapped and ablated during the re‐do procedure, including peri‐mitral AT (n = 7), cavotricuspid isthmus‐dependent AT (n = 3), the remnant LAA‐related microreentrant AT (n = 1), roof‐dependent reentry AT (n = 1) and focal AT (n = 1). Two patients had non‐PV triggers. All ATs were terminated by stepwise ablation.
Conclusion: After surgical AF ablation, reconnected PVs were common in patients with recurrent ATAs. The residual gaps were mainly located in the roof and at the bottom of PVs, which was difficult to be covered by bipolar ablation. Reentry was the main mechanism of ATs.
OP‐099‐V‐AF
Pathological characteristics of thrombosis from different
Jincheng Jiao 1; Sheng Liu2; Chang Cui1; Yuezhou Cao2; Zhenyu Jia2; Haibin Shi2; Mingfang Li1; Minglong Chen1
1 Division Of Cardiology, The First Affiliated Hospital Of Nanjing Medical University, Nanjing, China; 2Division of Interventional Radiology, The First Affiliated Hospital of Nanjing Medical University, China, Nanjing, China
Objectives: This study aimed to describe pathological characteristics of thrombosis from different origins and assess their clinical impact.
Materials and Methods: Between July 2020 and January 2022, thrombi from the intracranial large vessel, coronary artery, and chambers of the heart were prospectively collected and stained. The proportion of red blood cells (RBC), platelets (PLT), fibrin, and white blood cells (WBC) in each thrombus was achieved using Orbit software. The modified Rankin scale score (mRS) at 90 days of patients with acute ischemic stroke (AIS) was recorded.
Results: We collected 146 thrombi from an intracranial artery, 12 from the coronary artery, and 9 from the intracardiac chambers. Among 146 AIS patients, 38 had atherosclerotic occlusion (LAA), 83 had cardiogenic embolism (CE), and 25 had CS. Compared with CE, thrombi in LAA had a higher proportion of platelets (22.7 ± 13.7% vs. 29.4 ± 17.0%, p = 0.024) and a lower proportion of red blood cells (RBC, 44.4 ± 19.3% vs. 32.4 ± 22.0%, p = 0.003). There was no significant correlation of component proportion in thrombosis between CS and CE or LAA. CE and intracardiac thrombi had a similar proportion of each component and so as in LAA and coronary artery thrombi. The good functional outcome (mRS 0–2) was achieved in 45.8% of patients with platelet‐riched thrombosis, 40.7% of patients with fibrin‐riched thrombosis, and 40.8% with RBC‐riched thrombosis, respectively.
Conclusion: CE had a higher proportion of RBC, while LAA was rich in platelet. Different proportions of each component in a thrombus may also have an impact on prognosis.
OP‐100‐V‐AF
Risk factors associated with major gastrointestinal bleeding in patients with atrial fibrillation
Hao Jiang 1; Hengli Zhang1; Ying Wu1; Duxiao Zhang2; Chen Cai1; Mingfang Li1; Minglong Chen1
1 Division of Cardiology, The First Affiliated Hospital Of Nanjing Medical University, Nanjing, 中国; 2Department of Clinical Pharmacology, The First Affiliated Hospital of Nanjing Medical University, Nanjing, 中国
Objectives: This study aimed to determine risk factors associated with major gastrointestinal bleeding (MGIB) in patients with atrial fibrillation (AF).
Materials and Methods: This was a single‐center retrospective cross‐sectional study. From January 2012 to March 2021, hospitalized AF patients with GIB were identified via electronic medical records. The antithrombotic strategy that patients received preceding GIB included no antithrombotic treatment, and treatment with oral anticoagulants (OACs), platelet inhibitors, and combinations of antithrombotic medications. The primary outcome measure was MGIB, which was defined as a decrease in the hemoglobin level of ≥2 g/dl or transfusion of ≥2 units of packed red cells or causing death. Potential risk factors associated with MGIB were evaluated using multivariable regression analysis.
Results: Of the 102 patients (mean age was 74.3 ± 11.1 years and 49.0% male), 13 (12.7%) were with valvular AF, and another 89 (87.3%) were with non‐valvular AF (mean CHA2DS2‐VASc score 3.5 ± 1.9 and mean HAS‐BLED score 2.5 ± 1.2). Before GIB, 59 (57.8%) patients used OACs, 34 (33.0%) used platelet inhibitors, and 19 (18.6%) received no antithrombotic therapy. Endoscopic examination in 67 patients confirmed peptic ulcers in 22 patients, new‐onset cancers in 8, and active cancers in 2. MGIB occurred in 61 (59.8%) patients. Peptic ulcer was significantly associated with MGIB (Odds ratio: 4.51, 95% CI 1.41–14.42, p = 0.007).
Conclusion: Peptic ulcer and gastrointestinal cancer were commonly identified in AF patients with GIB. Peptic ulcer was significantly associated with MGIB. Further investigation is needed to confirm whether antithrombotic treatment could increase the MGIB.
OP‐101‐V‐AF
The abnormal activation of the renin‐angiotensin‐aldosterone system in patients with idiopathic atrial fibrillation
Youmei Shen 1; Min Wang2; Min Sun2; Mingfang Li1; Minglong Chen1
1 Division Of Cardiology, The First Affiliated Hospital Of Nanjing Medical University, Nanjing, 中国; 2Division of Endocrinology, The First Affiliated Hospital of Nanjing Medical University, Nanjing, 中国
Objectives: To explore the relationship between RAAS and idiopathic atrial fibrillation (iAF).
Materials and Methods: This single‐center prospective observational study included patients with iAF. The subjects referred for catheter ablation (CA) because of PSVT during the same study period served as controls with normal sinus rhythm (NSR). All participants aged 18–60 years had no conventional cardiovascular risk factors or comorbidities. Adrenal adenomas were ruled out using a CT scan. Upright plasma aldosterone concentration (PAC), plasma renin activity (PRA), and angiotensin I and II concentrations were measured. ARR was the aldosterone‐renin ratio. All patients with iAF underwent CA. The primary outcome was the difference in RAAS activation between the two groups. The secondary outcome was the 6‐month recurrence of AF.
Results: Totally, 56 patients with iAF and 97 with NSR were included. Patients with iAF were older (48.0 ± 8.2 y vs. 39.0 ± 11.5 y, p < 0.001) and more likely to be male (76.8% vs. 46.4%, p < 0.001) than controls. Patients with iAF had a lower level of PRA (3.1 μg/L·h vs. 5.3 μg/L·h, p = 0.034) and angiotensin I (0.5 μg/L vs. 0.9 μg/L, p = 0.048), and higher ARR (3.7 vs. 2.5, p = 0.026). Differences in PAC and angiotensin II levels between the two groups were not significant. After adjusting for gender and age, logistic regression analysis showed that PRA <1 μg/L·h was associated with iAF (OR = 0.23, 95% CI: 0.07–0.75, p = 0.015). Baseline ARR was non‐significantly higher in 11 patients with recurrent AF.
Conclusion: Concealed activation of RAAS might be associated with iAF. Further research is needed to confirm this observation.
Supporting Documents
TABLE Baseline characteristics between patients with iAF and NSR. *Normally distributed continuous variables are expressed as mean ± standard deviation. Nonnormally distributed continuous variables are expressed as medians (interquartile range); †Categorical variables are expressed as n (%). Abbreviations, iAF, idiopathic atrial fibrillation; NSR, normal sinus rhythm; PRA, plasma renin activity; PAC, plasma aldosterone concentration; ARR, aldosterone‐renin ratio; LAD, left atrial diameter; LVDd, left ventricular diastolic diameter; LVEF, left ventricular ejection fraction.
| iAF (n = 56) | NSR (n = 97) | P值 | |
|---|---|---|---|
| Age, years* | 48.0 ± 8.2 | 39.0 ± 11.5 | < 0.001 |
| Male, n (%)† | 43 (76.8) | 45 (46.4) | < 0.001 |
| Current drinker, n (%)† | 0 (0.0) | 0 (0.0) | NA |
| PRA, μg/L·h* | 3.1 (1.0, 5.5) | 5.3 (1.9, 8.1) | 0.034 |
| PRA <1 μg/L·h, n (%) | 15 (26.8) | 7 (7.2) | 0.001 |
| Angiotensin I, μg/L* | 0.5 (0.3, 1.1) | 0.9 (0.4, 1.5) | 0.048 |
| Angiotensin II, pg/ml* | 58.8 (45.4, 73.5) | 58.3 (51.5, 77.1) | 0.273 |
| PAC, μg/L* | 102.6 (81.1, 126.1) | 112.9 (83.7, 128.8) | 0.373 |
| ARR* | 3.7 (2.1, 9.1) | 2.5 (1.5, 5.0) | 0.026 |
| ARR > 30, n (%)† | 3 (5.4) | 5 (5.2) | 0.957 |
| ARR > 10, n (%)† | 13 (23.2) | 10 (10.3) | 0.031 |
| Serum potassium, mmol/L* | 4.1 ± 0.3 | 4.1 ± 0.3 | 0.292 |
| LAD, mm* | 37.2 ± 5.2 | 31.3 ± 4.0 | 0.021 |
| LVDd, mm* | 47.7 ± 3.5 | 45.7 ± 3.7 | 0.599 |
| LVEF, %* | 63.0 ± 3.4 | 64.3 ± 2.1 | 0.162 |

FIGURE The difference in RAAS activation between patients with iAF and NSR.
OP‐102‐V‐AF
Use of oral anticoagulants before the FIRST thromboembolic event IN patients with atrial fibrillation
Ying Wu 1; Jiaojiao Shi1; Jincheng Jiao1; Zidun Wang1; Mingfang Li1; Minglong Chen1
1 Division of Cardiology, The First Affiliated Hospital of Nanjing Medical University, Nanjing, 中国
Objectives: This study aimed to investigate the status of anticoagulant use in patients with atrial fibrillation (AF).
Materials and Methods: This single‐center cross‐sectional study consecutively enrolled patients with non‐valvular AF and a history of thromboembolism from January 2017 to September 2021. A questionnaire survey of the patients/their family members was conducted to record data including clinical characteristics, the awareness of AF diagnosis, use of oral anticoagulants (OAC) before the first‐ever thromboembolic event, and reasons for not/discontinuation of using OACs. The index date was defined as the date of the first‐ever thromboembolic event.
Results: A total of 752 patients (mean age was 67.8 ± 10.6 years and 36.0% male) were enrolled in this study. Based on the awareness of the AF diagnosis before the index date, patients were divided into Group A (n = 443) with the awareness and Group B (n = 309) without the awareness. Among 402 patients at high stroke risk before their index date in Group A, 24.6% (99/402) of them had ever been treated with OACs. Of them, 43 had already discontinued OAC mainly because of minor bleeding. The majority of patients who were continuously anticoagulated only received the inappropriate treatment of OACs. In group A, 75.4% (303/402) of patients at high stroke risk never received anticoagulant therapy. The main reason was that patients were never informed that AF increased the risk of stroke.
Conclusion: Non‐valvular AF at high stroke risk was still undertreated with OACs. Measures should be taken for patients and doctors to increase the awareness of AF and AF‐related risks of stroke.
OP‐104‐V‐AF
Regional voltage and left Atrial Wall thickness of extra‐pulmonary vein triggers in the left atrium
In Jae Park; Daehoon Kim; Hee Tae Yu; Tae‐Hoon Kim; Jae‐Sun Uhm; Boyoung Joung; Moon‐Hyoung Lee; Hui‐Nam Pak
Yonsei University College of Medicine, Yonsei University Health System, Seoul, South Korea
Objectives: The mechanism of extra‐pulmonary vein trigger (ExPVT) is not clearly defined. We investigated whether the voltage and left atrial wall thickness (LAWT) of each region of left atrium (LA) is associated with ExPVT.
Materials and Methods: We included 1696 patients who underwent de novo catheter ablation, isoproterenol provocation, LA voltage mapping during the procedure, and protocol‐based rhythm follow‐up. ExPVT was observed in 181 patients (10.7%; 60 LA, 99 RA, 15 biatrial, and 7 unmappable). Among 75 patients who showed ExPVT[LA] and ExPVT[Biatrial], 62 patients had LA voltage data, and bipolar, unipolar LA voltage, and LAWT were compared by the presence of ExPVT in each LA region.
Results: The existence of ExPVT was independently associated with low LA voltage (OR 0.68 [0.47–0.98], p = 0.0399). The existence of ExPVT showed significantly higher AF recurrence than their counterpart (HR 1.87 [1.48–2.37], p < 0.001, Log‐rank p < 0.001). The presence of ExPVT did not show any statistical significance in terms of bipolar, unipolar LA voltage in any of the total 9 LA regions (septum, posterior‐inferior, LA appendage, peri‐mitral, veno‐atrial, anterior, right LA roof, left LA roof, septum plus posterior‐inferior plus anterior), nor in terms of LAWT in total six regions (anterior, LA appendage, posterior, posterior‐inferior, LLI, septum).
Conclusion: The presence of ExPVT was associated with low LA voltage and poor rhythm outcome after AFCA, but LA voltage and LAWT did not show any regional difference in LA, respectively.
Supporting Documents

FIGURE 1 Comparison of Bipolar LA Voltage by the existence of ExPVT in each LA region.

FIGURE 2 Comparison of Unipolar LA Voltage by the existence of ExPVT in each LA region.

FIGURE 3 Comparison of LA wall thickness by the existence of ExPVT in each LA region.
TABLE 1 Baseline clinical and echocardiographic characteristics of patients who underwent AFCA with isoproterenol provocation, left atrial (LA) voltage mapping (Vm), and protocol‐based rhythm follow‐up
| Overall | No‐ExPVT | ExPVT | p‐Value | |
|---|---|---|---|---|
| (n = 1696) | (n = 1515) | (n = 181) | ||
| Age, (years) | 60.0 [52.0;67.0] | 60.0 [52.0;67.0] | 62.0 [55.0;68.0] | 0.016 |
| Male, n (%) | 1222 (72.1) | 1111 (73.3) | 111 (61.3) | 0.001 |
| Paroxymal Atrial Fibrillation, n (%) | 1091 (64.7) | 980 (65.0) | 111 (62.0) | 0.474 |
| Comorbidities, n (%) | ||||
| Heart failure | 236 (13.9) | 209 (13.8) | 27 (14.9) | 0.765 |
| Hypertension | 768 (45.3) | 683 (45.1) | 85 (47.0) | 0.688 |
| Diabetes mellitus | 267 (15.74) | 237 (15.62) | 30 (16.6) | 0.828 |
| Stroke | 202 (11.9) | 182 (12.07) | 20 (11.0) | 0.797 |
| CHA2DS2‐VASc score | 1.0 [1.0;3.0] | 1.0 [1.0;3.0] | 2.0 [1.0;3.0] | 0.189 |
| Echocardiography | ||||
| LA dimension, mm (n = 1696) | 41.0 [37.0;46.0] | 41.0 [37.0;46.0] | 41.0 [37.0;45.0] | 0.736 |
| LA volume index, ml/m 2 (n = 1696) | 35.3 [28.3;44.6] | 35.0 [28.2;44.1] | 39.2 [29.7;48.3] | 0.001 |
| LV ejection fraction, % (n = 1696) | 64.0 [59.0;68.0] | 64.0 [59.0;68.0] | 64.0 [59.0;67.0] | 0.742 |
| EEm (n = 1696) | 9.1 [7.6;12.0] | 9.0 [7.4;12.0] | 9.4 [8.0;12.0] | 0.126 |
| LV mass index, g/ m2 (n = 1696) | 91.5 [79.4;104.2] | 91.5 [79.4;104.3] | 92.3 [79.4;104.0] | 0.430 |
| Pericardial fat volumes (n = 1696) | 102.6 [71.5;143.9] | 103.5 [72.0;146.2] | 94.0 [65.6;134.1] | 0.052 |
| LA voltage | 1.4 [1.0;1.9] | 1.5 [1.0;2.0] | 1.3 [0.8;1.7] | 0.001 |
| LA pressure | ||||
| Peak pressure, AF (n = 1696) | 22.0 [17.0;28.0] | 22.0 [17.0;28.0] | 22.0 [16.0;28.0] | 0.902 |
| Mean pressure, AF (n = 1696) | 12.0 [9.0;16.0] | 12.0 [9.0;16.0] | 12.0 [8.0;16.0] | 0.529 |
| Peak pressure, SR (n = 1696) | 21.0 [15.0;28.0] | 21.0 [15.0;27.0] | 21.0 [16.0;29.0] | 0.192 |
| Mean pressure, SR (n = 1696) | 12.0 [8.0;16.0] | 11.0 [8.0;16.0] | 12.0 [8.0;17.0] | 0.295 |
| RVSP | 26.0 [22.0;30.0] | 26.0 [22.0;30.0] | 26.0 [23.0;30.0] | 0.158 |
ExPVT, extrapulmonary vein trigger; LA, left atrium; LV, left ventricle; Eem, ratio of the early diastolic mitral inflow velocity (E) to the early diastolic mitral annular velocity (Em); AF, atrial fibrillation; SR, sinus rhythm; RVSP, right ventricle systolic pressure.
TABLE 2 Univariate and multivariate analysis of predictors for the existence of ExPVT
| Univariate | Multivariable | |||
|---|---|---|---|---|
| OR (95% CI) | p‐Value | OR (95% CI) | p‐Value | |
| Age, (years) | 1.02 (1.00–1.03) | 0.0109 | 1.01 (0.99–1.03) | 0.4146 |
| Male, n (%) | 0.58 (0.42–0.79) | <0.0001 | 0.75 (0.47–1.20) | 0.2288 |
| Paroxymal Atrial Fibrillation, n (%) | 0.88 (0.64–1.21) | 0.4245 | ||
| Comorbidities, n (%) | ||||
| Heart failure | 1.10 (0.71–1.69) | 0.6803 | ||
| Hypertension | 1.08 (0.79–1.47) | 0.6313 | ||
| Diabetes mellitus | 1.07 (0.71–1.62) | 0.7452 | ||
| Stroke | 0.91 (0.56–1.48) | 0.7053 | ||
| CHA2DS2‐VASc score | 1.06 (0.97–1.17) | 0.2032 | ||
| Echocardiography | ||||
| LA dimension, mm | 1.00 (0.97–1.02) | 0.7055 | ||
| LA volume index, ml/m2 | 1.02 (1.01–1.03) | 0.0025 | ||
| LV ejection fraction, % | 1.00 (0.98–1.02) | 0.6923 | ||
| EEm | 1.03 (0.99–1.06) | 0.1505 | ||
| LV mass index, g/m2 | 1.00 (1.00–1.01) | 0.4001 | ||
| Pericardial fat volumes | 1.00 (0.99–1.00) | 0.0438 | 1.00 (0.99–1.00) | 0.1796 |
| LA voltage | 0.70 (0.55–0.88) | 0.0027 | 0.68 (0.47–0.98) | 0.0399 |
| LA pressure | ||||
| Peak pressure, AF | 1.00 (0.98–1.02) | 0.8003 | ||
| Mean pressure, AF | 0.99 (0.96–1.02) | 0.5352 | ||
| Peak pressure, SR | 1.01 (1.00–1.03) | 0.1582 | ||
| Mean pressure, SR | 1.01 (0.98–1.03) | 0.5014 | ||
| RVSP | 1.01 (0.99–1.03) | 0.4605 | ||
| HRV (post‐AFCA 3 mo) | ||||
| LF | 1.01 (1.00–1.02) | 0.1340 | ||
| HF | 1.03 (1.00–1.05) | 0.0211 | 1.02 (0.99–1.04) | 0.1914 |
| LF/HF | 0.91 (0.62–1.35) | 0.6512 | ||
ExPVT, extrapulmonary vein trigger; LA, left atrium; LV, left ventricle; Eem, ratio of the early diastolic mitral inflow velocity (E) to the early diastolic mitral annular velocity (Em); AF, atrial fibrillation; RVSP, right ventricle systolic pressure; HRV, heart rate variabilities; LF, low‐frequency component; HF, high‐frequency component.
TABLE 3 Clinical rhythm outcome comparison between no ExPVT and ExPVT group
| Overall | No‐ExPVT | ExPVT | p‐Value | |
|---|---|---|---|---|
| (n = 1696) | (n = 1515) | (n = 181) | ||
| Follow‐up duration, mo | 42.0 [21.0;78.0] | 43.0 [21.0;80.0] | 32.0 [17.5;54.0] | 0.001 |
| AAD use | ||||
| AADs use at discharge, n (%) | 325 (19.2) | 247 (16.3) | 78 (43.1) | <0.001 |
| AADs after 3 mo, n (%) | 535 (32.8) | 427 (29.3) | 108 (61.0) | <0.001 |
| AADs at the final follow‐up, n (%) | 486 (29.3) | 403 (27.2) | 83 (46.1) | <0.001 |
| Early recurrence, n (%) | 470 (28.3) | 375 (25.3) | 95 (52.8) | <0.001 |
| Recurrence type, AF; n (% in early recur) | 284 (60.4) | 218 (58.0) | 66 (69.5) | 0.054 |
| Recurrence type, AT; n (% in early recur) | 187 (39.8) | 158 (42.0) | 29 (30.5) | 0.054 |
| Clinical recurrence, n (%) | 562 (33.8) | 479 (32.3) | 83 (46.1) | <0.001 |
| Recurrence type, AF; n (% in recur) | 385 (68.5) | 332 (69.3) | 53 (63.9) | 0.390 |
| Recurrence type, AT; n (% in recur) | 177 (31.5) | 147 (30.7) | 30 (36.1) | 0.390 |
| Cardioversion, n (% in recur/% overall) | 226 (40.2/13.6) | 187 (39.0/12.6) | 39 (47.0/21.7) | 0.001 |
| HRV (post‐AFCA 3 mo) | ||||
| Mean heart rate, bpm | 74.0 [66.0;81.0] | 74.0 [67.0;82.0] | 70.0 [63.0;80.0] | 0.001 |
| HF | 5.2 [3.7;8.3] | 5.1 [3.7;8.1] | 6.1 [4.1;11.1] | 0.015 |
| rMSSD | 15.0 [11.0;23.0] | 14.0 [11.0;23.0] | 17.0 [11.0;34.0] | 0.010 |
| LF | 5.5 [3.3;9.9] | 5.4 [3.3;9.7] | 6.5 [3.6;11.6] | 0.037 |
| LF/HF | 1.0 [0.8;1.4] | 1.0 [0.7;1.4] | 1.0 [0.8;1.3] | 0.917 |
ExPVT, extrapulmonary vein trigger; atrial fibrillation; AAD, antiarrhythmic drug; AF, atrial fibrillation; AFCA, atrial fibrillation catheter ablation; AT, atrial tachycardia; HF, high‐frequency component; HRV, heart rate variabilities; rMSSD, root‐mean‐square of differences between successive NN intervals; LF, low‐frequency component.
TABLE 4 Comparison of baseline clinical and echocardiographic characteristics of ExPVT[LA], ExPVT[RA], and ExPVT[Biatrial] groups
| LA | RA | Biatrial | p‐Value | |
|---|---|---|---|---|
| (n = 60) | (n = 99) | (n = 15) | ||
| Age, (years) | 62.6 ± 9.3 | 60.4 ± 10.4 | 60.5 ± 11.2 | 0.398 |
| Male, n (%) | 41 (68.3) | 58 (58.6) | 9 (60.0) | 0.464 |
| Paroxymal Atrial Fibrillation, n (%) | 34 (56.7) | 63 (64.9) | 9 (60.0) | 0.579 |
| Comorbidities, n (%) | ||||
| Heart failure | 10 (16.7) | 14 (14.1) | 3 (20.0) | 0.805 |
| Hypertension | 31 (51.7) | 50 (50.5) | 2 (13.3) | 0.020 |
| Diabetes mellitus | 18 (30.0) | 7 (7.1) | 3 (20.0) | 0.001 |
| Stroke | 6 (10.0) | 14 (14.1) | 0 (0.0) | 0.251 |
| CHA2DS2‐VASc score | 2.0 [1.0; 3.0] | 2.0 [1.0; 3.0] | 1.0 [1.0; 2.0] | 0.472 |
| Echocardiography | ||||
| LA dimension, mm (n = 1575) | 41.7 ± 7.1 | 41.5 ± 5.9 | 40.8 ± 7.0 | 0.893 |
| LA volume index, ml/m2 (n = 1575) | 37.2 [28.8;47.1] | 39.7 [31.6;49.0] | 39.9 [34.0;48.0] | 0.805 |
| LV ejection fraction, % (n = 1575) | 63.0 [58.0;67.0] | 64.0 [58.5;67.0] | 66.0 [63.5;69.5] | 0.095 |
| EEm (n = 1575) | 9.3 [8.1;12.0] | 9.9 [8.0;13.0] | 9.4 [8.2;11.7] | 0.907 |
| LV mass index, g/m2 (n = 1575) | 93.2 [81.1;107.8] | 93.3 [78.6;103.3] | 88.9 [70.2;102.8] | 0.537 |
| Pericardial fat volumes (n = 1575) | 100.8 [61.6;140.0] | 93.0 [67.6;129.3] | 95.5 [73.7;124.8] | 0.756 |
| LA voltage | 1.4 [0.8; 1.9] | 1.3 [0.8; 1.7] | 1.0 [0.8; 1.2] | 0.153 |
| LA pressure | ||||
| Peak pressure, AF | 25.0 [20.0;33.0] | 20.0 [14.0;26.5] | 22.0 [17.5;26.5] | 0.005 |
| Mean pressure, AF | 14.0 [11.0;17.0] | 10.5 [7.5;14.5] | 12.0 [10.5;17.0] | 0.020 |
| Peak pressure, SR | 26.5 [18.0;33.5] | 19.0 [15.0;26.0] | 22.0 [20.0;30.0] | 0.001 |
| Mean pressure, SR | 14.0 ± 6.4 | 11.1 ± 5.6 | 14.9 ± 5.9 | 0.004 |
| RVSP | 28.0 [23.0;31.5] | 26.0 [23.0;29.0] | 25.5 [21.0;35.0] | 0.385 |
ExPVT, extrapulmonary vein trigger; LA, left atrium; LV, left ventricle; Eem, ratio of the early diastolic mitral inflow velocity (E) to the early diastolic mitral annular velocity (Em); AF, atrial fibrillation; SR, sinus rhythm; RVSP, right ventricle systolic pressure.
TABLE 5–1 Comparison of bipolar LA voltage of LA sections by the presence of ExPVT.
| ExPVT (mV) | No ExPVT (mV) | p‐Value | |
|---|---|---|---|
|
Septum (n = 62) |
0.9 [0.5;1.4] (n = 29) |
1 [0.7;1.2] (n = 33) |
0.769 |
|
Posterior‐inferior LA (n = 62) |
0.8 [0.4;1.5] (n = 18) |
1.1 [0.7;2.1] (n = 44) |
0.116 |
|
LA appendage (n = 60) |
2.1 [1.4;2.9] (n = 34) |
2.1 [1.9;3.3] (n = 26) |
0.519 |
|
Peri‐mitral area (n = 62) |
0.4 [0.4;0.8] (n = 7) |
0.8 [0.5;1.1] (n = 55) |
0.306 |
|
Veno‐atrial (n = 62) |
0.6 [0.2;1.5] (n = 17) |
0.7 [0.4;1.5] (n = 45) |
0.819 |
|
Anterior LA (n = 62) |
0.5 [0.2;1.4] (n = 14) |
1.0 [0.6;1.5] (n = 48) |
0.070 |
|
LA Roof, right (n = 62) |
0.2 [0.1;0.4] (n = 3) |
0.1 [0.1;0.3] (n = 59) |
0.555 |
|
LA Roof, left (n = 62) |
0.2 [0.1;1.4] (n = 10) |
0.3 [0.1;0.8] (n = 52) |
0.626 |
|
Septum, Posterior‐inferior LA, Anterior LA (n = 62) |
1.1 [0.5;1.6] (n = 44) |
1.1 [0.8;1.6] (n = 18) |
0.385 |
TABLE 5–2 Comparison of unipolar LA voltage of LA sections by the presence of ExPVT.
| ExPVT (mV) | No ExPVT (mV) | p‐Value | |
|---|---|---|---|
|
Septum (n = 51) |
1.5 [1.0;2.1] (n = 28) |
1.3 [1.1;1.7] (n = 23) |
0.646 |
|
Posterior‐inferior LA (n = 51) |
1.7 [1.0;2.1] (n = 14) |
2.0 [1.2;2.4] (n = 37) |
0.493 |
|
LA appendage (n = 51) |
2.7 [2.0;3.3] (n = 31) |
2.5 [2.2;3.6] (n = 19) |
0.843 |
|
Peri‐mitral area (n = 51) |
1.3 [1.0;2.8] (n = 6) |
1.6 [1.0;2.2] (n = 45) |
0.804 |
|
Veno‐atrial (n = 51) |
1.8 [0.9;3.5] (n = 14) |
1.5 [1.0;1.8] (n = 37) |
0.409 |
|
Anterior LA (n = 51) |
1.0 [0.6;2.0] (n = 14) |
1.8 [1.5;2.5] (n = 37) |
0.061 |
|
LA Roof, right (n = 51) |
0.6 [0.4;1.0] (n = 3) |
0.8 [0.6;1.2] (n = 48) |
0.368 |
|
LA Roof, left (n = 51) |
0.9 [0.5;2.9] (n = 10) |
0.9 [0.7;1.8] (n = 41) |
0.898 |
|
Septum, Posterior‐inferior LA, Anterior LA (n = 51) |
1.7 [1.0;2.2] (n = 26) |
1.8 [1.2;2.2] (n = 25) |
0.510 |
TABLE 5–3 Comparison of LA wall thickness of LA sections by the presence of ExPVT.
| ExPVT (mm) | No ExPVT (mm) | p‐Value | |
|---|---|---|---|
|
Anterior wall (n = 62) |
1.9 [1.7;2.2] (n = 14) |
2.0 [1.5;2.2] (n = 48) |
0.926 |
|
LA appendage (n = 60) |
2.1 ± 0.4 (n = 34) |
2.1 ± 0.5 (n = 26) |
0.667 |
|
Posterior wall (n = 62) |
1.9 [1.8;2.1] (n = 17) |
1.8 [1.6;2.1] (n = 45) |
0.636 |
|
Posterior‐inferior wall (n = 62) |
1.6 [1.4;1.8] (n = 18) |
1.7 [1.4;2.0] (n = 44) |
0.566 |
|
LLI (n = 62) |
2.1 ± 0.5 (n = 35) |
2.3 ± 0.5 (n = 26) |
0.265 |
|
Septum (n = 62) |
2.8 [2.2;2.9] (n = 29) |
2.5 [2.1;2.8] (n = 33) |
0.129 |
OP‐105‐2‐BS (TRACK 7 ‐ BS)
New mini‐pigs atrial fibrillation model with the endocardial approach by CRT Bi‐electrode atrial pacing
Elizaveta Fisher; Denis Losic; Vladimir Beloborodov; Vladimir Murtazin; Alexey Filippenko; Igor Micheenko; Vitaliy Shabanov; Alexander Romanov
Meshalkin National Medical Research Center, Novosibirsk, Russian Federation
Objectives: To evaluate the model of atrial fibrillation (AF) in mini‐pigs with endocardial approach implantation of CRTp using bi‐electrodes pacing through RV/LV connectors. However, the existing method using epicardial stimulation needs open heart surgery and long recovery of the animals.
Materials and Methods: All surgical interventions were mini‐invasive and were conducted under general anesthesia. CRTp was implanted endocardial using an X‐ray. The first electrode was fixed in the right atrial appendage. The second one in the interatrial septum. Both of them were connected with CRTp through RV/LV. Bi‐electrode atrial stimulation was realized during a week with a basic pace of 150 bpm and a delay between electrodes of 80 ms (mean 450 bpm), which corresponds to the heart rate (HR) of AF. An electrophysiological study was performed during the experiment to analyze the cardiac conduction system. AF inducibility was evaluated before and after stimulation.
Results: A series of experiments demonstrated that there were no complications. One of the three pigs was able to induce a non‐sustained paroxysm of AF before permanent pacing. After pacing we noted a tendency to increase the baseline HR (average frequency from 94 ± 8 to 98 ± 8 bpm). A non‐sustained paroxysm of AF was able to induce in all cases. The sustained AF with 92 min burden was induced in one pig.
Conclusion: Endocardial bi‐electrode pacing of the atria in mini‐pigs has proven to be safe. The above AF model increases AF inducibility. The proposed model can be considered an alternative to epicardial stimulation.
RSF № 22–25‐00672
Supporting Documents

OP‐105a‐V‐AF
Benefit from additional substrate modification in older female patients with paroxysmal atrial fibrillation
Nan Wu
The First Affiliated Hospital Of Nanjing Medical University, Nanjing, China
Abstract submitted under supporting document.
Supporting Documents
Objectives: Female gender has long been recognized to present a higher burden of low‐voltage area (LVA), and tend to have an increased recurrence rate than male after circumferential pulmonary vein isolation (CPVI). However, the benefit of additional LVA modification in female patients with atrial fibrillation remains unknown. This report describes outcomes according to sex at entry STABLE‐SR‐III trial.
Methods: Patients aged 65–80 years were randomly assigned to either CPVI plus LVA modification during sinus rhythm (STABLE‐SR) group or the “golden‐standard” CPVI alone group. The primary outcome was freedom from atrial arrhythmias lasting for ≥30 s after a single ablation procedure.
Results: Of 414 patients included in the STABLE‐SR‐III, 204 (49.3%) were female, mean age was 70.5 ± 4.7 years. Females demonstrated significantly higher LVA prevalence (51.5% vs. 32.9%, p = 0.000) and burden [5.6% (2.6–11.3) vs. 2.6% (1.7–5.0), p = 0.000] than males. Female sex, age, and large left atrial diameter were independent predictors of LVA. For the primary outcome, additional LVA ablation was associated with a 62% reduction in atrial arrhythmias recurrence for females (adjusted hazard ratio 0.38; 95% CI 0.19–0.76). Females with LVA who received CPVI alone had significantly higher recurrence rate than those females without LVA (HR 2.31 [95% CI, 1.17–4.59], p = 0.019) and those females with LVA receiving substrate modification (HR 3.88 [95% CI, 1.77–8.50], p = 0.003).
Conclusions: Female sex was found to have a higher LVA prevalence, LVA burden, and greater benefit of additional LVA modification than the male. Additional LVA ablation has emerged as a promising solution to improve the success rate in this population.
Key words: Paroxysmal atrial fibrillation; Catheter ablation; Low voltage area; Female gender.
TABLE 1 Baseline Characteristics
| Characteristics | Females, n = 204 | Males, n = 210 | p‐Value |
|---|---|---|---|
| Age, years | 70.5 ± 4.7 | 70.6 ± 3.9 | 0.744 |
| AF duration, months | 24 (6.0–48.0) | 12 (3.0–36.0) | 0.028 |
| BMI, kg/m2 | 24.7 ± 3.2 | 24.4 ± 3.1 | 0.698 |
| <25, n (%) | 120 (60.6) | 125 (62.5) | |
| ≥25, n (%) | 78 (39.4) | 75 (37.5) | |
| Comorbidities, n (%) | |||
| Hypertension | 127 (62.3) | 128 (61.0) | 0.785 |
| Diabetes | 32 (15.7) | 37 (17.6) | 0.598 |
| CAD | 47 (23.0) | 49 (23.3) | 0.943 |
| Stroke or TIA | 11 (5.4) | 25 (11.9) | 0.019 |
| Congestive heart failure | 1 (0.5) | 2 (1.0) | 1.000 |
| COPD | 1 (0.5) | 6 (2.9) | 0.122 |
| OSAS | 2 (1.0) | 1 (0.5) | 0.248 |
| NYHA functional class | 0.399 | ||
| I | 189 | 192 | |
| II | 7 | 4 | |
| III | 0 | 1 | |
| CHA2DS2‐VA score, n (%) | 0.773 | ||
| 1 | 49 | 46 | |
| 2 | 80 | 77 | |
| 3 | 48 | 53 | |
| >3 | 27 | 34 | |
| LAD, mm | 38.5 ± 5.2 | 39.0 ± 5.5 | 0.307 |
| LVEF, % | 62.6 ± 4.9 | 62.3 ± 5.7 | 0.652 |
| Medication use, n (%) | |||
| Class I AAD | 38 | 36 | 0.693 |
| Class III AAD | 54 | 62 | 0.489 |
| ACEI or ARB | 56 | 61 | 0.718 |
| Beta blocker | 65 | 69 | 0.829 |
| CCB | 38 | 28 | 0.141 |
| Digoxin | 1 | 3 | 0.623 |
AAD, denotes antiarrhythmic drugs; ACEI, angiotensin‐converting enzyme inhibitors; AF, atrial fibrillation; ARB, angiotensin receptor blocker; BMI, body mass index; CAD, coronary artery disease; CCB calcium channel blocker; COPD, chronic obstructive pulmonary disease; CPVI, circumferential pulmonary vein isolation; LAD, left atrial diameter; LVEF, left ventricular ejection fraction; NYHA, New York Heart Association heart failure classification; OSAS, obstructive sleep apnoea syndrome; TIA, transient ischaemic atta.
Plus‐minus values are means ±SD.

FIGURE 1 Properties of a low‐voltage area in females and males.


FIGURE 2 Kaplan–Meier survival curve of the freedom from atrial tachyarrhythmia recurrence after a single procedure.

Supplementary TABLE 1 Baseline Characteristics in Female Patients.
| Characteristics | STABLE‐SR, n = 102 | CPVI alone, n = 102 | p‐Value |
|---|---|---|---|
| Age, years | 70.0 (67.4–74.01) | 69.3 (66.8–73.3) | 0.308 |
| AF duration, months | 24 (6.0–60.3) | 24 (6.8–37.3) | 0.257 |
| BMI, kg/m2 | 24.2 ± 3.4 | 24.6 ± 3.0 | 0.361 |
| <25, n (%) | 38 (39.2) | 40 (39.6) | |
| ≥25, n (%) | 59 (60.8) | 61 (60.4) | |
| Comorbidities, n (%) | |||
| Hypertension | 58 (56.9) | 69 (67.7) | 0.112 |
| Diabetes | 14 (13.7) | 18 (17.7) | 0.441 |
| CAD | 22 (21.6) | 25 (24.5) | 0.618 |
| Stroke or TIA | 5 (4.9) | 6 (5.9) | 0.757 |
| Congestive heart failure | 0 (0.0) | 1 (1.0) | 1.000 |
| COPD | 0 (0.0) | 1 (1.0) | 1.000 |
| OSAS | 0 (0.0) | 0 (0.0) | / |
| NYHA functional class | 0.445 | ||
| I | 96 (98.0) | 93 (94.9) | |
| II | 2 (2.0) | 5 (5.1) | |
| III | 0 (0.0) | 0 (0.0) | |
| CHA2DS2‐VA score, n (%) | 0.169 | ||
| 1 | 31 (30.4) | 18 (17.7) | |
| 2 | 35 (34.3) | 45 (44.1) | |
| 3 | 24 (23.5) | 24 (23.5) | |
| >3 | 12 (11.8) | 15 (14.7) | |
| LAD, mm | 39 (35–42) | 38 (35–42) | 0.978 |
| LVEF, % | 62.75 ± 4.58 | 62.37 ± 5.27 | 0.587 |
| Medication use, n (%) | |||
| Class I AAD | 17 (16.7) | 21 (20.6) | 0.472 |
| Class III AAD | 27 (26.5) | 27 (26.5) | 1.000 |
| ACEI or ARB | 24 (23.5) | 32 (31.4) | 0.209 |
| Beta blocker | 33 (32.4) | 32 (31.4) | 0.881 |
| CCB | 19 (18.6) | 19 (18.6) | 1.000 |
| Digoxin | 0 (0.0) | 1 (1.0) | 1.000 |
AAD, denotes antiarrhythmic drugs; ACEI, angiotensin‐converting enzyme inhibitors; AF, atrial fibrillation; ARB, angiotensin receptor blocker; BMI, body mass index; CAD, coronary artery disease; CCB calcium channel blocker; COPD, chronic obstructive pulmonary disease; CPVI, circumferential pulmonary vein isolation; LAD, left atrial diameter; LVEF, left ventricular ejection fraction; NYHA, New York Heart Association heart failure classification; OSAS, obstructive sleep apnoea syndrome; TIA, transient ischaemic attack.
Plus‐minus values are means ±SD.
Supplementary TABLE 2 Hazard ratio for freedom from atrial tachyarrhythmia recurrence after adjustment of baseline characteristics in female patients.
| CPVI alone | STABLE‐SR | p‐Value | |
|---|---|---|---|
| HR (95% CI), Model 1 | 1 (reference) | 0.366 (0.183–0.731) | 0.004 |
| HR (95% CI), Model 2 | 1 (reference) | 0.368 (0.183–0.737) | 0.005 |
| HR (95% CI), Model 3 | 1 (reference) | 0.379 (0.189–0.762) | 0.006 |
Model 1: adjusted for AF duration.
Model 2: adjusted for model 1 covariates plus baseline hypertension.
Model 3: adjusted for model 2 covariates plus baseline CHA2DS2‐VA score.
Supplementary TABLE 3 Baseline Characteristics in Female Patients.
| Characteristics | Subgroup A, n = 50 | Subgroup B, n = 55 | Subgroup C, n = 99 | p‐Value |
|---|---|---|---|---|
| Age, years | 71.5 (67.6–74.5) | 71.1 (66.6–74.7) | 68.5 (66.8–72.0) | 0.042 |
| AF duration, months | 25.5 (12–74.5) | 24 (6–48) | 24 (6–48) | 0.175 |
| BMI, kg/m2 | 23.4 (21.2–26.7) | 24.3 (22.9–27.1) | 24.4 (22.1–26.5) | 0.266 |
| <25, n (%) | 17 (35.4) | 21 (38.9) | 40 (41.7) | |
| ≥25, n (%) | 31 (64.6) | 33 (61.1) | 56 (58.3) | |
| Comorbidities, n (%) | ||||
| Hypertension | 35 (70.0) | 33 (60.0) | 59 (59.6) | 0.429 |
| Diabetes | 10 (20.0) | 10 (18.2) | 12 (12.1) | 0.384 |
| CAD | 16 (32.0) | 15 (27.3) | 16 (16.2) | 0.065 |
| Stroke or TIA | 1 (2.0) | 6 (10.9) | 4 (4.0) | 0.092 |
| Congestive heart failure | 0 (0.0) | 0 (0.0) | 1 (1.0) | 0.587 |
| COPD | 0 (0.0) | 0 (0.0) | 1 (1.0) | 0.587 |
| OSAS | 0 (0.0) | 0 (0.0) | 0 (0.0) | / |
| NYHA functional class | 0.124 | |||
| I | 47 (100.0) | 52 (98.1) | 90 (93.8) | |
| II | 0 (0.0) | 1 (1.9) | 6 (6.3) | |
| III | 0 (0.0) | 0 (0.0) | 0 (0.0) | |
| CHA2DS2‐VA score, n (%) | 0.197 | |||
| 1 | 9 (18.0) | 10 (18.2) | 30 (30.3) | |
| 2 | 17 (34.0) | 23 (41.8) | 40 (40.4) | |
| 3 | 17 (34.0) | 12 (21.8) | 19 (19.2) | |
| >3 | 7 (14.0) | 10 (18.2) | 10 (10.1) | |
| LAD, mm | 41 (35.8–42.0) | 38 (35.8–42.0) | 39 (34.8–41.0) | 0.381 |
| LVEF, % | 62.3 (59–65) | 61.2 (58.8–64.0) | 63.9 (59–66.3) | 0.080 |
| Medication use, n (%) | ||||
| Class I AAD | 10 (20.0) | 18 (32.7) | 10 (10.1) | 0.002 |
| Class III AAD | 15 (30.0) | 18 (32.7) | 21 (21.2) | 0.243 |
| ACEI or ARB | 15 (30.0) | 14 (25.5) | 27 (27.3) | 0.872 |
| Beta blocker | 20 (40.0) | 15 (27.3) | 30 (30.3) | 0.338 |
| CCB | 12 (24.0) | 7 (12.7) | 19 (19.2) | 0.327 |
| Digoxin | 0 (0.0) | 1 (1.8) | 0 (0.0) | 0.256 |
Subgroup A, females with LVA who received additional substrate modification; Subgroup B, females with LVA who received CPVI alone; Subgroup C, females without LVA.
AAD, denotes antiarrhythmic drugs; ACEI, angiotensin‐converting enzyme inhibitors; AF, atrial fibrillation; ARB, angiotensin receptor blocker; BMI, body mass index; CAD, coronary artery disease; CCB calcium channel blocker; COPD, chronic obstructive pulmonary disease; CPVI, circumferential pulmonary vein isolation; LAD, left atrial diameter; LVEF, left ventricular ejection fraction; NYHA, New York Heart Association heart failure classification; OSAS, obstructive sleep apnoea syndrome; TIA, transient ischaemic attack.
Plus‐minus values are means ±SD.
Supplementary TABLE 4 Hazard ratio for freedom from atrial tachyarrhythmia recurrence in female patients.
| Subgroup B | Subgroup A | Subgroup C | p‐Value | |
|---|---|---|---|---|
| HR (95% CI), Model 1 | 1 (reference) | 0.276 (0.103–0.740) | 0.412 (0.212–0.803) | 0.006 |
| HR (95% CI), Model 2 | 1 (reference) | 0.305 (0.112–0.831) | 0.445 (0.224–0.884) | 0.016 |
| HR (95% CI), Model 3 | 1 (reference) | 0.333 (0.122–0.908) | 0.399 (0.195–0.815) | 0.014 |
| HR (95% CI), Model 4 | 1 (reference) | 0.323 (0.188–0.884) | 0.389 (0.188–0.803) | 0.012 |
| HR (95% CI), Model 5 | 1 (reference) | 0.327 (0.119–0.900) | 0.399 (0.188–0.849) | 0.019 |
Subgroup A, females with LVA who received additional substrate modification; Subgroup B, females with LVA who received CPVI alone; Subgroup C, females without LVA.
Model 1: adjusted for age and AF duration.
Model 2: adjusted for model 1 covariates plus baseline CAD and stroke/TIA.
Model 3: adjusted for model 2 covariates plus baseline NYHA.
Model 4: adjusted for model 3 covariates plus baseline LVEF.
Model 5: adjusted for model 4 covariates plus baseline class I AAD.
OP‐105b‐V‐AF
Randomized controlled study protocol: Shensong Yangxin in persistent atrial fibrillation after radiofrequency catheter ablation (SS‐ADJUST)
Bin Kong; Wei Shuai; Hongjie Yang; Hong Meng; Yu Liu; Congxin Huang; He Huang
Renmin Hospital Of Wuhan University, Wuhan, China
Introduction: Atrial fibrillation (AF) is one of the most common forms of arrhythmia in the clinic. There are about 10 million AF patients in China, of which 1/3 are paroxysmal AF, and the remaining 2/3 are persistent or permanent AF. Long‐term AF impairs cardiac function and leads to heart failure and thromboembolism. Moreover, AF increases the risk of mortality and ischemic stroke. Drug therapy and radiofrequency catheter ablation (RFCA) are still the mainstream treatment for AF patients. However, drug therapy has its drawbacks because of the high recurrence rate and side effects. Therefore, the current antiarrhythmic drugs could not meet all the clinical needs of patients with AF.
RFCA is superior to antiarrhythmic drugs in maintaining sinus rhythm, improving symptoms and exercise tolerance, and improving quality of life. The role of RFCA in the treatment of persistent AF has gradually been recognized and affirmed. Although RFCA has been progressively used in the treatment of AF, there is still a high recurrence rate of AF after RFCA, especially in patients with persistent AF. Hence, it is meant to solve the high recurrence rate of AF after RFCA.
Shensong Yangxin (SSYX) capsule has been proven to treat arrhythmia both in animal studies and clinical research. SSYX capsule could regulate multi‐ion channels, improve cardiomyocyte metabolism and regulate autonomic nervous function. In addition, randomized, double‐blind, multicenter clinical research indicated that the SSYX capsule exhibited good clinical efficacy in treating ventricular premature beats and paroxysmal AF. However, the effect of SSYX on recurrence after RFCA for patients with persistent AF remains unclear. High‐level randomized controlled trials (RCTs) could offer clinicians high‐quality evidence regarding the usage of SSYX capsule, especially in persistent AF patients who received RFCA. Hence, the RCTs aim to evaluate the effect of SSYX capsules on the prognosis in patients with persistent AF after RFCA through multicenter, double‐blind RCTs.
Methods: This trial will be conducted with a total of 920 participants diagnosed with persistent AF who received RFCA. The participants will be randomized (1:1) into groups receiving either SSYX or Placebo for 1 year. The primary endpoint includes the recurrence of AF within 1 year after RFCA. The secondary outcome measures include changes of AF load at 3 months, 6 months, 9 months, and 1 year after treatment, the time of first atrial flutter/AF, the incidence of cardioversion 1 year after treatment, changes of transthoracic echocardiographic parameters 1 year after treatment, the incidence of stroke and thromboembolism at 6 months and 1 year after treatment, the score of SF‐36 within 1 year after treatment.
Application: The trial is ongoing. The trial started in September 2019 and recruiting patients. Data collection will be completed after all participants have completed the treatment course and follow‐up assessments (expected in 2022, pending COVID‐19).
Next Steps/Future: The SS‐ADJUST study is a randomized control study of TCM in persistent AF after RFCA. It will determine the place of SSYX capsule as a new treatment approach and provide additional and innovative information regarding TCM and the specific use of SSYX in persistent AF after RFCA. SS‐ADJUST is registered at ChiCTR (ChiCTR1900026912).
OP‐105c‐V‐AF
Characteristics and risk scores in asian atrial fibrillation patients on edoxaban: ETNA‐AF Registry 1‐year snapshot
Hung‐Fat Tse
The University of Hong Kong Shenzen Hospital, Hong Kong, Hong Kong
Objectives: Stroke and bleeding risk scores are being used to determine the indication for oral anticoagulation in atrial fibrillation (AF) patients. This analysis from the ETNA‐AF Global registry shall contribute to a better understanding of edoxaban therapy in AF patients from East Asia when considering stroke and bleeding risk scores at baseline.
Materials and Methods: Enrolled were 3359 AF patients treated with edoxaban from South Korea, Taiwan, Hong Kong, and Thailand, extracted from the ETNA‐AF Global integrated database of more than 30,000 patients. Baseline characteristics and 1‐year outcomes were descriptively analyzed according to CHA2DS2‐VASc and HAS‐BLED scores.
Results: The patient history data as displayed in the table below changes in the same direction with increasing scores. The CHA2DS2‐VASc compared with the HAS‐BLED score covers a wider range of values for all parameters. The one‐year clinical event rates also cover a wider range for all parameters when using the CHA2DS2‐VASc vs the HAS‐BLED score for both, efficacy and safety addressing parameters.
Conclusion: When using categories for the CHA2DS2‐VASc and HAS‐BLED scores, it appears that the former may be the choice in clinical practice to better predict both, efficacy and safety events in atrial fibrillation patients from South Korea, Taiwan, Hong Kong, and Thailand when considering oral anticoagulation with edoxaban.
Supporting Documents
| CHA2DS2‐VASc | HAS‐BLED | ||||
|---|---|---|---|---|---|
| 0–1387 (11.5%) | 2–31,712 (50.1%) | ≥41,260 (37.5%) | <32,369 (74.6%) | ≥3808 (25.4%) | |
| Age [years], mean ± SD | 60.0 ± 8.4 | 70.3 ± 8.5 | 77.1 ± 7.3 | 70.7 ± 9.9 | 74.4 ± 8.1 |
| Body Weight (kg), mean ± SD | 72.6 ± 11.9 | 67.2 ± 12.2 | 62.3 ± 11.8 | 66.1 ± 12.6 | 65.5 ± 11.8 |
| CrCl [mL/min], mean ± SD | 82.2 ± 23.1 | 66.4 ± 22.4 | 52.2 ± 20.6 | 64.2 ± 24.2 | 58.9 ± 22.2 |
| CHA2DS2‐VASc score, mean ± SD | 0.8 ± 0.4 | 2.5 ± 0.5 | 4.7 ± 0.9 | 2.9 ± 1.4 | 3.9 ± 1.5 |
| Medical history, n (%) | |||||
| Ischaemic stroke | 0 (0.00) | 94 (5.49) | 413 (32.78) | 207 (8.74) | 281 (34.78) |
| Major or CRNM bleeding | 5 (1.29) | 42 (2.45) | 59 (4.68) | 46 (1.94) | 56 (6.93) |
| Clinical events at 1 year, n (%/year) [95% CI] | |||||
| Major bleeding (ISTH) |
3 (0.79) [0.25; 2.45] |
21 (1.27) [0.83; 1.95] |
19 (1.58) [1.01; 2.48] |
25 (1.09) [0.74; 1.61] |
16 (2.08) [1.28; 3.40] |
| Fatal bleeding |
0 (0.00) [0.00; NA] |
2 (0.12) [0.03; 0.48] |
2 (0.17) [0.04; 0.66] |
2 (0.09) [0.02; 0.35] |
2 (0.26) [0.06; 1.03] |
| Major GI bleeding |
1 (0.26) [0.04; 1.86] |
5 (0.30) [0.13; 0.72] |
12 (1.00) [0.57; 1.76] |
10 (0.43) [0.23; 0.81] |
7 (0.91) [0.43; 1.90] |
| Intracranial Hemorrhage |
0 (0.00) [0.00; NA] |
7 (0.42) [0.20; 0.88] |
5 (0.41) [0.17; 1.00] |
7 (0.30) [0.15; 0.64] |
4 (0.52) [0.19; 1.37] |
| Hemorrhagic stroke |
0 (0.00) [0.00; NA] |
5 (0.30) [0.13; 0.72] |
4 (0.33) [0.12; 0.88] |
6 (0.26) [0.12; 0.58] |
3 (0.39) [0.12; 1.20] |
| Ischemic stroke or TIA |
2 (0.53) [0.13; 2.10] |
20 (1.21) [0.78; 1.87] |
23 (1.92) [1.28; 2.90] |
25 (1.09) [0.74; 1.61] |
20 (2.61) [1.69; 4.05] |
| All‐cause mortality |
3 (0.79) [0.25; 2.44] |
25 (1.50) [1.01; 2.22] |
30 (2.48) [1.74; 3.55] |
37 (1.61) [1.16; 2.22] |
13 (1.67) [0.97; 2.88] |
| Cardiovascular mortality |
1 (0.26) [0.04; 1.86] |
8 (0.48) [0.24; 0.96] |
13 (1.08) [0.62; 1.85] |
15 (0.65) [0.39; 1.08] |
6 (0.77) [0.35; 1.72] |
| Net clinical outcome at 1 year | |||||
| Ischemic or hemorrhagic stroke, SEE, MI, major bleeding (ISTH), all‐cause mortality |
8 (2.11) [1.06; 4.22] |
60 (3.65) [2.83; 4.70] |
64 (5.40) [4.22; 6.89] |
81 (3.55) [2.86; 4.42] |
42 (5.54) [4.10; 7.50] |
OP‐106‐2‐BS (TRACK 7 ‐ BS)
Synchronizing systolic calcium release with Azumolene following ischemic ventricular fibrillation
Praloy Chakraborty 1; Daoyuan Si2; Mohammed Ali Azam1; Madhav Krishna Kumar Nair1; Stéphane Massé; Patrick F.H. Lai1; Christopher Labos1; Sheila Riazi1; Kumaraswamy Nanthakumar1
1 Toronto General Hospital ‐ Toronto, On, Toronto, Canada; 2China‐Japan Union Hospital, Jilin University, Changchun, Jilin, China
Background: Post‐defibrillation myocardial contractile dysfunction adversely affects the survival of patients after cardiac arrest. Attenuation of diastolic calcium (Ca2+) overload by stabilization of the cardiac ryanodine receptor (RyR2) is found to reduce refibrillation after long‐duration ventricular fibrillation (LDVF). In the present study, we explored the effect of RyR2 stabilization by azumolene on systolic Ca2+ release synchrony and myocardial contractility.
Methods: After completion of baseline optical mapping, Langendorff‐perfused rabbit hearts were subjected to global ischemia followed by reperfusion with azumolene or deionized distilled water. Following reperfusion, LDVF was induced with burst pacing. In the first series of experiments (n = 16), epicardial Ca2+ transient was analyzed for Ca2+ transient amplitude alternans and dispersion of Ca2+ transient amplitude alternans index (CAAI). In the second series of experiments following the same protocol (n = 12), ventricular contractility was assessed by measuring the LV pressure.
Results: Ischemic LDVF led to greater CAAI (0.06 ± 0.02 at baseline vs 0.12 ± 0.02 post‐LDVF, p < 0.01) and magnitude of dispersion of CAAI (0.04 ± 0.01 vs 0.09 ± 0.01, p < 0.01) in control hearts. In azumolene‐treated hearts, no significant changes in CAAI (0.05 ± 0.01vs 0.05 ± 0.01, p = 0.84) and dispersion of CAAI (0.04 ± 0.01 vs. 0.04 ± 0.01, p = 0.99) were noted following ischemic LDVF. Ischemic LDVF was associated with a reduction in LVDP (100% vs. 36.8 ± 6.1%, p = 0.002) and dp/dtmax (100% vs. 45.3 ± 6.5%, p = 0.003) in control hearts, but these reductions were mitigated (LVDP: 100% vs.74.0 ± 8.1%, p = 0.052, dp/dtmax: 100% vs. 80.8 ± 7.9%, p = 0.09) in azumolene‐treated hearts.
Conclusion: Treatment with azumolene is associated with improvement of systolic Ca2+ release synchrony and myocardial contractility following ischemic LDVF.
OP‐107‐2‐BS (TRACK 7 ‐ BS)
A 3D culture system enhances the therapeutic efficacy of MSCs‐Derived extracellular vesicles for heart repair
Ling Sun 1; Yuan Ji1; Boyu Chi2; Tingting Xiao1; Lipeng Mao2; Dabei Cai2; Ailin Zou1; Yu Wang1; Liming Tang1; Qingjie Wang1
1 The Affiliated Changzhou No. 2 People's Hospital of Nanjing Medical University, Changzhou, China; 2Dalian Medical University, Dalian, China
Background: Extracellular vesicles (EVs) derived from mesenchymal stem cells (MSCs), because of their inner functional substances, have shown great value in treating acute myocardial infarction (AMI). However, their clinical application is limited by a low yield. In the present study, we cultured EVs using a hollow fiber bioreactor‐based three‐dimensional (3D) system and assessed their therapeutic effectiveness on AMI.
Methods: The MSCs separated from fresh human umbilical cord were planted into the flasks of two systems: two‐dimensional (2D) culture and hollow‐fiber‐bioreactor‐based 3D culture. EVs were extracted from the culture supernatants. Characteristics and yields of EVs from two culture systems, namely 2D‐EVs and 3D‐EVs, were compared. A rat model of AMI was built to assess their therapeutic efficacy on AMI.
Results: The yield of 3D‐EVs was higher, with biofunctions similar to those of 2D‐EVs. 3D‐EVs repressed the apoptosis of cardiomyocytes, facilitated angiogenesis, and regulated the transition of macrophage subpopulations after myocardial infarction, and eventually improved cardiac function in the AMI rats.
Conclusion: The hollow fiber 3D culture system can increase the production of MSCs‐derived EVs showing a strong cardioprotective effects in AMI rats.
OP‐108‐2‐BS (TRACK 7 ‐ BS)
Correction of SCN5A splicing error of Brugada syndrome patient by antisense oligonucleotides
Koichi Kato 1; Hideyuki Jinzai1; Takeru Makiyama2; Yuichi Sawayama1; Ryotaro Kida1; Ryo Kurosawa3; Masahiko Ajiro3; Seiko Ohno4; Yoshihisa Nakagawa1; Minoru Horie1
1 Department of Cardiovascular Medicine, Shiga University Of Medical Science, Otsu, Japan; 2Department of Cardiovascular Medicine, Kyoto University Graduate School of Medicine, Kyoto, Japan; 3Department of Drug Discovery Medicine, Kyoto University Graduate School of Medicine, Kyoto, Japan; 4Department of Bioscience and Genetics, National Cerebral and Cardiovascular Center, Suita, Japan
Objective: Brugada syndrome is a well‐known lethal arrhythmic disease associated with loss‐of‐function SCN5A variants. We identified single nucleotide substitution c.1338 G > A at the last codon of SCN5A‐Exon10 which did not change the coding amino acid (p.E466E) in a patient with Brugada syndrome. The aim of this study is 1) to elucidate the consequence of this newly identified splice site variant, and 2) to correct the induced splice alteration using anti‐sense oligonucleotides.
Method: Splicing alteration by the SCN5A c.1338 G > A was predicted by Splice AI. Minigene splicing reporter assay was performed by using iPS‐cardiomyocytes (iPS‐CMs) and HEK293 cells. Three different antisense nucleotides were designed and tested by splice reporter assay in HEK293 and iPS‐CMs.
Results: Splice reporter assay in both HEK293 cells and iPS‐CMs demonstrated a dominant selection of an alternative splice site in 4 bp downstream from the authentic splice site between exon 10 and 11 which corresponded well with the in silico prediction by Splice AI. Three differently designed ASO suppressed total minigene reporter expression in a dose‐dependent manner. Among them, ASO1 effectively corrected the splice alteration at the final concentration of 0.3 μM in which it did not suppress the total minigene reporter expression.
Conclusion: In this study, we confirmed splice site alteration by single nucleotide alteration SCN5A c.1338G > A identified in a Brugada syndrome patient. Correction by ASO was effective in the minigene reporter assay. Further experiments using patient‐derived iPS‐CMs or gene‐edited iPS‐CMs would be the future step.
OP‐109‐2‐BS (TRACK 7 ‐ BS)
Lamp2‐Y228* Knock‐in mouse models successfully simulated clinical manifestations of a patient with Danon disease
Wei Lai1,2; Dandan Zhang1,2; Rong Wan2; Yuhao Su1,2; Yang Liu 1,2; Qinmei Xiong1; Juxiang Li1; Yang Shen2,3; Ali J Marian4; Kui Hong1,2,3
1 Department Of Cardiovascular Medicine, The Second Affiliated Hospital Of Nanchang University, Jiangxi, Nanchang, China; 2Jiangxi Key Laboratory of Molecular Medicine, the Second Affiliated Hospital of Nanchang University, Nanchang, China; 3Department of Genetics Medicine, the Second Affiliated Hospital of Nanchang University, Nanchang, China; 4Center for Cardiovascular Genetics, Institute of Molecular Medicine, The University of Texas Health Science Center‐Houston, Houston, USA
Objectives: Danon disease (DD) is a rare X‐linked lysosomal storage disorder caused by mutations in the gene encoding the lysosome‐associated membrane protein 2 (LAMP2). It is characterized by glycogen accumulation, cardiac and skeletal myopathy, and intellectual disability. LAMP2 is a key mediator of the lysosome‐mediated autophagy degradation pathway, which is required for lysosome biogenesis. Although abnormal macroautophagy has been implicated in the pathogenesis of DD, its pathogenesis has remained largely unknown.
Materials and Methods: DNA samples from a young patient with DD and his family members were analyzed by whole‐exome sequencing and the key findings were confirmed by Sanger sequencing. A knock‐in mouse model carrying the homologous Lamp2‐Y228* was generated.
Results: The proband was a 17‐year‐old boy presenting with severe left ventricular hypertrophy, heart failure, and skeletal myopathy. A c.669 T > G de novo nonsense variant in the LAMP2 gene, which generated a premature stop codon (p. Tyr223Ter). Knock‐in of the mutation into the mouse Lamp2 gene (Lamp2Y228*) led to a phenotype resembling the typical DD, including the short PR interval, pre‐excitation pattern on electrocardiogram, a smaller body size, lower body weight, and higher mortality. Transmission electron microscopy and immunofluorescence assay showed an aberrant accumulation of autophagolysosome and glycogen in the heart tissue.
Conclusion: Our findings suggest that Lamp2‐Y228* mouse models successfully reproduce clinical manifestations of a patient with Danon disease, which will further be used to explore the exact role of LAMP2 in impaired autophagy causing Danon disease.
OP‐111‐1‐CIED (TRACK 6 ‐ CIED 1)
Electrical considerations for left bundle area pacing
Yen‐Nien Lin; Wen‐De Tang; Ching‐Feng Chang; Kuan‐Cheng Chang
Cardiovascular center, China Medical University and Hospital, Taichung, Taiwan
Objectives: Left bundle area pacing (LBaP) has been demonstrated as a physiological pacing modality better than conventional right ventricular pacing (RVP). Current implant techniques begin with identifying the critical target area but based exclusively on anatomy. We hypothesize electrical signals can be useful markers to guide LBaP.
Materials and Methods: We retrospectively analyzed patients who received LBaP in a tertiary medical center in 2021. Patient characteristics, ECG before and after septal screwing were recorded. QRS patterns were categorized into five common subtypes, including R, Rs, rs, rS, S, which were further scored as 1–5. Precordial transition zones were also identified. We compared the electrical features in patients with post‐screw QRS duration (QRSd) <120 ms and ≥ 120 ms.
Results: A total of 59 patients (age 70.7 ± 11.4 years, male 57.6%) were enrolled. The baseline intrinsic QRSd was 108.3 ± 27.6 ms and RV‐paced QRSd was 144.6 ± 23.0 ms. After screwing the lead, LBaP QRSd became 129.5 ± 23.0 ms. The target area showed a score in lead II 1.9 ± 1.0, lead III 3.8 ± 1.2, and aVF 2.9 ± 1.3, indicating an inferior discordant pattern. The precordial transition zone was after 3.4 ± 1.2. Comparing electrical parameters in post‐screw QRSd <120 ms and ≥ 120 ms groups, significantly less pre‐screw QRSd (p = 0.001), pLVAT (p < 0.001), and higher V1 r’ (p = 0.016) were observed in QRSd <120 ms group.
Conclusions: Electrical signals are useful markers to guide LBaP. Inferior discordant pattern, short QRSd, and pLVAT during pre‐screw pacing, and V1 r’ in post‐screw pacing are associated with efficient left ventricular activation.
OP‐112‐1‐CIED (TRACK 6 ‐ CIED 1)
Dual‐Chamber leadless pacing maintains atrioventricular synchrony throughout various scenarios in a preclinical model
Vivek Reddy 1; Reinoud Knops2; Petr Neuzil3; Mayer Rashtian4; Daniel Booth5; Aditya Goil5; Nicole Cooper5; David Ligon5; Matthew Fishler5; Rahul Doshi6
1 Icahn School of Medicine at Mount Sinai, New York, USA; 2Academic Medical Center, Amsterdam, The Netherlands; 3Na Homolce Hospital, Prague, Czech Republic; 4Huntington Hospital, Pasadena, USA; 5Abbott, Sylmar, USA; 6HonorHealth Research Institute, Scottsdale, USA
Supporting Documents


OP‐113‐1‐CIED (TRACK 6 ‐ CIED 1)
More severe complications in TV‐ICD's compared to S‐ICD's: A secondary analysis of the PRAETORIAN trial
Reinoud Knops
1 Amsterdam UMC Location University of Amsterdam, Biomedical Engineering and Physics, Meibergdreef 9, Amsterdam, Netherlands, Amsterdam, Netherlands; 2Amsterdam Cardiovascular Sciences, Heart failure & arrhythmias, Amsterdam, The Netherlands
Objectives: The subcutaneous ICD (S‐ICD) is developed to overcome lead‐related complications and systemic infections, inherent to transvenous ICD (TV‐ICD) therapy. The PRAETORIAN trial demonstrated that the S‐ICD is non‐inferior to the TV‐ICD with regard to inappropriate shocks and complications. This prespecified secondary analysis evaluates all complications in the PRAETORIAN trial.
Materials and Methods: The PRAETORIAN trial is an international, multicenter, randomized trial in which 849 patients with a class I or IIa indication for ICD therapy were randomized to receive an S‐ICD (N = 426) or TV‐ICD (N = 423) and followed for a median of 49 months. Endpoints were device‐related complications, lead‐related complications, systemic infections, and the need for invasive interventions.
Results: A total of 36 device‐related complications occurred in 31 patients in the S‐ICD group versus 49 device‐related complications in 44 patients in the TV‐ICD group (HR 0.69; 95% CI 0.44–1.09; p = 0.11). Fewer lead‐related complications occurred in the S‐ICD group compared to the TV‐ICD group (HR 0.24; 95% CI 0.10–0.54; p < 0.001). No patients in the S‐ICD group versus 5 patients in the TV‐ICD group had a systemic infection (p = 0.03). The incidence of device‐related complications that required invasive interventions was higher in the TV‐ICD group compared to the S‐ICD group (8.3% vs. 4.3%, HR 0.59; 95% CI 0.35–0.99; p = 0.047).
Conclusion: This secondary analysis shows that lead‐related complications and systemic infections are more prevalent in the TV‐ICD group compared to the S‐ICD group. In addition, device‐related complications in the TV‐ICD group were more severe as they required significantly more invasive interventions.
Supporting Documents

OP‐114‐1‐CIED (TRACK 6 ‐ CIED 1)
A RARE cause for pacemaker‐mediated tachycardia
Wei Shen Chee 1; Soot Keng Ma2; Abd Raqib Abd Ghani1; Nor Halwani Habizal1; Hartini Mohd Yusof1; Kamaraj Selvaraj1; Asri Ranga Abdullah Ramaiah1; Abd Kahar Abd Ghapar1
1 Department of Cardiology, Serdang Hospital, Malaysia; 2Loh Guan Lye Specialists Centre, Malaysia
Objective: To demonstrate a rare cause for pacemaker‐mediated tachycardia (PMT).
Materials and Methods: Using PubMed and google search engine, there are so far no publications on rate‐responsive PVARP causing PMT and here we illustrate 2 cases of Rate responsive PVARP of different sensitivities causing PMT.
Results: PMT was thought mainly caused by inadequate PVARP and most of the time the physicians adjusted the PVARP by extending it. For our first case, we changed the RR PVARP from high to low and for the second case we turned off the RR PVARP .
Conclusion: PMT happens for a reason and in this case, we demonstrate the rare cause of rate‐responsive PVARP being the culprit for her PMT. We reset the rate‐responsive PVARP and since then they had no more PMT episodes.
Supporting Documents

OP‐115‐1‐CIED (TRACK 6 ‐ CIED 1)
Methodology of ventricular septal implantation using stylet‐driven lead
Takatsugu Kajiyama
Chiba University, 千葉市, Japan
Background: Right ventricular septal pacing based on stylet‐driven lead (SDL) is facilitated by a recently‐introduced three‐dimensionally curved guiding catheter. The present study is performed to investigate the multiple methods to install pacing leads on the interventricular septum.
Methods: We retrospectively analyzed the consecutive patients who underwent implantation of Biotronik Solia S leads, both including apical implantation and initial experience of septal implantation. The paced QRS duration was compared between 4 groups: G1 apical implantation, G2 septal with fluoroscopic guidance, G3 septal with echo guidance, G4 septal with echo guidance, and lead‐body rotation. Body rotation was performed to manage deep septal pacing.
Results: In total, 57 patients were analyzed. Biotronik Selectra 3D catheter was exclusively used to install leads into the septum. The number of patients in G1, G2 G3, and G4 was 18, 12, 20, and 7, respectively. Dislodgement of septal lead was less frequent in G2/G3 compared to G1 (21% vs. 3.7%). The QRS duration was 163 ± 15, 146 ± 13, 143 ± 11, and 127 ± 20 ms, respectively. In G3, half of the patients exhibited a QRS duration of less than 120 ms.
Conclusion: Combination of echocardiographic guidance and body rotation could be effective to improve procedural and clinical results after catheter‐guided septal implantation of SDLs.
OP‐116‐1‐CIED (TRACK 6 ‐ CIED 1)
Axillary venous spasm during pacemaker implantation: A rare but serious phenomenon
Theovano Oktavio; Sheila Adiwinata; Benny Setiadi
Kandou General Hospital Manado, Manado, Indonesia
Background: Venous spasm during pacemaker implantation is a rare phenomenon. The larger proportion of muscle fibers in the tunica media and elastic fibers in the tunica intima of veins predisposes to contraction.
Case Presentation: A 55‐year‐old female presented with presyncope, recurrent palpitation, and chest pain. She had a history of hypertension. Physical examination showed a heart rate of 55 bpm and blood pressure of 124/72 mmHg, with normal heart sounds, and no murmur. Electrocardiogram showed Mobitz I Second‐degree atrioventricular block. Electrocardiogram and echocardiogram did not show any evidence of ischemia. A Holter monitoring showed several bradycardia episodes with the lowest rate around 40 bpm. The patient was diagnosed with Sick Sinus Syndrome and dual chamber pacemaker implantation (DDD) was planned. The left axillary vein was selected for venous access. A venogram was performed and showed good vein access. The axillary vein could not be cannulated despite multiple attempts. The second venography showed a spasm in both the axillary and subclavian veins. A bolus of intravenous 10 mg isosorbide dinitrate was given. After 15 minutes, the third venogram showed the spasm had been relieved partially. A single‐chamber pacemaker was implanted because of the spasm.
Supporting Documents
Discussion: The mechanism of venous spasm is not clearly understood, it may be related to direct mechanical vascular injury, compression by surrounding tissues, temperature, and chemical factors. Intravenous isosorbide dinitrate, nitroglycerine, calcium channel blocker, and sedatives might have a role in shortening the spasm duration.
Conclusion: Monitoring and precaution should be performed to prevent venous spasms during pacemaker implantation.


OP‐117‐2‐CIED (TRACK 6 ‐ CIED 3)
Extra‐long‐term follow‐up of transvenous lead extraction patients without device Re‐implantation
Andrew Mamo 1; Claire Bartlett2; Sean Gomes1
1 Eastern Heart Clinic, Randwick, Australia; 2Sutherland Heart Clinic, Caringbah, Australia
Objective: To examine the primary outcomes of death and device reimplantation in the extra‐long‐term follow‐up of patients undergoing transvenous lead extraction (TLE) without early device reimplantation. The secondary outcome is the incidence of cardiac death.
Materials and Methods: Patients (and their next‐of‐kin) were followed up via telephone interview in conjunction with the review of electronic medical records and primary physician documentation +/− interview.
Results: Forty‐three patients from the initial cohort (n = 510) were identified. Data were available in 90.7% (n = 39) with an average follow‐up of 8.7 years [range 0.1–23.4 years]. The indication for TLE was an infection in 86.0% (n = 37) of patients. Cumulative mortality was 55.8% (n = 24) with a mean time‐to‐death of 4.5 years [range 0.1–14.2 years]. Reimplantation incidence was 20.9% (n = 9) with a mean time‐to‐reimplantation of 4.3 years [range 0.6–12.0 years]. The average follow‐up in surviving non‐re‐implantation patients (18.6%, n = 8) was 15.9 years [range 10.7–23.4 years]. Cardiac death occurred in 7.0% (n = 3) of patients (none of whom underwent device re‐implantation or had bradycardia/arrhythmia‐related deaths). Cause of death was not available in 17.4% (n = 4) of all deaths.
Conclusion: The study represents the longest follow‐up of TLE patients published to date. Extra‐long‐term death in this subset of TLE patients is high and reflects the known high mortality of TLE patients in general. The incidence of device re‐implantation in follow‐up is lower than expected; an important observation in rationalizing device re‐implantation in these patients. The incidence of cardiac death is relatively low and is not contributed to by non‐reimplantation or device‐preventable death.
OP‐118‐2‐CIED (TRACK 6 ‐ CIED 3)
First Indonesia experience of HOT‐CRT and its early outcome
Irnizarifka Irnizarifka 2; Giky Karwiky1; Mohammad Iqbal1; Achmad Chaerul1
1 Dept. Cardiology And Vascular Medicine, Universitas Padjadjaran, Indonesia, Bandung, Indonesia; 2Dept. Cardiology And Vascular Medicine, Universitas Sebelas Maret, Indonesia, Surakarta, Indonesia
Objective: This is to report the successful implantation of our first HIS‐optimized cardiac resynchronization therapy (HOT‐CRT) and its early outcome.
Case Illustration: A 50‐year‐old male with intractable mixed‐type cardiomyopathy on optimal medical therapy underwent HOT‐CRT implantation. Surface ECG depicted atrial fibrillation, atypical LBBB with QRS duration (QRSd) of 182 ms. All chamber dilatation was appreciated as baseline echocardiography, with LVEDV 341 ml, LVESV 260 ms, LVEF 24%, TAPSE 10 mm, and GLS ‐4.7. LV lead was uncomplicatedly placed at the basal‐mid lateral branch (1 V threshold using LV2‐LV3) and biventricular pacing generated QRSd of 168 ms. Partially corrected non‐selective HBP was noted (QRSd of 172 ms at 1 V) and His lead was connected to the atrial port. HOT‐CRT was optimized by changing LV lead polarity into LV3‐LV4 (HIS‐LV delay 50 ms), resulting largest LVOT VTI (13.9 cm) and narrowest QRSd (120 mm). A month after the procedure, not only patient experience better NYHA (fc I‐II), but objective data of echocardiography also showed the trend of geometry improvement (LVEDV 272 ml, LVESV 212 ms), RV function (TAPSE 15 mm), and GLS ‐5.4.
Conclusion: To the best of our knowledge, this is the first HOT‐CRT in Indonesia. Despite HBP being found promising, LBBB or intraventricular conduction block became a barrier to its usage. Hence, on this subset of the patient, it is a place for HOT‐CRT, wherein we appreciate a better trend of short‐term outcomes through evidence of reverse remodeling. The long‐term outcome is to wait which we believe will also give a further positive result.
Supporting Documents


OP‐119‐2‐CIED (TRACK 6 ‐ CIED 3)
Left bundle branch area pacing in patients with structural heart disease
Soonil Kwon 1; Hyo‐Jeong Ahn1; So‐Ryoung Lee1; Eue‐Keun Choi1; Seil Oh1
1 Seoul National University Hospital, Seoul, South Korea
Background: Recently, left bundle branch area pacing (LBBAP) has been performed using style‐driven extendable screw‐in leads with pre‐shaped delivery sheaths in Korea. There are limited data on the feasibility of LBBAP in patients with structural heart disease (SHD).
Methods: Patients, in which LBBAP was attempted, were consecutively enrolled. LBBAP was performed with a stylet‐driven lead (Solia S60, Biotronik) delivered through a delivery sheath (Selectra 3D, Biotronik). Procedure feasibility was evaluated in patients with or without SHD.
Results: A total of 69 patients were enrolled. The atrioventricular block was the most common indication (n = 50, 72.5%). The LBBAP success rate was 81.2% of the total study population. Thirty‐two patients (46.4%) were accompanied by SHD (Figure A). Patients with SHD had significantly lower left ventricular ejection fraction than those without SHD (56 ± 10% vs. 61 ± 6.7%, p = 0.016). The LBBAP success rate was not different between the two groups (patients with SHD vs. without SHD, 83.8% vs. 78.1%, p = 0.549, Figure B). There was no significant difference in total procedure time, fluoroscopic time, bipolar V sensing, V pacing threshold, and V impedance between the two groups (Figure C), except for left ventricular activation time (LVAT). Patients with SHD showed longer LVAT than those without SHD, but there was no statistically significant difference in the final QRS duration between the two groups (Figure C).
Conclusion: LBBAP using stylet‐driven pacing leads in patients with SHD is feasible and safe as in patients without structural heart disease, even by an early experienced operator with LBBAP procedure.
Supporting Documents

OP‐120‐2‐CIED (TRACK 6 ‐ CIED 3)
Inappropriate mode switch leading to Underpacing in a patient with Hbp, what is the etiology?
Kurniawan Prakoso 1; Giky Karwiky1; Mohammad Iqbal1; Chaerul Achmad1
1 Department Of Cardiology And Vascular Medicine, Universitas Padjadjaran, Bandung, Indonesia, Bandung, Indonesia
Introduction: His bundle pacing (HBP) is one of the best methods to achieve physiologic electromechanical activation of the left ventricle. Reprogramming may be needed in case of a low number of ventricular pacing. This case will elaborate on troubleshooting in a young patient with HBP.
Case Description: A 40‐year‐old male was referred to Hasan Sadikin General Hospital because of syncope. No history of prior cardiac disease is reported, and this was the first syncopal episode. The ECG obtained during hospitalization revealed a marked first‐degree AVB and transient CHB. The patient was then managed with HBP implantation. On the following day, the patient's HBP was evaluated, unfortunately, the number of ventricular pacing in this patient is low, therefore further investigation was carried out.
Discussion: In this case, the presence of marked first‐degree AVB and intermittent CHB was the primary consideration to give HBP to the patient. Recovery of AV synchrony is expected following HBP implantation in a patient with marked PR prolongation. Even though initially HBP implantation, in this case, was claimed to be successful, it was later documented that half of the intrinsic atrial rhythm was not detected correctly as it fell at the post‐ventricular atrial refractory period (PVARP) leading to pacing failure (Figure 1). Moreover, the close proximity between the atrial lead in RAA and RVOT can cause far‐field oversensing, which in turn activates an inappropriate mode switch in this patient. Therefore, lowering the sensitivity of the HBP and shortening the PVARP served as a solution so that HBP can function appropriately.
Supporting Documents

FIGURE 1 A. ECG obtained at the time of hospital admission; B. ECG obtained immediately after successful HBP implantation showing His capture characterized by spike before wide QRS complex with pseudo delta wave; C. Evaluation of the HBP showing undetected intrinsic atrial rhythm because of it being fell at the PVARP depicted by green color box as well as far‐field R wave depicted by a yellow circle; D. ECG obtained during HBP reprogramming showing far‐field R Wave oversensing and extremely prolonged PR Interval causing Inappropriate Mode Switch; E. ECG obtained after lowering HBP threshold and shortening PVARP showing atrial sensing followed by HBP ventricular pacing.
OP‐121‐2‐CIED (TRACK 6 ‐ CIED 3)
Feasibility of totally leadless CRT with a leadless pacemaker and leadless LV endocardial pacing system
Pascal Defaye 1; Christophe Leclercq; Arnold Martin; Petr Neuzil; Aldo Rinaldi; Richard Schilling; Anthony Chow; Dinesh Sharma; Giovanni Rovaris; Jeffery Alison
1 University Hospital Grenoble Alpes, Grenoble, France
Objective: CRT upgrades count for a quarter of all CRT implants because of pacing‐induced heart failure. As the use of leadless devices such as Micra and Aveir continues to expand, the need to upgrade these patients to CRT will continue to increase. The objective of this study was to assess the technical feasibility of achieving totally leadless CRT using the Micra and WiSE‐CRT Systems.
Methods: For patients with a chronic Micra implant, the WiSE‐CRT System was implanted in a one or two‐stage approach. For patients with an infection or de novo implant, the two systems were implanted over two stages. The indication for the Micra and WiSE‐CRT implantation was the infection of the conventional CRT system in five patients, upgrade of a chronic Micra in six patients, de novo implant in two patients, and high pacing thresholds in one patient.
Results: All fourteen WiSE‐CRT devices were able to detect the Micra pacing output and deliver synchronous LV endocardial pacing, resulting in successful CRT. No unforeseen device–device interactions were observed. The one acute complication recorded was because of premature detachment of an unanchored WiSE Electrode. Another Electrode was safely implanted without clinical sequelae.
Conclusions: Achieving totally leadless CRT using a combination of a Micra and WiSE‐CRT System is technically feasible. Further work is required to assess the efficacy and safety of this combination. Meanwhile, the WiSE‐CRT System remains the only means to upgrade the expanding population of Micra and Aveir patients to CRT without replacing the leadless device.
Supporting Documents

OP‐122‐2‐CIED (TRACK 6 ‐ CIED 3)
Left bundle branch area pacing using the 3830 Lumenless Lead: A systematic review and meta‐analysis
Pugazhendhi Vijayaraman 1; Joseph Ys Chan1; Kenneth A. Ellenbogen2; Patrick Zimmerman1
1 Medtronic, Inc., Mounds View, United States; 2Virginia Commonwealth University, Richmond, USA; 3Geisinger Wyoming Valley Medical Center, Geisinger Heart Institute, Wilkes Barre, USA
Objectives: Although left bundle branch area pacing (LBBAP) has been shown to be a feasible option for delivering physiological pacing, data are largely limited to single‐center reports and the safety and efficacy of the therapy have not been systematically examined.
Methods: PubMed, Embase, Cochrane Library, and Google Scholar were searched for full‐text articles on LBBAP using the SelectSecure Model 3830 lead. Rates and means were estimated using random‐ and mixed‐effects models.
Results: Of 3395 articles, 53 met inclusion criteria, representing 6061 patients undergoing an implant attempt. The average patient age was 68.1 years (95% CI: 66.6, 69.6) and 53.1% were male (95% CI: 50.5%, 55.7%). The average implant success rate among bradycardia‐indicated patients was 92.7% (95% CI: 89.5%, 94.9%). The overall estimated procedural adverse event rate was 2.5% (95% CI: 1.1%, 5.4%). The estimated septal perforation rate at implant was 1.6% (95% CI: 1.0%, 2.6%). Adverse clinical sequelae were not reported with septal perforation and events were resolved with lead repositioning. Pacing thresholds were low at implant (0.67 V [95% CI: 0.64, 0.70]) and remained stable through 12 months (0.76 V [95% CI: 0.72, 0.80]). Among bradycardia‐indicated patients, LVEF remained stable from baseline to post‐implant (60.0% [95% CI: 58.0%, 62.0%] vs. 60.3% [95% CI: 58.2%, 62.4%]).
Conclusion: This network meta‐analysis including 6061 patients implanted with a Model 3830 lead for LBBAP found an average implant success rate of 92.7% and a procedural adverse event rate of 2.5% with stable electrical parameters and LVEF post‐implant.
OP‐123‐2‐CIED (TRACK 6 ‐ CIED 6)
Development of pacing‐induced cardiomyopathy differed based on the time interval after pacemaker implantation
Sang Jin Ha; Se‐Jun Park
Gangneung Asan Hospital, Gangneung, South Korea
Backgrounds: Predicting which individuals will have a decline in left ventricular (LV) function after pacemaker implantation remains an important challenge. We investigated the real‐world risk of pacing‐induced cardiomyopathy (PICMP) after a pacemaker.
Methods and results: An analysis of consecutive patients receiving permanent pacemakers from 2000 to 2019 with LVEF >50% before pacemaker insertion. PICM was defined as <50% of LV ejection fraction (EF) in follow‐up with ≥10% or 5% decrease of EF, newly appeared regional wall motion abnormality irrelevant coronary artery disease without any other proven etiologies. among 829 patients in our pacemaker registry, 315 patients (mean age: 76 ± 7 years, M:F = 126: 189) enrolled. Prevalence of PCIM was 87/315 (27.6%) with a >10% decrease and was 120/315 (38.1%) with a >5% decrease over a mean follow‐up of 65 ± 45 months.
The incidence of PICMP did not decrease over the follow‐up period: 21% <6 months, 29% 6–12 months, 14.2% >12 months–2 years, 27% 2–3 years, 6.2% 4–5 years, and even 40% >5 years. Lower peak global systolic strain of LV and percent of ventricular pacing (Vp %) were the predictors for PICMP (GLS; OR 1.831, 95% confidence interval [CI] 1.396–2.403, p = 0.001, Vp%; OR 1.025, 95% confidence interval [CI] 1.002–1.049, p = 0.037). Vp% had an area under the receiver operating characteristic curve (AUC) of 0.704 (95% CI, 0.588–0.820) and GLS had an AUC of 0.903 (95% CI, 0.834–0.971).
Conclusion: PICMP is not uncommon during follow‐up and we suggested the echocardiographic evaluation in the follow‐up protocol.
Supporting Documents

OP‐124‐2‐CIED (TRACK 6 ‐ CIED 6)
Very Low‐Frame‐Rate digital fluoroscopy in biventricular cardiac device implantation
Ishita Yaduvanshi 1; Vikas Kataria2; Mohit Bhagwati2; Amitabh Yaduvanshi2
1 Dr. Baba Saheb Ambedkar Medical College, New Delhi, India; 2Holy Family Hospital, New Delhi, India
Fluoroscopic guidance is the standard tool used in cardiac electronic device implantation. Biventricular device (BivD) implantation is the most challenging and often involves high radiation exposure both to the patient and the operator.
The aim of our study was to investigate the radiation exposure during BivD implantation and the feasibility and reliability of biventricular device implantation with modified fluoroscopy protocols.
Between June 2015 and June 2020, 41 patients with heart failure underwent implantation BivD. In September 2018 we changed our imaging protocols to reduce radiation exposure, this included lowering the Fluoroscopy frame rates from 15fps to 4fps, frequent use of “flurosave,” and decreasing the cine frame rate from 15fps to 10fps.
Of the 41 patients, 24 procedures were done prior to the change in imaging protocol (PRE) and 17 procedures were done after (POST).
Mean fluoroscopy time was 42.9 min in PRE and 38.5 min in POST (p = 0.6), Median Dose surface product (PKA) reduced from 2493.5 mGy to 787.5 mGy (p < 0.01), and skin surface entry dose (KAR) reduced from 23020μGym2 to 7985μGym2 (p < 0.01).
There was no significant difference in the fluoroscopy time suggesting that clinically acceptable imaging could be achieved even after using very low frame rates during fluoroscopy.
Conclusion: Keeping the radiation exposure “as low as reasonable” (ALAR) is the philosophy behind all interventional procedures. Our study shows that biventricular device implantation can be done using very low frame rate fluoroscopy and the radiation exposure can be decreased by almost two‐thirds when compared to default imaging settings.
OP‐125‐2‐CIED (TRACK 6 ‐ CIED 6)
Allergic contact dermatitis related to CIED implantation mimicking infection response: A rare case in Indonesia
Billy Aditya Pratama 1; Erika Maharani2; Fera Hidayati2; Deshinta Putri Mulya3; Doni Priambodo3; Fajar Waskito4
1 Cardiology rResident, Department of Cardiology and Vascular Medicine, Faculty of Medicine, Universitas Gadjah Mada, Yogyakarta, Indonesia, Sleman, Indonesia; 2Department of Cardiology and Vascular Medicine, Faculty of Medicine, Universitas Gadjah Mada, Yogyakarta, Indonesia, Sleman, Indonesia; 3Department of Internal Medicine, Faculty of Medicine, Universitas Gadjah Mada, Yogyakarta, Indonesia, Sleman, Indonesia; 4Department of Dermatology and Venerology, Faculty of Medicine, Universitas Gadjah Mada, Yogyakarta, Indonesia, Sleman, Indonesia
Objectives: Allergic contact dermatitis related to CIED implantation was a rare condition. In this case, we report an allergic contact dermatitis caused by conductor material that mimics CIED infection.
Materials and Methods: A 70 years old male with heart failure reduced ejection fraction (HFrEF) New York Heart Association (NYHA) III because of dilated cardiomyopathy with no coronary artery disease. Electrocardiography showed sinus rhythm with left bundle branch block and QRS duration was 200 ms. Echocardiography showed LV dilatation with EF of 26%. The patient is still symptomatic despite guideline‐directed medical treatment (GDMT). During follow up sinus node dysfunction was found. Implantation of cardiac resynchronization therapy‐pacemaker (CRT‐P) was performed. Five months after the procedure, erythema and itching around the pacemaker wound were complained. Five days later wound get worsens with purulent pus with the suspicion of a pacemaker infection.
Results: Blood, wound, and pus culture were taken preceded antibiotic therapy and they showed no microbial colonization. Patch test revealed Nickel (II) Sulphate Hexahydrate and Potassium Dichromate which was conductor material in the device lead as an allergen. The CRT‐P system was explanted, and a dual chamber pacemaker was implanted. The evaluation showed improvement in symptom. We reported an allergic contact dermatitis because of a metallic component in CIED lead which caused a desensitization hypersensitivity process.
Conclusion: Removal of the device and replacement with another model that not containing documented allergens is the best treatment.
Supporting Documents


OP‐125A‐2‐CIED (TRACK 6 ‐ CIED 6)
Model 3830 lead performance for left bundle branch area pacing: Results from a Multi‐Center Registry
Pugazhendhi Vijayaraman 1; Michael West2; Thomas Dresing3; Jess Oren1; Anne Sexter4; Patrick Zimmerman5; Rebecca Bauer5; Hardik Mangrolia6
1 Geisinger Heart Institute, Wilkes‐Barre, United States; 2Presbyterian Heart and Vascular Care, Albuquerque, USA; 3Cleveland Clinic, Cleveland, USA; 4Medtronic, Inc., Minneapolis, USA; 5Medtronic, Inc., Mounds View, USA; 6Saint Luke's University Health Network, Bethlehem, USA
Objective: Left Bundle Branch Area Pacing (LBBAP) with the SelectSecure Model 3830 lead provides physiologic pacing and is an alternative for patients requiring ventricular pacing. The Medtronic Product Surveillance Registry (PSR) is an on‐going global, multi‐center registry that collects data from routine clinical practice. The purpose of this analysis was to characterize the performance of LBBAP with the Model 3830 lead among patients enrolled in the PSR.
Materials and Methods: This observational analysis included patients who underwent pacemaker implantations with LBBAP between May 2018 and February 2022. Patients were included in this analysis if they were implanted with a Model 3830 lead for LBBAP. The primary outcomes were lead‐related complications and elevated pacing capture threshold (PCT). R wave amplitudes were summarized.
Results: A total of 312 patients were included across 25 centers (mean age 74, 41% male). At implant, the mean PCT was 0.63 V ± 0.34 V and the mean R wave amplitude was 12.96 mV ± 7.32 mV. At 6 months post‐implant, the lead complication rate was 3.0% (95% 1‐sided upper limit 5.9%), and the mean PCT was 0.79 ± 0.24 V. Out of 130 leads, 1 had a PCT >2.5 V (0.8% with 95% 1‐sided upper limit 3.6%). The mean R wave amplitude was 16.10 mV ± 8.63 mV.
Conclusions: In a multi‐center cohort of pacemaker patients with Model 3830 LBBAP, the lead complication and elevated PCT rates were low through 6 months. These data suggest LBBAP with Model 3830 is viable for physiologic pacing.
OP‐126‐1‐CIED (TRACK 7 ‐ CIED 2)
Mid‐term feasibility of left bundle branch pacing with standard stylet‐driven leads and predictors of success
Ga‐In Yu 1; Tae‐Hoon Kim2; Hee Tae Yu2; Boyoung Joung2; Hui‐Nam Pak2; Moon‐Hyoung Lee2
1 GyeongSang National University College of Medicine, South Korea; 2Yonsei University College of Medicine, South Korea
Objective: Initially, left bundle branch area pacing (LBBAP) was achieved through a lumen‐less lead, and it has been reported that LBBAP using a standard stylet‐driven lead (SDL) is also available. The purpose of this study is to establish the feasibility and mid‐term outcome of LBBAP using SDL and to investigate the predictors of success.
Methods: This study enrolled a total of 119 patients who underwent LBBAP from December 2020 to February 2022. LBBAP was performed with a 5.6Fr stylet‐driven pacing lead with an extendable helix (Solia S60, Biotronik, SE & Co, KG). We analyzed the initial outcomes of the procedure, including the success rate and complications, and identified predictive factors that affect them. lead parameters were assessed in follow‐up.
Results: Total success rate of lead implantation of LBBAP with conventional stylet‐driven lead was 95.8% for the entire period. The larger the RA size, the greater the number of trials (Estimates = 1.770 [1.10–2.44], p = <0.001), and the smaller the RV size, the greater the number of trials (Estimates = −0.923 [−1.64 ‐ ‐0.21], p = 0.012). The mean thresholds at implant, 2 months and 6 months were 0.90 ± 0.80 V at 0.5 ms, 0.80 ± 0.16 V at 0.5 ms, and 0.87 ± 0.28 V at 0.5 ms, respectively, in the total period.
Conclusion: LBBAP with conventional stylet‐driven lead is a feasible and safe pacing modality. It has a high success rate and fewer complications, satisfied and stable lead parameters in intermediate‐term observations.
OP‐127‐1‐CIED (TRACK 7 ‐ CIED 2)
Pitfall of left bundle branch area pacing in complete heart block and ASD Primum post‐closure
Widuri Wita Shariefuddin; Giky Karwiky; Mohammad Iqbal; Chaerul Achmad
Department of Cardiology And Vascular Medicine, Faculty Of Medicine Universitas Padjadjaran, Dr. Hasan Sadikin General Hospital, Bandung, Indonesia
Case Presentation: Conduction disorder is seen in some patients with atrial septal defect (ASD), therefore higher‐grade AV nodal conduction abnormalities are frequently seen in patients with ostium primum ASD. We presented a case report of a young woman with ostium ASD primum, congenital complete heart block undergoing left bundle branch area pacing (LBBAP) implantation. We highlight the pitfall that might be encountered.
A 22‐years old woman undergo elective ASD closure surgery, the defect was closed using a patch. During surgery, the patient was placed epicardial temporary pacemaker and planned to do permanent pacemaker (PPM). Because PPM was done after surgical closure, there were some pitfalls because of anatomical changes; 1) PPM lead might enter through a fenestrated patch or residual shunt to the left ventricle (LV), 2) Lead can enter the coronary sinus, in this case, we get electrical signals but the PPM cannot be paced, 3) In the normal heart LBBB morphology obtain during RV septum before we screw in the septum, but in this case, RBBB morphology was shown during RV septum pacing because of RV enlargement. Contrast injection to the confirmed lead position at the right ventricular (RV) septum. After the lead penetrates the septum, we use LBBAP to establish criteria to asure successful implantation of LBBAP.
Conclusion: Implantation of a pacemaker in ostium primum ASD is challenging because there have been anatomical changes, especially after surgery. During the implantation procedure, there are pitfalls that we must be aware of.
Supporting Documents

FIGURE 1 Contrast injection during LBBAP implantation; A. Contrast fills the coronary sinus, B. Electrocardiogram showed signal but cannot be paced.

FIGURE 2 Contrast injection to confirm lead placement; A. Contrast provides an RV septum image, B. Electrocardiogram after LBBAP implantation.
OP‐128‐1‐CIED (TRACK 7 ‐ CIED 2)
Impact of proposed pacing guidelines on current practice
Elizabeth Woollard; Mikhail Alexander; James Lambert; Vincent Paul
Fiona Stanley Hospital, Murdoch, Australia
Objectives: With emerging evidence in support of Left Bundle Branch Area Pacing (LBBAP), the Latin American Heart Rhythm Society proposed pacing guidelines “for the avoidance and mitigation of heart failure” that were released for public comment in March. They support transthoracic echocardiography (TTE) prior to all permanent pacemaker implants (Class 1, Level A) to select the most appropriate device. They also suggest that patients with a substantial burden of pacing – even with normal left ventricular function ‐ should be considered for physiological pacing given the known incidence of right ventricle (RV) pacing‐induced cardiomyopathy. This study assesses our pacing practice and examines the potential impact of the proposed guidelines.
Materials and Methods: Device insertions at a tertiary hospital for the first two months of 2022 were reviewed. Data collected included TTE details pre‐procedure, device indication and type, and percentage pacing at review.
Results: During the study period 64 new devices were implanted. Twelve of those patients (mean age 78) did not have a documented TTE prior to the procedure. One patient who received traditional RV pacing had a TTE post‐device implant demonstrating significant LV dysfunction suggesting a possible benefit from physiological pacing. Of the 58 patients who received traditional RV pacing, 31 subsequently received ‘substantial pacing’ suggesting physiological pacing may have been beneficial.
Conclusion: Adherence to proposed guidelines would place a greater emphasis on pre‐assessment and may lead to a higher proportion of patients receiving physiological pacing; a change from current practice.
OP‐129‐1‐CIED (TRACK 7 ‐ CIED 2)
Leadless left bundle branch area pacing: A feasibility study
Mark Elliott 1,2; Nadeev Wijesuriya1,2; Vishal Mehta1,2; Peggy Jacon3; Steven Niederer1; Jeffrey Alison4; Olivier Piot5; Paul Roberts6; John Paisey6; Pascal Defaye3; Christopher Aldo Rinaldi1,2
1 King's College London, London, United Kingdom; 2Guys and St Thomas NHS Foundation Trust, London, United Kingdom; 3Grenobles Alpes University Hospital, Grenobles, France; 4Monash Heart, Melbourne, Australia; 5Centre Cardiologique du Nord, Paris, France; 6University Hospital Southampton NHS Foundation Trust, Southampton, United Kingdom
Objective: The WiSE‐CRT system (EBR systems, CA, USA) delivers leadless LV endocardial pacing. The system comprises a subcutaneous generator, intercostal transmitter, and an LV endocardial electrode. The electrode is conventionally placed on the LV lateral wall, however, positioning on the septum may allow capture of the left bundle branch. The objective of this study was to assess the feasibility of leadless left bundle branch area pacing (LBBAP) using the WiSE‐CRT system.
Materials and Methods: 8 patients underwent WiSE‐CRT implantation. Electrical mapping was performed by positioning a multipolar catheter along the LV septum to locate a Purkinje potential and assess temporary pacing at this site. The electrode was implanted on the LV septum via an inter‐atrial transseptal approach using a deflectable sheath.
Results: Implantation was successful in all 8 patients with biventricular capture confirmed on ECG. There was a significant reduction in QRS duration during biventricular pacing (187.1 ± 33.8 vs 149.5 ± 15.7 ms, p = 0.01). During temporary LV pacing, QRS duration was reduced further (139.8 ± 12.4 ms). In 4 patients the LV activation time in ECG leads V5/V6 was <90 ms, suggesting left bundle capture. At follow‐up, the median LV pacing percentage was 98.5% and 75% of patients improved symptomatically. Follow‐up echocardiographic data were available for 6 patients, of whom 50% demonstrated evidence of LV reverse remodeling.
Supporting Documents
Conclusion: We have demonstrated the technical feasibility of performing leadless LBBAP using the WiSE‐CRT system. Further study is required to assess the safety and efficacy of this technique.

OP‐130‐1‐CIED (TRACK 7 ‐ CIED 2)
Septal fibrosis is associated with attenuated left ventricular resynchronization during left bundle branch area pacing
Mark Elliott 1,2; Marina Strocchi1; Vishal Mehta1,2; Nadeev Wijesuriya1,2; Steven Niederer1; Christopher A. Rinaldi1,2
1 King's College London, London, United Kingdom; 2Guy's and St Thomas' NHS Foundation Trust, London, UK
Objective: Left bundle branch area pacing (LBBAP) can provide effective cardiac resynchronization in patients with dyssynchronous heart failure. Around a third of patients with dilated cardiomyopathy have evidence of septal fibrosis on cardiac MRI. Myocardial infarction can also cause subendocardial fibrosis in this region. We aimed to assess the effect of septal fibrosis on LBBAP using electrocardiographic imaging (ECGi).
Materials and Methods: 8 patients who met clinical indications for CRT underwent cardiac MRI with late gadolinium enhancement prior to a temporary pacing procedure. LBBAP was performed with a decapolar catheter placed along the LV septum via the femoral artery and retrograde aortic access. Reconstructed epicardial potentials from a CardioInsight ECGi vest (Medtronic, MN, USA) were used to calculate LV activation time (LVAT‐95) and LV dyssynchrony index (LVDI).
Results: Non‐ischemic septal fibrosis was present in 3 patients, and subendocardial ischemic fibrosis in one patient. Four patients had no evidence of fibrosis in the septum. Five patients had LBBB, 3 had an RV‐paced rhythm, and 1 had RBBB. The mean LV ejection fraction was 27.4 ± 6.0%. Overall, LBBAP reduced LVAT‐95 by 49.5 ± 23.7% and LVDI by 52.9 ± 22.3% from baseline. Reductions in LVAT‐95 and LVDI were lower in patients with septal fibrosis compared to those without (28.1 ± 22.4% vs 66.6 ± 10.0%; p = 0.02 and 33.0 ± 23.4% vs 66.7 ± 6.7%; p = 0.03 respectively).
Conclusion: Septal fibrosis on cardiac MRI is associated with attenuated LV resynchronization during LBBAP. Cardiac MRI may prove useful in selecting the optimal resynchronization strategy.
Supporting Documents

OP‐131‐1‐CIED (TRACK 7 ‐ CIED 2)
The first totally leadless CRT system in the US
Dinesh Sharma 1; Sankalp Patel1; Donald Melhorn1; Laura Muller1; Kumar Narayanan2
1 Nch Healthcare System, Naples, United States; 2Medicover Hospitals, Hyderabad, India
Abstract submitted under supporting document.
Supporting Documents
Objective: LV endocardial pacing (LVP) with the WiSE‐CRT System is feasible. MICRA AV and LVP provide an option for totally leadless cardiac resynchronization (CRT). We describe the first completely leadless CRT system case performed in the US.
Methods: An 82‐year‐old male with non‐ischemic cardiomyopathy, end‐stage renal disease on hemodialysis, ejection fraction (EF) of 40% was admitted for acute congestive heart failure, NYHA III. EF was depressed despite medical therapy for 3 months. Conventional CRT‐P was precluded because of bilateral subclavian vein occlusion. After discussion with the patient, MICRA AV and WiSE‐CRT were planned for a completely leadless CRT (Figure 1).
Results: MICRA was implanted successfully through the right femoral venous approach. WiSE‐CRT subcutaneous Battery and Transmitter implantation were also uneventful. LV Electrode implantation was initially attempted by transseptal approach; however, it prematurely detached and subsequently embolized to a small pelvic artery without clinical sequelae. A transaortic approach was utilized the second time because of a more optimal approach to the target wall segment. Anchoring of the Electrode was confirmed in multiple fluoroscopic views prior to detachment. The procedure was completed successfully with acceptable thresholds (Figure 2). At 5 months follow‐up, EKG demonstrated a QRS width decrease from 184 to 144 msec (Figure 3), and EF increased to 55%.
Conclusion: Fully leadless CRT implantation using the MICRA and WiSE‐CRT is feasible and provides a valuable alternative in patients with venous occlusions. Careful attention to technique, especially in the initial learning curve is warranted to improve implantation safety.

FIGURE 1 The WiSE‐CRT Electrode in LV is stimulated by ultrasonic waves. LV stimulation is timed off the sensed pulse from MICRA.

FIGURE 2 Fluoro image demonstrating MICRA in the RV, WISE‐CRT Electrode in LV, subcutaneous battery, and subcutaneous Electrode.

FIGURE 3 (a) EKG pre‐procedure (b) EKG post CRT.
OP‐132‐2‐CIED (TRACK 7 ‐ CIED 4)
Outcomes of his‐bundle pacing in patients with complete heart block: A propensity score‐matching study
Xucong Ruan 1; Khi Yung Fong2; Mon Hnin Tun3; Eugene Tan4; Elaine Boey5; Rodney Soh4; Hiong Hiong Gan4; Jie Ying Lee4; Jie ting Lisa Teo6; Colin Yeo7; Swee Chong Seow4; Pipin Kojodjojo4; Vern Hsen Tan7
1 Cardiology Residency, Singhealth, Singapore; 2Yong Loo Lin School of Medicine, National University of Singapore; 3Department of Health Services Research, Changi General Hospital, Singapore; 4Department of Cardiology, National University Heart Centre Singapore; 5Division of Cardiology, Ng Teng Fong General Hospital, Singapore; 6Clinical Measurement Unit, Changi General Hospital, Singapore; 7Department of Cardiology, Changi General Hospital, Singapore
His bundle pacing (HBP) can be technically challenging compared to conventional right ventricular pacing. Utilization of an electrophysiology recording system (EPRS) can aid visualization of intracardiac signals, in particular His signals. We sought to evaluate the acute procedural and medium‐term outcomes of HBP in patients with complete heart block (CHB), comparing those with or without EPRS in a propensity score‐matched (PSM) cohort.
This was a PSM multicenter study on consecutive patients with CHB who underwent HBP between August 2018 to December 2020. The primary outcome was the acute HBP procedural success defined as either selective or non‐selective His bundle capture with a threshold of ≦2.0 V at 1 ms at the end of procedure implantation. Secondary outcomes included acute procedural complications and medium‐term follow‐up outcomes of HBP lead performance, heart failure hospitalization, and all‐cause mortality.
A total of 130 CHB patients were recruited for the study, of which HBP was performed with HPRS in 37 patients (28.5%) and without HPRS in 93 patients (71.5%). After PSM, the acute success rate of HBP was similar between both groups (ATT = −0.367; SE = 0.218, p = 0.09). The acute procedure complication rate was also similar. After a mean follow‐up duration of 238.1 ± 210.6 days, there were no significant differences in HBP lead performance, in particular incidence of high pacing threshold >3 V at 1 ms (ATT = −0.110; SE = 0.199, p = 0.58), heart failure hospitalization (ATT = −0.015; SE = 0.013, p = 0.23) or all‐cause mortality (ATT = 0.038; SE = 0.079, p = 0.63).
HBP in CHB patients in centers with or without HPRS showed similar acute procedure success and complication rates.
OP‐133‐2‐CIED (TRACK 7 ‐ CIED 4)
A case of right‐sided permanent pacemaker implantation after Venoplasty of the superior vena cava stenosis
Kaye Eunice Lustestica; Mapili Jerahmeel Aleson; Pocholo Carlo Bernardo; Margaret Francine Co; Tricia Angela Sarile; Anna Franceska Abarquez; Michael Joseph Agbayani
Philippine General Hospital, Ermita, Philippines
Objectives: To present a case of right‐sided permanent pacemaker implantation after balloon venoplasty of the superior vena cava stenosis with the development of acute cardiac tamponade.
Results: A 42‐year‐old Filipino female, hypertensive, CKD stage V on hemodialysis, presented with dizziness and loss of consciousness. Electrocardiogram showed sinus rhythm in third‐degree AV block with junctional escape rhythm. She was advised for permanent pacemaker implantation (PPI) with a right‐sided implant because of the presence of arteriovenous (AV) fistula on the left arm. However, her venogram showed stenosis of the superior vena cava (SVC). The patient underwent successful venoplasty of the SVC and right‐sided single chamber PPI. Intraoperatively she developed acute cardiac tamponade because of RV perforation and emergent ventriculograhaphy with the subxiphoid pericardial window was done. The patient was sent home after five days improved and stable.
SVC stenosis is a common complication among patients with hemodialysis access. In PPI, the left subclavian vein is accessed and advanced to the SVC to position the leads in the right atrium and right ventricle. Pacemaker implantation after balloon venoplasty of SVC stenosis is uncommon and there are few published case reports.
Conclusion: We have demonstrated that balloon venoplasty of a superior vena cava stenosis to facilitate right‐sided permanent pacemaker implantation may be done successfully and that acute cardiac tamponade secondary to right ventricle perforation during lead insertion is one of the risks that should be anticipated which required urgent evaluation and treatment.
OP‐134‐2‐CIED (TRACK 7 ‐ CIED 4)
A case of Wolff‐Parkinson‐White syndrome in Ebstein anomaly
Sherry Mae Mondido; Giselle Gervacio; Michael‐Joseph Agbayani; Jhobeleen De Leon; Celia Uy; Marie Kirk Patrich Maramara; Roxanne Yen Bongcawil
Philippine General Hospital, Manila, Philippines
Objective: We present a case of a 25‐year‐old female with a known Ebstein Anomaly presenting with palpitations who underwent successful radiofrequency ablation.
Results: A 25‐year‐old female consulted at the outpatient clinic because of palpitations, lightheadedness, and near‐syncope. Resting ECG showed Wolff‐Parkinson‐White Pattern with a negative delta wave on V1, an R/S ratio of <0.5 in V1, and V2 and <1 in aVF pointing to a right‐sided posterior or posterolateral accessory pathway (AP). 2D‐echo showed apical displacement of the tricuspid valves toward the right ventricular apex and right ventricle atrialization suggestive of Ebstein Anomaly. She eventually underwent an electrophysiological study where inducible othrodromic atrioventricular reentrant tachycardia was noted. Conventional radiofrequency ablation of AP was successfully done at 7 o'clock of the tricuspid valve with loss of antegrade conduction and 6 o'clock position with loss of retrograde conduction. She improved with no pre‐excitation on ECG.
One week post‐RFA, she complained of palpitations and had incessant supraventricular tachycardia. Redo radiofrequency ablation of AP in the tricuspid valve annulus at the 6 o'clock position guided by 3D mapping was done. She was sent home improved and planned for definitive surgery.
Conclusion: Accessory conduction pathways are common in patients with Ebstein Anomaly. It may be because of the expanded tricuspid annular region caused by the displacement of the tricuspid valve. Electrophysiologic testing followed by ablation therapy is recommended. Early recurrence of arrhythmia post‐RFA might be related to multiple accessory pathways and the use of fluoroscopy without a 3‐dimensional electroanatomic mapping system.
OP‐134‐2‐CIED (TRACK 7 ‐ CIED 4)
Conduction system pacing using stylet‐driven Lead guided by deflectable mapping catheter: Single‐Centre experience
K. A. Mohamed Akram; S. Sangeetha; Anand Pasula; Anindya Ghosh; Ulhas Pandurangi
The Madras Medical Mission Hospital, Chennai, India, Chennai, India
Objectives: Conduction system pacing (CSP) in the recent years is being considered as an ideal pacing strategy. Lumenless leads (LLLs) have been the only used technology since the inception of CSP until recently. We herein share the largest single‐centre experience of SDL using deflectable mapping sheath, a recent technology for conduction system pacing at both HB and LB areas, and their medium‐term outcomes.
Materials and Methods: Patients with pacing indications according to the ESC guidelines enrolled between June 2021–July 2022. The aim of this study is to evaluate the safety and feasibility of CSP using SDL guided by mapping and deflectable delivery sheath by analyzing the implant tools, and electrical parameters during implant and follow‐up.
Results: A total of 30 patients with the mean age of 67.16 +/− 9.89 years (16males, 53.3%), The indications were SSS (7 patients, 23.0%) and CHB (23 patients, 76.6%), CSP was achieved in 80% of the patients (11 His bundle pacing, 11 Left bundle pacing). Acute procedural failure is 20% (5 Septal pacing, 2 RV apical pacing, 1 LLL). The mean fluoroscopy time was 45mins. The QRS width pre and post‐procedure was 118.9 ms and 116.8 ms, respectively. The average implant electrical parameters were pacing threshold 1.08 V; R wave amplitude; 7.09 +/− 3.36 m, pacing impedance 632+/− 183ohms remained stable at 3 months follow‐up.
Conclusion: The use of SDL is adequate for both HB and LB areas. Reshaping the catheter can help in achieving better results in CSP and also lower the overall procedure time.
Supporting Documents

OP‐135‐2‐CIED (TRACK 7 ‐ CIED 4)
Left bundle optimized implantable cardioverter defibrillator In‐Lieu of cardiac resynchronization therapy—Defibrillator
Priya Sangeetha; K. A. Mohamed Akram; Pasula Anand; Balaji Aparna; Monisha; Ghosh Anindya; Ulhas M. Pandurangi
The Madras Medical Mission Hospital, Chennai, India, Chennai, India
Objectives: To discuss the feasibility and efficacy of Left Bundle Branch Area Pacing (LBBAP) Optimized Implantable Cardioverter Defibrillator (LOT‐ICD) in patients indicated for Cardiac Resynchronization Therapy Defibrillator (CRT‐D).
Materials and Methods: Patients with LBBB, LVEF<35%, and NYHA class II‐III qualify for CRT‐D. We discuss the population of people in which the conventional Coronary Sinus (CS) lead was replaced with LBBAP lead because of challenges associated with CS anatomy. During the procedure 1 (10%) CS dissection, 3 (30%) Sub‐Optimal CS tributaries, 4 (40%) Difficult CS anatomy, 2 (20%) High LV threshold, and Phrenic Nerve Stimulation were noted. As a result of these challenges, we opted for a Left bundle Optimized ICD (LOT‐ICD) using Lumenless Leads for 9 (90%) and Stylet‐Driven Lead for 1 (10%) patients.5 patients were followed up using Remote Monitoring (RM). Procedural success and adverse events from RM were analyzed.
Results: A total of 10 patients (Male: 6 (60%), Female: 4 (40%), Mean age: 65 ± 10.5 years), ICMP: 4 (40%), NICMP: 6 (60%), Mean LVEF: 25.6 ± 5.56%, were selected for CRT–D but underwent LOT‐ICD implantation because of procedural difficulties. 6 (60%) patients had been implanted for primary prevention and 4 (40%) for secondary prevention. The averageIntrinsic QRS: 147.8 ms, Paced QRS: 134.2 ms, and R wave: 9.45 mV were noted. 4 (40%) Selective LB capture, 4 (40%) Non‐Selective LB capture, 2 (20%) Myocardial capture, LB threshold: 0.75 V. 1 (10%) Therapy were noted.
Conclusion: Procedural difficulties and CS anatomy limit the outcomes of CRT‐D implantation. LOT‐ICD implantation in these patients helps in achieving resynchronization with adequate procedural outcomes.
OP‐136‐2‐CIED (TRACK 7 ‐ CIED 4)
Short term in hospital results of CIED extraction: A retrospective single‐center observational study
Ravikanth Telikicherla; Aparna Jaswal; Anil Saxena; Amitesh Chakraborty
Fortis Escorts Institute, New delhi, India
Objectives: To study the spectrum of indications, Procedural and In Hospital outcomes of CIED extraction.
Materials and Methods: This is a retrospective single‐centre study done at our centre. The patients who underwent CIED extraction (Complete or incomplete) from September 2019 to August 2022 were included in the study. The procedural and post‐procedural outcomes in these patients were studied.
Results: Twenty‐six patients with the mean age of 61.8 + 13.9 yrs were included in the study. Nineteen (73%) of them were males. Hypertension (69.2%) was the commonest risk factor. Most of them underwent extraction for CIED infection except for two subjects. The mean duration from implantation to explantation was 86.84 months. Eight were CRT (2 CRT‐P, 6 CRT‐D), 3 were ICD, and 15 were pacemakers. Sixteen underwent complete extraction. Lead removal was not attempted in three subjects because of high risk. In 07 subjects, extraction failed. Extraction tools were used in 11 subjects. Tools used were Endovascular Spectranics Tight Rail Rotating Dilator Sheath extraction kit and Snare from the femoral site (3 cases). The success was more with Screwing leads (80%) when compared to tined leads (64%). One patient died during extraction of ICD because of cardiac tamponade.
Conclusion: CIED extraction is a complicated procedure but results are good if planned well. We have a very good Success rate with procedural and In hospital mortality rate of 3.8%. Our study is limited being a single centred and retrospective in nature.
OP‐137‐2‐CIED (TRACK 7 ‐ CIED 4)
Electrocardiographic characteristics of left bundle branch area pacing versus left bundle optimized cardiac resynchronization therapy
Chinmay Parale; Dinakar Bootla; Ashish Jain; Raja Selvaraj
Jawaharlal Institute of Postgraduate Medical Education and Research, India
Supporting Documents
Objectives: To compare the electrocardiographic characteristics between Left Bundle Branch Area Pacing (LBBAP) and Left Bundle Optimized Cardiac Resynchronization Therapy (LOT‐CRT).
Materials and Methods: Patients with non‐ischemic cardiomyopathy and left bundle branch block with left ventricular ejection fraction <35% who underwent LOT‐CRT with implantation of an atrial lead, a left bundle lead, and a coronary sinus lead were included in this prospective observational study. Digital 12 lead electrocardiograms were recorded in three pacing modes—AAI, DDD with pacing from the left bundle lead (LBBAP), and DDD with pacing from both left bundle and left ventricular leads (LOT‐CRT). QRS duration (QRSd), QT, JT, and T peak–T end (TpTe) intervals were compared between the three modes.
Results: Eleven patients (Mean age 52 years; 63% males) were included in this study. LOT‐CRT resulted in a narrower QRS compared to LBBAP and a significant reduction of QRSd compared to AAI (175.8 ± 29.6 ms to 152.3 ± 19 ms; p = 0.04), unlike LBBAP (163 ± 27.9 ms; p = 0.26). Patients with a wider QRS at baseline had a greater incremental reduction in QRSd with LOT‐CRT (R = 0.76, p = 0.02). There was no difference in QT and JT intervals between the three groups. Compared to baseline and LBBAP, the TpTe interval was significantly reduced with LOT‐CRT (97, 83.7, and 72.9 ms, respectively; p = 0.04).
Conclusions: An additional left ventricular lead over and above the left bundle branch area pacing alone for cardiac resynchronization therapy results in a narrower QRS. This is likely to result in better long‐term outcomes.

FIGURE 1 Representative image from one of the patients showing a baseline QRS width of 166 ms, which was reduced to 150 ms with LBBAP and to 138 ms with LOT‐CRT.
OP‐138‐2‐CIED (TRACK 7 ‐CIED 7)
Initial real‐world experience with a helix‐based ventricular leadless pacemaker: Single‐center experiences
Devi Nair1; Vivek Reddy 2
1 St. Bernards Medical Center, Jonnesboro, United States; 2Mount Sinai Health System, New York, United States
Objectives: Approximately 1 in 6 conventional, transvenous pacemaker patients experience complications within the first 3 years post‐implant. Many of these complications, specifically those involving the lead or subcutaneous pocket, may be avoided with leadless pacemakers (LPs) implanted entirely within the target chamber. This study evaluated the initial commercial experience of a novel single‐chamber, ventricular LP (Aveir VR, Abbott), designed with a helix‐based fixation mechanism.
Methods: Patients implanted with an Aveir VR device were consecutively included in this evaluation after the commercial release of the product in the United States. Implant procedural durations and electrical parameters were measured, along with any acute procedure‐related complications.
Results: Patients from a single center (N = 27, 56% male) were implanted with an Aveir VR LP. The median [interquartile range] total procedure duration was 23 [20–29] min, with a fluoroscopy duration of 4 [4–6] min. By employing Aveir's electrical mapping capability prior to fixation (1 site mapped in 74% of patients, 2 sites in 26%), repositioning after fixation that can potentially lead to clinical complications was avoided in 96% of pts. LPs were implanted in the lower (96%) or mid (4%) RV septum. Pacing capture threshold @ 0.4 ms, R‐wave amplitude, and pacing impedance was 0.8 [0.5–1.3] V, 10.0 [8.1–12.7] mV, and 750 [623–955] Ω. No acute complications were observed in this initial cohort.
Conclusion: The initial, real‐world, single‐center experience of Aveir VR leadless pacemakers with mapping capability demonstrated safe and efficient implantation with minimal repositioning, viable electrical metrics, and no acute complications.
Supporting Documents

OP‐142‐2‐CIED (TRACK 7 ‐CIED 7)
Effects of envelopes on CIED pocket healing: A head‐to‐head preclinical evaluation
Renu Virmani 1; John Kassotis2; Suneet Mittal3; D'Anne Kudlik4; Francois Phillipon5
1 CV Path Institute, Gaithersburg MD; 2Rutgers RWJ Medical School, New Brunswick NJ; 3Valley Health System, Ridgewood, NJ; 4Medtronic Inc., Mounds View MN; 5Institut Universitaire de Cardiologie et de Pneumologie de Québec (IUCPQ), Québec, Canada
Objectives: The body's immune response to cardiac implantable electronic device (CIED) implantation results in capsule formation with the healthy surrounding tissue. Alternatively, chronic inflammation and infection can disrupt healing, cause pocket instability, and increase morbidity and cost, while complicating future interventions. This study compares the CIED pocket healing effects of the recently developed third‐generation TYRX absorbable antibacterial envelope (T3) vs. the CanGaroo envelope derived from the porcine extracellular matrix (ECM).
Materials/Methods: CIEDs were implanted in an ovine model with T3 or ECM per manufacturer's instructions or with no envelope (control). At least one control was implanted per animal. Across 21 sheep, 90 CIED pockets were evaluated (T3 = 32, ECM = 20, control = 38). Morphometric and histopathologic analyses were completed for pockets at 3 days, 7 days, 4 wks, 12 wks, and 24 wks post‐implant. An independent pathologist completed blinded histopathology assessment of tissue blocks using ISO 10993‐6:2016 scoring standards.
Results: The healing process peaked early at 4 wks for T3 (lymphocytes = 1.4, macrophages = 2.4) compared to ECM (lymphocytes = 2.7 at 24 wks, macrophages = 3.0 at 12 wks). ECM had consistently elevated lymphocytes compared to T3 through 24 wks (T3 = 0.5, ECM = 2.7, Control = 0.5), suggesting ongoing inflammation. Capsule thickness decreased over time for all groups from 4 wks (T3 = 1.44 ± 0.16, ECM = 2.31 ± 0.10, Control = 0.89 ± 0.33 mm), and T3 resulted in the thinnest mature capsules at 24 wks (T3 = 0.37 ± 0.10, ECM = 0.80 ± 0.14, Control = 0.56 ± 0.17 mm).
Conclusion: The TYRX T3 absorbable antibacterial envelope was associated with a more rapid healing response with less inflammation and thinner capsule formation compared to ECM.
OP‐143‐2‐CIED (TRACK 7 ‐CIED 7)
Pre‐clinical evaluation of a third‐generation absorbable antibacterial envelope
Charles Love 1,2; Melissa Christie1; Ibrahim Hanna3; George Thomas4; Arnold Greenspon5; Matt Sanders1; Carrie Bauer1; Matt Christopherson1; Bill Schindeldecker1; Nicole Kirchhof1; Vasanthi Balaji1; Shira Skulsky1; M. Rizwan Sohail6
1 Medtronic Inc., Minneapolis MN; 2Johns Hopkins medicine, Baltimore MD; 3Brookwood Baptist health, Birmingham AL; 4Weill Cornell medicine, New York NY; 5Thomas Jefferson university hospital, Philadelphia PA; 6Baylor college of medicine, Houston TX
Objectives: The TYRX Absorbable Antibacterial Envelope has been shown to stabilize implantable cardiac devices and reduce infection. A third‐generation envelope (T3) has been developed to reduce surface roughness with a redesigned multifilament mesh and enhanced form factor but identical polymer coating and antibiotic concentrations as the currently available second‐generation envelope (T2). We compare drug elution, bacterial challenge efficacy, stabilization, and absorption of T3 vs. T2.
Materials/Methods: Antibiotic elution was assessed in vitro and in vivo. For efficacy against gram+/gram‐ bacteria, 40 rabbits underwent device insertions with and without T3 envelopes. For stabilization (migration, rotation), 5 sheep were implanted with 6 devices, each in T3 or T2 envelopes. Pre‐specified acceptance criteria were ≤ 83 mm migration and ≤ 90 degrees rotation. Absorption was assessed via gross pathology.
Results: Elution curves were equivalent (similarity factors ≥50 per FDA guidance1). T3 eluted antibiotics above minimal inhibitory concentration (MIC) in vivo at 2 hr post‐implant through 7d, consistent with T2. The bacterial challenge showed reductions (p < 0.05) in infection with T2 and T3. Device migration was 5.5 ± 3.5 (T3) vs. 9.9 ± 7.9 mm (T2) (p < 0.05). Device rotation was 18.9 ± 11.4 (T3) vs. 17.6 ± 15.1 degrees (T2) and did not differ statistically (p = 0.79). Gross pathology confirmed the absence of luminal mesh remainders and no differences in peri‐device fibrosis at 9 or 12 wks.
Conclusion: The T3 absorbable antibacterial envelope demonstrated equivalent pre‐clinical performance compared to T2 as antibiotic elution curves were similar, elution was above the MIC for 7d, infections were reduced compared to no envelope, and acceptance criteria for migration, rotation, and absorption were met.
OP‐144‐2‐CIED (TRACK 8 ‐CIED 8)
The lower complications rate after pacemaker implantation—A Real‐World observation from a Low‐Middle‐Income country
Intisar Ahmed; Hunaina Shahab; Aamir Khan
Aga Khan University, Karachi, Pakistan
Objectives: We aimed to study the pattern and frequency of complications of implants over a 10‐year period at a tertiary care hospital in a low‐middle‐income country.
Material and Methods: A retrospective observational study was conducted at the Aga Khan University Hospital, Pakistan, after obtaining the institutional ethical review committee approval (5343‐Med‐ERC‐18). All patients who underwent PPM implantation, from 2008 to 2018, were included. Statistical Package for Social Sciences (SPSS), version 23 was used for analysis.
Results: Out of 795 patients, 424 (53.3%) were males. The mean age at implantation was 70.8 ± 12.4 years. The third‐degree atrioventricular block was the indication for PPM implantation in 265 (40.3%) patients, followed by 2:1 AV block in 83 (12.6%), sinus node disease in 78 (11.9%), high‐degree AV block in 75 (11.4%) and tachy‐brady syndrome in 62 (9.4%) patients undergoing a new implant. There were a total of 138 generator changes for end‐of‐life or elective replacement indication. The overall complication rate was 4%. At a mean follow‐up of 82.6 weeks, complications were; lead dislodgement/displacement in 2.5% (n = 20), wound infection in 1% (n = 8), hematoma in 4 (0.5%), pneumothorax in 2 (0.2%) and access site venous thrombosis in 1 (0.1%). There was no mortality because of procedure or procedure‐related complications.
Conclusion: Our study showed that major complication rates from a tertiary care hospital in a low‐middle‐income country were comparable to developed global health care setups. This can be achieved if meticulous techniques and patient preparation protocols are followed.
OP‐145‐2‐CIED (TRACK 8 ‐CIED 8)
Subcutaneous—Implantable defibrillator (S‐ICD) in the prevention of sudden cardiac death—A Single‐Center experience
Jayachandra Amarapalli
Base Hospital, Delhi, India
Objective: Subcutaneous Implantable Defibrillator (S‐ICD) differs from the transvenous ICD (TV‐ICD) system in its extrathoracic and extravascular localization; eliminating the risks arising from vascular access, and leading to fewer complications. The objective was to describe the functionality and postoperative complications associated with S‐ICD implants in patients with cardiac dysfunctions.
Methods: The study sample comprised six patients indicated for S‐ICD because of either anterior wall myocardial infarction (MI) or left ventricular dysfunction who reported to a Tertiary Cardiac Care Center. Pre‐procedural evaluation for various cardiac parameters was carried out. The procedure was performed under antibiotic prophylaxis. Two incision techniques were used for the placement. The primary and secondary endpoints for the cases were set at evaluating the device‐related complications and evaluating prognostic outcomes, respectively.
Results: Subcutaneous Implantable Defibrillator (S‐ICD) was placed in six male patients with ages ranging from 36 to 51 years. The procedure demonstrated that it was effective, safe, and well‐tolerated in eliminating ventricular tachycardia/ventricular fibrillation and sudden cardiac death. Postoperative complications such as device infection, pocket hematoma, blood transfusion, prolonged hospitalization, cardiac perforation or tamponade, lead repositioning, or inappropriate shocks were not seen.
Conclusion: Subcutaneous Implantable Defibrillator (S‐ICD) promises to be a suitable alternative to TV‐ICD, especially in young patients. It circumvents the need to enter the heart and vasculature, resulting in fewer lead‐related complications, better cosmetic appearance, and greater comfort as it permits free movement of the shoulder.
OP‐146‐2‐CIED (TRACK 8 ‐CIED 8)
Worldwide experience with leadless pacemaker retrievals
Vivek Reddy 1; Petr Neuzil2; Derek Exner3; Reinoud Knops4; Daniel Cantillon5; Pascal Defaye6; Rajesh Banker7; Paul Friedman8; Stephanie Delgado9
1Icahn School of Medicine at Mount Sinai, New York, United States; 2 Na Homolce Hospital, Prague, Czech Republic; 3University of Calgary, Calgary, Canada; 4Amsterdam UMC, University of Amsterdam, Amsterdam, The Netherlands; 5Cleveland Clinic, Heart and Vascular Institute, Cleveland, United States; 6University Hospital of Grenoble Alpes, Grenoble, France; 7Hoag Memorial Hospital, Newport Beach, United States; 8Mayo Clinic, Rochester, United States; 9Abbott, Sylmar, United States
Objectives: Chronic retrievability is critical for the long‐term management of patients with Leadless cardiac pacemakers (LPs). Herein, we report worldwide chronic retrieval data of the Nanostim LP system out to nine years.
Materials and Methods: Subjects enrolled in any of three Abbott‐sponsored worldwide clinical trials (www.clinicaltrials.gov, NCT02051972, NCT02030418, and NCT01700244) that received a Nanostim right‐ventricular LP and had an attempted retrieval were included in the analysis. Sites collected data for retrieval attempts and documented serious or unexpected adverse device effects (SADEs/UADEs) associated with the retrieval procedure. An independent clinical events committee (CEC) adjudicated all SADEs/UADEs.
Results: A total of 1423 Nanostim LPs were successfully implanted across the three studies. There were 241 Nanostim retrievals attempted in 239 subjects between March 2014 and March 2022. The retrieval success rate was 88.0% (212/241) with 29 unsuccessful retrievals. The most common reason for unsuccessful retrieval was an inability to access the LP docking button (75.9%, 22/29). Other unsuccessful retrievals were because of the inability to deliver the retrieval catheter (3), detached docking button (2), inability to remove the retrieval snare (1), and inability to unscrew the LP from the ventricle wall (1). The mean time from implant to attempted retrieval was 3.09 ± 1.84 years (range 0 days ‐ 8.98 years). There was no significant difference in time from implant to successful retrieval versus unsuccessful retrieval (p = 0.71). There were 10 SADEs and a UADE adjudicated in 9 subjects (3.8%, 9/239).
Conclusion: Worldwide experience with Nanostim LP retrieval attempts in 239 subjects demonstrate a high success rate (88.0%).
OP‐147‐2‐CIED (TRACK 8 ‐CIED 8)
Utility of cardiac implantable electronic device algorithm in sleep Apnoea screening for patients with cardiomyopathy
Jiaqi Li 1; Yingjuan Mok2; Vern Hsen Tan2; Hang Siang Wong2; Yue Wang2; Sheldon Shao Guang Lee2; Ying Zi Oh2; Ai Ling Him2; Sherida Syed Hamid2; Janice Yi Ren Leo2; Jie Ying Liang2; Prunella Ting Lee2; Lisa Jie Ting Teo2; Leng Leng Lee2; Colin Yeo2
1 University of Cambridge, School of Clinical Medicine, United Kingdom; 2Changi General Hospital, Singapore
Objective: Half of the patients with heart failure are estimated to have sleep apnoea. However, many are undiagnosed as they do not report typical symptoms. This study aims to validate the inbuilt ICD sleep apnoea algorithm in a cohort of multi‐racial Asian patients for detecting severe sleep apnoea.
Materials and Methods: In this prospective pilot study, 24 participants who fulfilled ACC indications for an implantable cardiac defibrillator (ICD) of primary or secondary prevention of sudden cardiac death were recruited. Participants had no history of sleep apnoea. The Boston Scientific ICD has an inbuilt Apnoea Scan (AP Scan) algorithm that uses transthoracic impedance sensing to calculate a respiratory disturbance index (RDI). Using the AP Scan algorithm, we aim to validate its sensitivity and specificity against the gold standard polysomnography (PSG).
Results: Twenty‐four patients were enrolled and underwent PSG exams for formal investigation for OSA, and eighteen participants completed the study as of 23/08/2022. Severe sleep apnoea (defined as PSG‐AHI ≥30 episodes/h) was diagnosed by PSG in 66.7% of the patients. RDI was found to have a positive correlation with PSG‐AHI (r = 0.519, p < 0.05). The optimal cut‐off value for RDI for severe sleep apnoea is 41, with a sensitivity of 58% and specificity of 100%.
Conclusion: Transthoracic impedance sensing with an advanced inbuilt algorithm may be helpful to detect severe sleep apnoea in patients with heart failure and cardiomyopathy. This is the first study known to validate the algorithm in an exclusively multi‐ethnic Asian population with heart failure.
OP‐147a‐2‐CIED (TRACK 8 ‐CIED 8)
Long‐term follow‐up after left bundle branch pacing
Shunmuga Sundaram Ponnusamy; Vadivelu Ramalingam; Vithiya Ganesan; Thabish Syed; Selvaganesh Mariappan; Mahesh Kumar; Vijesh Anand; Senthil Murugan
1 Velammal Medical College Hospital and Research Institute, Madurai, India
Introduction: Left bundle branch pacing has evolved recently as an alternative modality for cardiac resynchronization therapy though the long‐term follow‐up data is largely unknown. The aim of our study is to assess the long‐term follow‐up of patients undergoing LBBP for the management of bradyarrhythmia and heart failure.
Methods: This was a prospective single‐center observational study involving consecutive patients who underwent successful left bundle branch pacing for bradyarrhythmia and as an alternative for cardiac resynchronization therapy since April 2019. LBBP was performed using C315 sheath and 3830 selectsecure lead in all patients and LBB‐capture was confirmed as per standard criteria. Electrocardiographic, pacing, and echocardiographic parameters were documented. In patients with heart failure, serial monitoring of left ventricular function, 6‐minute walk test, and NT‐pro BNP were performed. Patients were followed up in the device clinic at 15 days, 1 month, and every 3 months thereafter.
Applications: LBBP was successful in 405 out of 438 attempted patients (acute procedural success rate 92.4%). The reason for failure was the inability to penetrate the septum and incomplete QRS correction requiring biventricular pacing in heart failure patients. Indications for pacing include AV block (n = 174), CRT alternative (n = 148), sinus node dysfunction (n = 44), AV junction ablation (n = 22), and pacing‐induced cardiomyopathy (n = 17). The procedural success rate was higher in patients with baseline narrow QRS duration (96.2%). The mean fluoroscopy duration was 15.1 ± 8.7 minutes. The mean follow‐up duration was 20.1 ± 10.2 months. The operator learning curve for the procedure will be discussed. The procedural success rate, incidence of left bundle potential, non‐selective to selective capture transition, and change in ECG and echo parameters for patients with baseline narrow QRS, LBBB, and RBBB will be discussed. Pacing parameters remained stable during the mean follow‐up of 20.1 ± 10.2 months. Complications noted include septal perforation during implantation, coronary artery injury, septal hematoma, pneumothorax, and loss of LBB capture will be discussed. The predictors of septal perforation during implantation and loss of LBB capture during follow‐up will be discussed. To the best of our knowledge, this is the longest follow‐up data after LBBP was reported in the literature.
Next steps/Future: LBBP is a safe, feasible, and effective alternative modality to right ventricular pacing for bradyarrhythmia and biventricular pacing for cardiac resynchronization therapy. Long‐term follow‐up data is encouraging. Pacing parameters remain stable as opposed to His‐bundle pacing, hence reducing the need for a re‐do procedure. Future randomized trials are required to establish this cost‐effective therapy.
Supporting Documents

OP‐148‐2‐CIED (TRACK 8 ‐ CIED 5)
The chance of redo CABG after CRT‐D implantation response on heart failure and LBBB
Minh Hoang Quang; Van Tran Dai Quynh; Hoang Nguyen Anh; Dan Do Van Buu
FV Hospital, Ho Chi Minh city, Viet Nam
Objective: Ischemic myocardiopathy is one of the causes of heart failure (HF) and LBBB under the history of CABG and optimal medical treatment (OMT). The CRT response can improve heart failure and the chance for redo CABG or PCI again.
Material and Methods: The reporting case of 60‐year‐old male patient had a history of CABG and HF. He had some episodes of dyspnea and hospitalization and improved after OMT. During his admission, he has had an episode of dyspnea and leg edema, acute pulmonary edema, high NTproBNP, and TnT‐hs. The sinus rhythm with LBBB 180 ms on ECG and the echocardiography showed poor LVEF of 21% and severe mitral regurgitation.
The CAG showed only one graft supporting the LAD and total occlusion origin coronary artery. The strategy of RCA reopen was tried and failed.
The acute decompensated HF control with OMT under Dobutamine CRRT was performed.
For 6 week, he still had dyspnea at rest, legs edema with Furosemide 40 mg IV tid, and Dobutamine.
The strategy of CRT‐D implantation was performed as Class I.
After CRTD implantation, the optimized CRT was performed with LV4 to LV2, LV‐RV 20 ms, and SAV 100 ms. The ECG showed sinus rhythm, QRS 131 ms.
Result: The patient felt less dyspnea, stopped Dobutamine, transferred to the furosemide oral, controlled blood pressure, improved NYHA II, decreasingly NTproBNP, improved eGFR, added ARNI, and Spironolactone.
Once he is better, he will be transferred to CABG once again.
Conclusion: The ischemic myocardiopathy was rather difficult response due to akinesia of the left ventricle. So the CRT response will be the chance to redo CABG once again.
Supporting Documents

OP‐149‐2‐CIED (TRACK 8 ‐ CIED 5)
Permanent reverse remodeling after cardiac resynchronization therapy in a patient with ischemic heart disease
Moira Setiawan 1; Dony Yugo Hermanto2; Saga Sabara2
1 Faculty of Medicine, Universitas Indonesia, Jakarta, Indonesia; 2National Cardiac Center Harapan Kita, Jakarta, Indonesia
Objective: To report a case of reverse left ventricular (LV) remodeling after cardiac resynchronization therapy (CRT) in a patient with ischemic heart disease.
Materials and Methods: A 60‐year‐old male presented with acute decompensated heart failure and two‐vessel coronary artery disease post percutaneous coronary angioplasty. Electrocardiogram (ECG) showed a complete left bundle branch block with a QRS duration of 160 milliseconds. (Figure 1). Pre‐procedural echocardiogram showed an ejection fraction (EF) of 28%, end‐diastolic diameter (EDD) of 66 millimeters and end‐systolic diameter (ESD) of 57 millimeters. As a result of recurrent episodes of acute heart failure despite optimal guideline‐directed medical therapy, we decided to do CRT‐P implantation.
The multipolar LV lead was advanced to the posterolateral vein, with the other leads placed at the right ventricular (RV) apex and right atrial appendage with an acceptable threshold. The CRT‐P was programmed as DDD multipoint pacing, with LV2 to LV4 at 5 milliseconds and LV to RV at 60 milliseconds.
Result: Nine months after the procedure, the patient came for a routine follow‐up without complaints of any symptoms. ECG showed narrow QRS complexes with an rS pattern in V1 suggesting normal septal activation (Figure 2). After the mode was changed to ODO, the QRS complexes were persistently narrow with a QRS duration of 80 milliseconds, indicating LV reverse remodeling. The echocardiographic assessment showed an improvement in EF to 43%, EDD of 45 millimeters, and ESD of 36 millimeters.
Conclusion: The use of CRT can induce electrical and mechanical reverse remodeling permanently even if pacing ceases.
Supporting Documents

FIGURE 1 Baseline ECG.

FIGURE 2 Follow‐up ECG.
OP‐150‐2‐CIED (TRACK 8 ‐ CIED 5)
New generation of Transfemoral aortic valve—New risk of late AV‐block?
Gerhard Goebel
Kerckhoff‐Klinik, Bad Nauheim, Germany
Introduction: Over the years new trans‐femoral aortic valves were established in the market, and some of them self‐expanding. In the last month we are regarding more and more patients with the late occurrence of AV‐block 2nd or 3rd degree. Because of shorter stay in hospital, we see a greater risk for those patients and we want to know if there are a need for new strategies. In a retrospective study, we tried to find special risk factors for late AV‐Block.
Methods: 60 consecutive patients receiving transferal aortic valve replacement between January and July 2022 with post‐operative AV‐block were compared with 60 consecutive patients also receiving transfemoral aortic valve replacement and post‐operative av‐block between January and July 2019. Patient characteristics, procedural time, type and size of the valve, and many other markers were recorded.
Results: The demographical and clinical patient characteristics were nearly identical in both groups. No procedure‐associated complications have been noted. Only slight differences in procedural time and in X‐ray exposure time were observed. Also, we cannot show a difference concerning balloon dilatation before implantation. A great difference was regarded in time of appearance from av‐block. (2.7 days vs. 1.5 days). Patients with pre‐existing RSB showing a higher risk, but this was identical in both groups.
Conclusion: With this study, we can show, that new aortic valves had a mild higher risk for a late appearance from av‐block second‐order third degree. We cannot show other reliable indicators. Therefore, more studies had to be done if a longer rhythm monitoring is necessary and in which cases.
OP‐151‐2‐CIED (TRACK 8 ‐ CIED 5)
Left bundle branch area pacing (LBBAP) simplified using a deflectable sheath, stylet‐driven screw‐in Lead
Dhiraj Kumar; Zohaib Shaikh; Ashish Nabar; Kunal Anand; Malav Jhala; Chirag Parikh; Athar Ali; Nitin Burkule; Ajaykumar Mahajan
Seth GS Medical College And Kem Hospital, Mumbai, India
Objectives: Left bundle area pacing (LBBAP) can be tedious. Clinical outcomes with non‐selective vs selective LBBAP may be comparable. We analyzed the procedural success of LBBAP using a novel deflectable sheath (AgilisTM, Abbott), a 58 cm stylet‐driven screw‐in lead, and 12‐lead ECG.
Materials and Methods: All 20 LBBAP procedures performed by a single operator at 7 different centers were included. Pacing indications were bradycardia (11) or heart failure (9). Briefly, the LBBAP procedure involved: abutting the sheath to the RV septum → choosing the RV site based on a 12‐lead QRS pattern obtained following unipolar pacing by the extended screw → stepwise drilling the lead guided by fluoroscopy, 12‐lead ECG, pacing parameters and sheath angiogram.
Results: All patients (63 ± 13.76 yrs, M/F: 13 /7), except 1, underwent the procedure under conscious sedation. LBBAP was successful in 19/20 (95%) procedures. Need to target >1 site (13) was common, requiring >1 sheath (3) or >1 lead (2) was uncommon. LBBAP parameters achieved were QRS width (103.63 ± 10.67) and LVAT (74.68 ± 6.55) msec. Unipolar pacing parameters at implant were R wave (7.21 ± 4.35 mV), threshold (0.71 ± 0.25 V), and impedance (762 ± 15.11 Ω).
Conclusions: LBBAP is simplified using deflectable sheath, stylet‐driven screw‐in lead, and 12‐lead ECG and has a high implantation success.
OP‐152‐2‐CIED (TRACK 8 ‐ CIED 5)
Pacing mode survival in patients with single chamber atrial pacemaker for sinus node dysfunction
Dinakar Bootla; V. Ramanathan; Suresh Kumar Sukumar; Ashish Jain; Raja J. Selvaraj
Jipmer, Puducherry, India
Objectives: To study the rate of pacemaker mode change, AV block, pacemaker reoperation, and death in patients with a single chamber atrial (AAI) pacemaker implanted for Sinus node dysfunction (SND).
Materials and methods: This is a prospective‐retrospective study. All patients above the age of 18 yrs who underwent implantation of an AAI pacemaker for sinus node dysfunction between January 2014 and December 2020 were included. Patients were followed up annually, during which they were assessed for pacemaker mode change, new onset AV block, bundle branch block, atrial fibrillation (AF), lead complications, reoperation, and death.
Results: A total of 101 patients underwent AAI pacemaker implantation for SND during the study period. The mean age was 55.3 ± 12.1 years. Three patients had paroxysmal AF and three had LV dysfunction at the time of implant. During a mean follow‐up of 49.5 ± 22.6 months, none of the patients required a pacemaker mode change. Seven patients underwent reoperation, five for lead dislodgement, one for high threshold, and one for pocket site erosion. None developed AV block or AF with slow ventricular rate. Only four patients developed AF (3 paroxysmal, 1 permanent). There were three deaths during follow‐up and all were because of non‐cardiac causes.
Conclusion: Single chamber atrial pacing is an acceptable mode of pacing in patients with SND in developing countries. The development of AV conduction abnormalities is rare in this relatively younger population.
OP‐153‐2‐CIED (TRACK 8 ‐ CIED 5)
Does cardiac resynchronization using WiSE‐CRT leadless pacing result in greater QRS shortening than conventional resynchronization?
Simon James
James Cook University Hospital, Middlesbrough, United Kingdom
Objectives: To assess if LV leadless pacing at a site of the latest activation results in greater acute QRS shortening than conventional CRT.
Materials and Methods: WiSE‐CRT is a leadless endocardial pacing system. It uses ultrasound technology to transfer energy to a receiver implanted on the Left Ventricle (LV) endocardial wall. This can be implanted at any site within the LV.
WiSE‐CRT implants were compared with an equal number of consecutive conventional CRT cases. Leadless LV electrodes were implanted at the site of the latest activation defined by strain echocardiography.
Conventional CRT was via the standard coronary sinus route. Intrinsic QRS width was measured pre/ post‐implant. For pacing‐dependent cases the QRS width during RV pacing was measured.
Results: Twenty‐four patients underwent WiSE‐CRT implant. (6 pacing dependent, 18 intrinsic conduction) were compared with 24 consecutive conventional CRT (6 pacing dependent). Cases were well matched for baseline QRS duration. Underlying pathologies for WiSE‐CRT & conventional CRT were ischaemic 11 v 14, dilated cardiomyopathy 4 v 6, pacing‐induced LV impairment 4 v 4 respectively.
WiSE‐CRT resulted in greater QRS reduction for all cases (51 msec v 32, p = 0.002), intrinsic conduction (51 v 29, p = 0.003), and pacing‐dependent (60 v 40, p = 0.15).
Conclusion: WiSE‐CRT implant demonstrates a greater acute QRS shortening than conventional CRT. This should confer improved mortality. Further investigation is needed to ascertain whether this is because of targeting a specific site of the latest activation or a specific property of endocardial pacing itself.
Supporting Documents

OP‐154‐V‐CIED
A novel standardized left bundle branch pacing with left bundle branch block model
Sijing Cheng 1; Yiran Hu2; Pengkang He3; Hao Huang1; Min Gu1; Hongxia Niu1; Han Jin3; Wei Hua1
1 Fuwai Hospital, Chinese Academy of Medical Sciences and Peking Union Medical College, Beijing, China; 2Department of Cardiology and Macrovascular Disease, Beijing Tiantan Hospital, Capital Medical University, Beijing, China; 3Cardiology department, Peking University first hospital, Beijing, China
Objective: Left bundle branch pacing (LBBP) has been demonstrated in the treatment of dyssynchronous HF. The purpose of this study was to develop a novel standardized LBBP with a left bundle branch block (LBBB) model.
Methods: A “triangle‐zone” method by tricuspid valve annulus angiography for LBBP were performed in 6 canines. A catheter was then applied for retrograde His potential recording and LBB ablation. The electrocardiogram and pacing parameters were recorded. The hearts were isolated and stained by Lugol's iodine (5%) to assess the relative locations of the LBBP lead‐tip, in relation to the left septal fascicular (LSF).
Results: The mean LBB potential to the ventricular interval was 11.8 ± 1.2 ms. The mean interval between the pacing stimulus to retrograde His potential was 16.0 ± 1.7 ms. The Stimulus‐peak left ventricular activation time of LBBP was 35.7 ± 3.1 ms. The average intrinsic QRS duration was 44.7 ± 4.7 ms. LBB ablation significantly prolonged the QRS duration (106.3 ± 8.3 ms, p < 0.001). However, LBBP significantly shortened the paced QRS duration to 62.5 ± 5.3 ms (p < 0.001). After 6 weeks of follow‐up, both paced QRS duration (63.0 ± 5.4; p = 0.203) and LBBB duration (107.3 ± 7.4; p = 0.144) were unchanged when compared to the acute phase, separately. Anatomical analysis showed that the lead‐tip were all placed in the LSF area. The average lead depth in the septum was 12.2 ± 1.3 mm.
Conclusion: The new LBBP with the LBBB model was stable and feasible. It provided a useful tool to investigate the basic mechanism underlying physiological pacing.
Supporting Documents

OP‐155‐V‐CIED
Ambulatory Av synchronous pacing over time using a leadless ventricular pacemaker: Regional experience
Joseph Yat sun Chan 2; Mikhael F. El‐Chami3; Todd Sheldon1; Kurt Stromberg1; Joseph Ys Chan1; Larry A. Chinitz4
1 Medtronic, Inc., Mounds View, United States; 2Prince of Wales Hospital, Chinese University of Hong Kong, Shatin, Hong Kong; 3Emory University Medical Center, Atlanta, USA; 4NYU Langone Medical Center, New York, USA
Objectives: Prior proof‐of‐concept studies demonstrated that accelerometer‐based mechanically delivered AV synchronous (AVS) pacing is feasible using a leadless ventricular pacemaker; however, ambulatory performance and maintenance of AVS over time have not been studied.
Methods: AccelAV was a prospective single‐arm study to characterize AVS in patients implanted with a Micra AV, which uses the device accelerometer to mechanically detect atrial contractions and promote VDD pacing. The primary objective was to characterize resting AVS at 1 month in patients with complete AV block (AVB) and normal sinus function.
Results: A total of 152 patients were enrolled and implanted with a leadless pacemaker, including 19 patients from Hong Kong. Among patients with normal sinus function and complete AVB (n = 54), the mean resting AVS was 85.4% at 1 month, while ambulatory AVS was 74.5%. Mean resting and ambulatory AVS were similar among Hong Kong patients (n = 7; 85.6% resting, 72.7% ambulatory, p > 0.8). Among patients (n = 20) with programming optimization, the mean ambulatory AVS was 82.6%, representing a 10.5% improvement (p < 0.001). Quality of life as measured by the EQ‐5D‐3L improved significantly from pre‐implant to 3 months (p = 0.031). There were no upgrades to dual‐chamber devices or CRT through 3 months.
Conclusion: Accelerometer‐based mechanical atrial sensing significantly improves the quality in patients with AVB and normal sinus function and a leadless pacemaker implanted in the right ventricle. Mean resting and ambulatory AVS among Hong Kong patients were similar to the overall cohort with an increase in ambulatory AVS among patients with programming optimization. There were no upgrades to dual‐chamber pacemakers.
OP‐157‐V‐CIED
Performance of model 3830 left bundle branch area pacing: Results from CareLink and registration data
Jordana Kron 1; Matthew Bernabei2; Daniel Kaiser3; Sudip Nanda4; Kenneth Ellenbogen1; Patrick Zimmerman5; Alex Dedrick5; Rachael Rose5; Faiz Subzposh6
1 Virginia Commonwealth University, Richmond, United States; 2Lancaster Heart and Vascular Institute, Lancaster, USA; 3St. Thomas Heart, Nashville, USA; 4St. Luke's University Health Network, Bethlehem, USA; 5Medtronic, Inc., Mounds VIew, USA; 6Geisinger Heart Institute, Wilkes‐Barre, USA
Objectives: Left Bundle Branch Area Pacing (LBBAP) with a Model 3830 lead is an alternative to right ventricular pacing (RVP) and his‐bundle pacing (HBP). Literature suggests LBBAP may avoid the detrimental effects of RVP. Using CareLink and registration data, lead inactivation rate, electrical performance, and pacing output were determined.
Materials and Methods: Medtronic Model 3830 leads were included in the analysis if they were associated with a pacemaker implanted in 2020 or later and were assigned to a LBBAP, HBP, or apical/septal placement group. The pacing capture threshold (PCT) was determined based on ventricular capture management. Time‐to‐inactivation analysis used Kaplan–Meier survival estimates and comparisons were made using log‐rank tests.
Results: Within the database and registry, 14,933 LBBAP leads were identified. The average age at implant was 75.1 ± 11.1, 56.1% were male, and 51.7% had an indication for AV block. At 6 months, the mean pacing output was 2.1 ± 0.5 V at 0.4 ± 0.1 ms, the mean PCT was 0.88 ± 0.32 V, and the mean sensed amplitude was 14.9 ± 8.1 mV. At 24 months, LBBAP leads were more likely to remain active (95.3%) than apical/septal leads (94.7%, p = 0.026) or HBP leads (93.0%, p < 0.001).
Conclusion: In this large cohort of Model 3830 leads, LBBAP leads had a low PCT and reasonable sensed amplitude at implant, and electrical performance remained stable over follow‐up. LBBAP leads were also less likely to become inactive during the first 24 months of the implant than apical/septal leads or HBP leads. These data suggest LBBAP with Model 3830 is a viable alternative to right ventricular pacing.
OP‐158‐V‐CIED
Real‐World evidence on surgical intervention rates for pacemaker Lead dysfunction: Tendril STS vs other leads
Bruce L. Wilkoff 1; Jeeyun A. Kim2; Yelena Nabutovsky2; Grant Kim2; Matthew Desmond2; Leonard Ganz2; Anne B. Curtis3
1 Cleveland Clinic, Cleveland, United States; 2Abbott, Sylmar, United States; 3University at Buffalo, Buffalo, United States
Objectives: While several studies have reported on the safety of cardiac leads, there are limited comparative data on lead performance. Our aim was to compare Abbott Tendril STS leads and other manufacturers' pacing leads using real‐world evidence methodology.
Methods: Medicare Fee‐For‐Service (FFS) claims and Abbott device registration databases were linked to identify patients implanted with single‐chamber or dual‐chamber pacemakers with the Abbott Tendril STS lead from 1/1/2014–12/31/2019. Medicare pacemaker patients who did not link to Abbott devices were assumed to have non‐Abbott leads. Patients in both groups had to be enrolled in Medicare FFS at least 1 year prior to the implant date and have an initial pacemaker and associated lead(s) implanted on the same date. Patients were followed through the end of 2021. Surgical intervention for lead dysfunction was defined as a diagnosis code for a mechanical lead complication and a procedure code for a lead‐related surgery on the same claim. Kaplan–Meier curves for lead intervention‐free survival rates were compared between groups at the device level using a log‐rank test.
Results: The study cohort had 89,629 Tendril STS and 433,481 non‐Abbott patients. Groups were comparable in age (79.7 ± 8.6 years), sex (52.2% male), race/ethnicity, and baseline comorbidities. At 7 years, there was no significant difference in intervention‐free survival rates between groups (97.40% Tendril STS vs 97.57% non‐Abbott, p = 0.3435).
Supporting Documents
Conclusion: In this large Medicare population, there was no significant difference in surgical intervention‐free survival rates for pacemaker lead dysfunction between Tendril STS and non‐Abbott pacing leads over 7 years of follow‐up.

FIGURE
OP‐159‐1‐GE (TRACK 6 ‐ GE 1)
Precordial QRS voltage predicts response to immunosuppression in patients with cardiac sarcoidosis
Swapna Nalla; Muthiah Subramanian; Radhika Korabathina; Sachin Yalagudri; Daljeet Saggu; C. Narasimhan
Aig Hospital, Hyderabad, India
Objective: There is a paucity of clinical markers to assess the response to immunosuppression (IST) in patients with cardiac sarcoidosis. The aim of this study was to assess the utility of surface 12 lead ECG in the assessment of response to cardiac sarcoidosis.
Materials and Methods: Clinical and electrocardiographic data of 41 patients with cardiac sarcoidosis from the Granulomatous Myocarditis Registry were analyzed. All patients underwent a 18Fluorodeoxy glucose positron emission tomography (18FDG PET‐CT) prior to initiation of IST. The response was assessed after 4–6 months of therapy. Clinical response (CR) was defined as an improvement in functional class (NYHA Class>1), freedom from ventricular arrhythmias, and heart failure hospitalizations. Complete responders had no residual myocardial FDG uptake and fulfilled the CR criteria.
Results: Among the 41 patients included in the final analysis, 29 (70.7%) had a complete response to IST. Cox regression analysis identified that the summed QRS voltage in the precordial leads was higher in responders (5.1 + 0.8 mV vs. 3.4 + 0.7 mV, p = 0.031) compared to non‐responders. Compared to the baseline, there was a significant improvement in QRS voltage among responders (+1.2 + 0.2 mV vs. +0.2 + 0.1 mV, p = 0.016) compared to non‐responders. There was no correlation between clinical response and summed QRS voltage in the limb leads. Summed precordial lead voltage was an independent predictor of response following immunosuppression (HR 1.13, 95% CI 1.03–1.22, p = 0.042). Precordial lead voltage had a strong positive correlation with a change in LVEF following immunosuppression. It had a good discriminative power (AUC = 0.73) for predicting response to immunosuppression.
Conclusions: Summed precordial lead voltage can be used to assess clinical response to immunosuppression in patients with cardiac sarcoidosis.
OP‐160‐1‐GE (TRACK 6 ‐ GE 1)
Diagnostic performance of criteria in predicting PVC RVOT origin
Friska Angrraini Helena Silitonga 1; Simon Salim1; Muhammad Yamin1; Angga Pramudita1; Rubiana Sukardi2; Catur Wulanningsari2; Rohmad Widiyanto2
1 Division Of Cardiology, Department of Internal Medicine, Cipto Mangunkusumo, Indonesia; 2Integrated Cardiac Centre – Cipto Mangunkusumo Hospital, Indonesia
Abstract submitted under supporting document.
Objectives: To compare nine diagnostic criteria for predicting the RVOT origin of PVC.
Materials and Methods: Fifty patients with PVC morphology of LBBB pattern (predominantly negative in lead V1) and inferior axis (predominantly positive in lead II and III) underwent ablation between March 2018 and November 2021. We calculate and compare the criteria mentioned by Anderson et al., (1) with 6 diagnostic accuracy measures. RVOT criteria used were: (1) Earliest onset of QRS or peak in V2, (2) V1 R‐wave duration index <0.5 ms and R/S‐wave amplitude index <0.3 mV, 3) S‐R amplitude difference in V1 through V2 > 1625 mV, while LVOT criteria used were: 4) V3 R‐wave deflection interval > 80 ms and V1 R‐wave amplitude >0.3 mV, 5) V2 transition ratio >0.6 mV, 6) TZ Index <0, 7) V2S/V3R Index <1.5 mV, 8) V2QRSi40 > 0.52 mV, 9) Combination Index: Y = −1.15x(TZ) – 0.494x(V2S/V3R), Y > − 0.76. A negative result on LVOT criteria was concluded as RVOT.
Results: We found that the highest sensitivity and NPV were criterion 9 (90% and 55.6%, respectively). The highest specificity and PPV were criterion 5 (87.5% and 96.6%, respectively). Criterion 7 has the highest accuracy (82.98%), while criterion 5 has the highest AUC (0.779).
Conclusion: Criteria originally used to predict LVOT origin can also give good performance in predicting RVOT origin when applied to those with LBBB pattern and inferior axis. In our dataset, the best criterion to rule in RVOT origin was criterion 5 (when negative).
Reference
1. Anderson, R. D., Kumar, S., Parameswaran, R., Wong, G., Voskoboinik, A., Sugumar, H., Watts, T., Sparks, P. B., Morton, J. B., McLellan, A., Kistler, P. M., Kalman, J., & Lee, G. (2019). Differentiating Right‐and Left‐Sided Outflow Tract Ventricular Arrhythmias: Classical ECG Signatures and Prediction Algorithms. Circulation: Arrhythmia and Electrophysiology, 12(6), 1–15. https://doi.org/10.1161/CIRCEP.119.007392
Supporting Documents
TABLE 1 Diagnostic Measures of nine criteria
| n | AUC | Sensitivity (%) | Specificity (%) | PPV | NPV | Accuracy (%) | |
|---|---|---|---|---|---|---|---|
| Criterion 1 | 49 | 0.566 | 75.6% | 37.5% | 86.1% | 23.1% | 69.39% |
| Criterion 2 | 47 | 0.647 | 79.5% | 50% | 88.6% | 33.3% | 74.47% |
| Criterion 3 | 48 | 0.625 | 62.5% | 62.5% | 89.3% | 25% | 62.5% |
| Criterion 4 | 47 | 0.500 | ‐ | ‐ | ‐ | ‐ | ‐ |
| Criterion 5 | 49 | 0.779 | 68.3% | 87.5% | 96.6% | 35% | 73.47% |
| Criterion 6 | 50 | 0.679 | 85.7% | 50% | 90% | 40% | 80% |
| Criterion 7 | 47 | 0.611 | 84.6% | 37.5% | 86.8% | 33.3% | 82.98% |
| Criterion 8 | 50 | 0.503 | 88.1% | 12.5% | 84.1% | 16.7% | 76% |
| Criterion 9 | 48 | 0.763 | 90% | 62.5% | 92.3% | 55.6% | 81.25% |

FIGURE 1 ROC Curve of Nine Criteria.
OP‐161‐1‐GE (TRACK 6 ‐ GE 1)
Habitual coffee intake is safe and improves survival in prevalent arrhythmia and/or cardiovascular disease
David Chieng 1,2,3; Peter Kistler1,2,3,4; Rodrigo Canovas1; David Kaye1,2,4; Hariharan Sugumar1,2,3; Louise Segan1,2,3; AleksanVoskoboinik1,2,3; Joseph Morton3,5; Geoffrey Lee3,5; Sandeep Prabhu1,2,3; Liang‐Han Ling1,2,3; Jonathan Kalman3,4,5
1 Baker Heart and Diabetes Institute, Melbourne, Australia; 2Alfred Hospital, Melbourne, Australia; 3University of Melbourne, Melbourne, Australia; 4Monash University, Melbourne, Australia; Royal Melbourne Hospital, Melbourne, Australia
Objectives: Physicians often recommend avoiding coffee in patients with pre‐existing arrhythmia and cardiovascular disease (CVD). The objective of this study was to investigate the associations between coffee and mortality/arrhythmia outcomes in people with underlying cardiac conditions.
Materials and Methods: The UK Biobank consists of 502,543 people followed over >10 years with outcomes linked to ICD‐10 codes. Self‐reported coffee intake was divided into 0, <1, 1, 2–3, 4–5, >5 cups/day. CVD was defined as a composite of coronary heart disease, stroke, and cardiac failure. Cox regression was used to assess associations with mortality/arrhythmia outcomes.
Results: 7706 participants had a diagnosis of arrhythmia at enrolment, of which 1571 (20.4%) died during follow‐up of 12.2 ± 1.7 yrs. Coffee intake in those with arrhythmias was associated with reduced mortality (lowest risk 1 cup/day HR 0.80, CI 0.69–0.93, p < 0.01). There was no increase in sudden cardiac death risk (p = 0.59). 1 cup/day was associated with improved survival in AF/AFL (HR 0.83, CI 0.70–0.97, p = 0.02). Mortality in those with SVT and VT/VF was unaffected by all levels of coffee intake. In participants diagnosed with CVD (17587), coffee consumption at all levels was not associated with an increased risk of arrhythmia, including AF/flutter. Mortality risk was significantly reduced in participants with CVD who consumed 2–3 cups of coffee/day (HR0.88, CI 0.80–0.96, p < 0.01).
Conclusions: Regular coffee intake is associated with improved survival in those with underlying arrhythmias. In prevalent CVD, coffee intake is safe with no increase in arrhythmias. Coffee should not be discouraged in patients with underlying arrhythmias and/or CVD.
Supporting Documents

OP‐162‐1‐GE (TRACK 6 ‐ GE 1)
Impact of decaffeinated, ground, and instant coffee subtypes on the incidence of arrhythmias
David Chieng 1,2,3; Rodrigo Canovas1; Hariharan Sugumar1,2,3; Louise Segan1,2,3; Liang‐Han Ling1,2,3; AleksanVoskoboinik1,2,3; Joseph Morton3,4; Geoffrey Lee3,4; Sandeep Prabhu1,2,3; David Kaye1,2,5; Jonathan Kalman3,4,5; Peter Kistler1,2,3,5
1 Baker Heart and Diabetes Institute, Melbourne, Australia; 2Alfred Hospital, Melbourne, australia; 3University of Melbourne, Melbourne, australia; 4Royal Melbourne Hospital, Melbourne, Australia; 5Monash University, Melbourne, Australia
Objectives: Observational studies report health benefits from coffee. Coffee is a complex beverage with up to 100 biological compounds. Caffeine binds to adenosine receptors and is potentially anti‐arrhythmic, although the impact of caffeine on arrhythmia outcomes is unclear. The objective of this study is to evaluate the associations between coffee subtypes and incident arrhythmias.
Materials and Methods: The UK Biobank is a large prospective cohort with follow‐up >10 years. Coffee amount and type (ground, instant, or decaffeinated) were self‐reported and divided into 0, <1, 1, 2–3, 4–5, >5 cups/day. Associations between coffee subtypes and arrhythmia endpoints were assessed using Cox regression modeling and hazard ratios (HR).
Results: Of 449,536 participants, there were 82,575 ground, 198,062 instant, and 68,416 decaf coffee drinkers. Ground coffee intake between 1 and 5 cups/day was associated with a reduced risk of any arrhythmia and atrial fibrillation/flutter (AF/AFL), with the lowest risk seen at 4–5 cups/day (HR0.83, CI0.76–0.91, & HR0.77, CI0.68–0.87, respectively; p < 0.01). The risk of SVT and VT/VF were reduced at between 2–5 cups/day (p < 0.05). Instant coffee between 1–5 cups/day reduced the risk of any arrhythmia, and AF/AFL. The lowest risk was seen in 2–3 cups/day for any arrhythmia (HR0.88, CI0.85–0.94, p < 0.01), and 4–5 cups/day for AF/AFL (HR0.85, CI0.79–0.91, p < 0.01). SVT risk was lowest at 4–5 cups/day (HR0.75, CI0.63–0.88, p < 0.01). Decaf coffee had a neutral effect against incident arrhythmia.
Conclusion: Regular ground or instant but not decaffeinated coffee was associated with a reduction in arrhythmia incidence. These findings support in part a proposed antiarrhythmic effect of caffeine.
Supporting Documents

OP‐163‐1‐GE (TRACK 6 ‐ GE 1)
Habitual coffee consumption is associated with reduced incidence of arrhythmias: A large population study
David Chieng 1,2,3; Rodrigo Canovas1; Hariharan Sugumar1,2,3; Louise Segan1,2,3; AleksanVoskoboinik1,2,3; Joseph Morton3,4; Geoffrey Lee3,4; Sandeep Prabhu1,2,3; David Kaye1,2,5; Liang‐Han Ling1,2,3; Jonathan Kalman3,4,5; Peter Kistler1,2,3,5
1 Baker Heart and Diabetes Institute, Melbourne, Australia; 2Alfred Hospital, Melbourne, Australia; 3University of Melbourne, Melbourne, Australia; 4Royal Melbourne Hospital, Melbourne, Australia; 5Monash University, Melbourne, Australia
Objectives: There is a perception that arrhythmias are increased in coffee drinkers. Meta‐analyses suggest the beneficial effects of coffee on incident arrhythmias, although evidence is based on studies with small sample sizes. The objective of this study was to evaluate associations between coffee intake and incident arrhythmias utilising the UK Biobank.
Materials and Methods: The UK Biobank is a large prospective cohort with outcomes measured >10 years. Coffee intake, obtained from questionnaires, was divided into 0, <1, 1, 2–3, 4–5, >5 cups/day. Cox regression modelling with hazard ratios (HR) determined associations with incident arrhythmia, atrial fibrillation/flutter (AF/flutter), SVT, and ventricular tachycardia/ fibrillation (VT/ VF).
Results: The cohort included 449,563 individuals (age 57 ± 13 yrs, 55.3% female, hypertension 28%). U‐shaped relationships exist between higher coffee intake and incidents any arrhythmia, AF/flutter, and SVT. After adjustment for co‐variables age, gender, alcohol intake, tea intake, obesity, diabetes mellitus, hypertension, physical activity, OSA, smoking status, the lowest risk for any arrhythmia was seen in those who consumed 2–3 coffee cups/day, with HR 0.91 (CI 0.88–0.94, p < 0.01). The risk of AF/flutter and SVT was lowest at 4–5 cups/day, with HR 0.88 (CI 0.83–0.94, p < 0.01), and HR 0.84 (CI 0.74–0.96, p < 0.01), respectively. The lowest VT/ VF risk was seen with 4–5 cups/day (HR 0.83, CI 0.70–0.97, p = 0.02).
Conclusions: Mild–moderate regular coffee intake was associated with significant reductions in the incidence of any arrhythmia, AF/flutter, SVT, and VT/VF. Daily coffee intake should not be discouraged but rather considered part of a healthy diet.
Supporting Documents

OP‐164‐1‐GE (TRACK 6 ‐ GE 1)
Atrial fibrillation alarm system to improve the correct anticoagulation prescription rate
Wei‐Ta Chen1,2
1 Wanfang hospital, Taipei Medical University, Taipei City, Taiwan; 2School of Medicine, College of Medicine, Taipei Medical University, Taipei City, Taiwan
Objectives: Anticoagulation therapy reduces the stroke risk from atrial fibrillation (AF). However, the mis‐prescription rate of anticoagulation is high. An intervention to improve it should be undertaken.
Materials and Methods: An alarm system that could screen all the electrocardiography of each admitted patient was developed. Once AF was detected, it would suggest appropriate anticoagulation agents with the correct doses. An experienced cardiologist would confirm it and inform the particular in‐charge care team.
The system was engaged in clinical practice since November 01, 2021. All the enrolled patients would be followed at discharge, the 1st month, the 3rd month, and the 6th month after discharge. The correct prescription rates were analyzed. The data until June 30, 2022 was presented in this study.
Results: After the system engagement, the correct prescription rate was improved from 20.6% at baseline to 75.1% (p < 0.00001). In the first 2 months of the engagement, the correct prescription rate at admission was only 28.8%, leaving 71.2% of AF patients who needed our intervention to get correct prescriptions. However, the correct prescription rate at admission went up to 38.9% in the middle 2 months and 45.8% (p = 0.024) in the last 2 months. The correct prescription rate lasted even after discharge. (75.1% at baseline, 77.3% at 3rd month, 79.4% at 6th month, p > 0.05).
Conclusion: The AF alarm system could improve the correction prescription rate of anticoagulation therapy significantly. As a result of the spread of knowledge, the correction prescription rate was even improved before the intervention and lasted after discharge.
Supporting Documents


OP‐165‐2‐GE (TRACK 6 ‐ GE 3)
Late ventricular potential for risk prediction of sudden cardiac death risk
Joo Hee Jeong; Jong‐Il Choi; Yun Gi Kim; Yun Young Choi; Kyong‐jin Min; Hyoung Seok Lee; Jae‐min Shim; Young‐Hoon Kim
Korea University Anam Hospital, South Korea
Objectives: There is a paucity of data with signal‐averaged electrocardiography (SA‐ECG) on sudden cardiac death (SCD) survivors without structural heart disease, whereas the majority of previous studies had been focused on post‐myocardial infarction survivors. This study assessed SA‐ECG as a risk stratification modality for lethal arrhythmic event (LAE) in patients at risk of SCD without structural heart disease.
Materials and Methods: A total of 581 patients without significant structural heart disease were assessed with SA‐ECG. SA‐ECG was defined as positive when fulfilling three or more criteria: (1) unfiltered QRS duration≥114 ms, (2) filtered QRS duration≥114 ms, (3) duration of terminal QRS < 40uV exceeding 40 ms, and (4) root mean square voltage in the terminal 40 ms of ≤20 ms.
Results: Among 581 patients, 145 patients with positive late potential (LP) showed a higher incidence of LAEs compared to patients with negative LP (21.4% vs. 6.7%, p < 0.001, odds ratio 3.816 [95% confidence interval 2.208–6.597]). As the number of positive SA‐ECG criteria increases, the incidence of LAE tended to increase sequentially, which was markedly noted from 2 positive to 3 positive criteria (10.7% to 20.8%, p < 0.001). Patients with inherited arrhythmia showed a higher rate of positive LP compared to those with non‐inherited arrhythmia (51.0% vs. 19.3%, p < 0.001).
Conclusion: Positive LP resulted in strong association with LAE, which enables SA‐ECG as a non‐invasive risk stratification tool for SCD in patients without structural heart disease. At least 3 out of 4 diagnostic criteria in SA‐ECG can independently predict LAEs. Furthermore, our study suggests risk prediction for SCD using SA‐ECG in patients with inherited arrhythmias.
Supporting Documents

OP‐166‐2‐GE (TRACK 6 ‐ GE 3)
Brugada Phenocopy in a patient with severe hyperkalemia
Sonny Sendon 1; Namphril Malaluan1; Ma. Cecilia Lozada2; Isabelle Dominique Tomacruz3; Jojiemar De Pano4; Giselle Gervacio1
1 Division of Cardiovascular Medicine, University of the Philippines‐Philippine General Hospital, Manila, Philippines; 2Department of Medicine, University of the Philippines‐Philippine General Hospital, Manila, Philippines; 3Division of Nephrology, University of the Philippines‐Philippine General Hospital, Manila, Philippines; 4Division of Urology, University of the Philippines‐Philippine General Hospital, Manila, Philippines
Backgound: Brugada syndrome is an autosomal‐dominant channelopathy that presents with characteristic findings on electrocardiogram. Electrolyte abnormalities such as hyperkalemia can also present with Brugada ECG.
Case: A 51‐year‐old man with no known co‐morbidities presented with lower urinary tract symptoms and enlarging hypogastric mass. He had no history of syncope and denied a family history of sudden death. The workup revealed high‐grade urothelial carcinoma of the bladder and acute kidney injury from obstructive uropathy. Hemodialysis was initiated and was weaned off after a urinary diversion was done. On follow‐up, he was anemic and not complaining of chest pain or its equivalent. His ECG showed a coved ST segment with T wave inversion typical of Brugada Type I. He had elevated serum potassium (5.6 mmol/L) and creatinine (1173 umol/L). The patient received treatment for hyperkalemia and eventually underwent hemodialysis. There was a resolution of the Brugada pattern as the potassium level normalized.
Conclusion: Severe hyperkalemia can present with Brugada pattern ECG. Recognition of Brugada phenocopy is essential in clinical decision‐making to come up with appropriate management.
Supporting Documents

OP‐168‐2‐GE (TRACK 6 ‐ GE 3)
A case of SCN5A mutation‐associated left atrial standstill and ischemic stroke
Dong‐Seon Kang1; Pichmanil Khmao 2; Jaewon Oh1; Hui‐Nam Pak1
1 Yonsei University Health System, Seoul, Republic of Korea; 2Khmer Soviet Friendship Hospital, Phnom Penh, Cambodia
Objective: To screen genetic mutation of the proband with left atrial standstill and his first‐degree relative. The disease progression on atrial mechanical contraction and the electrical involvement in AV conduction system was also observed.
Materials and Methods: Informed consent was obtained from the patient and his first‐degree relative including the mother and sister. The patient's father died because of a traffic accident. The patient underwent AF ablation and EP study. Standard 12‐lead ECG, echocardiography, and peripheral blood sample for DNA extraction were obtained from the proband and his first‐degree relative. Genetic screening using target gene sequencing for exome region of cardiovascular‐related 369 genes using NextSeq 550Dx System (Illumina) with 2 × 150 bp reads was performed.
Results: Serial echocardiography from the patient showed a gradual and loss of A wave. EP study of the patient showed electrical silence of LA and infra‐nodal conduction delay. Two months after the diagnosis of LA standstill, Holter EKG monitoring from the proband showed paroxysmal AV block which required permanent pacemaker implantation. ECG and echocardiography from first‐degree relatives including mother and sister were within normal. An SCN5A heterozygous missense mutation (NM_198056.2: c.3823G > A, D1275N) was found in the proband, and his mother and sister.
Conclusion: SCN5A‐D1275N mutation is one of the pathogenic factors associated with LA standstill. This condition might require long‐term anticoagulation therapy and close follow‐up to evaluate the progression of the disease. The different manifestations of the disease can suggest modifier genes including polymorphism in gap junction proteins can implicate in this particular form.
Supporting Documents


OP‐169‐2‐GE (TRACK 6 ‐ GE 3)
Role of Tpeak‐Tend indices in risk stratification for patients with ECG pattern of Brugada syndrome
Long Vien‐Hoang; Linh Pham Tran; Hieu Pham Trung; Thuy Nguyen Thi Le; Tuan Nguyen Duy; Thanh Vu Huy
Vietnam National Heart Institute – Bach Mai Hospital, Hanoi, Viet Nam
Objectives: Brugada syndrome is an inherited arrhythmogenic syndrome, has the repolarization disorder is proposed as one of the underlying pathophysiological mechanisms. Tpeak‐Tend interval and Tpeak‐Tend/QT ratio are the parameters, which reflect the transmural dispersion of repolarization. In this study, we investigate the association between Tpeak‐Tend indices on the 12‐lead electrocardiogram (ECG) and the results of electrophysiological study (EPS).
Materials and Methods: A total of 41 patients with ECG pattern of Brugada syndrome (mean age 49 ± 11, 39 males) were included. The Tpeak‐Tend interval and Tpeak‐Tend/QT ratio were measured in each of the right precordial leads (V1‐V3). EPS was performed in all participants after the presence of structural heart disease was excluded.
Results: EPS was positive in 24 patients (59%), which induced ventricular tachycardia, and ventricular fibrillation. The Tpeak‐Tend interval was significantly longer in the positive EPS group than those had negative EPS, as in lead V1 (79.83 ± 6.78 vs 73.29 ± 4.21 ms; p = 0.001), in lead V2 (80.92 ± 8.91 vs 75.47 ± 3.41 ms; p = 0.022), in lead V3 (80.63 ± 5.27 vs 74.18 ± 4.8 ms; p < 0.0001). A similar result was also found with Tpeak‐Tend/QT ratio when comparing the positive EPS group versus the negative EPS group, 0.212 ± 0.012 vs 0.190 ± 0.012 in lead V1 (p < 0.0001), 0.213 ± 0.012 vs 0.191 ± 0.011 in lead V2 (p < 0.0001) and 0.219 ± 0.009 vs 0.197 ± 0.014 in lead V3 (p < 0.0001), respectively.
Conclusion: In patients with the Brugada ECG pattern, Tpeak‐Tend interval and Tpeak‐Tend/QT ratio were significantly higher in leads V1‐V3 in the positive EPS group. These Tpeak‐Tend indices may be useful to predict the result of risk stratification using EPS for patients with Brugada ECG patterns.
OP‐170‐2‐GE (TRACK 6 ‐ GE 3)
Role of SV2/RV3 ratio on the electrocardiogram in differentiating the origin site of outflow tract PVBs
Long Vien‐Hoang 1; Linh Pham Tran1; Anh Nguyen Thi Lan2; Thuy Nguyen Thi Le1; Tuan Nguyen Duy1; Thanh Vu Huy1
1 Vietnam National Heart Institute – Bach Mai Hospital, Hanoi, Viet Nam; 2Thanh Nhan Hospital, Hanoi, Viet Nam
Objectives: This study aimed to investigate the surface electrocardiographic characteristics of outflow tract PVBs of left bundle branch block (LBBB) pattern, and develop the criteria for distinguishing LVOT from RVOT origin in patients with outflow tract PVBs using the SV2/RV3 index.
Materials and Methods: We analyzed the characteristics of surface ECG in a cross‐sectional study of 150 patients with PVBs of LBBB pattern without structural heart diseases. The wave amplitude was measured using an electronic caliper. The SV2/RV3 index was calculated by dividing the S wave amplitude in lead V2 by the R wave amplitude in lead V3 of the same PVB.
Results: Among 150 patients with outflow tract PVBs, 110 were confirmed with RVOT origin and 40 with LVOT. The SV2/RV3 index was significantly smaller in the LVOT than in the RVOT (1.23 ± 0.78 vs 6.07 ± 6.32; p < 0.001). The area under the curve (AUC) for the SV2/RV3 index was 0.934, with a critical value ≤1.6, yielding a sensitivity of 90.9% and specificity of 80% for predicting PVBs originating from LVOT. Comparing this index with a number of other indices in both the study group and the subgroup of patients with the transition at V3, we found that our index yields the highest result in terms of value under the ROC curve, sensitivity, and specificity.
Conclusion: The SV2/RV3 index is a simple measure that reliably distinguishes LVOT from RVOT origin in patients with outflow tract PVBs, which is useful in clinical practice.
OP‐171‐2‐GE (TRACK 7 ‐ GE 4)
Implementation of computational ECG mapping system is associated with decreased procedure duration and fluoroscopy use
Avinash Toomu1; Gordon Ho1; Sutton Fox2; Kevin Sung1; Kurt Hoffmayer1; Jonathan Hsu1; Farshad Raissi1; Amir Schricker3; Michael Field4; Gregory Feld1; Frederick Han1; David Krummen 1
1 University of California San Diego, San Diego, United States; 2VA San Diego Healthcare System, San Diego, United States; 3Mills Peninsula Medical Center, Burlingame, United States; 4Medical University of South Carolina, Charleston, United States
Background: Computational ECG mapping provides arrhythmia source information during electrophysiology ablation procedures, but whether this information would have an impact on procedural metrics was uncertain. We performed a retrospective, case–control study to evaluate the hypothesis that non‐invasive ECG mapping may reduce overall procedural duration, fluoroscopy, and cost.
Materials and Methods: We retrospectively compared the first 30 clinical cases using a computational ECG mapping system with matched control cases performed prior to system availability at 2 tertiary medical centers. Cases were matched based on attending physician, institution, arrhythmia type, and case complexity. Procedural, fluoroscopy, and catheter data were obtained from anesthesia and nursing electronic records; total procedural time was defined from beginning intravascular access to beginning hemostasis.
Results: Of the first 30 cases, 2 (6.7%) were noninvasive programmed stimulation (NIPS) in preparation for stereotactic ablative radiotherapy which did not have comparable control cases and was excluded. Use of the system was associated with a reduction in procedure duration (68 minutes; 227 ± 54 vs 295 ± 77 minutes, p < 0.001), fluoroscopy time (16.3 minutes; 18.4 ± 13.9 vs 34.7 ± 16.6 minutes, p < 0.001), and EP lab costs ($2267). Fewer 64‐electrode basket catheters were used in AF ablation cases (p = 0.025).
Conclusion: Clinical use of noninvasive computational ECG mapping is associated with a significant reduction in procedural duration, fluoroscopy use, and cost. The system also permitted a novel case type to be performed (NIPS in preparation for stereotactic radiotherapy). Prospective studies are planned to further quantify these results.
Supporting Documents

OP‐172‐2‐GE (TRACK 7 ‐ GE 4)
Change in left ventricular ejection fraction 3 months post‐acute myocardial infarction
Waqar Habib Ahmed1; Dejia Huang2; Mullasari Ajit Sankardas3; Hyeon‐Chol Gwon4; Wen‐Jone Chen5; Houng‐Bang Liew6; Brian van Dorn7; Paul DeGroot7; Rianna Rapson7; Shu Zhang8
1 King Fahad Armed Forces Hospital, Jeddah, Saudi Arabia; 2West China Hospital, Sichuan University, Chengdu, Mainland China; 3Madras Medical Mission, Chennai, India; 4Samsung Medical Center, Sungkyunkwan University School of Medicine, Seoul, South Korea; 5National Taiwan University Hospital, Taipei, Taiwan; 6Clinical Research Centre, Queen Elizabeth Hospital II, Sabah, Malaysia; 7Medtronic Inc, Mounds View, Minnesota, USA; 8Fu Wai Hospital Chinese Academy of Medical Sciences and Peking Union Medical College, Beijing, Mainland China
Objective: Patients with lower left ventricular ejection fraction (LVEF) post‐myocardial infarction (MI) are at higher risk of sudden cardiac death (SCD).
Materials/Methods: The Improve SCA Bridge study included patients ≥18 years old, with acute MI ≤30 days and LVEF <50% ≤14 days post‐MI.
Patients were followed for 12 months in a total of 6 protocol‐defined regions: China, India Subcontinent (ISC), Korea, Middle East/Africa/Central Asia/Turkey (MEACAT), Southeast Asia (SEA), and Taiwan. At any follow‐up visit, patients could be referred for SCD risk stratification and management if they had a LVEF ≤40%. This prespecified sub‐analysis included patients with LVEF measurements at both baseline and 3 months post‐MI.
Results: Of the 1491 patients enrolled (age = 60.2 ± 12.0 years, 82.4% male) 1046 (70.2%) had both LVEF measurements. The mean LVEF change was 6.25% (SD = 8.95%). Patients with higher baseline LVEF (61.3% ≥40%) were likely to also have higher 3‐month LVEF (91.9% ≥40%). Decreased LVEF at 3 months post‐MI was comparable among patients with baseline LVEF above and below 40%: 20.7% and 19.7%, respectively. Of the patients with reduced LVEF at 3 months, 46% were referred for SCD risk stratification and management.
Conclusion: Despite average LVEF showing an increase, ~20% of patients showed a reduction. Furthermore, 29.8% of patients' LVEF was unmeasured contrary to ESC guidelines. These results highlight a need for continued education to increase adherence to guideline recommendations for post‐MI care.
OP‐173‐2‐GE (TRACK 7 ‐ GE 4)
Abnormal heart rate variability in patients with acute stroke
Intisar Ahmed; Pirbhat Shams; Lavita Kumari; Muhammad Anas Khan; Aamir Hameed Khan
Aga Khan University, Karachi, Pakistan
Objective: Reduced heart rate variability is a marker of autonomic dysfunction following stroke and carries prognostic value. We aimed to evaluate heart rate variability in our patients with acute stroke using Holter monitoring.
Methods: All patients admitted with acute ischemic stroke, undergoing Holter monitoring for stroke workup were enrolled in the study. The study duration was from 2013–2019. The cut‐offs for heart rate variability were extracted from studies of Holter monitoring in normal individuals.
Results: A total of 268 patients with acute ischemic stroke were enrolled. The mean age was 62 ± 14 years. 73% were males. The majority were diabetic (53%) and hypertensive (73). 15% had a prior history of stroke. The most involved stroke territories were left MCA (30%), right MCA (21%), and right ACA (5%). Most strokes were left‐sided (55%). The mean EF was 51%. The mean LVID was 40 mm, and the mean LAVI was 29. Overall, abnormal heart rate variability was found in 41% of patients. Abnormal ASDNN5 was found in 35% of patients. The majority had compromised SDNN (51%), and 12% had unhealthy SDNN. The majority had RMSSD <30 ms (55%).
Conclusion: Heart rate variability is altered in patients with acute stroke. This can be assessed to predict cardiac autonomic dysregulation in these patients. Future studies are needed for establishing the correlation between HRV and cardiovascular outcomes.
OP‐174‐2‐GE (TRACK 7 ‐ GE 4)
Patient comfort in using chest strap and dry electrode system for longer term arrhythmia monitoring
Daljeet Kaur Saggu 1; Udigala Madappa Nagamalesh2; Satyaprakash Dash3; Arunkumar Sathiyamoorthy4; V. Mohan Pinjala4; Vinayakrishnan Rajan3; Shantanu Sarkar5
1AIG Hospital, Hyderabad, India; 2 M S Ramaiah Medical College and Hospital, Bangalore, India; 3India Medtronic Pvt Ltd, Mumbai, India; 4Medtronic Engineering and Innovation Center, Hyderabad, India; 5Medtronic Inc, Minnesota, United States
Objective: To investigate the patient comfort level of wearing a chest strap‐based dry electrode system for continuous monitoring for a period of three months in an ambulatory setting.
Materials & Methods: The prospective observational Cardlinq external cardiac monitor (ECM) feasibility study enrolled patients with a history of cardiovascular disease or increased risk of cardiac arrhythmia. Patients wore the ECM prototype at home continuously except when bathing or having discomfort. The ECM investigational prototype was designed using a chest strap with dry electrodes connected to a coin cell battery‐powered implantable cardiac monitor electronics capable of patient‐initiated loop recording and automatic cardiac arrhythmia detection. Patients filled out a survey at 2‐, 4‐, 8‐, and 12‐week follow‐ups which answered 5 questions related to their comfort level. Patients also maintained a diary noting down the number of times and reason for a temporary removal of the device.
Results: The study enrolled 14 patients for ambulatory monitoring (21% females, average age 49.7 years, average BMI 26.1 kg/m2). A total of 43 patient comfort survey responses was completed and are summarized in figure. Only 5.1% of the responses indicated that patients disagreed that ECM was comfortable to wear (2.8% uncomfortable during sleep, 1.4% uncomfortable for the skin). The patient diary reported a total of 726 days with the temporary removal of the device. The total duration of temporary removal was ≤2‐hour in 93%. The major reason (93%) for removal was during bathing, and 1.5% of removals were because of skin irritation.
Conclusion: The ECM was mostly comfortab to wear over 3 months period.
Supporting Documents

OP‐175a‐2‐GE (TRACK 7 ‐ GE 4)
Predicting cardiac arrhythmia risk with lifestyle behaviors: A population‐based machine‐learning approach
Yutao Guo; G. Y. H. Lip
Sixth Medical Center, Chinese Pla General Hospital, Beijing, China
Introduction: Physical inactivity, obstructive sleep apnea (OSA), and other modifiable lifestyle‐related factors are associated with atrial fibrillation (AF), ectopics, and other arrhythmias. The increasing use of wearables can monitor changes in these risk factors. We aimed to develop a machine learning (ML)‐based model for real‐time prediction of cardiac arrhythmia risk using wearables via the tracking of unhealthy lifestyle risk factors.
Methods: In this prospective study, we applied Linear Regression (LR), Light Gradient Boosting Machine (LGBM), and Synthetic Minority Oversampling Technique (SMOTE) to develop ML approaches to predict the cardiac arrhythmia risks by tracking lifestyle behaviors change between August 1, 2020, to August 1, 2021, across China. The dataset of 2676 subjects (mean age ± SD, 46 ± 16 years, 75% male) was randomly divided (7:3) into a training cohort and a testing cohort, with a total of 13,230 signals available for the optimization of the model. We validated the model in an independent cohort of 1973 subjects. Furthermore, we assessed the consistency of subject‐reported outcomes and cardiac arrhythmias risk predicted by ML models involving 470 subjects.
Application: The 28 features of sleep quality, 16 features of physical activity, 12 features of OSA, and 18 features of prior monitored cardiac arrhythmia, were available for developing the model. For the testing cohort, the accuracy (%, standard deviation, SD) of ML approaches for cardiac arrhythmia risk were 86·9% ± 0·8 with LR, 89·8% ± 0·6 with LGBM, and 88·2% ± 0·8 with SMOTE + LGBM, while F1‐scores (SD) were 70·8 ± 1·4, 73·9 ± 1·3, and 73·1 ± 1·6, respectively. The goodness‐of‐fit of sleep quality, physical activity, OSA, and others (stress, etc.) of the ML models to the real‐world setting, in relation to risk strata of cardiac arrhythmia, ranged from 0·95–0·99. The area under the curve (AUCs, 95% confidence interval, CI) of LR and LGBM for high‐risk cardiac arrhythmia were 0.97 (0.85–0.98) and 0.96 (0.095–0.98), respectively (DeLong test, p = 0.334).
For the externally validated cohort, the accuracy and F1‐score of the ML approach for cardiac arrhythmia risk were 90·8% and 75·5% with LGBM, respectively, while 88.5% and 75.1% with LR, respectively.
A comprehensive score of the subject‐reported outcome questionnaire was 82.9, which was highly consistent with the cardiac arrhythmias predicted by ML models.
Future A wearable‐based ML approaches demonstrated good ability for predicting cardiac arrhythmia risk. ML models offer a solution to operationalize the proactive management of lifestyle behaviors and risk factors modification in the general population to reduce the burden of AF and other common arrhythmias.
Supporting Documents


OP‐176‐1‐GE (TRACK 7 ‐ GE 2)
The arrhythmic events and short‐term cardiovascular outcomes in patients hospitalized with COVID‐19 infection in Taiwan
Fui Jun Yee 1; Chye Gen Chin2; Tsing‐Yih Ou3; Ying‐Shih Su3; Wen‐Sen Lee3; Jong‐Shiuan Yeh2; Ming‐Hsiung Hsieh2
1 Department of Internal Medicine, Taipei Medical University, Taipei, Taiwan; 2Division of Cardiology, Department of Internal Medicine, Wan Fang Hospital, Taipei Medical University, Taipei, Taiwan; 3Division of Infectious Disease, Department of Internal Medicine, Wan Fang Hospital, Taipei Medical University, Taipei, Taiwan
Objective: The aim of this study is to investigate the arrhythmic events and short‐term cardiovascular (CV) outcomes in patients hospitalized with COVID‐19 infection in a single Taiwan tertiary center.
Methods: A retrospective study was carried out on 186 confirmed COVID‐19 infection patients admitted to our hospital between May, 2021 and September, 2021. We investigate their CV symptoms, vital signs, laboratory examinations, arrhythmic events, and major adverse cardiovascular events (MACE), including ischemic stroke or systemic embolism, myocardial infarction, CV death, and heart failure (HF) during hospitalization.
Results: During the hospitalization, 29.6% of patients had an elevation of cardiac enzymes, 67.2% had an elevation of d‐dimer level, and 7.5% had abnormal NT‐pro BNP level. The most common recorded arrhythmia is sinus tachycardia (22%), followed by atrial arrhythmia (12.4%, including atrial fibrillation 7.0%), sinus bradycardia (3.2%), ventricular arrhythmia (1.6%), and paroxysmal supraventricular tachycardia (1.1%). A total of 68 patients (36.6%) had arrhythmic events during hospitalization. During the mean follow‐up of 2.8 months, 17 patients (9.1%) developed MACE, including 6 ischemic strokes, one pulmonary embolism, one peripheral artery occlusive disease, 3 HF, and 7 CV death. The total mortality rate is 19.9%. The hospitalized patients with arrhythmic events were associated with a higher incidence of intubation (32% vs 15%, p = 0.0062), MACE (22% vs 2%, p < 0.001), and mortality (37% vs 10%, p < 0.001) than those without arrhythmic events.
Conclusion: The patients hospitalized with COVID‐19 infection were associated with higher CV manifestations and arrhythmic events in Taiwan. Those patients with arrhythmic events were associated with higher morbidity and mortality.
OP‐177‐1‐GE (TRACK 7 ‐ GE 2)
Radiofrequency ablation lesion size: Magnetic resonance imaging versus gross pathology
Omar Yasin 1,2; Tatsuhiko Hirao1; Naoto Otsuka1; Megan Schmidt3; Maryam Rettmann1; Alexa Miller1; Laura Hammel1; Narayan (Guru) Kowlgi1; Douglas Packer1
1 Mayo Clinic, United States; 2UCLA, Los Angeles, United States; 3Medtronic, Minneapolis, United States
Objective: Compare radiofrequency ablation (RFA) lesion size on magnetic resonance Imaging (MRI) compared to gross pathology.
Materials and Methods: In vivo prospective experiments were conducted in a canine animal model after approval by the Institutional Animal Care and Use Committee. RFA of left and right ventricles was followed by intravenous gadolinium and 8–10% triphenyl tetrazolium chloride administration. Post‐mortem delayed contrast enhancement MRI on a 3 Tesla scanner (Signa HDxt, GE Healthcare) was performed followed by pathology examination after fixation in 10% formalin solution. Lesion volume calculation assumed an oblate ellipsoid shape. Mean differences and limits of agreement (LoA) were calculated using Bland–Altman plots.
Results: Data from 4 animals were included (38 total ablations: 20 LV & 18 RV). Each animal had 5 LV and 6 RV ablations (1 animal did not have RV RFA). Average lesion depth, maximum width, and volume were 9 ± 2.7 mm, 3 ± 1.4 mm, and 326 ± 327.0〖mm〗^3 on MRI and 7 ± 2.5 mm, 8 ± 2.9 mm, 188 ± 237.7〖mm〗^3 on pathology. Wall thickness at the site of ablation was measured similarly on MRI and gross pathology (average difference: 0.3 ± 1.63 mm; LoA −2.9, 3.5 mm). Lesion depth and volume were larger on MRI (average difference: 1.2 ± 0.89 mm; LoA −0.58, 2.91 mm & 138 ± 116.80〖mm〗^3; LoA = −90.6, 367〖mm〗^3 respectively). Lesion max width was larger on pathology (average difference: 5.2 ± 2.39 mm; LoA 0.5, 9.8 mm). Lesion depth, measured as a percentage of overall wall thickness, was 5.8 ± 12% deeper on MRI compared to pathology (LoA = −17%, 29%).
Conclusion: RF ablation lesion volume measured larger on post‐mortem MRI compared to gross pathology. This could be a result of myocardial contraction as the heart is placed in formalin.
OP‐178‐1‐GE (TRACK 7 ‐ GE 2)
Association of interatrial block and left atrial fibrosis in patients without a history of atrial fibrillation
Natnicha Pongbangli; Arintaya Phrommintikul; Narawudt Prasertwitayakij; Teerapat Nantsupawat; Wanwarang Wongcharoen
Division of Cardiology, Thailand
Objectives: The presence of left atrial (LA) fibrosis reflects underlying atrial cardiomyopathy. Interatrial block (IAB) is associated with LA scar in patients with atrial fibrillation (AF). The association of IAB and LA scar in patients without a history of AF is unknown. We aimed to assess the association of IAB and LA scars in patients without a history of AF.
Materials and Methods: This is a retrospective analysis of 229 patients undergoing cardiac magnetic resonance imaging (CMR). LA scar was reported from the spatial extent of delayed enhancement of CMR. IAB was measured from 12‐lead electrocardiography using a digital caliper.
Results: Of 229 patients undergoing CMR, the prevalence of IAB was 50.2%. Patients with IAB were older (56.9 ± 13.9 vs 45.9 ± 19.2 years, p < 0.001) and had a higher prevalence of comorbidities. The left ventricular ejection fraction was lower in the IAB group. LA volume index (LAVI) was greater in the IAB group (54.6 ± 24.9 vs 43.0 ± 21.1 ml/m2, p < 0.001). Patients with IAB had a higher prevalence of LA scar than those without IAB (82.6% vs 35.1%, p < 0.001). After multivariable analysis, only IAB and LAVI were the independent factors that predict atrial scar.
Conclusion: The prevalence of IAB in the patients undergoing CMR was high. IAB was highly associated with the presence of LA scar and larger LA size in patients without a history of AF.
Supporting Documents

OP‐179‐1‐GE (TRACK 7 ‐ GE 2)
Changes in the heart rate variability after coronary artery bypass grafting surgery
Son Pham Truong1; Thanh Ngo Van2; Hinh Nguyen Van 1
1 108 Military Central Hospital, Hanoi, Vietnam; 2Hanoi Heart Hospital, Hanoi, Vietnam
Objectives: To determine the pattern of changes in heart rate variability (HRV) of patients undergoing coronary artery bypass grafting surgery (CABG).
Materials and Methods: A prospective study of 119 consecutive patients with chronic coronary syndrome underwent CABG at Hanoi Heart Hospital from June 2016 to August 2018. 24‐hour Holter was evaluated in all patients on: 2 days before CABG and 7 days, 3 months, and 6 months after the surgery.
Results: All the time‐domain (ASDNN, SDNN, rMSSD, pNN 50) and frequency‐domain (VLF, LF, HF) parameters of HRV decreased precipitately after CABG and were mostly recovered 3 months postoperatively. The percentage of decreased HRV before surgery was 28.6% and 51.8% after 7 days, 19.6% after 3 months, and 12.7% after 6 months. ASDNN and SDNN before and after surgery had the highest rates of change with the ratio of decreased indices before surgery (19.3%, 8.4%), after 7 days (45.9%, 21.1%), after 3 months (13.7%, 2%), and after 6 months (5.9%, 1%), respectively.
Conclusion: Our study shows that frequency and time domain indices changed over time following CABG. HRV reduced remarkably after 7 days, stabilized after 3 months, and increased 6 months after surgery. The ratio of decreased HRV was the highest 7 days after surgery, in which the ratio of decreased ASDNN and SDNN showed the most change, then lowered after 3 months and minimized after 6 months with significant reduction compared to pre‐operation.
Supporting Documents
Introduction: Coronary artery bypass grafting (CABG) with extracorporeal circulation is a key therapy for coronary artery disease (CAD). However, cardiovascular events and cardiac arrhythmias may still occur in these patients following surgery. Many studies have demonstrated a correlation between cardiac arrhythmias and heart rate variability (HRV). This study aimed to establish the temporal change pattern of HRV observed following CABG.
Methods: A prospective method was used to study 119 consecutive patients with stable CAD who were assessed using 24‐hour Holter recordings 2 days before CABG and 1 week, 3 months, and 6 months after the surgery at Hanoi Heart Hospital from June 2016 to August 2018.
Main results: All the time‐domain and frequency‐domain parameters of HRV decreased precipitately after CABG and were mostly recovered 3 months postoperatively. The percentage of decreased HRV before surgery was 28.6% and 51.8% after 7 days, 19.6% after 3 months, and 12.7% after 6 months. ASDNN and SDNN before and after surgery had the highest rates of change.
Conclusion: The early decrease in HRV observed 7 days after CABG may be related to the acute effects of the surgery. The recovery of HRV at 3 months after surgery, regardless of the preoperative state of the patients, implies that autonomic nervous system (ANS) disorder may be improved at this time. At 6 months after surgery, the autonomic nervous injury was recovered in combination with improvement of reperfusion, resulting in improvement in almost all HRV indices compared with those indices pre‐operatively.
Keywords: coronary artery disease, coronary artery bypass graft surgery, heart rate variability
1. Introduction: Coronary artery disease (CAD) is a common disease and the leading cause of death worldwide [1,2]. Currently, coronary artery bypass grafting (CABG) with extracorporeal circulation is a key therapy for CAD, however, cardiovascular events and cardiac arrhythmias still occur in these patients after surgery [3–6]. Cardiac arrhythmias commonly occurring after surgery include atrial fibrillation (5–40%), ventricular tachycardia (26.6%), and ventricular fibrillation (2.7%) [7–9]. Cardiac arrhythmias account for 30–50% of all post‐operative deaths [10]. Among the cardiac arrhythmias mentioned above, only 5–10% can be detected by a 12‐lead electrocardiogram (12‐lead ECG); this can be increased to up to 40–60% by using 24‐hour Holter monitoring (or 24‐hour Holter ECG) detection [11]. The autonomic nervous system (ANS) is a risk factor for the development of arrhythmias [12]. Holter ECG plays a direct role in assessing arrhythmias and an indirect role in assessing ANS activity through HRV, which is considered to be a predictor of arrhythmia and cardiovascular events [12,13].
Several studies have evaluated HRV pre and postoperatively. However, in these studies, HRV after CABG was only monitored at one time [14] or was assessed by sequential changes with a limited number of cases [15,16,17]. In this study, we assessed HRV in the time domain and frequency domain by 24‐hour Holter ECG in patients before and after CABG at 1 week, 3 months, and 6 months. The assessment of HRV at three times post‐surgery will help to predict ventricular arrhythmias, especially new‐onset atrial fibrillation for acute post‐surgery and stable stage after surgery, which may provide better prognosis and treatment in different postoperative periods.
Materials and methods
Selection criteria: A total of 119 patients with stable CAD in sinus rhythm undergoing isolated CABG surgery at Hanoi Heart Hospital between June 2016 and August 2018.
Exclusion criteria: Patients with an acute coronary syndrome, acute heart failure, or other acute diseases; patients with medical conditions where HRV could not be assessed before surgery, such as atrial fibrillation, frequent premature ventricular complex, sinus node dysfunction, and second and third‐degree atrioventricular block; patients with pacemakers; patients with congenital heart disease or combined cardiac surgeries; and patients who did not consent to participate in the study were excluded.
2. Methods and research
Study Design: This study was conducted by prospective, descriptive methods and approved by the Hospital Ethics Committee. Patients were advised of the protocol for the study and written informed consent was obtained.
Research Tools: Holter 24‐hour recordings were made by 3‐channel SEER LIGHTS Digital Holter recorders; an MSC 8800 Holter Monitoring system with Medical System International software version 5.02 was used.
Research Steps: Perioperative management: No patients took amiodarone preoperatively. Most patients were extubated on the day of surgery and oral medication was initiated on postoperative day 1, no inotropes were used at 3 days postoperatively. We tried to avoid prescribing drugs that affect HRV (calcium channel blockers, beta‐blockers, antiarrhythmic drugs, etc.). If drugs affecting HRV were prescribed for preoperative treatment, we overcame this influencing factor by continuing its use after surgery.
Holter ECG recordings and HRV analysis: The first recording was made 2 days before surgery, the second was made 7 days after surgery, the third was made 3 months after surgery, and the 4th was made 6 months after surgery. HRV was analyzed using the Holter Monitoring system and then over‐read manually. It was analyzed in Holter ECG recordings only in patients with sinus rhythm. Holter ECG results were reviewed by a single cardiologist and only recordings with less than 15% of ectopic beats were used. All artifacts were cleaned and beats were modified as needed.
Evaluation Criteria: Most of the variables were calculated as recommended by the Task Force of the European Society of Cardiology and the North American Society of Pacing and Electrophysiology [18]. For frequency domain analysis, the indices measured included VLF (the magnitude of the HRV in the VLF range, 0.0033 to 0.04 Hz), LF (the magnitude of the HRV in the LF range, 0.04 to 0.15 Hz), and HF (the magnitude of the HRV in the HR range, 0.15 to 0.04 Hz). HRV in the time domain covered ASDNN (the mean of the standard deviations of all normal to normal intervals for 5 minutes of recording), rMSSD (the square root of the mean of the sum of the squares of differences between adjacent normal to normal intervals), pNN50 (percentage of normal to normal intervals >50 ms), SDNN (standard deviation of all normal to normal intervals), and SDANN (standard deviation of averages of normal to normal intervals in all 5‐minute segments of recordings). Decreased HRV was defined according to Crawford et al. (1999), i.e. when there was at least one index of expression upper to the limit level [19]. Atrial fibrillation was defined as at least 6 minutes of an irregularly‐irregular pattern of QRS‐waves recorded [19].
Statistical analysis
The corrected data were processed, and HRV was computed. The results are expressed by mean value± standard deviation with minimum and maximum values. The normality of the distribution of the variables was checked using a Kolmogorov‐Smirnov test. Variables that are normally distributed have a histogram (or “density function”) that is bell‐shaped, with only one peak, and are symmetric around the mean. Comparisons in parameters between two groups were performed using Pearson's X2 test for categorical variables, unpaired t test for normally distributed variables, and Mann–Whitney's U test for skewed variables. Continuous variables underwent Student's unequal variance unpaired t‐tests or nonparametric tests, as appropriate. All analyses were performed with the SPSS statistical package, version 11.0.
3. Results and discussion
3.1. General characteristics of the patients

FIGURE 1 Age distribution.
A total of 119 patients were recruited for this study. The general characteristics of the studied patients are shown in Table 1 and Figure 1. The average age of these patients was 64.92 ± 7.34 years old, with the common age ranging between 60 and 70 years old. The youngest patient was 38 years old and the oldest was 81 years old. The age of patients in this study is similar to that in published studies [20].
TABLE 1 General characteristics, risk factors, and comorbidities
| Value | Patients (n = 119) | |
|---|---|---|
| Parameters | Values (n) | Ratio (%) |
| Male | 99 | 83.2 |
| Smoking | 55 | 46.2 |
| BMI ≥23 | 61 | 51.2 |
| History of myocardial infarction | 10 | 8.4 |
| Hypertension | 103 | 86.6 |
| Dyslipidemia | 62 | 52.1 |
| Chronic obstructive pulmonary disease (COPD) | 4 | 3.4 |
| Type 2 diabetes | 40 | 33.6 |
| peripheral arterial disease | 15 | 12.6 |
| Renal failure ≥ IIIa | 56 | 47.1 |
| Age (years) | 64.92 ± 7.34 (39–81) | |
| BMI (kg/m2) | 22.99 ± 2.85 (15.99–30.8) | |
| EuroSCORE II (%) | 1.31 ± 0.82 (0.6–4.9) | |
Males accounted for 83.2% of the patients (99 patients) and females accounted for 16.8% (20 patients). The proportion of men was more than four times that of women. This rate is similar to that of several published studies [21–23]. Generally, men are three to four times more likely to develop coronary heart disease than women. The mean BMI of the patients was 22.99 ± 2.85 (ranging between 15.99 and 30.8). Being under/overweight or obese increases the frequency of pneumonia and it can be difficult to wean such patients off mechanical ventilation in the early stages of surgery [24]. Hypertension‐related diseases were prevalent in 103 of the patients. These characteristics reflect the common risk factors of CAD such as advanced age, multiple risk factors, and comorbidities.
3.2. HRV in the frequency domain
TABLE 2 Heart rate variability by frequency domain before and after surgery
| Timing frequency domain | Before surgery (1) ( n = 119) | After 7 days (2) (n = 109) | After 3 months (3) (n = 102) | After 6 months (4) (n = 102) | |
|---|---|---|---|---|---|
|
VLF (ms2) |
(±SD) | 25.19 ± 12.28 | 18.32 ± 11.86 | 25.74 ± 9.18 | 29.75 ± 11.33 |
| p | p (1–2) < 0.001 | p (1–3) > 0.05 | p (1–4) < 0.05 | ||
|
LF (ms2) |
(±SD) | 16.26 ± 12.33 | 12.95 ± 11.93 | 17.06 ± 9.09 | 20.25 ± 9.91 |
| p | p (1–2) < 0.05 | p (1–3) > 0.05 | p (1–4) < 0.05 | ||
|
HF (ms2) |
(±SD) | 11.35 ± 7.21 | 8.74 ± 6.19 | 12.00 ± 6.26 | 12.91 ± 5.40 |
| p | p (1–2) < 0.001 | p (1–3) > 0.05 | p (1–4) > 0.05 | ||
| LF/HF | (±SD) | 1.43 ± 0.40 | 1.48 ± 0.64 | 1.48 ± 0.42 | 1.59 ± 0.43 |
| p | p (1–2) > 0.05 | p (1–3) > 0.05 | p (1–4) < 0.05 | ||
All 119 patients had sinus rhythm Holter ECG results before surgery. At 7 days after CABG surgery, there were two cases of death and eight cases of persistent atrial fibrillation. At 3 months and 6 months postoperatively, there were 14 cases of atrial fibrillation and one more death, respectively. HRV is the oscillation of the heart rate interval that reflects the interaction of factors regulating heart rate. Age, race, sex, physical status, and concomitant diseases influence HRV. However, HRV in 24 hours is stable on a day‐to‐day, day‐to‐week basis in the absence of therapeutic intervention or major events and regulated by the ANS [25]. Imbalances in the ANS have been shown to increase the risk of arrhythmia in CAD patients. Increments in sympathetic nervous system (SNS) activity in CAD patients may lead to greater myocardial ischemia which, in turn, increases SNS activity while decreasing parasympathetic nervous system (PSNS) activity [25,26].
Table 2 shows that the measured value of HRV according to the frequency domain changed over the study period. At 7 days after CABG surgery, the values of the frequency spectrum indices (VLF, LF, HF) were lower than before surgery; however, the LF/HF ratio remained unchanged. This is likely explained by acute post‐operative injuries affecting the ANS, which decreased both the SNS (decreased VLF and LF) and PSNS (decreased HF) and continued the imbalance between the SNS and PSNS (LF/HF remained unchanged). Cheng‐Deng Kuo [15] tested 14 patients, the result showed that total power and only low‐frequency power (SNS activity) decreased significantly 1 month after CABG and returned to preoperative levels from the second month. There were no significant differences in high‐frequency power (PSNS activity) and low−/high‐frequency power ratio (SNS activity) before and after CABG. The author suggested that CABG affected SNS and its improvement after 2 months of operation was attributed to the recovery from direct injury to the vagus nerve or sinus node. In their study with 22 patients, C. Ann Brown et al [16] found that overtime between six and 12 weeks postoperatively the indices of PSNS (HF/ total power) improved significantly, whereas no change was seen in the LF/HF ratio. Both authors above found that either SNS or PSNS was affected by CABG. In our study, both SNS and PSNS were reduced at one week postoperatively and changed during the follow‐up period. The difference may be explained that in these previous studies, a limited case recruited can cause bias in statistical analysis, and the difference in baseline characteristics maybe the reason.
Three months after surgery (table 2), all values of the frequency domain indices had risen again and were not significantly different from the preoperative values (p (1–3) > 0.05), indicating the improved recovery of the ANS compared to 7 days after surgery because of the improvement of acute injury 3 months postoperatively. However, the LF/HF index was not improved, which implied a remaining SNS/PSNS imbalance. After 6 months of surgery, a significant increase was seen in LF but not in HF, which resulted in significantly increased LF/HF and the improvement of SNS/PSNS balance. Probably, before surgery LF was markedly reduced and only mild reduction was seen in HF, therefore, postoperative LF increased remarkably and an increase was also found in postoperative HF but without significance. This may explain the results of previous studies where cardiovascular events and cardiac arrhythmias at 6 months after surgery continued to improve compared to those 3 months postoperatively [28,29]. In another study [15], HRV did not exceed the preoperative level over 6 months after CABG, the author suggested that there was incomplete recovery from direct injury to the vagal nerve or sinus node, or that revascularization because of CABG cannot improve the autonomic nervous activity of the heart in 6 months. This present study was carried out recently in good condition and facilities, which may partly explain the better revascularization with the improvement of HRV as compared to the previous study.
3.3. HRV in the time domain
TABLE 3 Heart rate variability (HRV) in the time domain before and after surgery
| Timing time domain | Before surgery (1) ( n = 119) | After 7 days (2) (n = 109) | After 3 months (3) (n = 102) | After 6 months (4) (n = 102) | |
|---|---|---|---|---|---|
|
ASDNN (ms) |
(±SD) | 44.84 ± 20.14 | 34.54 ± 21.24 | 46.13 ± 16.53 | 52.23 ± 16.56 |
| p | p (1–2) < 0.001 | p (1–3) > 0.05 | p (1–4) < 0.05 | ||
|
rMSSD (ms2) |
(±SD) | 26.73 ± 12.15 | 22.14 ± 12.82 | 27.83 ± 12.18 | 29.14 ± 10.01 |
| p | p (1–2) = 0.001 | p (1–3) > 0.05 | p (1–4) > 0.05 | ||
|
pNN 50 (%) |
(±SD) | 6.84 ± 7.24 | 4.94 ± 8.78 | 7.69 ± 7.74 | 8.40 ± 6.72 |
| p | p (1–2) < 0.05 | p (1–3) > 0.05 | p (1–4) > 0.05 | ||
|
SDNN (ms) |
(±SD) | 101.18 ± 34.28 | 76.65 ± 35.04 | 107.5 ± 27.27 | 121.5 ± 25.98 |
| p | p (1–2) < 0.001 | p (1–3) > 0.05 | p (1–4) < 0.001 | ||
In this study, the time domain indices of HRV also changed over time. At 7 days after surgery, all of the time domain indexes (ASDNN, rMSSD, pNN50, SDNN, SDANN, and Mean NN) were lower than before surgery (Table 3). This shows that the acute effect of CABG surgery reduces the time domain indices, which is similar to the results of the frequency domain indices analysis above. Acute injuries caused by surgery include myocardium damage, autonomic nerve fibers (caused by cutting, burning, contusion, etc.), neurohumoral dilution because of cardiopulmonary system filling, bleeding, and fluid infusion [30,31]. The HRV indexes reflect the ANS, in which the SDNN index is governed by the SNS (like the LF index). The pNN50 and rMSSD indices are governed by the PSNS (like the HF index). In the first week after surgery, other authors have found that arrhythmias increase significantly compared to before surgery [32]. The decrease in the time domain indices during this time might indirectly reflect postoperative damage, which may help predict postoperative arrhythmias. Three months after surgery, all HRV indexes in the time domain had increased and were equal to those before surgery (p (1–3) > 0.05, Table 3). HRV recovery at 3 months after surgery was consistent in both the frequency and time domains. This result further demonstrates that ANS damage (including the SNS and PSNS) caused by acute effects of CABG was generally healed 3 months after surgery. These results reach an agreement with the other studies, Pedro Paulo S Soares [17] also noted that all the time‐domain indexes of HRV decreased at 3 days, 6 days, and 15 days after CABG, which gradually increased at 30 days postoperatively. At 60 days and 90 days after surgery, all time‐domain indexes returned to pre‐surgery values with no significant difference.
In this study, at 6 months after surgery, the ASDNN, SDNN, and SDANN indexes were higher than before surgery (Table 3), which is similar to the VLF and LF indices in the results of the analysis of the frequency domain indices, indicating an increased function of the SNS on the heart. Whereas, at 6 months, the rMSSD and HF indices changed insignificantly compared to those before and 3 months after surgery. Both indexes were controlled by the PSNS and depended on concomitant diseases such as hypertension, kidney failure, diabetes, and CAD. Despite reperfusion after surgery, the underlying disease still existed and a proportion of patients had not been completely reperfused, which may explain the incomplete recovery of the PSNS indicators with no significantly different values compared to those before surgery.
3.4. Decreased HRV
TABLE 4 The ratio of decreased heart rate variability before and after surgery
| Timing time domain | Before surgery (1) (n = 119) | After 7 days (2) (n = 109) | After 3 months (3) (n = 102) | After 6 months (4) (n = 102) | |
|---|---|---|---|---|---|
| Decreased heart rate variability (n, %) | Yes | 34 (28.6) | 57 (52.3) | 20 (19.6) | 13 (12.7) |
| No | 85 (71.4) | 52 (47.7) | 82 (80.4) | 89 (87.3) | |
| p (1,2) < 0.001 | p (1,3) < 0.05 | p (1,4) < 0.05 | |||
|
ASDNN (ms) |
<30 | 23 (19.3) | 50 (45.9) | 14 (13.7) | 6 (5.9) |
| ≥30 | 96 (80.7) | 59 (54.1) | 88 (86.3) | 96 (94.1) | |
| p | p (1,2) < 0.05 | p (1,3) > 0.05 | p (1,4) < 0.05 | ||
|
rMSSD (ms2) |
<15 | 18 (15.1) | 28 (25.7) | 10 (9.8) | 7 (6.9) |
| ≥15 | 101 (84.9) | 81 (74.3) | 92 (90.2) | 95 (93.1) | |
| p | p (1,2) > 0.05 | p (1,3) > 0.05 | p (1,4) < 0.05 | ||
|
pNN 50 (%) |
<0.75 | 26 (21.8) | 34 (31.2) | 13 (12.7) | 11 (10.8) |
| 93 (78.2) | 75 (68.8) | 89 (87.3) | 91 (89.2) | ||
| p | p (1,2) > 0.05 | p (1,3) > 0.05 | p (1,4) < 0.05 | ||
|
SDNN (ms) |
<50 | 10 (8.4) | 23 (21.1) | 2 (2.0) | 1 (1.0) |
| 109 (91.6) | 86 (78.9) | 100 (98.0) | 101 (99.0) | ||
| p | p (1,2) < 0.05 | p (1,3) < 0.05 | p (1,4) < 0.05 | ||
|
SDANN (ms) |
<40 | 6 (5.0) | 22 (20.2) | 2 (2.0) | 1 (1.0) |
| 113 (95.0) | 87 (79.8) | 100 (98.0) | 101 (99.0) | ||
| p | p (1,2) < 0.05 | p (1,3) > 0.05 | p (1,4) > 0.05 | ||

FIGURE 2 Heart rate variability. (A) The ratio of decreased heart rate variability before and after surgery; (B) The ratio of decreased heart rate variability by each indices.
In our study, there was a change in the percentage of decreased HRV at the following time points: before surgery (28.6%), 7 days after surgery (51.8%), 3 months after surgery (19.6%), and 6 months after surgery (12.7%). There was a sharply increased ratio of decreased HRV at 7 days postoperatively. Among these indices, the ratios of decreased ASDNN, SDNN, and SDANN were found to be significantly higher; this reflects the reduction of SNS function (Table 4, Figure 2). No significant changes in the ratio of decreased rMSSD or pNN 50 were observed, indicating that PSNS activity was not greatly affected.
The high proportion of patients with decreased HRV immediately after surgery was possibly because of the acute impact of the surgery, which reduced the HRV indices governed by the SNS, while the HRV indices reflecting the PSNS were not affected. Previous studies have shown that only a reduction in PSNS function is valuable in predicting cardiovascular events [33]. This may be the reason why a decreased HRV at 7 days after surgery has little value in predicting cardiovascular events. Likewise, regarding the consequences of decreased HRV in CABG patients with stable CAD, most authors have the same opinions. Milicevic et al., studying 175 CAD patients (124 with acute myocardial infarctions (MI) and 51 undergoing CABG surgery), showed that a decreased HRV in the CABG surgery group had less predictive value for mortality than in the MI group [29]. Lakusic (2015) also suggested that, unlike a reduction of AMI in patients with MI, a reduction in HRV after CABG was not associated with major cardiovascular events [30]. Park et al. stated that a decreased HRV pre‐operatively has a predictive value in the occurrence of new atrial fibrillation and stroke following CABG [31].
In this study, decreased HRV was gradually recovered by the third month, in conjunction with significantly lower ratios of decreased HRV by each time domain index. However, no significantly different value was observed compared to the pre‐operative values. By the sixth month, the ratios of decreased HRV by each index continued to decrease compared to the third month and a significant difference was observed compared to the pre‐operative values, except for that of SDANN. By the sixth month, the HRV indices reflecting the PSNS and the indices reflecting the SNS and PSNS were significantly improved. The post‐operative ANS injury which occurred during the first week lasted up to 3 months after surgery. By the sixth month, these damages had recovered in combination with the recovery of reperfusion, which resulted in an improvement in almost all HRV indices compared with the pre‐operative indices [32]. Despite a significant improvement in HRV compared to pre‐operation, a number of patients still have a decreased HRV and HRV had not totally normalized. This likely explains why cardiac arrhythmia often occurred in the first week and then decreased gradually after 1, 3, and 6 months in most of the patients [33–36].
4. Conclusion
Our study shows that frequency and time domain indices changed over time following CABG. HRV in both SNS and PSNS indices reduced remarkably after 7 days, stabilized after 3 months, and increased 6 months after surgery. The ratio of decreased HRV was the highest 7 days after surgery, in which the ratio of decreased ASDNN and SDNN showed the most change, then lowered after 3 months and minimized after 6 months with significant reduction compared to pre‐operation.
Limitation
In this study, HRV was not assessed monthly during the follow‐up, the pattern of change was only evaluated at 7 days, 3 months, and 6 months postoperatively. Cardiac events and death had not been followed up to find the relation with HRV change, which cannot help to provide a prognosis. As a result of the lack of a large number of patients, HRV had not been analyzed in terms of baseline characteristics and surgery‐related factors.
Data availability
Data can be made available on request through email to the corresponding author.
Conflict of Interest
The authors declare no conflicts of interest regarding the publication of this article.
Author contribution
P.T.S conceptualized the study, searched the literature, wrote the manuscript, and supervised the work, N.V.T and N.S.H collected and processed the data, and P.N.S analyzed and interpreted the data.
Acknowledgment
The authors thank Professor Philips Wong (National Heart Center, Singapore) for advice and training and Hanoi Heart Hospital, and 108 Central Military Hospital for supporting this study.
References
-
1
E. Kandaswamy and L. Zuo, “Recent advances in treatment of coronary artery disease: role of science and technology”, International Journal of Molecular Sciences, vol. 19, p. 2, 2018.
-
1
M. A. Sadr‐Ameli, A. Alizadeh, V. Ghasemi, M. Heidarali, “Ventricular tachyarrhythmia after coronary bypass surgery: incidence and outcome”, Asian Cardiovascular and Thoracic Annals, vol. 21, no. 5, pp. 551–557, 2013.
-
2
E, Thorén, L. Hellgren, F. Granath, LG. Hörte, E. Ståhle, “Postoperative atrial fibrillation predicts cause‐specific late mortality after coronary surgery”, Scandinavian Cardiovascular Journal, vol. 48, no. 2, pp. 71–78, 2014.
-
3
M. Hata, K. Akiyama, S. Wakui et al., “Does warfarin help prevent ischemic stroke in patients presenting with post coronary bypass paroxysmal atrial fibrillation?”, Annals of Thoracic and Cardiovascular Surgery, vol. 19, no. 3, pp. 207–211, 2013.
-
4
A. Sezai and M. Shiono, “Atrial fibrillation after coronary artery bypass grafting”, General General Thoracic and Cardiovascular Surgery, vol. 61, no. 8, pp. 427–428, 2013.
-
5
J. A. Yeung‐Lai‐Wah, A. Qi, E. McNeill et al., “New‐onset sustained ventricular tachycardia and fibrillation early after cardiac operations”, Annals of Thoracic Surgery, vol. 77, no. 6, pp. 2083–2088 (2004).
-
6
M. Milojevic, S. J. Head, C. A. Parasca et al., “Causes of death following PCI versus CABG in complex CAD: 5‐year follow‐up of SYNTAX”, Journals of the American College of Cardiology, vol. 67, no. 1, pp. 42–55, 2016.
-
7
M. A. Mosorin, M. Lantos, T. Juvonen, F. Biancari, “Five‐year outcome after coronary artery bypass surgery in survivors of out‐of‐hospital cardiac arrest”, Frontiers in Surgery, vol. 2, pp. 2, 2015.
-
8
M. F. El‐Chami Kilgo, V. Thourani, O. M. Lattouf et al., “New‐onset atrial fibrillation predicts long‐term mortality after coronary artery bypass graft”, Journals of the American College of Cardiology, vol. 55, no. 13, pp. 1370–1376, 2010.
-
9
O. J. Ormerod, C. G. Mcgregor, D. L. Stone, “Arrhythmias after coronary bypass surgery”, Bristic Heart Journal, vol. 51, no. 6, pp. 618–621, 1984.
-
10
S. S. Barold, “Norman J. “Jeff” Holter–“Father” of Ambulatory ECG Monitoring”, Journal of Interventional Cardiac Electrophysiology, vol. 14, pp. 117–118, 2005.
-
11
F. Maycon Jr., and A. Zanesco, “Heart rate variability as important approach for assessment autonomic modulation”, Motriz ‐ Rio Claro, vol. 22, no. 2, pp. 3–8, 2016.
-
12
A. R. David, K. E. Nieminski, J. C. Monteferrante, “Ventricular arrhythmias after coronary artery bypass graft surgery: Incidence, risk factors and long‐term prognosis”, Journal of the American College of Cardiology, vol. 6, no. 2, pp. 307–310, 1985.
-
13
H: Lakusic, V. Slivnjak, F. Baborski, and D. Cerovec, “Heart rate variability after off‐pump versus on‐pump coronary artery bypass graft surgery,” Cardiology Research and Practice, vol. 2009, Article ID 295376, 4 pages, 2009.
-
14
M: C. D. Kuo, G. Y. Chen, S. T. Lai, Y. Y. Wang, C. C. Shih, and J. H. Wang, “Sequential changes in heart rate variability after coronary artery bypass grafting,” American Journal of Cardiology, vol. 83, no. 5, pp. 776–779, 1999
-
15
N: C. A. Brown, L. A. Wolfe, S. Hains, G. Ropchan, and J. Parlow, “Heart rate variability following coronary artery bypass graft surgery as a function of recovery time, posture, and exercise,” Canadian Journal of Physiology and Pharmacology, vol. 82, no. 7, pp. 457–464, 2004
-
16
K: P. Soares, A. M. Moreno, S. L. Cravo, and A. C. Nobrega, “Coronary artery bypass surgery and longitudinal evaluation of the autonomic cardiovascular function,” Critical Care, vol. 9, no. 2, pp. R124–R131, 2005.
-
17
Electrophysiology Developed in Collaboration with the North American Society for Pacing ACC/AHA Guidelines for Ambulatory Electrocardiography, Journals of the American College of Cardiology, vol. 34, no. 3, pp. 912–948, 1999.
-
18
M. H. Crawford and Al, “Guidelines for Ambulatory ECG”, Journal of the American College of Cardiology and the American Heart Association, vol. 34, no. 3, pp. 912–919, 1999.
-
19
S. Verma, D. L. Bhatt, P. G. Steg et al., “REDUCE‐IT Investigators. Icosapent Ethyl Reduces Ischemic Events in Patients With a History of Previous Coronary Artery Bypass Grafting: REDUCE‐IT CABG”. Circulation, vol. 144, no. 23, pp. 1845–1855, 2021.
-
20
M. Nakayama, T, Takahashi, R. Horinaka, T. Uchiyama, “A case report of myocardial ischemia improvement despite early bypass graft occlusion: Efficiency of physiological reassessment”, Journal of Cardiology Cases, vol. 21, no. 3, pp. 119–122, 2019.
-
21
E. M. J. P. Mouws, A. Y. P. Knops, C. K. E. Boersma et al., “Early ventricular tachyarrhythmias after coronary artery bypass grafting surgery: Is it a real burden?”, Journal of Cardiology, vol. 70, pp. 263–70, 2017.
-
22
M. Kasra, D. Elena, M. James et al., “In‐Hospital Outcomes and Complications of Coronary Artery Bypass Grafting in the United States Between 2008 and 2012”, Journal of Cardiothoracic and Vascular Anesthesia, vol. 31, no. 1, pp. 19–25, 2017.
-
23
Li X, Gu D, Wang X et al., “Trends of Coronary Artery Bypass Grafting Performance in a Cohort of Hospitals in China Between 2013 and 2018”, Circulation: Cardiovascular Quality and Outcomes, vol. 14, no. 4, e007025, 2021.
-
24
S. Dimitriadis, E. Qian, A. Irvine, A. Harky, “Secondary Prevention Medications Post Coronary Artery Bypass Grafting Surgery‐A Literature Review”, Journal of Cardiovascular Pharmacology and Therapeutics, vol. 26, no. 4, pp. 310–320, 2021.
-
25
S. Bonnini, G. Mazzoni, M. Borghesi et al., “Improving walking speed reduces hospitalization costs in outpatients with cardiovascular disease. An analysis based on a multistrata non‐parametric test”, BMC Health Services Research, vol. 20, no. 1, p. 1048, 2020.
-
26
Z. K. Wu, S. Vikman, J. Laurikka et al., “Nonlinear heart rate variability in CABG patients and the preconditioning effect”, European Journal of Cardio‐Thoracic Surgery, vol. 28, no. 1, pp. 109–113, 2005.
-
27
S. Demirel, V. Akkaya, H. Oflaz, T. Tükek, O. Erk “Heart rate variability after coronary artery bypass graft surgery: a prospective 3‐year follow‐up study”, Annals of Noninvasive Electrocardiology, vol. 7, no. 3, pp. 247–250, 2002.
-
28
G. Milicevic, L. Fort, M. Majsec, V. Bakula, “Heart rate variability decreased by coronary artery surgery has no prognostic value”, European Journal of Cardiovascular Prevention & Rehabilitation, vol. 11, no. 3, pp. 228–232, 2004.
-
29
N. Lakusic, D. Mahovic, P. Kruzliak et al., “Changes in heart rate variability after coronary artery bypass grafting and clinical importance of these findings”, BioMed Research International, vol. 2015, p. 680515, 2015.
-
30
S. J. Park, Y. K. On, J. S. Kim et al., “Heart rate turbulence for predicting new‐onset atrial fibrillation in patients undergoing coronary artery bypass grafting”, International Journal of Cardiology, vol. 174, no. 3, pp. 579–585, 2014.
-
31
D. J. Fonseca Alves, J. Bartholomeu‐Neto, E. R. Júnior et al., “Walking Speed, Risk Factors, and Cardiovascular Events in Older Adults‐Systematic Review”, Journal of Strength and Conditioning Research, vol. 31, no. 11, pp. 3235–3244, 2017.
-
32
P. K. Stein, P. P. Domitrovich, R. E. Kleiger, “CAST Investigators. Including patients with diabetes mellitus or coronary artery bypass grafting decreases the association between heart rate variability and mortality after myocardial infarction”, American Heart Journal, vol. 147, no. 2, pp. 309–316, 2004.
-
33
T.Kinoshita, T. Asai, T. Ishigaki et al., “Preoperative Heart Rate Variability Predicts AtrialFibrillation After Coronary Bypass Grafting”, Annals of Thoracic Surgery, vol. 91, pp. 1176–1182, 2011.
-
34
H. V. Huikuri, P. K. Stein, “Heart rate variability in risk stratification of cardiac patients”, Progress in Cardiovascular Diseases, vol. 56, no. 2, 153–159, 2013.
-
35
A. C. M. Omoto, R. M. Lataro, T. M. Silva et al., “Heart rate fragmentation, a novel approach in heart rate variability analysis, is altered in rats 4 and 12 weeks after myocardial infarction”, Medical and Biological Engineering and Computing, vol. 59, no. 11–12, pp. 2373–2382, 2021.
OP‐180‐1‐GE (TRACK 7 ‐ GE 2)
A comparison between the accuracy of apple watch 4 and Fitbit versa to measure heart rate
Anunay Gupta; Samual Turnbull; Kartheek Garikapati; Kasuna De Silva; Ashwin Bhaskaran; Richard G. Bennett; Yasuhito Kotake; Timothy Campbell; Chow Clara; Saurabh Kumar
Westmead Hospital, Sydney, Australia
Objective: To compare two commonly used newer generation wearables, the Apple Watch 4 (AW) and Fitbit Versa (FB) to accurately detect HR during various arrhythmias in patients undergoing EPS.
Materials and Methods: Patients underwent a clinically indicated EPS along with AW on one wrist and FB on the other. The device‐measured HR was obtained using the highest‐measured HR. The corresponding true HR was derived from the ECG. Accurate measurement was defined as HR within ±10% of true HR. The rhythms were divided into five categories i.e., regular, the onset and termination of tachycardia, irregular, and sinus pause of more than 3 seconds (or CHB).
Results: Thirty‐two patients with n = 322 simplified rhythms were analyzed. Both devices failed to capture HR of more than 180 bpm. The accuracy within 10% of true HR for regular rhythms for AW and FB was 86.9% and 100% for SR, 86.3% and 88.6% for SVT, and 58% and 40.5% for VT. AW had an accuracy of 85.7% to detect the onset of SVT and 60% to detect VT. FB had an accuracy of 39.2% and 16.2% for SVT and VT onset. Both devices had poor accuracy (<70%) during the termination of SVT and VT, AF, NSVT, and PVC. No episodes of VF, sinus pause, or CHB were picked.
Conclusion: The overall accuracy of AW was better than FB. Both can accurately detect HR during tachyarrhythmias and an unexpected increase in HR detected by the AW is likely a true tachyarrhythmia.
Supporting Documents
TABLE 1 Accuracy of Fitbit and Apple watch for the various rhythms
| Number of rhythms | Accuracy ratio (±10%) Fitbit | Delta (FB HR—True HR) | Accuracy ratio (±10%) apple | Delta (AW HR—True HR) | |
|---|---|---|---|---|---|
| Regular | 121 (37.5%) | ||||
| Sinus Rhythm (HR 40–150) | 46 (38.0%) | 40 (86.9%) | 2.83 ± 11.83 | 46 (100%) | 0.7 ± 2.2 |
| SVT (HR 100–200) | 44 (36.3%) | 38 (86.3%) | ‐ 8.75 ± 25.52 | 39 (88.6%) | ‐ 8.32 ± 24.86 |
| VT (HR 100–261) | 31 (25.6%) | 18 (58.0%) | ‐ 38.19 ± 49.14 | 21 (67.7%) | ‐ 35.97 ± 53.85 |
| VT HR < 180 | 22 (18.8%) | 18 (81.8.%) | −11.05 ± 23.52 | 21 (95.4%) | −3.82 ± 17.02 |
| Onset | 65 (20.1%) | ||||
| SVT (HR 100–200) | 28 (43.0%) | 11 (39.2%) | ‐ 29.18 ± 34.61 | 24 (85.7%) | ‐ 9.79 ± 26.88 |
| VT (HR 100–286) | 37 (56.9%) | 6 (16.2%) | ‐ 71.51 ± 57.5 | 15 (40.5%) | ‐ 63.57 ± 63.23 |
| VT HR < 180 | 25 (38.46%) | 6 (24%) | ‐ 34.0 ± 39.96 | 15 (60%) | ‐ 1.50 ± 43.11 |
| Termination | 66 (20.5%) | ||||
| SVT (HR 41–140) | 37 (56.1%) | 15 (39.4%) | 18.5 ± 20.32 | 23 (60.5%) | 5.43 ± 8.06 |
| VT (HR 27–169) | 29 (43.9%) | 9 (31%) | 14.34 ± 36.71 | 12 (41.3%) | 7.28 ± 32.48 |
| Irregular rhythms | 66 (20.5%) | ||||
| AF (HR 56–194) | 28 (42.4%) | 10 (39.4%) | −19.92 ± 28.27 | 11 (60.5%) | −17.96 ± 31.76 |
| VF (HR 171–430) | 10 (15.1%) | 0 | −110.2 ± 60.37 | 0 | −91.8 ± 61.91 |
| VPC (HR 50–112) | 11 (16.6%) | 6 (54.5%) | −58.5 ± 41.85 | 6 (54.5%) | −65.5 ± 43.15 |
| NSVT (HR 102–197) | 17 (25.7%) | 3. (17.6%) | −7.36 ± 19.28 | 2 (11.7%) | −7.5 ± 16.09 |
| Pause >3 seconds and CHB | 4 (0.01%) | 0 | 17.12 ± 19.32 | 0 | −13.8 ± 24.48 |
Note: Data are represented as n (%), mean ± SD.

FIGURE 1 Scatter plot depicting accuracy of wearables for stable regular rhythm (Panel A) and (Panel B) onset of SVT. Red dashed lines are +/−10% ECG heart rate limits. Black line is zero difference from ECG HR.
OP‐181‐1‐GE (TRACK 7 ‐ GE 2)
Optimal anticoagulation intensity of warfarin in Korean patients with atrial fibrillation: Multi‐center, prospective, randomized controlled trials
Kihong Lee 1; Jeong Gwan Cho1; Seung Yong Shin2; Hyung Wook Park1; Jum‐Seok Koh3; Nam Ho Kim3; Yae min Park4; Jung Myung Lee5; Nam Sik Yoon1; sung Soo Kim6; Jun Hyung Kim7; Dong Min Kim8
1 Chonnam National University, Gwangju, South Korea; 2Chung‐Ang University, Seoul, South Korea; 3Wongkwang University, Iksan, South Korea; 4Gachon University, Incheon, South Korea; 5Kyung Hee University, Seoul, South Korea; 6Chosun University, Gwangju, South Korea; 7Chungnam University, Daejeon, South Korea; 8Dankuk University, Cheonan, South Korea
Objectives: In this randomized, open‐label trial, we compared low‐intensity anticoagulation (international normalized ratio, INR 1.6 to 2.6) with standard‐intensity anticoagulation (INR 2.0 to 3.0) with warfarin in 616 patients with atrial fibrillation (AF) and at least 1 risk factor for stroke.
Material and Methods: The per‐protocol, intension‐to‐treatment analysis was designed to determine whether low‐intensity anticoagulation (n = 308) was non‐inferior to standard‐intensity anticoagulation (n = 308) with warfarin for the primary endpoint of net clinical outcomes defined as the sum of stroke, systemic embolism, major bleeding, and death.
Results: Median value of INR was significantly higher in a standard‐intensity group than the low‐intensity group (2.19 vs. 2.07, p = 0.002), whereas that of time in the therapeutic range was comparable between the 2 groups. The rate of primary outcome was 1.55% per year in low‐intensity anticoagulation, as compared with 2.46% per year in standard‐intensity anticoagulation (hazard ratio [HR] 0.62, 95% confidence interval [CI] 0.22 to 1.74, p for non‐inferiority <0.001). New‐onset stroke occurred in 2 patients (0.52% per year) in the low‐intensity group and in 5 patients (1.23% per year) in the standard‐intensity group (HR 0.42, 95% CI 0.08 to 2.17, p for non‐inferiority <0.001). Major bleeding occurred in 4 patients (0.88% per year) in the low‐intensity group and 5 patients (1.23% per year) in the standard‐intensity group (HR 0.84, 95% CI 0.22 to 3.17, p for non‐inferiority <0.001).
Conclusion: In Korean patients with AF, low‐intensity anticoagulation with warfarin as INR 1.6 to 2.6 was non‐inferior to standard‐intensity anticoagulation with warfarin as INR 2.0 to 3.0.
OP‐182‐2‐GE (TRACK 6 ‐ GE 5)
Baseline electrocardiogram changes could predict clinical outcomes among hospitalized chronic kidney disease patients
Ricardo Adrian Nugraha 1; Bagus Putra Dharma Khrisna1; Tony Santoso Putra1; Eka Prasetya Budi Mulia1; Lalu Galih Rinjani1; Rerdin Julario2; Budi Baktijasa Dharmadjati2
1 Department of Cardiology and Vascular Medicine, Faculty of Medicine, Universitas Airlangga – Dr. Soetomo General Hospital, Surabaya, Indonesia; 2Division of Electrophysiology and Pacing, Department of Cardiology and Vascular Medicine, Faculty of Medicine, Universitas Airlangga – Dr. Soetomo General Hospital, Surabaya, Indonesia
Objectives: As data on cardiovascular complications among chronic kidney disease patients has been limited, the present study aimed to understand the association between electrocardiogram changes with clinical outcomes among hospitalized patients with chronic kidney disease.
Methods: We performed a single‐center, observational prospective cohort study among stage V CKD patients who have not experienced hemodialysis. CKD was diagnosed based on the KDIGO 2012 criteria. The cumulative all‐cause mortality and cardiovascular death, MACE, and non‐fatal MI were analyzed using Kaplan–Meier.
Results: A total of 350 patients were enrolled, 96 patients were excluded because of the previous history of hemodialysis and 56 patients were excluded because of incomplete data. The rest of the 198 patients were analyzed. Their mean age was 39.87 years and 41.52% were women. They were followed up for 12 months on average, with 129 incident cases (65.15%) being identified during 1‐years at risk. Pathologic Q wave at baseline (HR 3.15, 95% CI [1.81–5.37]; p < 0.01), peak T wave (HR 1.93, 95% CI [1.07–2.84]; p = 0.04), left axis deviation (HR 2.14, 95% CI [1.03–4.47]; p = 0.04), and non‐specific ST/T changes (HR 2.70, 95% CI [1.65–3.78]; p = 0.01) were all independently associated with all‐cause mortality, cardiovascular death, and MACE. On the contrary, left ventricular hypertrophy and fragmented QRS were not associated with clinical outcomes.
Conclusion: Several changes in electrocardiogram were significantly associated with the incidence of all‐cause mortality, cardiovascular mortality, MACE, and rehospitalization independently of level and change in cardiovascular disease risk factors, and may have clinical utility for prognostication among hospitalized CKD patients.
Supporting Documents


OP‐183‐2‐GE (TRACK 6 ‐ GE 5)
Association between diastolic dysfunction with coronary artery calcium score in stable coronary artery disease patients
Hilfan Ade Putra Lubis
Adam Malik General Hospital, Medan, Indonesia
Objectives: Diastolic dysfunction is a common problem in patients with obesity, hypertension, diabetes, or coronary artery disease (CAD) including stable CAD. The coronary artery calcium score (CACS) is used to non‐invasively evaluate cardiovascular risk in asymptomatic patients with a low to intermediate pre‐test probability for CAD. The purpose of this study was to evaluate the association of diastolic dysfunction with an abnormal CAC score.
Materials and Methods: This study considered a cohort of patients >18 years of age with normal ejection fraction who were admitted to the hospital with chest pain but low‐risk presentation for acute myocardial infarction. Patients then underwent cardiac CT for measurement of CAC score. Patients were excluded if they had a prior history of CAD, ECG findings diagnostic of an acute coronary syndrome, an elevated troponin level, or hemodynamic instability.
Results: A total of 200 patients were included and 96 (48%) patients had echocardiographic evidence of diastolic dysfunction. Patients with diastolic dysfunction were more likely to have a higher mean calcium score (12.154.68 ± 17.588.30 vs 2666.38 ± 9725.82; p < 0.001). Receiver operating characteristics (ROC) analysis showed the area under the curve was 86.3% and cut off was 129.5 with a sensitivity of 85% and specificity of 74%.
Conclusions: Our study demonstrates that left ventricular diastolic dysfunction is associated with an abnormal CAC score. Patients without known CAD that present with chest pain with evidence of abnormal diastolic function on echocardiogram may warrant a more thorough evaluation for coronary atherosclerotic disease with CAC score assessment.
OP‐184‐2‐GE (TRACK 6 ‐ GE 5)
Association of electrocardiographic abnormalities with in‐hospital mortality in adult patients with COVID‐19 infection
Jannah lee Tarranza; Marcellus Francis Ramirez; Milagros Yamamoto
University of Santo Tomas Hospital, Manila, Philippines
Objectives: The study aims to determine the association between electrocardiographic abnormalities and in‐hospital mortality of patients with Coronavirus Disease 2019 (COVID‐19) infection admitted in a tertiary hospital in the Philippines.
Materials and Methods: We conducted a retrospective study of confirmed COVID‐19‐infected patients. Demographic, clinical characteristics, and clinical outcomes were extracted from the medical records. Electrocardiographic analysis was derived from the 12‐lead electrocardiogram (ECG) recorded upon admission. The frequencies and distributions of various clinical characteristics were described, and the ECG abnormalities associated with in‐hospital mortality were investigated.
Results: A total of 163 patients were included in the study, most were female (52.7%) with a median age of 55 years old. Sinus rhythm (40%), nonspecific ST and T wave changes (35%), and sinus tachycardia (22%) were the frequently reported ECG findings. The presence of any ECG abnormality was detected in 78.5% of patients and it was significantly associated with in‐hospital mortality (p = 0.038). The analysis revealed a statistically significant association between in‐hospital mortality and having atrial fibrillation or flutter (p = 0.002), supraventricular tachycardia (SVT) (p = 0.011), ventricular tachycardia (p = 0.011), third‐degree atrioventricular block (AVB) (p = 0.011), T wave inversion (p = 0.005) and right ventricular hypertrophy (RVH) (p = 0.011).
Conclusion: The presence of any ECG abnormality in patients with COVID‐19 infection was associated with in‐hospital mortality. ECG abnormalities that were associated with mortality were atrial fibrillation or flutter, SVT, ventricular tachycardia, third‐degree AVB, T wave inversion, and RVH.
Supporting Documents
Association of electrocardiographic abnormalities with in‐hospital mortality in adult patients with COVID‐19 infection
TARRANZA, Jannah Lee [1]; RAMIREZ, Marcellus Francis [1,2]; YAMAMOTO, Milagros [1]
1 Section of Adult Cardiology, Department of Internal Medicine, University of Santo Tomas Hospital, Manila, Philippines
2 Division of Electrophysiology, Section of Adult Cardiology, Department of Internal Medicine, University of Santo Tomas Hospital, Manila, Philippines
Key words: Electrocardiography, COVID‐19, mortality, Philippines.
TABLE 1 Demographic and clinical profiles of COVID‐19 patients (n = 163) with ECG abnormalities
| Variable | Group | Total (n = 163) | Any ECG abnormality | No ECG abnormality | p‐value |
|---|---|---|---|---|---|
| Age (Mean ± SD) | 57.13 ± 17.20 | 45.63 ± 18.62 | 0.001* | ||
| Gender | Male | 77 | 65 | 12 | 0.083 |
| Female | 86 | 63 | 23 | ||
| Obesity | Not Obese | 84 | 63 | 21 | 0.258 |
| Obese | 79 | 65 | 14 | ||
| Smoking | Never | 110 | 83 | 27 | 0.383 |
| Active Smoker | 12 | 10 | 2 | ||
| Former Smoker | 41 | 35 | 6 | ||
| Comorbidities | |||||
| Hypertension | No | 70 | 46 | 24 | 0.001* |
| Yes | 93 | 82 | 11 | ||
| Diabetes Mellitus | No | 116 | 90 | 26 | 0.646 |
| Yes | 47 | 38 | 9 | ||
| Coronary Artery Disease | No | 150 | 116 | 34 | 0.207 |
| Yes | 13 | 12 | 1 | ||
| Chronic Heart Failure | No | 154 | 119 | 35 | 0.107 |
| Yes | 9 | 9 | 0 | ||
| COPD | No | 159 | 124 | 35 | 0.290 |
| Yes | 4 | 4 | 0 | ||
| Prior Stroke | No | 146 | 113 | 33 | 0.303 |
| Yes | 17 | 15 | 2 | ||
| Active Cancer | No | 154 | 121 | 33 | 0.955 |
| Yes | 9 | 7 | 2 | ||
| Permanent Pacing | No | 160 | 125 | 35 | 0.361 |
| Yes | 3 | 3 | 0 | ||
| Dyslipidemia | No | 151 | 117 | 34 | 0.249 |
| Yes | 12 | 11 | 1 | ||
| Heart rate | 91.04 ± 14.57 | 87.80 ± 13.35 | 0.237 | ||
| Laboratory findings | |||||
| Hemoglobin (g/L) (Mean ± SD) | 133.98 ± 17.99 | 132.83 ± 16.81 | 0.733 | ||
| HsTrop I (ng/L) (Mean ± SD) | 1.21 ± 13.08 | 0.02 ± 0.09 | 0.591 | ||
| D‐dimer, ng/mL (Mean ± SD) | 3.0 ± 13.36 | 0.70 ± 1.30 | 0.313 | ||
| Ferritin, ug/L (Mean ± SD) | 1323.93 ± 1767.37 | 1436.35 ± 4121.85 | 0.811 | ||
| eGFR (Mean ± SD) | 82.65 ± 31.89 | 89.78 ± 38.43 | 0.203 | ||
Significant at 0.05 level.
TABLE 2 Clinical Profile of COVID‐19 Patients (n = 163) based on their Survival Status
| Variable | Group | Total (n = 163) | Survivors | Non‐survivors | p‐value |
|---|---|---|---|---|---|
| Age (Mean ± SD) | 52.13 ± 17.82 | 70.82 ± 9.53 | 0.000* | ||
| Gender | Male | 77 | 64 | 13 | 0.231 |
| Female | 86 | 77 | 9 | ||
| Obesity | Not Obese | 84 | 69 | 15 | 0.093 |
| Obese | 79 | 72 | 7 | ||
| Smoking | Never | 110 | 100 | 10 | 0.002* |
| Active Smoker | 12 | 12 | 0 | ||
| Former Smoker | 41 | 29 | 12 | ||
| Comorbidities | |||||
| Hypertension | No | 70 | 68 | 2 | 0.001* |
| Yes | 93 | 73 | 20 | ||
| Diabetes Mellitus | No | 116 | 103 | 13 | 0.179 |
| Yes | 47 | 38 | 9 | ||
| Dyslipidemia | No | 151 | 133 | 18 | 0.037* |
| Yes | 12 | 8 | 4 | ||
| Coronary Artery Disease | No | 150 | 133 | 17 | 0.006* |
| Yes | 13 | 8 | 5 | ||
| Chronic Heart Failure | No | 154 | 136 | 18 | 0.005* |
| Yes | 9 | 5 | 4 | ||
| COPD | No | 159 | 137 | 22 | 0.424 |
| Yes | 4 | 4 | 0 | ||
| Prior Stroke | No | 146 | 128 | 18 | 0.201 |
| Yes | 17 | 13 | 4 | ||
| Active Cancer | No | 154 | 134 | 20 | 0.431 |
| Yes | 9 | 7 | 2 | ||
| Heart rate | 89.65 ± 13.65 | 94.82 ± 17.89 |
0.116 |
||
| Laboratory findings | |||||
| Hemoglobin (g/L) (Mean ± SD) | 134.98 ± 17.54 | 125.77 ± 17.00 | 0.026* | ||
| HsTrop I (ng/L) (Mean ± SD) | 1.07 ± 12.46 | 0.22 ± 0.64 | 0.752 | ||
| D‐dimer, ng/mL (Mean ± SD) | 0.87 ± 1.39 | 12.99 ± 30.70 | 0.078 | ||
| Ferritin, ug/L (Mean ± SD) | 989.43 ± 1230.87 | 3691.63 ± 5448.66 | 0.031* | ||
| eGFR (Mean ± SD) | 87.34 ± 31.96 | 58.16 ± 32.34 | 0.000* | ||
Significant at 0.05 level.
TABLE 3 ECG Abnormalities of COVID‐19 Patients (n = 163) based on their Survival Status
| Variable | Group | Any ECG abnormality | No ECG abnormality | Test statistic (df) | p‐value |
|---|---|---|---|---|---|
| Survival Status | Survivor | 107 | 34 | 4.322 | 0.038* |
| Non‐Survivor | 21 | 1 |
Significant at 0.05 level.
TABLE 4 ECG Parameters of COVID‐19 Patients (n = 163) based on their Survival Status
| Variable | Survivors (mean ± SD) | Non‐survivors (mean ± SD) | Test statistic t | p‐value |
|---|---|---|---|---|
| Atrial rate | 85.52 ± 20.65 | 101.68 ± 63.08 | 1.193 | 0.246 |
| Ventricular Rate | 87.09 ± 16.54 | 112.55 ± 39.26 | 3.000 | 0.007 |
| PR‐interval, ms | 0.17 ± 0.04 | 0.11 ± 0.08 | −3.322 | 0.003* |
| QRS Complex | 0.08 ± 0.19 | 0.09 ± 0.03 | 1.299 | 0.207 |
| QTc‐interval, ms | 0.36 ± 0.04 | 0.30 ± 0.11 | −2.208 | 0.038* |
| QTc‐Bazette | 0.42 ± 0.04 | 0.39 ± 0.13 | −1.225 | 0.234 |
| QTc‐ Fridericia | 0.40 ± 0.03 | 0.37 ± 0.13 | −1.190 | 0.247 |
Significant at 0.05 level.
TABLE 5 ECG Abnormalities of COVID‐19 Patients (n = 163) based on their Survival Status
| Variable | Group | Survivors | Non‐survivors | Test statistic (df) | p‐value |
|---|---|---|---|---|---|
| Sinus rhythm (with other ECG abnormalities) | No | 44 | 14 | 8.732 | 0.003* |
| Yes | 97 | 8 | |||
| Sinus bradycardia | No | 137 | 22 | 0.640 | 0.424 |
| Yes | 4 | 0 | |||
| Sinus Tachycardia | No | 113 | 15 | 1.614 | 0.204 |
| Yes | 28 | 7 | |||
| Sinus arrhythmia | No | 135 | 21 | 0.004 | 0.950 |
| Yes | 6 | 1 | |||
| Ectopic atrial rhythm | No | 139 | 22 | 0.316 | 0.574 |
| Yes | 2 | 0 | |||
| Atrial fibrillation or flutter | No | 137 | 18 | 9.601 | 0.002* |
| Yes | 4 | 4 | |||
| SVT | No | 141 | 21 | 6.449 | 0.011* |
| Yes | 0 | 1 | |||
| Ventricular tachycardia | No | 141 | 21 | 6.449 | 0.011* |
| Yes | 0 | 1 | |||
| APCs or atrial premature complexes | No | 134 | 21 | 0.007 | 0.933 |
| Yes | 7 | 1 | |||
| VPCs or ventricular premature complexes | No | 136 | 21 | 0.054 | 0.817 |
| Yes | 5 | 1 | |||
| First degree AV block | No | 137 | 21 | 0.187 | 0.666 |
| Yes | 4 | 1 | |||
| Third Degree AV block | No | 141 | 21 | 6.449 | 0.011* |
| Yes | 0 | 1 | |||
| Fragmented QRS | No | 136 | 22 | 0.805 | 0.370 |
| Yes | 5 | 0 | |||
| Right bundle branch blocks (RBBB) | No | 137 | 20 | 2.099 | 0.147 |
| Yes | 4 | 2 | |||
| Left bundle branch block (LBBB) | No | 141 | 22 | NA | NA |
| Yes | 0 | 0 | |||
| Left anterior fascicular block | No | 140 | 22 | 0.157 | 0.692 |
| Yes | 1 | 0 | |||
| Abnormal precordial R wave progression | No | 131 | 20 | 0.111 | 0.738 |
| Yes | 10 | 2 | |||
| Brugada pattern | No | 138 | 22 | 0.477 | 0.490 |
| Yes | 3 | 0 | |||
| Acute ST elevation | No | 140 | 22 | 0.157 | 0.692 |
| Yes | 1 | 0 | |||
| T wave inversion | No | 136 | 18 | 7.814 | 0.005* |
| Yes | 5 | 4 | |||
| Old infarction | No | 134 | 19 | 2.485 | 0.115 |
| Yes | 7 | 3 | |||
| Nonspecific ST and T wave changes | No | 89 | 17 | 1.676 | 0.195 |
| Yes | 52 | 5 | |||
| Right ventricular hypertrophy (RVH) | No | 141 | 21 | 6.449 | 0.011* |
| Yes | 0 | 1 | |||
| Left ventricular hypertrophy (LVH) | No | 129 | 20 | 0.008 | 0.928 |
| Yes | 12 | 2 | |||
| Left atrial abnormality | No | 138 | 22 | 0.477 | 0.490 |
| Yes | 3 | 0 | |||
| Early repolarization pattern | No | 139 | 22 | 0.316 | 0.574 |
| Yes | 2 | 0 | |||
| Presence of U waves | No | 137 | 22 | 0.640 | 0.424 |
| Yes | 4 | 0 | |||
| Prolonged QTc | No | 134 | 19 | 2.485 | 0.115 |
| Yes | 7 | 3 | |||
| Low voltage limb leads | No | 137 | 22 | 0.640 | 0.424 |
| Yes | 4 | 0 |
Significant at 0.05 level.
OP‐185‐2‐GE (TRACK 6 ‐ GE 5)
Study of conduction system disturbances in patients undergoing aortic valve surgeries
Sathish Reddy; Suhail Raja; Abhishek Rathore; Deepak Padmanabhan; Darshan Krishnappa; Jayaprakash Shenthar
Sri Jayadeva Institute of Cardiovascular Sciences and Research, Bengaluru, India
Objectives: To determine the Electrocardiographic and Electrophysiological changes in patients undergoing Isolated Aortic valve surgeries.
Materials and Methods: This is a single‐center open‐labeled observational study that included 38 patients aged >45 years, with isolated degenerative severe aortic stenosis posted for coronary workup prior to valve replacement surgery. Enrolled patients at the time of coronary angiogram undergo one catheter EP study via 6F right femoral venous sheaths to assess the AH, and HV intervals. The same study shall be repeated in the post‐operative period prior to discharge.
Results: In this study of 38 patients, there was no difference between AH and HV intervals pre and post‐procedure. AH interval difference in median pre‐ and post‐procedure is 5 msec (74 msec vs 79 msec), weak association (p = 0.012). HV interval difference in median pre‐ and post‐procedure 0.5 msec (47.5 msec vs 48 msec), no association (p = 0.542). One patient with basal RBB with normal HV interval developed a prolonged HV interval of 75 msec and required a pacemaker at follow‐up. The same patient had calcification of the aortic valve extending to the septum. There are no electrocardiographic changes post‐procedure.
Conclusion: In this first study comparing the findings of the electrophysiologic study (EPS) and electrocardiography (ECG), the impact of the Aortic valve replacement on the AV conduction system showed not much perturbance of the conduction system by surgical aortic valve replacement.
OP‐186‐2‐GE (TRACK 6 ‐ GE 5)
Usefulness of T‐wave alternans as an arrhythmic risk stratifier prior to use of the AAD
Hyeonjeong Oh; Myung Jin Cha; Min Su Cho; Jun Kim; Kee‐Joon Choi; Gi‐Byoung Nam
Asan Medical Center, Seoul, South Korea
Microvolt level T‐wave alternans (MTWA), a phenomenon of beat‐to‐beat variability in the repolarization phase of the ventricles, has been closely associated with an increased risk of ventricular tachyarrhythmic events (VTE) and sudden cardiac death (SCD). Analysis of ambulatory Holter monitors from patients with various forms of heart disease has demonstrated a sharp upsurge in repolarization alternans within the minutes prior to spontaneous VTE. Also, commonly used cardiac medications have been shown to alter susceptibility to TWA. We sought to pre‐screen the patient who was vulnerable to arrhythmia by examining the TWA before the use of antiarrhythmic drugs. We retrospectively reviewed the medical records and 24 Hr Holter monitoring of 20 healthy patients, 22 patients with congenital LQT, and 6 patients with acquired LQT and TdP. Exclusion criteria were the presence of AF or high‐grade AV block and valvular heart disease. Peak TWA was determined by the Modified Moving Average method. The sum of peak TWA values of three leads in healthy subjects was significantly lower than those in LQTS patients.[84.250 μV versus 146.955 μV, p < 0.001]. The sum of peak TWA values of the patients with TdP history after acquiring long QT because of AAD use had the highest value among all the patients. [176.3 μV, p < 0.001]. The patient with acquired LQT and TdP examined the 24 Hr Holter after washing out of AAD. The ability to detect or make a prediction of the arrhythmic Risk using TWA was useful and feasible in the clinical setting prior to the use of the AAD.
OP‐187‐2‐GE (TRACK 6 ‐ GE 5)
A study of clinical and electrophysiological characteristics of Infrahisian Wenckebach
Anindya Ghosh 1; Anand Y. Pasula1; Uday Shankar Das2; Ulhas M. Pandurangi1
1 The Madras Medical Mission, Chennai, Chennai, India; 2Apollo Multispecialty Hospital, Kolkata, India
Objectives: To study the clinico‐electrophysiological profile of patients with Infrahisian Wenckebach (IHW) conduction.
Materials and Methods: Patients with a clinical diagnosis of atrioventricular (AV) block who underwent permanent pacemaker implantation (PPI) based on standard indications from July 2021–June 2022 at The Madras Medical Mission were subjected to pre‐ implant Electrophysiology study to document conduction pathology.
Results: A total of 94 patients underwent PPI for AV block during the study period. EPS was performed in all but one patient (COVID pneumonia). The incidence of IHW was 9/93 (9.6%) of patients with AV block. There is no gender predisposition (M‐4, F‐5) and their mean age was 71.4 ± 11.7 years. As many as half of the patients (5/9) had an underlying narrow QRS. The mean QRS duration was 130 ± 19.3. Ischemic heart disease affected half of the patients and cardiomyopathy in 4/9 patients (mean EF 45.1 ± 13.7%). Presentation was syncope in all, mean NYHA class was 2.1. Presentation ranged from isolated 1st‐degree AV block (1/9) to tri‐fascicular block (3/9). In EP study, the mean basal HV interval was 94.7 ± 27.1 ms. IHW was noted spontaneously in 4 patients and on atrial pacing in the remaining. In the literature, a total of 11 documented cases have been reported (8 case reports). Unlike typical Wenckebach, the increment in PRI is minimal in the 2nd beat of the train.
Conclusion: Wenckebach periodicity is classically considered an AV nodal phenomenon. IHW is scarcely reported in the literature. Distinction becomes critical as IHW is harbinger of a complete AV block. This is the largest series and the first clinic‐etiological profile of IHW patients published to date.
Supporting Documents

TABLE 1 Demographic and Electrophysiological Characteristics of patients with InfraHisian Wenckebach

TABLE 2 Review of published literature

Case 1

Case 2

Case 3

Case 4

Case 5

Case 6

Case 7

Case 8
OP‐188‐V‐GE
Etiologic profile and clinical characteristics of atrioventricular block in young and middle‐aged inpatients
Zhongli Chen; Yuanhao Jin; Keping Chen
State Key Laboratory of Cardiovascular Disease, Cardiac Arrhythmia Center, Fuwai Hospital, National Center for Cardiovascular Disease, Chinese Academy of Medical Sciences and Peking Union Medical College, Beijing, China
Objectives: Little is known about the etiology distribution and clinical profile of the atrioventricular block in the Asian young and middle‐aged population.
Materials and Methods: We retrospectively enrolled inpatients ≤50 years old who were diagnosed with AVB at National Center from January 1st, 2020 to December 31st, 2021. Medical records were reviewed to identify the etiology. Age/ sex‐specific etiology distribution was calculated. According to AVB type and cardiac change, the relationship between etiology and clinical phenotypes was analyzed.
Results: In the 471 patients with AVB, the median age was 36 and 61.78% were male. 14 etiologies were identified but undetermined etiology accounted for 38.6%. Non‐ischemic cardiomyopathy (NICM) (16.6%), complication of cardiac surgery (13.4%), ischemic heart disease (IHD) (7.4%), congenital heart disease (CHD) (6.8%), vagal etiology (4.3%) constituted the top 5 causes for AVB. Cardiac surgery‐related AVB was more common in minors (age:0–17), vagal‐related AVB is more significant in young adults (age:18–35), and middle‐aged adults (age:36–50) were dominated by IHD. Determined etiologies were more common in males. Patients with unknown etiology had four distinct phenotypes according to AVB severity and left ventricle (LV) change. In these patients, NT‐proBNP levels were associated with both the severity of AVB (p trend =0.009) and odds of severe phenotype (advanced AVB with LV change).
Conclusion: Etiologies in young and middle‐aged AVB patients were diverse and presented with age/sex‐specific patterns, but with a diagnostic gap. Patients with unknown etiology displayed different clinical phenotypes and NT‐proBNP levels were associated with AVB severity and severe phenotype in this group.
Supporting Documents
Left: Etiology distribution of atrioventricular block (AVB) among young and middle‐aged patients.
Right: Etiology of AVB in relation to blocking severity and cardiac structure and function.
(Abbreviations: NICM: non‐ischemic cardiomyopathy, IHD: ischemic heart disease, LQTs: long Q‐T syndrome, BrS: Brugada Syndrome, CAVB: congenital atrioventricular block, CM: cardiomyopathy, LVEDD: left ventricular end‐diastolic diameter, LVEF: left ventricular ejection fraction, HFrEF: heart failure with reduced ejection fraction (LVEF ≤40%) HFmrEF: Heart failure with mildly reduced ejection fraction (41% ≤ LVEF≤49%), severe AVB: advanced AVB was defined as Mobitz Type II AVB/ high ‐degree AVB/Third‐degree AVB, large LVEDD: borderline or elevated LVEDD, LV end‐diastolic diameter >55 mm for an adult man, > 50 mm for women and pediatrics).


OP‐189‐V‐GE
Protective effect of low‐dose versus high‐dose NOACs for the prevention of death in established atherosclerosis
Riccardo Cappato; Mauro Chiarito; Michela Giustozzi; Letizia Riva; Gianluca Bonitta; Hussam Ali; Pierpaolo Lupo; Corrado Lodigiani; Giulio Stefanini
IRCCS Multimedica, Sesto San Giovanni, Milano, Italy
Objectives: We investigated whether, in patients with manifest coronary artery disease (CAD), randomization to Low‐dose (D) novel oral anticoagulants (NOACs) more effectively prevents mortality than assignment to High‐D NOACs.
Methods: PubMed/Embase/BioMedCentral/ Google Scholar/ and Cochrane Central Register of Controlled Trials were searched for studies reporting all‐cause mortality in patients with various manifestations of CAD in which allocation to control, Low‐D or High‐D NOACs was designated by protocol. After exclusions, three studies were analyz ed. Rivaroxaban 2.5 mg versus 5.0 mg twice daily in patients with acute or stable CAD and edoxaban 30 mg versus 60 mg once daily in patients with concomitant atrial fibrillation were used for inter‐group comparison.
Results: All‐cause mortality occurred in fewer patients in the Low‐D (589 of 14,957 [3.9%]) than in the High‐D NOAC group (705 of 14,843 patients [4.7%]; RR, 0.83; 95% CI, 0.74 to 0.92; p = 0.031; I2 = 0%). There was no significant difference in fatal bleeding between the two groups (26 [0.2%] versus 33 [0.2%]; RR 0.78; 95% CI, 0.69 to 1.52; p = 0.4684). When compared to 14,876 patients in the control group of the three trials, fewer patients died in the Low‐D group (RR, 0.78; 95% CI, 0.69 to 0.88; p < 0.0001), but not in the High‐D group (RR, 0.95; 95% CI, 0.86 to 1.05; p = 0.306).
Conclusions: Patients with manifest CAD receiving a Low‐D of NOAC therapy had a lower all‐cause mortality risk than those receiving a High‐D. This benefit, which was not determined by a reduced risk of fatal bleeding, is in need of further assessment.(250).
Supporting Documents

FIGURE
OP‐190‐1‐HF (TRACK 9 ‐ HF 1)
Comparison of Asian‐Pacific and non‐Asian‐Pacific heart failure patients with CRT between AdaptResponse and Mid‐Q response
Toon‐Wei Lim 1; Kengo Kusano2; Seung‐Jung Park3; Sofian Johar4; Andrew St. Martin5; Janelle van Wel6; Federica La Neve7; Kazutaka Aonuma8
1 National University Hospital, Singapore; 2Department of Cardiovascular Medicine, National Cerebral and Cardiovascular Center, Osaka, Japan; 3Sungkyunkwan University School of Medicine, Samsung Medical Center, Seoul, South Korea; 4Gleneagles Jerudong Park Medical Centre and Institute of Health Sciences, Universiti, Brunei‐Muara, Brunei Darussalam; 5Medtronic Cardiac Rhythm Management, United States of America; 6Medtronic Bakken Research Center, Maastricht, Netherlands; 7Medtronic Study & Scientific Solutions, Rome, Italy; 8Department of Cardiology, Faculty of Medicine, University of Tsukuba, Tsukuba, Japan
Objectives: The AdaptResponse and Mid‐Q Response studies have been designed to evaluate the superiority of the AdaptivCRT algorithm compared to standard CRT therapy in CRT‐indicated patients with moderate to wide QRS duration, preserved atrioventricular conduction and left bundle branch block. Asian adults have narrower QRS complexes than Western adults, possibly related to a lower height and smaller heart sizes in Asians. Mid‐Q Response investigates the hypothesis that AdaptivCRT is beneficial from a lower QRS duration cut‐off of 120 ms.
Materials and Methods: AdaptResponse required a QRS duration ≥130 ms for women and ≥ 140 ms for men while Mid‐Q Response is enrolling patients with a QRS duration of ≥120 and < 150 ms. AdaptResponse is conducted in 27 countries worldwide (3620 patients randomized, 245 (6.8%) from Asia‐Pacific). Mid‐Q Response is conducted in 10 countries in Asia and randomized 110 out of 220 patients up to now.
Results: In the AdaptResponse study, a comparison of baseline characteristics between Asian and non‐Asian Pacific patients showed a significant difference in height, BMI, Systolic Blood Pressure, and NYHA Class (p < 0.001). The AdaptResponse Asian‐Pacific patients with QRS duration <150 ms are similar to those enrolled in Mid‐Q Response with the only difference being QRS duration (p < 0.0001).
Conclusion: The similarity in the patient groups is encouraging and the difference in QRS duration confirms that Mid‐Q Response is enrolling subjects in the lower QRS range. Whether the differences in patient outcomes between the AdaptivCRT and standard CRT arms in both studies are similar as well will become clear in 2 years.
Supporting Documents

OP‐191‐1‐HF (TRACK 9 ‐ HF 1)
Acute heart failure and sinus node dysfunction—Hyperthyroid induced reversible cardiac insult: A case report
Amit Malik
Max Hospital Vaishali India, Ghaziabad, India
Seventy‐seven‐year‐old female with progressive shortness of breath, palpitation, and syncope for 4 days.
Twelve‐lead electrocardiogram (ECG) showed Atrial fibrillation (AF) with ST‐segment elevation in lead I, aVl, V2‐V3. The patient had spontaneous termination of AF and sinus pause associated with syncope. Initial echocardiogram demonstrated severe hypokinesia of the lateral, anterior, and apical segments with overall impaired left ventricular systolic function (EF 35%). The patient was treated for acute pulmonary edema. Coronary angiography showed normal coronary arteries. Temporary pacemaker insertion is done. The patient was treated with Levosimendan infusion (0.1 mcg/kg/min for 24 hrs.), Ramipril, Furosemide, and Enoxaparin.
The patient's family gave a history of irregular treatment for Multinodular goiter. The thyroid profile was sent the next morning. FT3 was 3.67 pg/ml (VN: 2.6–4.2 pg/ml), FT4 was 2.13 ng/dl (VN: 0.58–1.64 ng/dl) and TSH was 0.04 mcg IU/ml (VN: 0.34–5.6 mcg IU/ml) Antithyroid therapy (Carbimazole) was initiated. The patient's clinical status improved gradually. Episodes of Paroxysmal Atrial fibrillation and sinus pauses reduced in frequency gradually. Temporary pacemaker was removed after 72 hours and she was put on telemetry monitoring. The patient was discharged on Ramipril 5 mg once, Apixaban 5 mg twice, and Carbimazole 30 mg once daily doses. 6 weeks follow‐up telemetry revealed normal sinus rhythm, No AF or sinus pauses. The echocardiogram showed normal left ventricular systolic function (EF 60%). Carbimazole and Apixaban continued.
Conclusion: We identified a patient with acute heart failure and sinus node dysfunction in whom treatment of the thyroid disease, along with standard heart‐failure therapies, resulted in complete recovery of LV dysfunction and sinus node function.
Supporting Documents

OP‐192‐1‐HF (TRACK 9 ‐ HF 1)
Atrial fibrillation ablation for heart failure with preserved ejection fraction (HFpEF): A randomized controlled trial
David Chieng 1,2,3; Hariharan Sugumar1,2,3; Louise Segan1,2,3; Caleb Tan2; Donna Vizi1,2; Shane Nanayakkara1,2; Ahmed Al‐Kaisey3,4; Joshua Hawson3,4; Sandeep Prabhu1,2,3; AleksanVoskoboinik1,2,3; Joseph Morton3,4; Geoffrey Lee3,4; Justin Mariani2; Andre La Gerche1,2,3; Peter Kistler1,2,3,5; Jonathan Kalman3,4,5; David Kaye1,2,5; Liang‐Han Ling1,2,3
1 Baker Heart and Diabetes Institute, Melbourne, Australia; 2Alfred Health, Melbourne, Australia; 3University of Melbourne, Melbourne, Australia; 4Royal Melbourne Hospital, Melbourne, Australia; 5Monash University, Melbourne, Australia
Objectives: Atrial fibrillation (AF) and HFpEF often concurrently exist. Few therapies have proven benefit in HFpEF. The objectives of this study are to compare the effects of AF ablation on markers of HFpEF severity, including exercise haemodynamics, functional capacity, and quality of life scores.
Materials and Methods: Patients with AF and HFpEF underwent clinical evaluation, cardiopulmonary exercise testing, exercise right heart catheterization (ExRHC), and natriuretic peptide (NT‐proBNP) assay. HFpEF diagnosis required a pulmonary capillary wedge pressure (PWCP) ≥15 mmHg at rest or ≥ 25 mmHg at peak exercise on ExRHC as the gold standard. Patients were randomized to AF ablation versus medical therapy and re‐evaluated at 6 months. The primary outcome was a change in PCWP on follow‐up.
Results: Thirty‐one patients (mean 66 years, 51.6% females) were randomized to AF ablation (16) versus medical therapy (15). Baseline characteristics were comparable across groups. At 6 months, ablation reduced the primary outcome measure of peak PCWP (30.4+/−4.2 to 25.9+/−4.3 mmHg, p < 0.01), with improvements in peak VO2 (1937.3+/−739.3 to 2216.3+/−861.9 mL/min, p < 0.01), NT‐pro BNP (771+/−703 to 167+/−66 ng/L, p = 0.03), and Minnesota Living with Heart Failure (MLHF) score (51+/−21.9 to 16.6+/−17.5, p < 0.01). No differences were observed in the medical arm. Following ablation, 50% (8/16) no longer met ExRHC‐based criteria for HFpEF (including 6/8 of those remaining arrhythmia‐free) versus 7% (1/15) in the medical arm (p = 0.02).
Conclusion: In concurrent AF and HFpEF, AF ablation improves invasive exercise hemodynamic parameters, increases exercise capacity, and enhances quality of life. Successful AF ablation may reverse the clinical syndrome of HFpEF in a proportion of these patients.
Supporting Documents

OP‐193‐1‐HF (TRACK 9 ‐ HF 1)
Left atrial scarring does not predict LV recovery post AF ablation in AF‐mediated cardiomyopathy
Louise Segan 1; David Chieng1,2,3; Geoffrey Lee3,4; Joshua Hawson3,4; Ahmed Al‐Kaisey3,4; Hariharan Sugumar1,2,3; AleksanVoskoboinik1,2,3; Han‐Liang Ling1,2,3; Joseph Morton3,4; Jonathan Kalman3,4; Peter Kistler1,2,3; Sandeep Prabhu1,2,3
1 Alfred Health, Prahran, Australia; 2Baker Heart and Diabetes Institute, Melbourne, Australia; 3University of Melbourne, Melbourne, Australia; 4Royal Melbourne Hospital, Melbourne, Australia
Objectives: We evaluated the impact of left atrial (LA) electroanatomical characteristics on clinical outcomes in patients with AF and heart failure (HF) without cardiac MRI (CMR) detected left ventricular (LV) fibrosis.
Methods: Consecutive patients with AF and HF (baseline LV ejection fraction (LVEF) <45%) without CMR‐detected LV fibrosis underwent LA electroanatomical mapping prior to AF ablation. Global and regional Unipolar and Bipolar voltage, scarring, fractionation, and conduction velocity were collected and the impact on LV recovery and AF recurrence was evaluated.
Results: Forty‐one patients (12.2% female, mean age 59 ± 12 years) with AF (80.5% persistent AF (PsAF)) and non‐ischaemic cardiomyopathy (baseline LVEF 32 ± 8%, LAVI 56 ± 15 mL/m2) were included. At 6 months, 68.3% demonstrated complete LV recovery and 36.6% experienced AF recurrence.
Patients were stratified according to the presence (49%) of LA scar (<0.05 mV). Baseline characteristics were similar, though PsAF and AF recurrence were higher in the LA scar cohort. On average, 1346 ± 353 points were analyzed. In those with LA scar, global scar burden was 1.5 ± 1.3% with higher fractionation (p = 0.002) though similar tissue voltage and conduction velocity (all p > 0.05, table 1). Global LA scar (x2 5.707, p = 0.017) and fractionation (R = 0.462, p = 0.002) were associated with AF recurrence but not LV recovery (x2 = 0.344, p = 0.558; R = 0.168, p = 0.294). Low voltage burden and voltage heterogeneity were not associated with AF recurrence nor LV recovery (all p > 0.05).
Conclusion: left atrial substrate does not predict LV recovery and its presence should not discourage consideration of catheter ablation in the pursuit of rhythm control among the AF‐mediated cardiomyopathy population.
Supporting Documents


OP‐194‐1‐HF (TRACK 9 ‐ HF 1)
Optimization of left ventricular atrio‐ventricular pacing delay in LV‐only cardiac resynchronization therapy
Tran Thong 1; Toan Nguyen‐Duy2; Phong Nguyen‐Vu1; Tien Hoang‐Anh1; Van‐Minh Huynh1; Dung Kieu‐Ngoc3; Tat‐Dat Tran4; Cuong Vuong‐Dinh5; Thang Nguyen‐Duy6; Duc Nguyen‐Huu7
1 Hue University of Medicine and Pharmacy, Hue, Viet Nam; 2Hospital 103, Hanoi, Vietnam; 3Cho Ray Hospital, Hochiminh City, Vietnam; 4Post Office Hospital, Hanoi, Vietnam; 5Viet Tiep Friendship Hospital, Hai Phong; 6Hanoi University of Medicine, Hanoi, Vietnam; 7Quang Tri General Hospital, Quang Tri, Vietnam
Objectives: Adaptive LV‐only pacing (LVop) is an alternative to biventricular cardiac resynchronization therapy (CRT) in patients with LBBB and good A‐RV conduction. We investigate fixed delay LVop with programmed optimal left ventricular atrioventricular delay (LVAVD).
Materials and Methods: The LVAVD of de novo and (unoptimized) LVop patients were optimized. The delays from atrial senses to electrocardiogram initial QRS peaks were measured during sensing tests, As‐Rpk (assuming R wave). The delays from the LV pacing pulses to initial QRS peaks during LV threshold tests were measured, LVp‐Qpk (assuming Q wave). The optimal LVAVD is (As‐Rpk) ‐ (LVp‐Qpk). Visual fine‐tuning was done. The final LVAD at rest is the optimal LVAVD minus 15–20 ms, the “dromotropic reserve”.
Patients with dual chamber pacemakers (electrodes in RA, LV) and triple chamber CRT devices (RA, RV, LV) programmed to LVop, were studied. Therapeutically, CRT is the same.
Results: For de novo patients, left ventricular ejection fraction (LVEF) measurements were made a few days after implant. For established LVop patients, LVEF before and after LVAVD optimization was measured.
For the five de novo patients, LVEF improvements from no pacing to optimal pacing ranged from +5% to +21%, without cardiac remodeling!
For the six established LVop patients, LVEF improved from +5% to +15.6%, on top of the improvements during unoptimized LVop. Expect further improvements with cardiac remodeling.
Conclusion: Optimized fixed delay LVAVD dual and triple chamber CRT devices can offer superior performance just from LVAVD optimization. Further improvements are expected from later cardiac remodeling.
Supporting Documents

OP‐195‐1‐HF (TRACK 9 ‐ HF 1)
Atrial fibrillation with preexcitation induced biventricular dysfunction in Ebstein anomaly
Raymond Bernardus; Giky Karwiky; Mohammad Iqbal; Chaerul Achmad
Hasan Sadikin Hospital, Bandung, Indonesia; 2Hasan Sadikin Hospital, Bandung, Indonesia
Case presentation: Ebstein's Anomaly is a rare congenital heart disorder occurring ≈1 per 200,000 live births and accounting for <1% of all cases of congenital heart disease. Downward displacement of the septal leaflet of the tricuspid valve created a potential substrate for accessory atrioventricular (AV) connection and pre‐excitation which cause ventricular dyssynchrony that leads to cardiomyopathy. The surgical approach is indicated when symptoms of cyanosis, exercise intolerance (NYHA III or IV), or cardiothoracic ratio >0.65 in NYHA I or II exist. We presented a case of Ebstein anomaly with atrial fibrillation and preexcitation on right postero‐septal pathway who received multiple ablation and medical therapy despite surgical indications.
A 26 years old male presented with signs and symptoms of right heart failure, hypotension, and tachycardia. Laboratory exam showed elevated transaminases. The ECG showed Atrial fibrillation with Wolff Parkinson white (AF‐WPW). Echocardiography showed dilated all chamber, reduced left ventricular ejection fraction (LVEF 40%) with global hypokinetic, moderate mitral regurgitation, and tricuspid regurgitation because of septal tricuspid valve apical displacement (10 mm/BSA). The patient underwent two separate ablation procedures which succeeded and 6 months of follow‐up and monitoring showed improvement of functional capacity, normal sinus rhythm, and echocardiographic improvement of left and right heart function which exclude the indication for surgery.
CONCLUSION: Ebstein's anomaly with an accessory pathway that could cause dyssynchrony and eventually heart failure can be cured by ablation of the accessory pathway. Improvement of functional capacity and echocardiographic parameters exclude the need for surgery.
Supporting Documents

FIGURE 1 (a) ECG Showed AFWPW on admission; (b) Post ablation showed atrial fibrillation; (c) readmission in 1 month showed recurrence of AF‐WPW; (d) After 2nd ablation and optimal medical therapy ECG showed normal sinus rhythm.
OP‐196‐1‐HF (TRACK 9 ‐ HF 2)
Cardiac resynchronization therapy (CRT) in a patient with arrhythmogenic right ventricular cardiomyopathy: A case report
Tam Adrian Aya‐Ay; Michael‐Joseph Agbayani; Giselle Gervacio; John Christopher Pilapil; Albert Rollorazo
Philippine General Hospital, Manila City, Philippines
Objectives: We present a case of a 39‐year‐old male with high‐frequency ventricular arrhythmias and symptomatic bradycardia complicated by heart failure. He was diagnosed to have Arrhythmogenic Right Ventricular Cardiomyopathy and successfully underwent cardiac resynchronization therapy.
Results: A 39‐year‐old male with high‐frequency ventricular arrhythmias survived sudden cardiac death and presented in the emergency department with loss of consciousness. Family history revealed first‐degree relatives with structural heart abnormalities but no premature sudden death. At presentation, 12 L‐ ECG revealed 3rd Degree AV block with complete right bundle branch block and T wave inversions in V1‐4 accompanied by epsilon waves, hence he underwent temporary pacing. Transthoracic echocardiogram revealed a reduced LV function (EF 20%); also a dilated and dyskinetic RV, dilated RVOT, and reduced fractional area change, fulfilling 2 major and 2 minor criteria in the 2019 Modified Task Force Criteria for ARVC/D diagnosis consistent with a definite diagnosis of Arrhythmogenic Right Ventricular Cardiomyopathy. The patient underwent successful cardiac resynchronization therapy and was discharged improved with heart failure medications. On follow‐up and device interrogation 1, 3, and 6 months after, the patient had multiple episodes of ventricular fibrillation and ventricular tachycardia which were terminated with shocks and burst antitachycardia pacing.
Conclusion: Heart failure in patients with arrhythmogenic right ventricular cardiomyopathy is under‐recognized and may be detrimental alongside its concomitant potential lethal ventricular arrhythmias. This case report illustrates the presentation of heart failure in arrhythmogenic right ventricular cardiomyopathy which was successfully treated with cardiac resynchronization therapy.
OP‐198‐1‐HF (TRACK 9 ‐ HF 2)
Conduction system pacing and left‐sided AVJ ablation in a patient with partial AVCD repair
Basavaraj Sutar; P. Vijay Shekar; C. Sridevi; Chennapragada; Sachin Yalagudri; Muthiah Subramanian; Daljeet Kaur; Calambur Narasimhan Narasimhan
Aig Hospital, Hyderabad, India
Objectives: Conduction system pacing can be an effective alternative to conventional CRT as an adjunct to AVJ ablation.
Materials and Methods: LBB area pacing is emerging as an alternative to conventional cardiac resynchronization therapy (CRT). We report a case with drug‐refractory long‐standing AF successfully treated with AVJ ablation with left bundle branch (LBB) area pacing. The patient presented with refractory AF and progressive worsening of heart failure. The presence of an atrioventricular canal defect (AVCD)—post‐intracardiac repair and a mechanical mitral prosthesis in our patient adds to the complexity of the presentation. Patients with AVCD create a technical challenge for AVJ ablation from the right side. The displaced conduction system poses a challenge for the LBBA pacing a Presence of mechanical prosthesis in the mitral position precludes an antegrade approach to left‐sided AVJ ablation. Hence left‐sided AVJ was performed through a retrograde approach.
Results: Post‐procedure, the patient improved symptomatically. The final QRS duration was 124 ms. TTE after 48 hours showed significant improvement in LV systolic function (Pre discharge EF: 48%). Recovery of LV function is attributed to the control of ventricular rates. The patient had no further hospitalizations for heart failure during the follow‐up period of 6 months.
Conclusion: Heart failure is common in any tachyarrhythmia, AV junction ablation relatively simple and safe procedure that can be done to benefit a specific subset of patients with atrial fibrillation with heart failure.
OP‐199‐1‐HF (TRACK 9 ‐ HF 2)
Pre‐diabetes is associated with increased cardiac events in cancer patients treated with anthracyclines
Iokfai Cheang 1; Kai‐Hang Yiu1; Xinli Li2
1 University of Hong Kong, Queen Mary Hospital, Hong Kong, Hong Kong, China; 2First Affiliated Hospital, Nanjing Medical University, Nanjing, China
Objective: To evaluate the association between pre‐diabetes and cardiovascular events in patients treated with anthracyclines containing chemotherapy (ACT).
Methods: Patients treated with ACT between 2000 and 2019 were divided into diabetes, pre‐diabetes, and normoglycemia groups based on the baseline glycemic status. The primary outcome was the major adverse cardiovascular composite events (MACE) of heart failure hospitalization and cardiovascular death. Kaplan–Meier, multivariable COX regression, and Fine and Gray model analysis were applied.
Results: Among 12,649 patients treated with ACT, 3997 (31.6%, median age 61 years old) had pre‐diabetes and 5622 (44.45%, median age 67 years old) had diabetes at baseline. Over a median follow‐up of 8.7 years, the incidence of MACE was 211 (7.0%) in the normoglycemia group, 358 (9.0%) in the pre‐diabetes group, and 728 (12.9%) in the diabetes group. Compared with the normoglycemia group, both pre‐diabetes (adjusted HR = 1.20, 95%CI 1.01–1.43) and diabetes (adjusted HR = 1.46, 95% CI 1.24–1.70) were significantly associated with an increased risk of MACE. Further analysis showed that there were 475 (18%) progressed to overt diabetes in the pre‐diabetes group after 2 years of the index date and were at greater risk of MACE (Adjusted HR = 1.76, 95% CI 1.31–2.36).
Conclusions: Pre‐diabetes was significantly associated with an increased risk of MACE in patients treated with ACTs. Among, those who progressed to diabetes after 2 years demonstrated an increased risk of MACE. Findings support that pre‐diabetes as a risk factor for cardiovascular events might optimize management.
OP‐200‐1‐HF (TRACK 9 ‐ HF 2)
Characterisation of subsets of Tachycardiomyopathy
Harshad Shah; Raghav Bansal; Yash Lokhandwala
Holy Family Hospital, Bandra, Mumbai, India
Tachycardiomyopathy (TCMP) is a well‐defined entity. TCMP has been classified as pure type and impure type, TCMP may completely recover while those with normal hearts may remain with ventricular dysfunction after control of the tachycardia. This study used a novel classification of TCMP and attempted to identify predictors of future courses at first presentation.
Aims
The study aims to characterize TCMP into 2 clinical groups:
Classic TCMP: Complete reversibility over 12 weeks
Partial TCMP: Partial reversibility over 12 weeks
Material and Methods: Single centre observational study carried out between 2019–2021. Patients presenting with (LVEF<40) suspected secondary to an incessant or frequent arrhythmia were identified. The profiles were recorded before and immediately after tachycardia termination. The patients were followed up at 12 weeks with echocardiography and clinical outcomes, and data was statistically analysed.
Discussion: Totally 55 patients were included in the study over a period of 15 months. Of the 55 patients, Classic TCMP was seen in 30 (55%), 7 (23%) of whom had atrial tachycardia, 13 (43%) had AF, 6 (20%) had atrial flutter and 4 (13%) had VT. Partial TCMP was seen in 25 (45%), 15 (60%) of whom had AF, 3 (12%) had atrial flutter and 7 (28%) had atrial tachycardia. Interestingly, 13 (24%) patients had an initial immediate improvement of LVEF, followed by a variable course. we have defined a novel entity which we have called Exaggerated TCMP.
Conclusion: Classic and Partial TCMP have similar incidences. No robust predictor could be identified to differentiate between these 2 types. We propose a new subgroup of Exaggerated TCMP.
Supporting Documents
Characterisation of subsets of tachycardiomyopathy
Presenting author‐ Shah HP
Co‐authors: Bansal R, Bachani N, Panicker G, Dhirawani B, Lokhandwala YY
Key words: Left ventricular dysfunction, Arrhythmias
Abstract
Introduction: Tachycardiomyopathy (TCMP) is a well‐defined entity, though large‐volume studies documenting the course is scanty. TCMP has been classified as pure type and impure type, based on the absence or presence of structural heart disease respectively. However, patients with structural heart disease and TCMP may completely recover while those with normal hearts may remain with ventricular dysfunction after control of the tachycardia. Hence this study used a novel classification of TCMP and attempted to identify predictors of future courses at first presentation.
Aim
The study aims to characterize TCMP into two clinical groups and study their clinical profiles:
-
2
Classic TCMP: Complete reversibility over 12 weeks
Partial TCMP: Partial reversibility over 12 weeks
Material and Methods: This was an ambispective single‐centre observational study carried out between 2018–2020. Patients presenting with left ventricular dysfunction (LVEF<40) suspected secondary to an incessant or frequent arrhythmia were identified and recruited in the study after an informed consent. Patients who had a similar left ventricular dysfunction preceding the onset of arrhythmia were excluded. The demographic profile, baseline ECG and echocardiographic findings were recorded before and immediately after tachycardia termination. The patients were then followed up at 12 weeks with echocardiography and clinical outcomes. For analysis, the subjects were divided into classic and partial subgroups, which were then compared with respect to different parameters using standard statistical analysis.
Results and Discussion: Totally 55 patients were included in the study over a period of 15 months. The age of the patients was 53.2 ± 11 years; 30 (55%) of the patients were males while 25 (45%) were females. Overall 24 (44%), 26 (47%), and 5 (9%) of the study population presented with NYHA class II, III, and IV symptoms respectively. Of the 55 patients, 27 (49%) had atrial fibrillation, 9 (16.3%) had atrial flutter, 15 (27%) had atrial tachycardia and 4 (13%) had ventricular tachycardia. Medical therapy alone was undertaken in 28 (51%) while catheter ablation was performed in 27 (49%) patients. The baseline LVEF was 0.26 ± 0.6, which increased to 0.5 ± 0.14 at 12 weeks follow‐up (p < 0.0001). Classic TCMP was seen in 30 (55%) of patients, 7 (23%) of whom had atrial tachycardia, 13 (43%) had atrial fibrillation, 6 (20%) had atrial flutter and 4 (13%) had ventricular tachycardia. Partial TCMP was seen in 25 (45%) patients, 15 (60%) of whom had atrial fibrillation, 3 (12%) had atrial flutter and 7 (28%) had an atrial tachycardia. There was no significant differences between the Classic and Partial TCMP groups when compared for age, gender distribution, distribution of arrhythmia, and presence of other comorbidities. Interestingly, 13 (24%) patients had an initial immediate improvement of LVEF, followed by a variable course. This immediate improvement was because of a fallacy in the echocardiographic assessment during the tachycardia, and this subgroup was identified as a novel entity which we have called Exaggerated Tachycardiomyopathy.
Conclusion: Classic and Partial TCMP have similar incidence. No robust predictor could be identified to differentiate between these two types. We propose a new subgroup of Exaggerated Tachycardiomyopathy. Future large studies on these lines are warranted to study the subgroups of Tachycardiomyopathy and further identify predictors of response.

OP‐201‐V‐HF
Identification of potential candidate genes and dysregulated mechanisms of heart failure
Yao Dong Li
Department of Pacing and Electrophysiology, The First Affiliated Hospital of Xinjiang Medical University, Urumqi, China
Background: Heart failure (HF) adversely affects quality of life. This work aims to increase the understanding of the biology of HF in order to identify candidate markers that can provide the most effective diagnosis and treatment.
Methods: Gene expression profiles in HF and non‐failing (NF) samples were collected from GSE116250 and GSE141910. Differentially expressed genes (DEGs) between HF and NF were identified, and common genes were obtained using intersection analysis. Enrichment analysis was performed to identify biological mechanisms underlying HF. Further, candidate genes were screened using the least absolute shrinkage and selection operator (LASSO) analysis. The diagnostic role of candidate genes to predict the occurrence of HF was evaluated by meta‐analysis and ROC curves. In addition, we also utilized xCell to analyze the differences in immune cell infiltration between HF and NF.
Results: A total of 379 common genes were obtained as differentially expressed between HF and NF. Enrichment analysis identified common genes mainly involved in the immune response, Toll‐like receptor signaling pathway. Through the LASSO model, we identified eight candidate genes (PHLDA1, C1QTNF2, SPC24, FNDC1, FREM1, SLC16A9, PLA2G2A, and S1PR3). The meta‐analysis and ROC curve results suggest that the candidate genes are highly sensitive for the diagnosis of HF. Finally, we found that neutrophil, B cell plasma, and Th1 CD4+ T cells were significantly infiltrated in HF.
Conclusion: To identify potential diagnostic and therapeutic candidate genes using gene expression profiling of HF patients. In the future, more efforts are needed to investigate the role of candidate genes in HF.
OP‐209‐1‐PEDS (TRACK 8 ‐ PEDS 1)
Fetal cardiac arrhythmias—A 25‐year experience and evolving trends
Monika Kotecha; Sreekanthan Sundararaghavan; Ming Xu; Kok Wooi Teoh; Jonathan Tze Liang Choo
KK Women's and Children's Hospital, Singapore
Objective: We describe our 25‐year experience in the diagnosis and management of fetal arrhythmia.
Materials and Methods: The fetal cardiac databases were reviewed retrospectively from 1997–2022 and cases of fetal arrhythmias (bradyarrhythmias and tachyarrhythmias) were identified. Epidemiological trends are described. The cases from the last 5 years were compared to those from the preceding 20 years.
Results: 45 cases of fetal arrhythmia were detected in the last 25 years. 18 cases were diagnosed in the last 5 years compared to 27 cases in the preceding 20 years. The commonest fetal cardiac rhythm abnormality detected was premature atrial contractions (n = 23). The next most common fetal cardiac rhythm abnormality was complete heart block (n = 13). 8 fetuses were diagnosed with fetal supraventricular tachycardia (SVT). 4 fetuses with SVT were diagnosed in the last 5 years. Of these, 3 were given transplacental therapy (maternal flecainide n = 2, maternal sotalol n = 1). Rhythm control was achieved in all cases prior to delivery. There was 1 case of fetal ventricular tachycardia that was diagnosed as probable congenital long QTc syndrome. The baby required cardiac pacing and beta‐blockers in the neonatal period.
Conclusion: In the last 5 years, there has been an increase in the diagnostic accuracy of fetal arrhythmia. We have had a good experience with transplacental therapy for fetal SVTs. We have begun to perform maternal CYP2D6 genetic testing and maternal flecainide levels for better risk stratification. Although uncommon, antenatal management and perinatal planning can help improve perinatal outcomes of fetuses with significant arrhythmia.
OP‐211‐1‐PEDS (TRACK 8 ‐ PEDS 1)
Pacing therapy in infants with congenital heart block in a single tertiary centre in Hong Kong
Sit‐Yee Kwok; Ngai Lun Ho; Kin Shing Lun; Rocha Barnabe; Nicholson Yam; Sabrina Tsao; Tak Cheung Yung
Hong Kong Children's Hospital, Kowloon Bay, Hong Kong
Background: Data in pacing therapy in infants with congenital complete heart block are limited.
Methods: All infants diagnosed with congenital complete heart block and aged <1 year at pacemaker implantation from 2006 to 2018 were included. The clinical course was reviewed.
Results: Eight infants were recruited, with a median FU duration of 77.3 months (IQR 35.8–136.2). Two infants (25%) had evidence of low cardiac output, while the rest of them were indicated for pacing therapy either because of asymptomatic extreme bradycardia or wide escape rhythm. The mean age of the first pacemaker implantation was 9.9 days (range 1–38), with a mean escape ventricular rate of 53.8 +/− 6.2 bpm and QRS duration of 76.3 +/− 27.8 milliseconds (ms). Epicardial dual‐chamber pacing system was implanted for all our infants. Two out of three infants with RV pacing developed RV pacing‐induced LV dyssynchrony with ventricular failure at 3 and 6 months, and ventricular function improved after the upgrade to biventricular pacing. All patients with LV basal pacing (2/2) developed ventricular dysfunction at 8 and 9 months, with improvement after reducing the pacing rate. In contrast, all patients with LV apical pacing (2/2) did not develop heart failure. Three patients had the complication of epicardial lead fracture, at a median age of 108 months (range 45–129). The left ventricular end‐diastolic diameter demonstrated a trend of normalization over time.
Conclusion: Five out of eight infants (62.5%) with congenital heart block developed subsequent ventricular dysfunction. LV apex appeared to be the most favourable pacing site.
Supporting Documents

The change in LV dimension (z‐score) in congenital heart block infants after dual‐chamber ventricular pacing.
OP‐212‐1‐PEDS (TRACK 8 ‐ PEDS 1)
Transcatheter ablation in adult congenital heart diseases in single tertiary centre of Hong Kong
Sit‐Yee Kwok 1; Hung Fat Tse2; Tak Cheung Yung1; Ngai Lun Ho1; Jojo Hai2; Sabrina Tsao1
1 Hong Kong Children's Hospital, Kowloon Bay, Hong Kong; 2University of Hong Kong, Pok Fu Lam, Hong Kong
Background: Transcatheter ablation plays a key role in the contemporary management of arrhythmias in patients with adult congenital heart diseases (ACHD).
Methods: A retrospective review of consecutive transcatheter ablation was conducted for all ACHD patients from Jan 2016 to April 2021, in the only tertiary congenital heart centre (Queen Mary Hospital) in Hong Kong.
Results: Twenty‐six ACHD patients (15 male) were identified (mean age 35.9 ± 9.7 years). The graph shows the case‐mix. The only redo procedure was performed for a ccTGA patient with five identifiable arrhythmic mechanisms. A total of 68 arrhythmia mechanisms was found, with intra‐atrial reentrant tachycardia (IART) being the predominant subtypes (48.5%), followed by focal atrial tachycardia (FAT) (13.2%). There was a median of 2 arrhythmia mechanisms per ACHD patient (range: 1–5). CTI‐dependent IART comprised of 45.5% of mappable IART. There was a total of 24 AT, 2 AF, 4 pathway/AVNRT, 2 PVC ablations. The median follow‐up time was 23.8 months (IQR: 15.7–35.4 months). For AT ablations, the overall success rate was 87.5%, with at least one of the ATs ablated. In 62.5% of patients, there was no inducible AT at the end of the procedure. No major complications were found. The recurrence rate was 34.6% with the median time of recurrence 5.4 months (IQR: 1.7–8.2 months) post‐ablation. Acute success rate was 100% for non‐atrial tachyarrhythmia with no recurrence.
Conclusion: Multiple atrial arrhythmia mechanisms are common in ACHD patients. Reentrant atrial tachyarrhythmia is the predominant mechanism, and transcatheter ablation had a good acute success rate.
Supporting Documents

OP‐214‐1‐PEDS (TRACK 8 ‐ PEDS 1)
Clinical outcome of non‐fluoroscopic radiofrequency ablation in pediatric atrioventricular nodal reentrant tachycardia
Chieh‐Mao Chuang 1,2; Pi‐Chang Lee1; Yun‐Ching Fu1; Yu‐Cheng Hsieh3; Ming‐Chih Lin1; Cheng‐Hung Li3; Chi‐Jen Weng3; Sheng‐Lin Jan1; Shang‐Ju Wu3; Shih‐Ann Chen3
1 Division of Pediatric Cardiology, Children's Medical Center, Taichung Veterans General Hospital, Taichung City, Taiwan; 2Division of Cardiology, Asia University Hospital, Asia University, Taichung City, Taiwan; 3Divison of Electrophysiology, Cardiovascular Center, Taichung Veterans General Hospital, Taichung City, Taiwan
Objective: The goal of this study was to investigate the clinical outcome of nonfluoroscopic RF ablation for AVNRT in pediatric patients.
Materials and Methods: We retrospectively enrolled consecutive pediatric patients with AVNRT received RF catheter ablation guided by nonfluoroscopic intracardiac navigation system (X‐ group) or fluoroscopic system (X+ group) from multi‐centers from 2011 to 2022. We compared the rate of acute success, complication, and recurrence. Procedure time and RF time were also evaluated between groups.
Results: A total of 78 patients were enrolled with X+ group of 45 children and X‐ group of 34 children. The median procedure time was 115 mins (IQR: 92.5–145 mins) in X+ group and 110.5 mins (95–136 mins) in X‐ group (p = 0.98). The median fluoroscopic time was 24.1 mins (15.1–36.9 mins) in X+ group, while no fluoroscopy use in X‐ group (p < 0.001). No advanced AV block was noted in both groups. Acute procedure success rate was 97.8% in X+ group and 100% in X‐ group (p = 1.0). Longer follow‐up duration in X+ group (97 months vs 18.5 months, p < 0.001). Recurrence rate was 9.1% in X+ group and 2.9% in X‐ group (p = 0.38). No significant difference in arrhythmia‐free survival between groups was revealed (p = 0.48).
Conclusion: Combining intracardiac navigation system and RF ablation can allow non‐fluoroscopic slow pathway ablation for AVNRT in pediatric patients with similar procedure time comparing with fluoroscopic guide RF ablation. Fluoroless RF slow pathway ablation in pediatric patients is safe and effective at mid‐term follow‐up.
Supporting Documents


OP‐215‐1‐PEDS (TRACK 8 ‐ PEDS 2)
Genetic make up among children with suspected long QT syndrome in National Heart Institute
Yazmin Yusoff Azudin; M. Hasri Samion; Marhisham Che Mood; Boekhren Karyostyko; Mathan Mohan Munusamy
National Heart Institute, Kuala Lumpur, Malaysia
Objective: Long QT syndrome (LQTS) is characterized by prolonged QT interval that potentially leads to fatal cardiac events. In order to diagnose it correctly, genetic testing plays an important role in determining the presence of Long QT genes, especially in asymptomatic borderline QT interval patients. Our objective is to identify the genetic makeup of all patients who are suspected with LQTS based on Schwartz criteria and associated signs and symptoms.
Method: All patients seen in the arrhythmia clinics with suspected LQTS and structurally normal heart were recruited. Patients and first degree family members were counselled and consented. All related clinical history data were collected and blood samples were acquired and were sent to the reference laboratory for genetic testing.
Results: A total of 30 patients were identified with suspected LQTS. 1 patient was excluded because of incomplete clinical data. Table 1 result depicts that all suspected LQTS patients either with or without sign and symptoms have prolonged QTc intervals. Table 2 depicts 14 patients with confirmed LQTS with specific genes expressed presented with significant fatal sign and symptoms and these patients generally inherit the genes from either one of their parents screened via genetic testing.
Conclusion: Suspected LQTS patients with prolong QTc intervals does not necessarily present with sign and symptoms as compared to the confirmed LQTS patients from this study. A larger patients cohort is required to further analyze the genetic makeup, especially in the suspected LQTS group that does not present with specific LQTS genes.
Supporting Documents
TABLE 1 Signs and symptoms in patients with suspected Long QT syndrome in relation to the QTc values
| Signs & Symptoms | Y/N | N | QTc (mean ± SD) |
|---|---|---|---|
| Bradycardia | Y | 14 | 500.36 ± 57.53 |
| N | 15 | 503.13 ± 58.65 | |
| Syncope | Y | 9 | 538.44 ± 51.20 |
| N | 20 | 485.30 ± 52.69 | |
| Heart Failure | Y | 2 | 549.50 ± 27.58 |
| N | 27 | 498.26 ± 57.38 | |
| VT/VF | Y | 8 | 526.88 ± 70.64 |
| N | 21 | 492.24 ± 49.68 | |
| Cardiomyopathy | Y | 4 | 506.75 ± 67.55 |
| N | 25 | 501.00 ± 56.80 |
TABLE 2 Confirmed case of Long QT Syndrome patients in relation to the QTc values with fatal sign and symptoms presentation
| N (patients) | Genotype | Type of long QT | QTc duration | Bradycardia | Syncope | VT/VF |
|---|---|---|---|---|---|---|
| 4 | KCNQ1 | Long QT 1 | >460 ms | ‐ | 2 | 2 |
| 2 | KCNH2 | Long QT 2 | 1 | 2 | ‐ | |
| 3 | SCN5A | Long QT 3 | 1 | ‐ | 1 | |
| 2 | CACNA1C | Long QT 8 | 1 | 1 | ‐ | |
| 3 | KCNJ5 | Long QT 13 | 2 | ‐ | 1 |
OP‐216‐1‐PEDS (TRACK 8 ‐ PEDS 2)
Atrioventricular reentrant tachycardia in infant with ccTGA: Finding the proper anti‐arrhythmic regimen for recurrent tachyarrhythmia
Mochamad Faisal Adam 1,2; Yovi Kurniawati1,2; Dicky Armein Hanafy1,2; Oktavia Lilyasari1,2
1 National Cardiovascular center Harapan Kita, Jakarta, Indonesia, Jakarta, Indonesia; 2Department of Cardiology and Vascular Medicine Faculty of Medicine Universitas Indonesia, National Cardiovascular Centre Harapan Kita, Jakarta, Indonesia
Introduction: Congenitally corrected transposition of the great arteries (ccTGA) is a rare cardiac malformation characterized by the combination of discordant atrioventricular and ventriculoarterial connections (AV‐VA discordance). Arrhythmia such as high degree AV block, AV node re‐entry tachycardia (AVNRT) are commonly found in ccTGA, but rarely, atrioventricular reentrant tachycardia (AVRT) because of the presence of accessory pathway (AP) might be found. Catheter ablation is the definite treatment for terminating AVRT. Nevertheless, ablation may not always be feasible especially in infants and in developing countries such as Indonesia.
Case Description: A 6‐month‐old baby came to the emergency room with sudden palpitation. ECG showed narrow regular QRS tachycardia with rate of 234 bpm. After successful cardioversion, ECG showed Wolf‐Parkinson‐White (WPW) pattern suggesting left‐lateral AP. Echocardiography examination revealed situs solitus, AV‐VA discordance (ccTGA), and secundum ASD. As a result of recurrent AVRT and inability to perform catheter ablation, the patient was given anti‐arrhythmic drugs consisting of adenosine, bisoprolol, digoxin, and amiodarone IV subsequently switched to oral regimen. After tachycardia termination for four days, patient was discharged with oral amiodarone 6 mg/kg (25 mg b.i.d.) and bisoprolol 4 mg/kg (2.5 mg o.d.) after one month of hospitalization.
Conclusion: We present a rare case of AVRT because of WPW syndrome of left lateral AP in ccTGA. As a result of the limited facility to perform percutaneous or open‐chest ablation of AP, optimal anti‐arrhythmic management should be the first‐line therapy to prevent the recurrence of AVRT.
Keywords: Atrioventricular Reentrant Tachycardia, WPW syndrome, Congenitally Corrected Transposition of Great Arteries, Anti Arrhythmic Agent, Catheter Ablation.
Supporting Documents
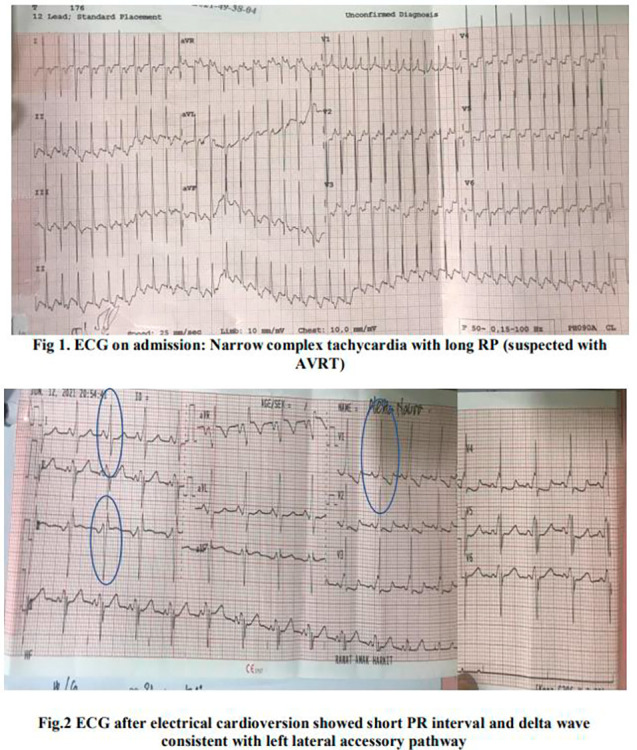

OP‐217‐1‐PEDS (TRACK 8 ‐ PEDS 2)
Initial P‐wave deflection and the risk of arrhythmia in Heterotaxy syndrome: A retrospective single‐center study
Mochamad Faisal Adam 1; Theresia Sri Rezeki Sembiring1; Dony Yugo Hermanto1,2; Aditya Agita Sembiring1,3; Dicky Armein Hanafy1,2; Sunu Budhi Raharjo1,2; Yoga Yuniadi1,2
1 National Cardiovascular center Harapan Kita, Jakarta, Indonesia; 2Division of Arrhythmia, National Cardiovascular Center Harapan Kita, Jakarta, Indonesia; 3Division of Pediatric Cardiology and Congenital Heart Disease, National Cardiovascular Center Harapan Kita, Indonesia
Objectives: To present initial P‐wave deflection (IPWD) as a representation of probable sino‐atrial (SA) node location and its association with arrhythmia in heterotaxy syndrome (HS).
Materials and Methods: A retrospective single‐center study was conducted involving HS patients admitted from 2017–2022. HS was diagnosed by trans‐thoracal echocardiography (TTE) performed by our pediatric cardiologists. Only preoperative ECGs were analyzed including any ECGs showing arrhythmias. IPWD was divided into four quadrants based on IPWD at lead I and aVF (positive or negative): right superior (RS): positive I and positive aVF; left superior (LS): negative I and positive aVF; right inferior (RI): positive I and negative aVF; left inferior (LI): negative I and negative aVF.
Results: A total of 142 patients consisting of 52.1% male and 60.6% right atrial (RA) isomerism were identified. As many as 21.1% patients had documented arrhythmia which was more prevalent in LA‐ than RA isomerism (26.8% vs 17.4%, p < 0.001). In RA isomerism, IPWD were predominantly from the upper quadrant (RS 58.2% vs LS 29.1%). However, in LA isomerism, IPWD were evenly distributed (RS 27.8% vs RI 37% vs LS 14.8 vs LI 12%). SA nodes at the lower quadrant were associated with higher occurrences of arrhythmia (OR 4875; 95% CI: 1.83‐12.98, p < 0.01) specifically RI SA‐nodes in subgroup analysis (OR 3.19; 95% CI: 1.16‐8.87, p < 0.026).
Conclusion: IPWD in RA isomerism is mostly from the upper quadrant while it is evenly distributed in LA isomerism. IPWD from lower quadrants, especially at RI, was associated with higher occurrences of arrhythmia.
OP‐218‐1‐PEDS (TRACK 8 ‐ PEDS 2)
Cross‐sectional study of neurodevelopmental disorders in patients with catecholaminergic polymorphic ventricular tachycardia
Yoko Yoshida
Division of Pediatric Electrophysiology, Osaka City General Hospital, Osaka, Japan
Objective: In 2019, a multicenter international study reported that 8% of patients with CPVT1 have intellectual disability (ID). However, this study may have underestimated the prevalence because the study included individuals who demonstrated apparent intellectual disability. We examined the prevalence of ID in a cross‐sectional survey.
Methods: We included patients with symptomatic CPVT1 and excluded those with severe mental and physical disabilities because of ischemic brain injury. Between Jan 2021 and Apr 2022, we obtained information from medical records and examined an intelligence test (WISC‐4 or WAIS ‐4) and brain imaging.
Results: Of 13 patients with CPVT, one patient was excluded; 8/12 (67%) were male; age at initial cardiac symptom was 4.8 (4.0–7.5) years, age at diagnosis was 8.5 (4.9–13.4) years, age at investigation was 19.5 (16.1–20.3) years old. Intelligence test was performed in 10/12 (84%), with full‐scale IQ of 73 (60–89) and FSIQ <70 in 5/10 (50%). Two patients who refused intelligence test had already had the issued intellectual disability certificates. Overall, 7/12 (58%) were estimated to have ID. Brain imaging was performed on 8/10 (80%) and showed old brain damage in one patient with ID, but this patient had been diagnosed with a developmental delay before the cardiac event.
Conclusion: The prevalence of neurodevelopmental disorders in CPVT patients may be higher than previously reported.
Supporting Documents

OP‐219‐1‐PEDS (TRACK 8 ‐ PEDS 2)
Forward‐solution computational ECG mapping for ventricular arrhythmias in patients with adult congenital heart disease
Sutton Fox1; Frederick Han1; Gordon Ho2; Avinash Toomu1; Kevin Sung1; Kurt Hoffmayer1; Jonathan Hsu1; Farshad Raissi1; Andrew McCulloch1; Gregory Feld1; David Krummen 1
1 University of California San Diego, San Diego, United States; 2VA San Diego Healthcare System, San Diego, United States
Objective: Forward solution ECG mapping has demonstrated effective source localization in patients with ischemic and non‐ischemic cardiomyopathy. Accuracy in patients with adult congenital heart disease (ACHD) is unknown. We hypothesized that forward solution mapping for PVC and VT ablation in patients with ACHD is feasible with good spatial and anatomical resolution.
Materials and Methods: We enrolled consecutive ACHD patients undergoing PVC and VT ablation between 2020–2022. Successful VT and PVC ablation locations were marked on a 3‐dimensional cardiac model. ECGs of clinical arrhythmias were analyzed using the forward solution algorithm to generate heatmaps of probable source locations. Regional (free wall versus septal), segmental, center‐to‐center spatial, and right versus left ventricular accuracy were assessed compared to the site of successful ablation.
Results: Six patients (38 years [35–48], EF 61% [56–64], female = 4) were enrolled. Patients had prior surgical intervention in the RV (67%) and LV (17%). Ten ablation sites were analyzed; the most common were RV apex (30%), moderator band (20%), and LV outflow tract (20%). Regional and segmental mapping outputs were accurate for all arrhythmias (10/10, 100%). Spatial accuracy was 13.5 mm ([7.5–15.75]; Wilcoxon p < 0.05). Right versus left ventricular accuracy was suboptimal in 2 subjects with double‐outlet right ventricle and Williams Syndrome.
Conclusion: Forward solution ECG mapping demonstrated accurate source localization in ACHD. Suboptimal right versus left chamber accuracy may reflect abnormal electrical activation in ACHD. Additional studies are required to determine whether arrhythmia simulation libraries specific to ACHD may improve mapping results.
OP‐221A‐V‐PEDS
Is there a correlation between severities of morphological abnormality and accessory pathways in Ebstein's anomaly
Yajnik Kumble; Neeta Bachani; Raghav Bansal; Harshad Shah; Yash Lokhandwala
Holy Family Hospital, Mumbai, Mumbai, India
Background: Ebstein's anomaly (EA) is associated with arrhythmias in about 50% cases, especially related to accessory pathways (Aps). There is no information whether the severity of this electrical abnormality correlates with that of the anatomic defect.
Method: A single‐centre observational study conducted over a period of 2 years. Consecutive patients with Ebstein's anomaly and APs undergoing electrophysiology (EP) study were included. Demographic parameters, clinical characteristics, electrocardiographic diagnosis, echocardiographic parameters, electrophysiological parameters, and outcomes of catheter ablation were recorded.
Results: Twenty‐six subjects (14 males) were included. The age was 28 ± 14 years. Three patients had syncope. All 26 patients had right‐sided APs. 14 (55%) patients had baseline pre‐excitation. EP study revealed a single AP in 19 patients, 2 APs in 6 patients, and 3 APs in 1 patient. Right inferoparaseptal was the most common location of AP (55%). Mahaim‐type AP was noted in 5 patients and 4 patients had associated atrial fibrillation. Twelve of the manifest APs were deemed high risk with an effective refractory period (ERP) less than 250 ms. We created an EP score (based on syncope, need for cardioversion, pre‐excited tachycardia, multiple APs, associated arrhythmias, and ablation success) and an echocardiographic score (based on tricuspid valve displacement, tethering, annular dilatation, tricuspid regurgitation severity, severity of right atrial, and ventricular volume overload and right ventricular dysfunction). However, there was no correlation between the 2 scores.
Conclusion: Among Ebstein's anomaly with APs, all were right‐sided. There was no correlation between the EP and Echo scores of severity.
Supporting Documents
STUDY OF ARRHYTHMIAS AND ELECTROPHYSIOLOGICAL CHARACTERISTICS IN RELATION TO ECHOCARDIOGRAPHIC SEVERITY IN EBSTEINS ANOMALY
Authors—Kumble YM, Bachani NS, Shah HP, Bansal R, Lokhandwala Y
Background: Ebstein anomaly (EA) is a rare congenital heart disease with an incidence of 1 in 200,000 live births. The cardinal features of EA are the apical displacement and tethering of the tricuspid leaflets (TL) with enlarged right heart chambers, associated atrial septal defect (ASD), and arrhythmogenic potential of the diseased right ventricle (RV) especially presence of accessory pathways (AP), Wolf Parkinson White (WPW), atrial fibrillation (AF) and ventricular arrhythmias.
The clinical course of EA range from intra‐uterine death to asymptomatic survival into late adulthood. The outlook for fetal EA is deemed appalling. Neonates have a less adverse outcome even though only 50% survive to 5 years, while adults present with arrhythmic events that decline survival rate regardless of the severity of EA. The frequency of AP range from 10 to 44% with a sizeable percentage having multiple AP. Electrophysiological (EP) evaluation and treatment can be challenging because of the distorted anatomical landmarks.
Egbe A et al, in their study found that outcomes of catheter ablation during preoperative EP study were comparable to surgical arrhythmia therapy.
Wei W et al in their study noted a predominance of right‐sided AP location in the lower half of the tricuspid annulus (TA), with about 30% of them having multiple AP.
Similarly, in a study by Alizadeh A et al, the most common location of AP was the right posterolateral (RPL) region. They reasoned that all patients with EA should undergo EP study as they formed a critical component in management of patients with EA, a recommendation echoed uniformly across multiple studies and case report analysis.
The literature thus far has emphasized on routine EP evaluation of patients with EA because of a myriad of arrhythmic possibilities, treatment of which can significantly alter the clinical outcome.
Objectives/hypothesis:
-
3
To study EP parameters specifically in relation to number and location of AP.
To study the severity of arrhythmias in terms of hemodynamic instability, number of recurrences and number of pathways.
To devise a scoring system for the electrical abnormality.
To devise a new scoring system for echocardiographic severity.
To see if a correlation exists between our electrical score and the existing (GOSE, Carpentier, Celermajor) standardized scores.
Methods: Design of study: Part Prospective part retrospective observational study.
Inclusion Criteria: Patients with EA who undergo electrophysiology study and catheter ablation.
Exclusion Criteria: Patients who have undergone corrective surgery for EA.
Echocardiographic score was designed and scored based on the displacement and tethering of anterior, posterior and septal TL, TA diameter, severity of TV regurgitation, right atrial and RV volume overload and presence of RV Dysfunction, with a total score amounting to 17.
The EP scoring included historical data of syncope, patients warranting DC shock, and a documented pre‐excited tachycardia. The EP data included number of AP, associated AVNRT or atrial tachycardia, antegrade ERP of AP less than 250 and previous ablation failure. Each of the parameters score one point with a total amounting to 12.
Statistical analysis of the data was carried out with SPSS. A Confidence level of more than 95% was considered statistically significant (p < 0.05).
Results and Discussion: Of the 26 patients, 55% were males and 45% were females. The mean age of our cohort was 28+/− 14 years. 10% of patients had a history of syncope at presentation. 55% had a pre‐excited tachycardia, 45% had a concealed AP. 45% had an antegrade ERP of less than 250 ms.
During EP study, all of our patients had a right‐sided AP. This conforms to the established reports from previous studies. Presence of multiple AP in EA is not uncommon. 25% of the patients had multiple AP, with one patient having 3 AP, while 75% had a single AP. We found the right postero‐septal region (55%) to be the predominant AP location, with right postero‐lateral (RPL) location seen in half of our study cohort, either singly or accompanying multiple AP. 20% of the patients had a Mahaim pathway. 15% patients had an associated AF.
50% had either the septal or the posterior TL displaced apically while the other half had both leaflets displaced. Tethering of the anterior TL was seen. Near equal thirds of our patient had mild, moderate or severe grade of tricuspid valve regurgitation, 10% had quantifiable RV dysfunction. 30% had an associated ASD.
The highest standardized GOSE grade seen in our cohort was grade 2 (45%). The highest EP score attained was 5 (10%), while the rest majority falling in the score bracket of one and four (35% each). The maximum echocardiographic score attained was 13 (10%, severe grade), while the vast majority had a moderate grade EA as tabulated with our scoring system.
We did not find a statistically significant association between the location of AP and presence of syncope or pre‐excitation, or between the location of the AP and the number of displaced TL. We found no correlation between the total EP score and the standardized GOSE score, and our Echo score. We also could not find a correlation between our echo and EP score on preliminary analysis. Although on further study of the data, we found a positive correlation between the variables of the standardized GOSE score and the EP and Echo score.
This suggests that additional data may help bring to light a strong correlation between the grading systems, so as to extrapolate evidence and assemble meaningful recommendations, with the aim to improve outcome in EA.
Conclusion: With current data leaning toward routine EP evaluation in EA, we find that to be prudent and constructive. The structural configuration of EA serves as a prelude to arrhythmia, with appearance of first symptoms in some occurring as late as early adulthood. Well‐timed management of arrhythmias can effect desirable long‐term outcomes.
Also, the EP evaluation was carried out by a single electrophysiologist to maintain continuity in observations of characteristics in EA.
Limitations
Our study is limited by its sample size.
Nonetheless, this study serves to deliver insights, make reasonable assumptions and provide a framework to further our knowledge about this disease entity.
The Coronavirus pandemic has been a deterrent in the accrual of patients with this rare abnormality.
The echocardiographic observations were not blinded to account for intra‐observer variability.
References
Delhaas T, Sarvaas GJ, Rijlaarsdam ME, Strengers JL, Eveleigh RM, Poulino SE, et al. A multicenter, long‐term study on arrhythmias in children with Ebstein anomaly. Pediatr Cardiol. 2010;31(2):229–33.
Keith JD, Rowe RD, Vlad P. Heart Disease in Infancy and Childhood. New York, NY: Macmillan Co; 1958.
Perloff J, Marelli A. Perloff's Clinical Recognition Of Congenital Heart Disease. Philadelphia, PA: Elsevier/Saunders; 2012.
Correa‐Villasenor A, Ferencz C, Neill CA, Wilson PD, Boughman JA, For the Baltimore‐Washington Infant Study Group. Ebstein's malformation of the tricuspid valve: genetic and environmental factors. Teratology. 1994; 50:137–147.
Frescura C, Angelini A, Daliento L, Thiene G. Morphological aspects of Ebstein's anomaly in adults. Thorac Cardiovasc Surg. 2000;48:203–208.
Edwards WD. Embryology and pathologic features of Ebstein's anomaly. Prog Pediatr Cardiol. 1993;2:5–15.
Mann RJ, Lie JT. The life story of Wilhelm Ebstein (1836–1912) and his almost overlooked description of a congenital heart disease. Mayo Clin Proc. 1979;54:197–204.
van Son JA, Konstantinov IE, Zimmermann V. Wilhelm Ebstein and Ebstein's malformation. Eur J Cardiothorac Surg. 2001;20:1082–1085.
Yater WM, Shapiro MJ. Congenital displacement of the tricuspid valve (Ebstein's disease): review and report of a case with electrocardiographic abnormalities and detailed histologic study of the conduction system.
Attie F, RosasM, Rijlaarsdam M, Buendia A, Zabal C, Kuri J et al.The adult patient with Ebstein anomaly—outcome in 72 unoperated patients. Medicine 2000;79:27–36.
Vermeer AM, van Engelen K, Postma AV, Baars MJ, Christiaans I, De Haij S, et al. Ebstein anomaly associated with left ventricular noncompaction: an 18. autosomal dominant condition that can be caused by mutations in MYH7. Am J Med Genet C: Semin Med Genet. 2013;163C:178–84.
Chauvaud S, Berrebi A, d'Attellis N, Mousseaux E, Hernigou A, Carpentier A. Ebstein's anomaly: repair based on functional analysis. Eur J Cardiol Thorac Surg 2003:525–31.
Wei W, Zhan X, Xue Y et al. Features of accessory pathways in adult Ebstein's anomaly. Europace. 2014;16(11):1619–1625. doi:10.1093/europace/euu028
Attenhofer Jost CH, Connolly HM, Dearani JA, Edwards WD, Danielson GK. Ebstein's anomaly. Circulation. 2007 Jan 16;115(2):277–85. doi: 10.1161/CIRCULATIONAHA.106.619338. PMID: 17228014.
Edwards WD. Embryology and pathologic features of Ebstein's anomaly. Prog Pediatr Cardiol. 1993;2:5–15.
Hebe J. Ebstein's anomaly in adults: arrhythmias: diagnosis and therapeutic approach. Thorac Cardiovasc Surg. 2000;48:214–219.
Attenhofer Jost C, Connolly H, Scott C, Burkhart H, Warnes C, Dearani J. Outcome of Cardiac Surgery in Patients 50 Years of Age or Older With Ebstein Anomaly. J Am Coll Cardiol. 2012;59(23):2101–2106.
Chung J, Goo H, Im Y et al. One and a Half Ventricle Repair in Adults: Postoperative Hemodynamic Assessment Using Phase‐Contrast Magnetic Resonance Imaging. Ann Thorac Surg. 2011;92(1):193–198.
Sirivella S, Gielchinsky I. Surgery of the Ebstein's Anomaly: Early and Late Outcomes. J Card Surg. 2011;26(2):227–233.
Lange R, Burri M, Eschenbach L et al. Da Silva's cone repair for Ebstein's anomaly: effect on right ventricular size and function. European Journal of Cardio‐Thoracic Surgery. 2014;48(2):316–321. doi:10.1093/ejcts/ezu472
Huang CJ, Chiu IS, Lin FY, Chen WJ, Lin JL, Lo HM, et al. Role of electrophysiological studies and arrhythmia intervention in repairing Ebstein's anomaly. Thorac Cardiovasc Surg. 2000;48:347–50.
Cappato R, Schluter M, Weiss C, Antz M, Koschyk DH, Hofmann T, et al. Radiofrequency current catheter ablation of accessory atrioventricular pathways in Ebstein's anomaly. Circulation. 1996;94:376–83.
Vogel M, Marx GR, Tworetzky W, Cecchin F, Graham D, Mayer JE, et al. Ebstein's malformation of the tri‐ cuspid valve: short‐term outcomes of the “cone pro‐ cedure” versus conventional surgery. Congenit Heart Dis. 2012;7:50–8.
Celermajer DS, Bull C, Till JA, et al. Ebstein's anomaly: presentation and outcome from fetus to adult. J Am Coll Cardiol. 1994;23(1):170–176.
Flores Arizmendi A, Fernández Pineda L, Quero Jiménez C, et al. The clinical profile of Ebstein's malformation as seen from the fetus to the adult in 52 patients. Cardiol Young. 2004;14(1):55–63. doi:10.1017/s1047951104001106
Ammash NM, Warnes CA, Connolly HM, Danielson GK, Seward JB. Mimics of Ebstein's anomaly. Am Heart J. 1997;134:508–13.
Muraru D, Badano LP, Sarais C, Solda E, Iliceto S. Evaluation of tricuspid valve morphology and func‐ tion by transthoracic three‐dimensional echocardi‐ ography. Curr Cardiol Rep. 2011;13:242–9.
Bharucha T, Anderson RH, Lim ZS, Vettukattil JJ. Multiplanar review of three‐ dimensional echocardiog‐ raphy gives new insights into the morphology of Ebstein's malformation. Cardiol Young. 2010;20:49–53.
Carpentier A, Chauvaud S, Macé L et al. A new reconstructive operation for Ebstein's anomaly of the tricuspid valve. J Thorac Cardiovasc Surg. 1988;96(1):92–101.
Smith WM, Gallagher JJ, Kerr CR, Sealy WC, Kasell JH, Benson DW Jr, Reiter MJ, Sterba R, Grant AO. The electrophysiologic basis and management of symptomatic recurrent tachycardia in patients with Ebstein's anomaly of the tricuspid valve. Am J Cardiol. 1982;49:1223–1234.
Sherwin ED, Triedman JK, Walsh EP. Update on interventional electrophysiology in congenital heart disease: evolving solutions for complex hearts. Circ Arrhythmia Electrophysiol. 2013;6:1032–40.
Park S, Chung S, On Y et al. Fragmented QRS Complex in Adult Patients With Ebstein Anomaly and Its Association With Arrhythmic Risk and the Severity of the Anomaly. Circulation: Arrhythmia and Electrophysiology. 2013;6(6):1148–1155. doi:10.1161/circep.113.000636
Egbe A, Yogeswaran V, Connolly H. Outcome of preoperative electrophysiology study in patient with Ebstein anomaly. J Am Coll Cardiol. 2017;69(11):617. doi:10.1016/s0735‐1097(17)34006‐8.
Kastor J, Goldreyer B, Josephson M et al. Electrophysiologic characteristics of Ebstein's anomaly of the tricuspid valve. Circulation. 1975;52(6):987–995. doi:10.1161/01.cir.52.6.987
Arya P, Beroukhim R. Ebstein Anomaly: Assessment, Management, and Timing of Intervention. Curr Treat Options Cardiovasc Med. 2014;16(10). doi:10.1007/s11936‐014‐0338‐x
Alizadeh A, Heiadarli M, Khajali Z, Lavaf SR. Electrophysiological Study Characteristics in Patients With and Without Ebstein Anomaly With Accessory Pathway. Clinic Cardia Electrophysiology. 2016 February; 1(1):e5517
Khositseth A, Danielson G, Dearani J, Munger T, Porter C. Supraventricular tachyarrhythmias in Ebstein anomaly: Management and outcome. ACC Current Journal Review. 2005;14(4):61.
Oliveira L, Freitas A, Mehta N, Ortiz M, Mulinari L, Cunha C. Electrophysiological Study in Ebstein's Anomaly With no Evidence of Accessory Pathway. Arq Bras Cardiol. 2014.
Walsh E. Interventional Electrophysiology in Patients with Congenital Heart Disease. Circulation. 2007;115(25):3224–3234. doi:10.1161/circulationaha.106.655753.
Dearani J, Danielson G. Congenital Heart Surgery Nomenclature and Database Project: Ebstein's anomaly and tricuspid valve disease. Ann Thorac Surg. 2000;69(3):106–117. doi:10.1016/s0003‐4975(99)01265‐5
ROTEN L, LUKAC P, DE GROOT N et al. Catheter Ablation of Arrhythmias in Ebstein's Anomaly: A Multicenter Study.J Cardiovasc Electrophysiol. 2011;22(12):1391–1396. doi:10.1111/j.1540‐8167.2011.02161.x
Kiernan T, Fahy G. Multiple accessory pathways, dual AV nodal physiology, non‐ compacted myocardium and patent foramen ovale in a patient with Ebstein's anomaly: Report of a case. Int J Cardiol. 2007;114(3):412–413. doi:10.1016/j.ijcard.2005.11.090
Danielson G, Driscoll D, Mair D, Warnes C, Oliver W. Operative treatment of Ebstein's anomaly. J Thorac Cardiovasc Surg. 1992;104(5):1195–1202. doi:10.1016/s0022‐5223(19)34605‐7
Brickner M, Hillis L, Lange R. Congenital Heart Disease in Adults. New England Journal of Medicine. 2000;342(5):334–342. doi:10.1056/nejm200002033420507
Tables
| Age | |||||
|---|---|---|---|---|---|
| Frequency | Percent | Valid percent | Cumulative percent | ||
| Valid | 4 | 1 | 4.0 | 4.0 | 4.0 |
| 5 | 1 | 4.0 | 4.0 | 8.0 | |
| 8 | 1 | 4.0 | 4.0 | 12.0 | |
| 13 | 1 | 4.0 | 4.0 | 16.0 | |
| 15 | 1 | 4.0 | 4.0 | 20.0 | |
| 16 | 2 | 7.0 | 7.0 | 27.0 | |
| 17 | 1 | 4.0 | 4.0 | 31.0 | |
| 21 | 1 | 4.0 | 4.0 | 35.0 | |
| 22 | 1 | 4.0 | 4.0 | 39.0 | |
| 27 | 1 | 4.0 | 4.0 | 43.0 | |
| 28 | 1 | 4.0 | 4.0 | 47.0 | |
| 32 | 3 | 12.0 | 12.0 | 59.0 | |
| 33 | 1 | 4.0 | 4.0 | 63.0 | |
| 34 | 2 | 7.0 | 7.0 | 70.0 | |
| 36 | 2 | 7.0 | 7.0 | 77.0 | |
| 40 | 3 | 11.0 | 11.0 | 88.0 | |
| 46 | 1 | 4.0 | 4.0 | 92.0 | |
| 51 | 1 | 4.0 | 4.0 | 96.0 | |
| 53 | 1 | 4.0 | 4.0 | 100.0 | |
| Total | 26 | 100.0 | 100.0 | ||
| Gender | |||||
|---|---|---|---|---|---|
| Frequency | Percent | Valid percent | Cumulative percent | ||
| Valid | Female | 12 | 46.0 | 46.0 | 46.0 |
| Male | 14 | 54.0 | 54.0 | 100.0 | |
| Total | 26 | 100.0 | 100.0 | ||
| Syncope | |||||
|---|---|---|---|---|---|
| Frequency | Percent | Valid percent | Cumulative percent | ||
| Valid | No | 23 | 88.0 | 88.0 | 88.0 |
| Yes | 3 | 12.0 | 12.0 | 100.0 | |
| Total | 26 | 100.0 | 100.0 | ||
| Pre_excited_tachy | |||||
|---|---|---|---|---|---|
| Frequency | Percent | Valid percent | Cumulative percent | ||
| Valid | No | 9 | 35.0 | 35.0 | 35.0 |
| Yes | 17 | 65.0 | 65.0 | 100.0 | |
| Total | 26 | 100.0 | 100.0 | ||
| Acce_pathway | |||||
|---|---|---|---|---|---|
| Frequency | Percent | Valid percent | Cumulative percent | ||
| Valid | 1RPL | 6 | 23.0 | 23.0 | 23.0 |
| 1MP | 4 | 15.0 | 15.0 | 38.0 | |
| 1RPS | 10 | 38.0 | 38.0 | 76.0 | |
| 2RPS | 2 | 8.0 | 8.0 | 84.0 | |
| 3RPS, RPL, MP | 1 | 4.0 | 4.0 | 88.0 | |
| 1RPS/RPL | 1 | 4.0 | 4.0 | 92.0 | |
| 2RPS, RPL | 2 | 8.0 | 8.0 | 100.0 | |
| Total | 26 | 100.0 | 100.0 | ||
| Numb_Acc_pathway | |||||
|---|---|---|---|---|---|
| Frequency | Percent | Valid percent | Cumulative percent | ||
| Valid | 1 | 19 | 73.0 | 73.0 | 73.0 |
| 2 | 6 | 23.0 | 23.0 | 96.0 | |
| 3 | 1 | 4.0 | 4.0 | 100.0 | |
| Total | 26 | 100.0 | 100.0 | ||
| Assoc_avnrt | |||||
|---|---|---|---|---|---|
| Frequency | Percent | Valid percent | Cumulative percent | ||
| Valid | No | 25 | 96.0 | 96.0 | 96.0 |
| Yes | 1 | 4.0 | 4.0 | 100.0 | |
| Assoc_artial_arrhy | |||||
|---|---|---|---|---|---|
| Frequency | Percent | Valid percent | Cumulative percent | ||
| Valid | No | 22 | 85.0 | 85.0 | 85.0 |
| Yes | 4 | 15.0 | 15.0 | 100.0 | |
| Total | 26 | 100.0 | 100.0 | ||
| ERP_lessthan_250 ms | |||||
|---|---|---|---|---|---|
| Frequency | Percent | Valid percent | Cumulative percent | ||
| Valid | No | 15 | 58.0 | 58.0 | 58.0 |
| Yes | 11 | 42.0 | 42.0 | 100.0 | |
| Total | 26 | 100.0 | 100.0 | ||
| Total_EP_score | |||||
|---|---|---|---|---|---|
| Frequency | Percent | Valid percent | Cumulative percent | ||
| Valid | 1 | 7 | 27.0 | 27.0 | 27.0 |
| 2 | 4 | 15.0 | 15.0 | 42.0 | |
| 3 | 3 | 11.0 | 11.0 | 53.0 | |
| 4 | 10 | 39.0 | 39.0 | 92.0 | |
| 5 | 2 | 9.0 | 9.0 | 100.0 | |
| Total | 26 | 100.0 | 100.0 | ||
| Gose_score | |||||
|---|---|---|---|---|---|
| Frequency | Percent | Valid percent | Cumulative percent | ||
| Valid | Grade 1 | 16 | 58.0 | 58.0 | 58.0 |
| Grade 2 | 8 | 42.0 | 42.0 | 100.0 | |
| Total | 26 | 100.0 | 100.0 | ||
| total_echo_score | |||||
|---|---|---|---|---|---|
| Frequency | Percent | Valid percent | Cumulative percent | ||
| Valid | 7.00 | 10 | 38.0 | 38.0 | 38.0 |
| 8.00 | 3 | 12.0 | 12.0 | 50.0 | |
| 9.00 | 4 | 16.0 | 16.0 | 66.0 | |
| 10.00 | 3 | 12.0 | 12.0 | 78.0 | |
| 11.00 | 2 | 7.6. | 7.6 | 84.6 | |
| 12.00 | 2 | 7.6 | 7.6 | 92.2 | |
| 13.00 | 2 | 7.6 | 7.6 | 100.0 | |
| Total | 26 | 100.0 | 100.0 | ||
Cross‐tabulation
| ERP_lessthan_250 ms * Acce_pathway Crosstabulation | ||||||
|---|---|---|---|---|---|---|
| Count | ||||||
| Acce_pathway | ||||||
| 1RPL | 1MP | 1RPS | 2RPS | 3RPS, RPL, MP | ||
| ERP_lessthan_250 ms | No | 6 | 0 | 8 | 1 | 0 |
| Yes | 1 | 4 | 4 | 1 | 1 | |
| Total | 7 | 4 | 12 | 2 | 1 | |
| Chi‐Square tests | |||
|---|---|---|---|
| Value | Df | Asymp. Sig. (2‐sided) | |
| Pearson Chi‐Square | 9.360a | 6 | 0.154 |
| Likelihood Ratio | 11.570 | 6 | 0.072 |
| N of Valid Cases | 26 | ||
| total_EP_score * total_echo_score Crosstabulation | ||||||||
|---|---|---|---|---|---|---|---|---|
| Count | ||||||||
| total_echo_score | ||||||||
| 7.00 | 8.00 | 9.00 | 10.00 | 11.00 | 12.00 | 13.00 | ||
| total_EP_score | 1 | 3 | 1 | 1 | 2 | 0 | 1 | 0 |
| 2 | 1 | 1 | 0 | 0 | 0 | 0 | 1 | |
| 3 | 1 | 2 | 0 | 0 | 0 | 0 | 0 | |
| 4 | 4 | 0 | 2 | 1 | 1 | 1 | 1 | |
| 5 | 0 | 0 | 1 | 0 | 1 | 0 | 0 | |
| Total | 9 | 4 | 4 | 3 | 2 | 2 | 2 | |
| Chi‐Square tests | |||
|---|---|---|---|
| Value | Df | Asymp. Sig. (2‐sided) | |
| Pearson Chi‐Square | 25.262a | 24 | 0.392 |
| Likelihood Ratio | 23.250 | 24 | 0.505 |
| Linear‐by‐Linear Association | 1.342 | 1 | 0.247 |
| N of Valid Cases | 26 | ||
Reliability
Scale: ALL VARIABLES
| Case processing summary | |||
|---|---|---|---|
| N | % | ||
| Cases | Valid | 23 | 89.0 |
| Excludeda | 3 | 11.0 | |
| Total | 26 | 100.0 | |
| a. Listwise deletion based on all variables in the procedure. |
| Reliability statistics | ||
|---|---|---|
| Cronbach's alpha | Cronbach's alpha based on standardized items | N of items |
| 0.484 | 0.489 | 3 |
| Item statistics | |||
|---|---|---|---|
| Mean | Std. deviation | N | |
| Gose_score | 1.4118 | 0.50730 | 23 |
| total_EP_grade | 1.5294 | 0.51450 | 23 |
| total_ECHO_grade | 2.1176 | 0.33211 | 23 |
| Inter‐item correlation matrix | |||
|---|---|---|---|
| Gose_score | total_EP_grade | total_ECHO_grade | |
| Gose_score | 1.000 | 0.310 | 0.436 |
| total_EP_grade | 0.310 | 1.000 | −0.022 |
| total_ECHO_grade | 0.436 | −0.022 | 1.000 |
| Scale statistics | |||
|---|---|---|---|
| Mean | Variance | Std. deviation | N of items |
| 5.0588 | 0.934 | 0.96635 | 3 |
| Intraclass correlation coefficient | ||||||
|---|---|---|---|---|---|---|
| Intraclass Correlationb | 95% confidence interval | F test with true value 0 | ||||
| Lower bound | Upper bound | Value | df1 | df2 | ||
| Single Measures | .238a | −0.048 | 0.568 | 1.939 | 16 | 32 |
| Average Measures | .484c | −0.159 | 0.798 | 1.939 | 16 | 32 |
| Intraclass correlation coefficient | |
|---|---|
| F test with true value 0b | |
| Sig | |
| Single Measures | .054a |
| Average Measures | .054c |
| Two‐way mixed effects model where people effects are random and measures effects are fixed. |
| a. The estimator is the same, whether the interaction effect is present or not. |
| b. Type C intraclass correlation coefficients using a consistency definition‐the between‐measure variance is excluded from the denominator variance. |
| c. This estimate is computed assuming the interaction effect is absent, because it is not estimable otherwise. |
OP‐221‐V‐PEDS
Long‐term outcome of cardiac pacemaker implantation in pediatric population
Deepanjan Bhattacharya; Narayanan Namboodiri; Baiju S. Dharan; Krishna Kumar Mohanan Nair
SCTIMST, Trivandrum, India
Objectives: The aim of this study is to assess the long‐term outcome of pacemaker implantation in children less than 18 years of age. Objectives include to study the indication of PPI in this population, along with types of leads and pacing mode used, various pacemaker parameters and their trends during follow‐up and any re‐interventions or upgradation required.
Materials and Methods: We prospectively analyzed the long‐term outcomes of PPI in children below 18 years of age, with respect to indications, techniques, need for reinterventions and complications.
Results: 235 children were included with M:F ratio being 1.1, and median of implantation of 7 years. 43.4% underwent epicardial PPI, and the commonest indication being congenital CHB (50.2%) followed by post‐operative CHB (28.1%). 65.5% underwent VVI pacemaker implantation. 41.3% had associated CHD out of which VSD was commonest, followed by ASD. Over a median follow‐up of 8 years, mean percentage of pacing was 82.1 ± 29.2%, with stable lead thresholds. 23.8% patients underwent PG change at median duration 97 months for battery depletion, 3.4% underwent lead change for lead dysfunction at median duration 52 months while 4.3% patients had surgical site infection. 6.38% had post‐implantation ventricular dysfunction at a median duration of 83 months, and overall mortality was 2.9%, with major predictors being age at implantation below 28 days, maternal lupus antibodies, CHD, and post‐implantation ventricular dysfunction.
Conclusion: PPI in children has favorable outcomes with age at implantation below 28 days, maternal lupus antibodies, CHD, and post‐implantation ventricular dysfunction associated with adverse outcomes.
OP‐222‐1‐ST (TRACK 7 ‐ ST)
Early dose of adenosine, postradiofrequency ablation of accessory pathway in determining acute procedural success (early study)
Anand Manickavasagam 1; Siva Nagewara Rao Guttikonda2; Dinakar Bootla2; Sirish Chandra Srinath Patloori1; Ashish Jain2; David Chase1; Raja Selvaraj2; John Roshan1
1 Christian Medical College, Vellore, India; 2JIPMER, Puducherry, India
Objective: To determine whether the administration of intravenous adenosine at 10 minutes after ablation of accessory pathway (AP) would have the same diagnostic accuracy as waiting for 30 minutes in predicting resumption of AP conduction.
Materials and Methods: This prospective interventional study was conducted in two centers after obtaining ethics committee approval. Post ablation of the AP, intravenous adenosine was administered at 10 minutes to look for dormant pathway conduction. The response was recorded as positive (presence of pathway conduction), negative (absence) or indeterminate (not able to demonstrate AV and VA block and inability to ascertain AP conduction).
Results: The study included 110 procedures performed in 109 patients. Adenosine administration at 10 minutes showed positive result in 3 cases (2.7%), negative result in 99 cases (90%) and indeterminate result in 8 cases (7.3%). Reconnection of accessory pathway at 30 minutes post ablation was seen in 8 cases (7.3%). Of these 8 cases, 10 minutes adenosine administration showed positive test in 3 patients and negative test in 5 patients. Adenosine test at 10 minutes has a sensitivity, specificity, positive predictive value, and negative predictive value of 37.5%, 100%, 100% and 94.9% in identifying the recurrence of accessory pathway conduction at 30 minutes, respectively.
Conclusion: Absence of pathway conduction on administration of adenosine 10 minutes post ablation does not help predict the absence of resumption of conduction thereafter.
Supporting Documents

OP‐223‐1‐ST (TRACK 7 ‐ ST)
Lower common pathway block in AVNRT mimicking atrial tachycardia
Mega Amanda Putri; Karwiky Giky; Iqbal Mohammad; Achmad Chaerul
Department of Cardiology and Vascular Medicine, Universitas Padjadjaran, Dr. Hasan Sadikin General Hospital, Bandung, Indonesia
Case Presentation: Differentiate Atrioventricular Nodal Reentry Tachycardia (AVNRT) from other forms of Supraventricular Tachycardia (SVT) during Electrophysiologic Study (EPS) is important in catheter ablation. However, diagnosis of AVNRT might be confusing especially in the presence of block. We report a case report of a woman with symptoms of palpitation in which EPS showed AVNRT with lower common pathway block mimicking Atrial Tachycardia (AT).
A 53‐years old woman was referred for an EPS and catheter ablation. Quadripolar catheters were placed in His Bundle (HB), Right Ventricle Apex (RVA), High Right Atrium (HRA), and Coronary Sinus (CS). Initially, SVT was thought to be AT because: (1) a short CL with 2:1 AV conduction and Wenckebach AV block; (2) burst pacing from RVA showed VA dissociate; (3) burst pacing from HRA showed cross‐over and normal AV‐BCL. A suggestive diagnosis of AVNRT with lower common pathway block was made based on the findings that extra stimulus pacing from HRA showed double AH jump, echo beat, normal ERP, and earliest atrial activation at HB region. Sulfas Atropine 5 mg was administered intravenously. Atrial extra‐stimulus induced SVT with 1:1 AV conduction, PPI‐TCL > 114 ms, and SA‐VA > 85 ms. Successful ablation at a slow pathway was achieved. Post‐ablation EPS showed a single echo beat without inducible SVT.
Conclusion: EPS should be performed before catheter ablation to obtain a diagnosis of SVT. Careful maneuvers during EPS could re‐evaluate diagnosis and mandatory for successful ablation therapy.
Supporting Documents

FIGURE 1

FIGURE 2
OP‐224‐1‐ST (TRACK 7 ‐ ST)
Deep learning analysis of sinus rhythm electrocardiograms to classify paroxysmal supraventricular tachycardia types
Soonil Kwon 1; Jangwon Suh2; Jimyeong Kim2; Hoojin Ju1; Hyo‐Jeong Ahn1; Sunhwa Kim3; So‐Ryoung Lee1; Wonjong Rhee2; Eue‐Keun Choi1; Seil Oh1
1 Seoul National University Hospital, Seoul, South Korea; 2Seoul National University, Seoul, South Korea; 3Presbyterian Medical Center, Jeonju, South Korea
Objectives: We aimed to investigate whether deep learning analysis can classify underlying Atrioventricular Nodal Reentry Tachycardia (AVNRT) from concealed Atrioventricular Reentry Tachycardia (cAVRT) using sinus rhythm electrocardiograms (ECGs).
Materials and Methods: We collected the patients with AVNRT or cAVRT, and their 12‐lead ECGs with sinus rhythm between 2001 and 2021. The diagnosis of each patient was validated with an electrophysiology study. The deep learning model (Figure A) was trained to classify sinus rhythm ECGs with underlying AVNRT and cAVRT. ResNet‐34 was used, and it was pre‐trained with the PhysioNet/CinC Challenge 2021 dataset to overcome the limited dataset size. The deep learning model was validated with the 10‐fold cross‐validation. Grad‐CAM visualization was adopted to analyze which ECG segment is important for the model to classify the two arrhythmias.
Results: A total of 696 patients with AVNRT and 305 patients with cAVRT were analyzed. Compared to the AVNRT group, the cAVRT group had a comparable age but a significantly higher male proportion; age 46.6 vs. 44.4 years (p = 0.775); male 47.7 vs. 63.3% (p = 0.002). The deep learning model showed 0.71 (95% CI 0.67–0.74) for AUROC, 0.83 (95% CI 0.80–0.86) for AUPRC, 0.71 (95% CI 0.67–0.75) for sensitivity, and 0.59 (0.51–0.66) for specificity (Figure B). Grad‐CAM analysis showed that the model focused on the QRS complex and the ST segment for classifying AVNRT, while it focused on the ST segment for classifying cAVRT (Figure C).
Conclusion: Deep learning classification of AVNRT and cAVRT was feasible with sinus rhythm ECGs.
Supporting Documents

FIGURE
OP‐225‐1‐ST (TRACK 9 ‐ ST)
Radiofrequency ablation of incessant atrial tachycardia after COVID‐19 infection
Tam Adrian Aya‐Ay; Michael‐Joseph Agbayani; Elaine Alajar; Bernadette Mariño; Henzor Dauigoy
Philippine General Hospital, Manila City, Philippines
Objectives: We present a case of a 38‐year‐old male with no known comorbidities who presented with incessant focal atrial tachycardia complicated by tachycardia‐mediated cardiomyopathy and COVID‐19 infection. He successfully underwent 3D Cardiac Mapping + radiofrequency ablation of the right superior pulmonary vein.
Materials and Methods: Results: A 38‐year‐old male presented with persistent palpitations and tachycardia associated with heart failure symptoms. On work up, 12 L‐ ECG showed sustained focal atrial tachycardia with heart rate (HR) ranges 170–190 bpm with positive p‐wave axis in lead I, II, III, AVF and upright in lead V1. He was initially started on HR‐lowering medications and given electrical synchronized cardioversion which were both unsuccessful. A week later, patient developed COVID‐19 pneumonia and subsequently completed isolation as per local government protocol. During the course of admission, a POCUS echocardiogram was done which showed a newly depressed left ventricular ejection fraction (EF) of 22% compared to a previous 44% two weeks earlier. Hence, patient eventually underwent successful 3D‐mapping and radiofrequency ablation of the right super pulmonary vein via transseptal approach. He was then successfully discharged with Metoprolol 200 mg twice daily alongside with other heart failure medications.
Conclusion: Development of COVID‐19 infection can run the risk of worsening and clinical decompensation among patients with incessant tachyarrhythmia and there are still no established data regarding the safety of doing radiofrequency ablation post‐COVID‐19 infection. This case report illustrates doing a successful radiofrequency frequency ablation post‐COVID‐19 infection in a patient who developed incessant atrial tachycardia.
OP‐226‐1‐ST (TRACK 9 ‐ ST)
Intracardiac electrograms (EGMS)—Can be a clue to indicate epicardial accessory pathways?
Amira Shaik; Varsha Prakash; Prakash Vadagenalli
M S Ramaiah Medical College, Bengaluru, India
Objective: Posteroseptal accessory pathways (PSAP) quite often result in failed ablation with a higher incidence of epicardial location of AP. Surface electrogram has a low Sensitivity and high Specificity in suggesting Epicardial APs. Intracardiac EGM pattern could suggest an epicardial location avoiding unnecessary and failed radiofrequency lesions.
Materials and methods: Describing a case series of five patients with intracardiac EGM showing a peculiar pattern of antegrade AV fusion in the mid CS dipoles recording suggestive of a broadband AP in the left posteroseptal location.
However, delivery of Radiofrequency (RF) energy at that site via trans‐septal approach failed to eliminate the accessory pathway. Coronary sinus (CS) angiogram revealed CS diverticulum in three cases & a dilated CS in two. Mapping revealed AV fusion with a pathway potential at the neck of the CS diverticulum. Application of RF energy at this site resulted in loss of preexcitation and AV separation.
Results: In all five patients RF ablation of epicardial accessory pathway located at CS Diverticulum/ dilated CS was performed via transvenous approach. Mean number of therapies delivered were 3 (2–7) with 20–30 watts. Mean procedure time was 68 minutes (33–128 minutes). There were no complications. All five patients are asymptomatic at follow‐up with no manifest preexcitation or documented arrhythmias.
Conclusion: Intracardiac Electrograms with fused AV signals in the mid‐CS dipoles mimicking existence of a broadband left Posteroseptal AP, are a clue to suggest the possibility of CS diverticulum and the presence of Epicardial AP in its proximity.
Supporting Documents


OP‐227‐1‐ST (TRACK 9 ‐ ST)
You can run, but you cannot Hide: An unorthodox location of focal atrial tachycardia
Yuen Hoong Phang; Mohanaraj Jayakumar; Chee Wei Leong; Ahmad Faiz Mohd Ezanee; Vijayendran Rajalingam; Kai Soon Liew; Kantha Rao Narasamuloo; Saravanan Krishinan
Hospital Sultanah Bahiyah/Ministry of Health, Alor Setar, Malaysia
We present a redo case of tachycardia‐induced cardiomyopathy in a 27 years gentleman with a history of focal atrial tachycardia catheter ablation over the left upper pulmonary vein performed 10 years ago.
He complained of recurrent palpitation and decreased effort tolerance with NYHA 2. ECG was noted to be long RP tachycardia with a heart rate of 100–120, with P wave upright in all leads, and an echocardiogram noted an EF of 45% with segmental RWMA and LVIDD 6 cm.
EPS was started with a CS catheter to high RA, and another to CS, which noted eccentric activation during tachycardia. We then proceeded Carto 3D system with a Pentaray‐Nav catheter. Mapping was started from RA and noted the earliest spot was found at the posterior wall, which was later than P wave onset.
We proceeded with a transeptal puncture and mapped the LA. The earliest activation site was located at the posterior wall of LA, 33 ms pre‐P wave onset. The signal was consistent, with a sharp descent unipolar signal. AT was terminated during ablation but recurred within 5 seconds with a slower cycle length. The ablation region was micro‐mapped, and the earliest signal was capture at the superior posterior wall, with catheter contact terminating the tachycardia. Ablation was done using @60°C 25 W, inducing atrial runs during ablation. Post ablation, AT was not inducible.
Bisoprolol was stopped post‐procedure.
4 weeks later, he was in NYHA 1, remained in sinus rhythm and echocardiogram noted EF 65% with no RWMA and LVIDD 5.8 cm.
Supporting Documents

OP‐228‐1‐ST (TRACK 9 ‐ ST)
Assess the properties and outcome of special supraventricular tachycardia cases using three‐dimension navigation system
Quoc Tran
Tam Duc Heart Hospital, Ho Chi Minh City, Viet Nam
Objective: Radiofrequency catheter ablation (RFCA) is traditionally performed under fluoroscopic guidance, however procedure time and radiation exposure by fluoroscopy depends on many variables such as experience of the operator or complexity of the heart, target position. Nowadays, three‐dimension navigation system (3D) applied in such special SVT cases appeared as an ambitious approach. The aim of this study was to assess the properties and outcome in the group using 3D mapping compared to traditional approach.
Materials and Methods: A retrospective chart review was performed in our center from Jan 2022 to July 2022 collected 83 patients.
Results: Fifty‐seven and 26 patients underwent RFCA traditional fluoroscopic guidance and mapping using Ensite Precision system, respectively. The gender between two groups was not different but the patients in 3D group was statistical younger and had more structural heart disease than in 2D group (32 ± 23.4 vs 42 ± 15.9 ys, p = 0.04 and 6% vs 1.2%, p = 0.01, respectively). The acute procedural success in 3D group was higher significantly compared to 2D group (100% vs 94.7%, p = 0.02). The target around parahisian site occured commonly in 3D (9.8 vs 6.0%, p = 0.02). In addition, the rate of failed initial ablation was prominent in 3D group (23% vs 1.75%, p = 0.01).
Conclusion: RCFA with 3D mapping in SVT is shown to be more successful and helpful in special populations such as parahisian accessory pathway, or re‐ablation procedure.
Supporting Documents


OP‐229‐V‐ST
Novel endpoints for recurrence after catheter ablation of atrioventricular nodal reentry tachycardia
Hyoungseok Lee
Korea University College of Medicine and Korea University Medical Center, Seoul, South Korea
Objective: Catheter ablation is the curative treatment of symptomatic atrioventricular nodal reentrant tachycardia (AVNRT), however, the association between endpoints of the procedure and recurrence has not yet been clearly identified.
Therefore, we aimed to demonstrate whether novel procedural endpoints using window period and inducibility can predict recurrence.
Materials and Methods: This is a retrospective study in patients who successfully performed RFCA after being diagnosed with AVNRT from 2005 to 2021. The predictive power of recurrence was assessed by logistic regression using a novel endpoint. It is the addition of inducibility applied to the conventional procedure endpoint which is AH jump and 1 echo with echo window within 40 ms.
Results: Among a total of 1567 consecutive patients were successfully treated with AVNRT ablation, 22 patients (1.43%) showed recurrence after the procedure in 1533 cases, excluding 34 cases with follow‐up loss.
When AH jump was applied alone to the non‐recurrent and recurrent groups (table 1), the odd ratio (OR) was 1.06; whereas AH jump and 1 echo with echo window within 40 ms were applied together, the OR was 0.948. And AH jump, 1 echo with echo window within 40 ms and inducibility were applied together, the OR was 0.400.
Conclusion: This study demonstrated that when inducibility is applied to AH jump and 1 echo with echo window within 40 ms, which are known procedure endpoints, the ORs seem to be decreased, suggesting inducibility applied to the existing procedure endpoint during catheter ablation of AVNRT may have a predictive power of recurrence.
Supporting Documents
TABLE 1 Procedure endpoint with None‐recurrence and Recurrence
| Non‐recurrence (n = 1511) | Recurrence (n = 22) | OR (95% CI) | p‐value | |
|---|---|---|---|---|
| AH jump (−) | 1079 (71.4%) | 16 (72.7%) | 1.06 (0.415–2.747) | 0.892 |
| AH jump (±) with 1 echo and echowindow within 40 ms | 1361 (90.9%) | 20 (90.9%) | 0.948 (0.219–4.101) | 0.943 |
| AH jump (±) with 1 echo, echowindow within 40 ms and inducibility (−) | 1120 (74.1%) | 13 (59.0%) | 0.400 (0.158–1.012) | 0.053 |
OP‐230‐V‐ST
Combined supra‐and‐subvalvular approach for right accessory pathway under anterior tricuspid valve
Nanqing Xiong; Wentao Gu; Weizhuo Liu; Xinping Luo; Jian Li
Huashan Hospital Fudan University, Shanghai, China
Objective: To evaluate the effectiveness of a combined supravalvular plus subvalvular approach to right accessory pathway under the anterior tricuspid valve. Materials and Methods Patients undergoing right accessory pathway under anterior tricuspid valve were enrolled. Conventional supravalvular approach was used in group A for ablation. While in the other patients (group B), a combined supravalvular plus subvalvular approach was applied, in which supravalvular approach was used for target mapping and first radiofrequency delivery, and subsequently, subvalvular ablation using a reverse‐S catheter position was immediately performed with the help of a long sheath from the opposite side of valve. Procedural and follow‐up data were collected from the patients. Results 9/10 procedures in group A and all 8/8 procedures in group B were successful with a similar mean procedural time (p = 0.83). Group B has a shorter ablation time than group A, counted from the beginning of mapping till the final pathway elimination (p < 0.01). After 6‐month follow‐up, 1 patient from group A suffered from disease recurrence while all patients in group B achieved long‐term success Conclusion Combined supraventricular and subvalvular approach was feasible in right anterolateral accessory pathway ablation by facilitating catheter stability during radiofrequency application with considerable mapping and ablation efficiency.
Supporting Documents


OP‐231‐1‐SDC (TRACK 8 ‐ SDC)
Endocrinopathies leading to misdiagnosis of gene‐negative long QT syndrome
Praloy Chakraborty 1; Jason D. Roberts2,3; Michael H. Gollob1,4
1 Toronto General Hospital – Toronto, Ontario, Canada; 2Section of Cardiac Electrophysiology, Division of Cardiology, Western University, London, Ontario, Canada; 3Population Health Research Institute, McMaster University, and Hamilton Health Sciences, Hamilton, Ontario, Canada; 4Inherited Arrhythmia and Cardiomyopathy Clinic, Partners in Advanced Cardiac Evaluation, Newmarket, Ontario, Canada
Background: Despite having a genetic etiology, 30% of patients with LQTS are ‘gene elusive’.
Objective: We describe a series of six patients of ‘gene negative’ LQTS where a detailed clinical workup demonstrated endocrinopathies as the cause of QT prolongation.
Methods: N/A.
Results: Two patients (case 1: 32 years/ F, case 2: 43 years/F) presented with hypotension, QT prolongation (QTc = 584 ms and 553 ms, respectively), and recurrent torsades de pointes (TdP). As a result of the presence of unprovoked hypoglycemia, the ACTH challenge test was planned and established the diagnosis of adrenal insufficiency in both cases with resolution of symptoms and normalization of the QT interval with Corticosteroid therapy. Two patients (case 3: 64 years/F, case 4: 61 years/F) were referred because of the incidental observation of QT prolongation. In case 3, elevated serum parathyroid hormone (13.5 pmol/L), normal Ca2, and normal 25‐hydroxy vitamin D confirmed a diagnosis of normocalcemic hyperparathyroidism. In case 4, hypocalcemia was observed in association with normal 25‐OH Vitamin D level and a reduced serum PTH (0.64 pmol/L), indicating a diagnosis of hypoparathyroidism. Lastly, two pediatric cases (case 5: 15 years/M, case 6: 11 years/F) presented with recurrent syncope QT prolongation (QTc of 475 ms in both patients). Biochemical assessment noted hypocalcemia (case 5:1.42, case 6: 1.44 mmol/L) and elevated PTH (case 5: 20.4, case 6: 36 pmol/L), establishing a diagnosis of pseudohypoparathyroidism in both. Treatment with calcium and calcitriol normalized the QTc in the last three cases.
Conclusions: Endocrinopathies should be considered in the diagnosis of “gene negative” LQTS.
OP‐232‐1‐SDC (TRACK 8 ‐ SDC)
Clinical predictors of cardiac syncope receiving an INSERTABLE cardiac monitor in patients with unexplained syncope
Shinji Ito
Izumi City General Hospital, Izumi, Japan
Objectives: The prognosis of syncope is related both to underlying comorbidities and etiology, with cardiac syncope (CS) having a higher risk for mortality and cardiovascular events than the syncope of non‐cardiac causes. Although a novel insertable cardiac monitor (ICM) is an effective tool for diagnosing unexplained syncope, the decision to implant an ICM with a high pretest likelihood of CS should contribute to economic costs reduction and avoid unnecessary complications. We investigated the clinical factors for CS after ICM implantation in patients with unexplained syncope.
Materials and Methods: This was a retrospective observational study that included consecutive 31 patients implanted with an ICM for the indication of syncope between September 2016 and August 2021. The initial examinations for the syncope evaluation included a detailed history, physical examination, blood test, 12‐lead electrocardiogram and transthoracic echocardiography.
Results: Of the 31 patients, recurrent CS occurred in 13 (41.9%) during the follow‐up period (676 ± 469 days). Among several clinical factors, presence of minor injuries related to syncope (p = 0.017) and higher brain natriuretic peptide (BNP; p = 0.043) were significantly associated with CS. Moreover, multivariable analysis showed that both minor injuries related to syncope (odds ratio, 11.2; 95% confidential interval, 1.4–88.4; p = 0.022) and BNP higher than 64.0 pg/ mL (odds ratio, 7.0; 95% confidential interval, 1.1–44.2; p = 0.038) were independent predictors of CS after ICM implantation.
Conclusion: A history of minor injury secondary to syncope and higher BNP level were independent predictive factors of CS in patients receiving ICM for syncope.
OP‐233‐1‐SDC (TRACK 8 ‐ SDC)
Improvement of right ventricular systolic function in association with reduced appropriate ICD therapy
Toshinori Chiba 1; Takatsugu Kajiyama2; Yutaka Yoshino1; Satoko Ryuzaki1; Masafumi Sugawara1; Mari Kitagawa1; Ryo Ito1; Miyo Nakano1; Masahiro Nakano2; Yusuke Kondo1; Yoshio Kobayashi1
1 Department of Cardiovascular Medicine, Chiba University Graduate School of Medicine, Japan; 2Department of Advanced Cardiorhythm Therapeutics, Chiba University Graduate School of Medicine, Japan
Background: A recent study showed that right ventricular fractional area change (RVFAC) was associated with a significantly increased risk of SCD despite of LVEF. The purpose of this study was to evaluate the association of RVFAC and appropriate implantable cardioverter‐defibrillator (ICD) therapy.
Methods: Consecutive patients who underwent initial ICD implantation except for hypertrophic cardiomyopathy and Brugada syndrome and long QT syndrome were retrospectively enrolled. Primary endpoint was defined as any appropriate ICD therapy. Right ventricular dimensions and functions were also measured to be analyzed. The change of RVFAC after implantation was re‐evaluated one year later.
Results: In total, 172 patients (60.3 ± 13.6 years, 131 males) including 64 ischemic cardiomyopathy (37.2%) were enrolled. Ninety patients received an ICD as a secondary prophylaxis. Mean left ventricular ejection fraction (LVEF) and RVFAC were 38.3 ± 14.3% and 35.8 ± 8.82%, respectively. Regarding appropriate ICD therapy events, the best cut‐off value of RVFAC was 34.8%. The odds ratio of low RVFAC was 2.73 (95%CI: 1.456–5.121, p = 0.00174). In multivariate analysis, only low RVFAC is an independent predictor of appropriate ICD therapy (HR: 3.53, 95%CI:1.78–6.99, p < 0.001). Secondary prophylactic cohort with low RVFAC showed highest incidence of appropriate ICD therapy. Among patients with RV dysfunction, RVFAC was normalized in 39% patients during follow‐up. This recovered group showed significantly lower incidence of appropriate ICD therapy than unrecovered group (p = 0.037).
Conclusion: RVFAC and its improvement may be important to stratify the prognosis of ICD patients.
OP‐234‐2‐SDC (TRACK 8 ‐ SDC 1)
Impact of manual editing on T‐wave alternans values in myocardial infarction or heart failure patients
Tae‐Wan Chung; Seung‐Jung Park; Ju Youn Kim; Kyoung‐Min Park; Young Keun On; June Soo Kim
Samsung Medical Center, Sungkyunkwan University School of Medicine, Seoul, South Korea
T‐wave alternans (TWA) are a useful non‐invasive predictor of sudden cardiac death (SCD) in patients with myocardial infarction (MI) or heart failure (HF). However, TWA values are frequently overestimated because of noise or artifacts. We evaluated the extent of change in the TWA values during manual editing.
The Korean noninvasive Risk Evaluation study for sudden cardiac DEath From INfarction or heart failure (K‐REDEFINE) registry prospectively measured TWA using ambulatory ECG data in patients with MI and HF at 25 tertiary referral hospitals in South Korea. In all patients, pre‐ and post‐editing Maximal TWA (Max‐TWA) values were obtained in each channel. Manual editing was performed by 2 cardiologists.
Ambulatory ECG recording were performed in 1101 MI and 383 HF patients (Male 74.2%, Age 61 ± 13 years old). Max‐TWA values were available in both leads V1 and V5 among 1329 (89.6%) of 1484 patients. There was a significant decrease in Max‐TWA values during manual editing: 53 ± 28 vs. 43 ± 17 μV in V1 lead, p < 0.001; 60 ± 42 vs. 55 ± 24 μV in V5 lead, p < 0.001. A significant decrease in Max‐TWA values was also observed when patients were divided into HF and MI subgroups. Additionally, proportion of patients with Max‐TWA ≥65 μV (a cut‐off value for predicting SCD in previous studies) dramatically reduced from 32 (422/1329) % to 28% (370/1329) (p = 0.031).
Max‐TWA values in each lead and proportion of patients with Max‐TWA ≥65 μV significantly decreased by manual editing. Therefore, manual editing should be performed when Max‐TWA values are used for the risk assessment of SCD.
OP‐235‐2‐SDC (TRACK 8 ‐ SDC 1)
Association between dynamic structural change and lethal arrhythmic events in patients with hypertrophic cardiomyopathy
Joo Hee Jeong; Jong‐Il Choi; Yun Gi Kim; Yun Young Choi; Kyong Jin Min; Hyoung Seok Lee; Jae‐Min Shim; Mi‐Na Kim; Seong‐Mi Park; Young‐Hoon Kim
Korea University Anam Hospital, South Korea
Objectives: Risk factors for sudden cardiac death (SCD) in hypertrophic cardiomyopathy (HCM) have been established, which include echocardiographic assessment of left ventricular hypertrophy and left ventricular ejection fraction. However, less is known about the temporal change of HCM after diagnosis and its association with lethal arrhythmic events (LAE). We aimed to investigate structural change measured by echocardiography in adult HCM, and further assessed its association with LAEs.
Materials and Method: This study is based on cohort of HCM patients in a single‐center: patients with diagnostic codes of HCM were extracted from 1998 to 2021. LAE was defined as composite outcome of aborted SCD, ventricular arrhythmia, and implantable cardioverter‐defibrillation implantation.
Results: Among 611 HCM patients, 153 patients with 5‐year follow‐up echocardiographic data were studied. LAE occurred in 63 patients (41.2%). Compared with non‐LAE group, LAE group presented younger age of onset (56.0 ± 15.9 vs. 62.1 ± 15.1 years old, p = 0.017), higher proportion of septal HCM (65.0 vs. 47.7%, p = 0.033), higher interventricular septum (IVS)/posterior wall (PW) ratio (1.5 ± 0.4 vs. 1.3 ± 0.3 mm, p = 0.013), and higher calculated risk of SCD (1.8 ± 1.0 vs. 1.4 ± 0.7%, p = 0.011). There was no significant difference in cumulative occurrence of LAE regarding the change of IVS/PW ratio or maximal wall thickness at 5‐year period.
Conclusion: Although echocardiographic parameters did not show significant temporal change at 5‐year follow up according to LAE occurrence, asymmetric wall thickness of hypertrophied ventricle was associated with risk of LAE. Non‐structural clinical markers may be needed in stratifying subsequent probability of lethal arrhythmia.
Supporting Documents

OP‐236‐2‐SDC (TRACK 8 ‐ SDC 1)
Obesity is not associated with sudden cardiac death
Joo Hee Jeong 1; Yun Gi Kim1; Jong‐Il Choi1; Kyung‐Do Han2; Yun Young Choi1; Kyong Jin Min1; Hyoung Seok Lee1; Jae‐Min Shim1; Young‐Hoon Kim1
1 Korea University Anam Hospital, South Korea; 2Soongsil University, Department of Statistics and Actuarial Science, Seoul, South Korea
Objectives: The linkage and causal relationship of obesity and sudden cardiac death (SCD) is not fully established. This study investigated the impact of body weight status, measured by body‐mass index (BMI) and waist circumference (WC), on the risk of SCD, based on a nationwide database of health insurance system.
Materials and Methods: A total of 4,234,341 participants who underwent medical check‐up in 2009 were included. Influence of confounding risk factors (age, sex, social habits, and metabolic disorders) was further analyzed.
Results: During 33,345,378 person*years of follow‐up, SCD occurred in 16,352 cases. BMI resulted a J‐shaped association with risk of SCD, in which obese group (BMI≥30) had 20.8% increased risk of SCD compared with normal body weight group (18.5 ≤ BMI < 23.0) (95% confidence interval [CI] = 1.12–1.31; p < 0.001). WC showed a robust linear association with the risk of SCD, with 2.69‐fold increased risk of SCD in highest WC group as compared with the lowest WC group (95% CI = 2.50–2.89; p < 0.001). However, after adjustment of covariates, neither BMI nor WC was associated with the risk of SCD. In multivariate model, sex was the strongest predictor for SCD (HR = 2.35, 95% CI = 2.25–2.46; p < 0.001), followed by smoking, diabetes mellitus, and hypertension.
Conclusion: Obesity assessed as BMI and WC is not associated with SCD risk after adjustment of confounding risk factors. Rather than focusing on obesity per se, integrated approach with extended to consideration of pre‐existing metabolic disorders as well as people demographics and social habits might provide better understanding and prevention of SCD.
Supporting Documents

OP‐237‐2‐SDC (TRACK 8 ‐ SDC 1)
Mutant Nav1.5 with dominant‐negative effect does not correspond to the severe phenotype
Ayami Tano 1; Koichi Kato2; Hideyuki Jinzai2; Daisuke Fukumoto3; Seiko Ohno4; Yoshihisa Nakagawa2; Minoru Horie2
1 Department of Neurology, Shiga University of Medical Science, Otsu, Japan; 2Department of Cardiovascular Medicine, Shiga University of Medical Science; 3Osaka Kaisei Hospital, Osaka, Japan; 4Department of Bioscience and Genetics, National Cerebral and Cardiovascular Center, Suita, Japan
Objectives: Loss‐of‐function (LOF) variants of SCN5A are known to cause various arrhythmic syndromes. Recent studies demonstrated dominant‐negative (DN) effect of LOF‐SCN5A variants via channel dimerization and its association with phenotype penetrance but not with severity. We identified compound heterozygous SCN5A variants, p.G833R and p.T1396P, in a family with bradyarrhythmia. In this study, we analyzed functional property of these variant to understand the association between disease severity and DN effect of SCN5A variants.
Materials and Methods: A whole‐cell patch‐clamp analysis was performed for the functional analysis of the mutant Nav1.5 s expressed in HEK cells. Coupling effect of mutated channels was assessed by co‐expressing WT and mutant plasmids in various combinations with or without a channel‐dimerization cancelling peptide, difopein.
Results: HEK cells expressing T1396P showed complete loss of sodium current, whereas those expressing G833R did not show any functional alterations. Cells expressing WT/T1396P mimicking heterozygote demonstrated significant reduction of current density, that was so‐called a DN‐effect. The effect was canceled by co‐expression of difopein, implying that T1396P manifested DN‐effect via channel dimerization. When co‐expressing T1396P/G833R together, T1396P did not manifest DN‐effect. It suggests that G833R worked as a dimerization canceller. However, the proband carrying both T1396P and G833R showed obviously severe phenotype than her mother carrying only T1396P, suggesting that cancellation of dimerization by G833R did not weaken phenotype severity.
Conclusion: Our result supports the Nav1.5‐dimerization concept and consequent DN‐effect by LOF‐SCN5A variants. The role of dimerization‐canceller for phenotype expression should be studied further.
Supporting Documents

OP‐238‐2‐SDC (TRACK 8 ‐ SDC 1)
Genotypes identified by next‐generation sequencing in idiopathic ventricular fibrillation
Honggyu Kim 1; Joo Hee Jeong2; Yun Gi Kim2; Yun Young Choi2; Kyongjin Min2; Hyoung Seok Lee2; Jaemin Shim2; Jong‐Il Choi2; Young‐Hoon Kim2
1 Korea university College of Medicine and Korea University Anam Hospital, Seoul, Republic of Korea; 2Division of Cardiology, Department of Internal Medicine, Korea University College of Medicine and Korea University Anam hospital, Seoul, Republic of Korea
Objective: Idiopathic ventricular fibrillation (IVF) is a diagnosis of exclusion, which is diagnosed when the cause of ventricular fibrillation cannot be identified despite thorough clinical examination. We aimed to investigate genotypes of IVF probands to undercover concealed disease using next‐generation sequencing (NGS).
Materials and Methods: This study is based on single‐center cohort of aborted sudden cardiac arrest without identified causes and structural heart disease from 2016 to 2020. Clinical data and genetic data using NGS panel (Illumina, Inc., San Diego, CA, USA) were analyzed.
Results: A total of 15 IVF patients were studied, and the mean age of onset was 43.5 ± 12.2 years old. All patients were male, and were implanted with implantable cardioverter‐defibrillators. 12‐lead electrocardiography revealed sinus rhythm in 14 patients, and mean heart rate and QTc interval was 63.8 ± 8.4 and 408.6 ± 31.7. None of the patients revealed significant electrocardiography change that can be associated with SCD. Mean left ventricular ejection fraction was 58.1 ± 5.1%. Drug provocation test with flecainide and epinephrine resulted non‐significant QT prolongation in 1 of 13 patients. Fourteen patients underwent the NGS panel, and 13 patients were detected with certain genotypes. The most frequent variant was TTN (n = 5), followed by RYR2, KCNQ, CACNA1C (n = 2). AKAP9, TRPM4, DSG2, DTNA, DSP, SCN5A, PKP2 variants were also identified.
Conclusions: NGS‐based genetic testing identified substantial proportion of genetic variants in patients initially diagnosed with IVF. The molecular diagnostic approach suggests further clinical evaluation and follow‐up in IVF patients with positive genotypes, with possibility of concealed inherited arrhythmia and cardiomyopathy.
OP‐239‐2‐SDC (TRACK 8 ‐ SDC 1)
Is post‐acute sequelae COVID‐19 (Long‐COVID) a post‐viral postural orthostatic tachycardia syndrome?
Marie‐Claire Seeley 1; Celine Gallagher1; Amy Langdon2; Eric Ong2; Jonathan Chieng1; Danielle Bailey1; Dennis Lau1
1 Centre for Heart Rhythm Disorders, University of Adelaide, South Australian Health and Medical Research Institute and Royal Adelaide Hospital, Adelaide, Australia, Adelaide, Australia; 2College of Medicine and Public Health, Flinders University, Adelaide, Australia, Adelaide, Australia
Objectives: To compare autonomic function and health‐related quality of life (HRQoL) in those with post‐acute sequelae of Covid‐19 (PASC), postural orthostatic tachycardia syndrome (POTS) and healthy controls.
Methods: A total of 60 participants were recruited (PASC = 20, POTS = 20, controls = 20). There were no significant differences in age or other demographics between groups. PASC was defined as ≥3 months of persistent unexplained symptomology post SARS‐CoV‐2 infection. 10‐minute active standing test was undertaken using Finapres® NOVA to measure beat‐to‐beat haemodynamic response. Composite Autonomic Symptom Score (COMPASS‐31) was used to assess autonomic symptomology and the Euroquol 5‐Dimension (EQ‐5D) survey to assess HRQoL (scale of 0–1 with ‘1’ representing full health). The 5‐point hypermobility questionnaire (5‐PHQ) was used to assess generalized joint hypermobility (defined as score ≥2).
Results: 95% of PASC subjects fulfilled the standing test criteria for POTS (∆ heart rate, bpm: 42 ± 10 vs. 48 ± 14 in POTS and 16 ± 6 in controls; p < 0.001) and significantly increased autonomic symptoms per COMPASS‐31 score as compared to controls (39 ± 11 vs. 51 ± 15 in POTS and 12 ± 14 in controls; p < 0.001). Individuals with PASC and POTS had higher rates of joint hypermobility than controls (45% vs. 75% vs. 25% respectively; p = 0.006) and significantly reduced HRQoL utility scores (0.61 ± 0.04 vs. 0.64 ± 0.03 vs. 0.94 ± 0.09 respectively; p < 0.001).
Conclusion: Autonomic dysfunction and reduced HRQoL is prevalent in sufferers with PASC and bear high similarity to those with POTS. This is in keeping with the often‐observed post‐viral illness‐mediated POTS. Our data calls for routine involvement of autonomic physicians in the care of subjects with PASC.
Supporting Documents

OP‐23A‐1‐AT (TRACK 9 ‐ AT 3)
Catheter ablation of cardiac arrhythmias during COVID‐19 pandemic in Cambodia
Mam Chandara
Calmette Hospital, Phnom Penh, Cambodia
Abstract
Catheter ablations of cardiac arrhythmias are nowadays frequently guided by electro‐anatomic mapping systems. Technical staff with medical training, or medical staff with technical training, is needed to assist the operator. Travel restrictions because of current COVID‐19 pandemics have limited the in person availability for technical support staff. These limitations make us to perform the feasibility of remote support with an internet based communication platform. A total cardiac arrhythmias 25 patients (Male: 10 cases, Female: 15 cases) with different arrhythmias such as Atrial fibrillation (1 case), Atrial flutter (5 cases), Atrial tachycardia (2 cases), Right and Left Ventricular Arrhythmias (19 cases), having undergone ablation procedures between 2020 to 2022. Acute procedure success was obtained 25 cases, no complications. Our experience with remote support for electro‐anatomic mapping for complex electrophysiological ablation procedures, showed the feasibility and safety of this approach. It increases the availability of technical support for reducing the costs. Remote support for electroanatomic mapping may therefore facilitate continuous care for patients with arrhythmias during the COVID‐19 pandemics. As a result of its advantages beyond COVID‐19 pandemics related problems, it will likely play a greater role in the future.
Keywords: Cardiac arrhythmias, Covid‐19 Pandemic, Electro‐anatomic mapping, Technical remote support.
OP‐23B‐1‐AT (TRACK 9 ‐ AT 3)
Half versus normal saline irrigation for catheter ablation of outflow tract ventricular arrhythmias (HALF)
Fengxiang Zhang 1; Yan Dong1; Hongtao Wang2; Kezhong Ma3; Zhiyu Ling4; Dongsheng Zhao1; Yuegang Wang5; Zhiyong Zhang6; Mingliang Shao7; Hejian Song8; Wei Jiang2; Kai Yang8; Qiushi Chen1; Pipin Kojodjojo9; Minglong Chen1
1 The First Affiliated Hospital with Nanjing Medical University, Nanjing, China; 2The Second Affiliated Hospital of Xi'an JiaoTong University, Xi'an, China; 3Affiliated Hospital of Hubei University of Arts and Science, Xiangyang, China; 4The Second Affiliated Hospital of Chongqing Medical University, Chongqing, China; 5Nanfang Hospital, Southern Medical University, Guangzhou, China; 6The Affiliated Suqian First People's Hospital of Nanjing Medical University, Suqian, China; 7The Affiliated Xuancheng Hospital of Wannan Medical College, Xuancheng, China; 8The First Affiliated Hospital of Kangda College of Nanjing Medical University, Lianyungang, China; 9Asian Heart and Vascular Centre, Singapore
Background: Animal studies demonstrated that deeper lesions could be achieved during radio‐frequency catheter ablation (RFCA) using half saline (HS) compared to normal saline (NS) as irrigation.
Objectives: This study sought to compare the efficiency and safety of HS and NS for irrigation during RFCA of idiopathic outflow tract ventricular arrhythmia (OT‐VA).
Methods: In this multicenter, randomized controlled study, a total of 167 patients undergoing RFCA of OT‐VA were randomized 1:1 to receive HS‐ or NS‐irrigated ablation. Acute success was defined as the absence of induced targeted premature ventricular contraction (PVC) at the end of the procedure. The 6‐month success was defined as a ≥ 80% reduction of pre‐procedural PVC burden.
Results: After excluding 14 lost to follow‐up, 153 patients (77 in HS group and 76 in NS group) were analyzed. Patients in HS group had shorter total ablation time (259.5 ± 155.5 S vs. 355.6 ± 230.7 S, p = 0.04) than that in NS group. The acute and 6‐month success rate were similar between the HS and NS group (92.2% vs. 90.8%, p = 0.75; 90.9% vs. 92.1%, p = 0.79, respectively). No significant difference was observed in the incidence of steam pops between the HS and NS group (2.6% vs. 1.3%, p = 1.00).
Conclusions: Irrigation with HS is similarly effective and safe with NS during OT‐VA ablation. However, irrigation with HS could save the ablation time.
OP‐240‐2‐SDC (TRACK 8 ‐ SDC 2)
Ventricular fibrillation because of early repolarization syndrome concomitant with Wolff‐Parkinson‐White syndrome
Mochamad Faisal Adam 1,2; Dicky Armein Hanafy1,2; Dony Yugo Hermanto1,2; Sunu Budi Rahardjo1,2; Yoga Yuniadi1,2
1 National Cardiovascular Center Harapan Kita, Jakarta, Indonesia; 2Department of Cardiology and Vascular Medicine, Faculty of Medicine Universitas Indonesia, National Cardiovascular Center Harapan Kita, Jakarta, Indonesia
Introduction: Ventricular fibrillation (VF) in Wolf‐Parkinson‐White (WPW) syndrome can occur because of several causes, such as degeneration from atrial fibrillation (AF), iatrogenic, or concomitant with structural or channelopathy disease. Early repolarization syndrome (ERS) could be the cause of VF.
Case Description: A 28‐year‐old man presented to the emergency department with palpitation one hour before admission. ECG confirmed diagnosis pre‐excited AF. After synchronized cardioversion delivered,
ECG showed WPW pattern suggestive left lateral accessory pathway (AP). Radiofrequency ablation for left lateral AP had been successfully performed. However, electrophysiology study after ablation found that.
VF was easily inducible. 12‐lead ECG after that showed no delta waves seen, but there was concave STsegment elevation at V1‐V4, followed with notched J point at inferolateral lead, suggesting malignant pattern of early repolarization. Further examination to find the cause of VF (right ventricle biopsy, cardiac MRI, echocardiography, and Brugada provocation test) showed no abnormality was found.
Conclusion: The cause of VF of this patient was more likely from ERS after excluding every possible.
causes. So the final diagnosis was inducible VF because of ERS concomitant with WPW syndrome.
Keywords: Early repolarization syndrome, ventricular fibrillation, WPW syndrome.
Supporting Documents

OP‐241‐2‐SDC (TRACK 8 ‐ SDC 2)
Fever‐induced Brugada syndrome: The forgotten ST‐segment elevation, insight from rural area
Sabrina Erriyanti 1,2; Mochamad Faisal Adam1; Dony Yugo Hermanto1,3; Dicky Armein Hanafy1; Sunu Budi Rahardjo1; Yoga Yuniadi1
1 National Cardiovascular Center Harapan Kita Hospital, Jakarta, Indonesia; 2Hermina Hospital, Bandar Lampung, Indonesia; 3Pupuk Kaltim Hospital, East Kalimantan, Indonesia
Introduction: Brugada syndrome is an abnormal ECG pattern characterized by coved type ST‐segment elevation pattern (Type 1) in right precordial leads associated with malignant arrhythmia that can lead to sudden cardiac death (SCD). Brugada pattern might appear more prominent in certain situation such as fever. We aim to highlight the importance of identifying fever‐induced‐Brugada in emergency settings especially in rural area such as Indonesia.
Case Illustration: We present 2 cases of a 59‐year‐old man and a 35‐year‐old male with fever >390C. Our first patient in Bontang, Kalimantan had chronic cough accompanied by night sweating for the past 1 month while our second patient in Lampung, Sumatra had right lower abdominal pain for the past 3 days. Both patients' initial ECG showed an rSR’ pattern in V1 and V2, with coved ST segment elevation >2 mm in V1 followed by an inverted T wave consistent with a type 1 Brugada pattern. Laboratory findings of both patients showed leukocytosis of 22.000 and 15.000, respectively. Our first patient was later diagnosed with active tuberculosis infection then subsequently treated with broad‐spectrum antibiotics and anti‐tuberculosis drugs while our second patient was diagnosed with acute appendicitis and underwent appendectomy. Fever resolved within 2 days with normal ECG findings when both patients were no longer feverish.
Conclusion: It is necessary to identify the classical ST‐segment elevation pattern of type 1 Brugada and point out the trigger especially in patients with signs and symptoms of infection so that appropriate treatment can be given.
OP‐242‐2‐SDC (TRACK 8 ‐ SDC 2)
Predictive score for recurrent ventricular arrhythmias in symptomatic Brugada syndrome patients after ICD implantation
Natthinee Mattanapojanat 1; Kittisak Sawanyawisut2; Pattarapong Makarawate3
1 BNH Hospital, Bangkok, Thailand; 2Khon Kaen University, Khon Kaen, Thailand; 3Khon Kaen University, Khon Kaen, Thailand
Objective: Previous studies found abnormal electrocardiographic (ECG) patterns associated with ventricular arrhythmias (VAs) in Brugada syndrome, but the data was limited in asymptomatic patients. This is the largest cohort on factors predictive of VAs in patients with Brugada syndrome in a secondary prevention fashion.
Methods: This is a retrospective single‐center cohort study, included all adult patients with symptomatic Brugada syndrome with an implantable cardioverter‐defibrillator (ICD) implantation during 12.5 years at Khon Kaen University. The interested ECG parameters were analyzed. The primary outcome was the first appropriate ICD therapy recorded by device interrogation. Predictors of ICD therapy were executed by using Cox proportional hazard model and cut‐points were calculated.
Results: There were 105 patients (mean age 52.16 ± 11 years, 99.05% males) who met the study criteria and 60 patients had ICD therapy. A median time to first ICD therapy was 33.5 (range 3–122) months. Three from thirteen ECG factors were independently associated with ICD therapy consisting of aVR sign, corrected Tpeak Tend (Tpec) dispersion, and maximum Tpec duration≥115 msec with an adjusted hazard ratio (HR) of 2.12 (95%confidence interval (CI) 1.09–4.16;p = 0.03), 1.04 (95%CI 1.02–1.05;p < 0.01) and 2.92 (95%CI 1.24–6.89;p = 0.01), respectively. The predictive score was [(0.75*aVR sign) + (0.04*Tpec dispersion) + (1.07*maximum Tpec duration≥115 msec) + (0.06*wide QRS complex in lead V2)], with area under the curve of 0.963. A cut‐point of 2.10 indicated risk of ICD therapy with sensitivity and specificity of 81.7% and 97.8%, respectively.
Conclusion: Our novel predictive score showed excellent discrimination to predict the first appropriate ICD therapy in symptomatic Brugada syndrome patients in the Thailand population.
OP‐243‐2‐SD (TRACK 8 ‐ SDC 2)
Triggers of ventricular fibrillation in patients with Infero‐Lateral J waves
Yuki Komatsu 1; Michel Haïssaguerre2; Akihiko Nogami1; Nobuyuki Sato3; Shinya Kowase4; Tetsuro Takase5; Yukio Hosaka6; Yoshimi Onishi7; Mitsuharu Kawamura7; Ikutaro Nakajima8; Yasuya Inden9; Masaki Ieda1
1 University of Tsukuba, Tsukuba, Japan; 2Centre Hospitalier Universitaire de Bordeaux, Bordeaux, France; 3Asahikawa Medical University, Asahikawa, Japan; 4Yokohama Rosai Hospital, Yokohama, Japan; 5Ayase Heart Hospital, Ayase, Japan; 6Niigata City General Hospital, Niigata, Japan; 7Showa University School of Medicine, Shinagawaku, Japan; 8St. Marianna University School of Medicine, Kawasaki, Japan; 9Nagoya University Graduate School of Medicine, Nagoya, Japan
Objective: Infero‐lateral J waves in the surface electrocardiogram (ECG) are associated with an increased risk of life‐threatening ventricular arrhythmias. The objective of this study was to investigate the elctrocardiographic and electrophysiological features of the onset of ventricular fibrillation (VF) in patients with infero‐lateral J waves.
Materials and Methods: We retrospectively studied 28 premature ventricular contractions (PVCs) triggering VF that was observed in 22 patients (36 ± 16 years old, 19 male) with infero‐lateral J waves. All patients survived recurrent VF episodes. A 12‐lead ECG morphology of VF‐triggering PVCs was documented in all patients.
Results: Location of J‐point elevation at baseline was inferior wall only in 7, lateral wall only in 3, and infero‐lateral in 12 patients. The VF‐triggering PVCs exhibited right bundle branch block configuration in 21 (75%), superior axis deviation in 25 (89%), various QRS duration (range 114–204 ms), and various coupling interval (range 250–374 ms). Endocardial ablation eliminated PVCs in 7 patients. One patient had PVCs that were not successfully ablated endocardially and were controlled by quinidine. Seven patients underwent epicardial mapping/ablation. Of these, VF‐triggering PVCs were eliminated by ablation at the left ventricular (LV) postero‐lateral epicardium in 5 and right ventricular (RV) inferior epicardium in 2 patients, where local abnormal electrograms recorded.
Conclusion: The initiation manner of VF in patients with infero‐lateral J waves appears to have heterogeneous electrocardiographic and electrophysiological characteristics. VF‐triggering activities emanate from the LV as well as RV where possibly corresponds to the arrhythmogenic substrate.
OP‐244‐V‐SDC
Genetic testing in children with Brugada syndrome: Results from a large prospective registry
Luigi Pannone1; Antonio Bisignani1; Randy Osei2; Anaïs Gauthey1; Juan Sieira1; Mark La Meir3; Pedro Brugada1; Gian Battista Chierchia1; Sonia van Dooren2,4; Carlo de Asmundis 1
1 UZ Brussel HRMC, Brussels, Belgium; 2Vrije Universiteit Brussel (VUB), Universitair Ziekenhuis Brussel (UZ Brussel), Clinical Sciences, Research Group Reproduction and Genetics, Centre for Medical Genetics, Brussels, Belgium; 3Cardiac Surgery Department, Universitair Ziekenhuis Brussel – Vrije Universiteit, Brussels, Belgium; 4Vrije Universiteit Brussel (VUB), Universitair Ziekenhuis Brussel (UZ Brussel), Clinical Sciences, Research Group Reproduction and Genetics, Brussels Interuniversity Genomics High Throughput Core (BRIGHTcore), Brussels, Belgium
Objectives: The aim of this study is to define the diagnostic yield of a wide gene panel with ACMG standardized variant classification in a large cohort of pediatric BrS. Furthermore, a correlation between the clinical outcomes and the genetic background of children with BrS in comparison with adult BrS is aimed.
Materials and Methods: All consecutive patients diagnosed with BrS, between 1992 and 2022 were enrolled in the UZ Brussel monocentric BrS registry. Inclusion criteria were: (1) BrS diagnosis; (2) Genetic analysis for BrS performed with a large gene panel and (3) classification of gene variants following current ACMG guidelines. Pediatric patients were defined if ≤12 years of age.
Results: A total of 452 BrS patients were included, 38 pediatric patients and 414 adult patients.
Among children with BrS, 17 patients (44.7%) had a P/LP variant (P+), all in SCN5A gene. No P/LP variants could be identified in 21 (55.3%) pediatric patients (P‐). After a mean follow‐up of 142.7 months, 3 children (7.9%) experienced a VA, treated with appropriate ICD shock. Inappropriate shocks occurred in 3 pediatric patients (7.9%).
At survival analysis, P‐ pediatric patients had higher VA‐free survival during the follow‐up, compared with P+ pediatric patients. There was no difference in VA‐free survival between pediatric and adult BrS patients both without (P‐) and with (P+) a P/LP variant.
Conclusion: In a large BrS cohort, the diagnostic yield for P/LP variants in the pediatric population is 44.7%. P+ children with BrS have a worse arrhythmic prognosis.
OP‐245‐V‐SDC
Clinical values of placing higher intercostal leads in Brugada syndrome: Insights from SADS‐TW registry
Hsinyu Tseng 1; Mu‐Ying Kuo2; Ching‐Yu Julius Chen2; Yen‐Bin Liu2; Cho‐Kai Wu2; Lian‐Yu Lin2; Wen‐Jone Chen2; Junn‐Li Lin2; Ling‐Ping Lai2; Jyh‐Ming Jimmy Juang2
1 National Taiwan University BioMedical Park Hospital, Hsinchu County, Taiwan; 2National Taiwan University Hospital, Taipei, Taiwan
Objectives: Diagnosis of Brugada syndrome (BrS) is based on type 1 morphology (Coved type) in standard intercostal spaces (4th ICS) or higher intercostal spaces (2nd or 3rd ICS). We aimed to investigate the diagnostic accuracy of the higher intercostal leads in Taiwanese population and clarify if there is any difference in clinical presentations, genetic mutation or prognosis.
Materials and Methods: Patients enrolled in Sudden Arrhythmic Death Syndrome‐ Taiwan registry from Janurary 01, 2010 to July 30, 2021 were retrospectively reviewed. 163 patients were enrolled if their ECGs of V1, V2 in 2nd, 3rd and 4th ICS showed type 1 Brugada pattern in at least ≥1 leads. Baseline characteristics, clinical presentations, SCN5A mutation status, cardiovascular mortality were analyzed.
Results: When applied standard leads (V1‐2 in 4th ICS) alone, 56.4% patients could be diagnosed of BrS, the remaining 43.6% patients were only diagnosed by higher leads (V1‐2 in 2nd or 3rd ICS). The mean age of the patients diagnosed by higher intercostal leads was younger compared to the patients diagnosed by standard leads (42.2 ± 14.7 year‐old vs. 46.8 ± 14.6 year‐old, p = 0.048). 27.2% of patients diagnosed by standard leads had hypertension, compared to 4.2% patients diagnosed by higher intercostal leads (p < 0.001). No any difference was observed in clinical presentation, positive family history, SCN5A mutation or mortality (mean follow‐up time = 3.96 ± 3.45 years, p = 0.211) between the two groups.
Conclusion: Higher intercostal leads (V1‐2 in 2nd and 3rd ICS) could significantly increase diagnosis rate (43.6%) in Taiwanese BrS population although it could not affect clinical prognosis.
Supporting Documents

GRAPH 1 Diagnosis Rate of stander intercostal leads (4th ICS) and only higher intercostal leads (3rd and 2nd ICS).
TABLE 1 Baseline Characters
| Lead V1, V2 in 4th ICS (n = 92) | Lead V1, V2 only in 2nd or 3rd ICS (n = 71) | p‐value | |
|---|---|---|---|
| Age – yr | 46.8 ± 14.6 | 42.2 ± 14.7 | 0.048 |
| Male Sex – no. (%) | 80 (87.0%) | 64 (90.1%) | 0.53 |
| Body height – cm | 169.6 ± 1.5 | 168.4 ± 0.8 | 0.45 |
| Body weight – kg | 64.4 ± 1.4 | 65.2 ± 1.6 | 0.93 |
| Hypertension ‐ no. (%) | 25 (27.2%) | 3 (4.2%) | <0.001 |
| Diabetes mellitus ‐ no. (%) | 8 (8.7%) | 2 (2.8%) | 0.121 |
| Hyperlipidemia ‐ no. (%) | 21 (22.8%) | 8 (11.2%) | 0.056 |
| Coronary artery disease ‐ no. (%) | 16 (17.4%) | 7 (9.9%) | 0.171 |
| Family history of syncope, SCD or BrS ‐ no. (%) | 27 (29.3%) | 26 (36.6%) | 0.326 |
| Presentation | |||
| Asymptomatic ‐ no. (%) | 36 (39.1%) | 27 (38.0%) | 0.785 |
| Palpitation ‐ no. (%) | 11 (12.0%) | 11 (14.5%) | |
| Chest discomfort ‐ no. (%) | 19 (20.7%) | 19 (26.8%) | |
| Dyspnea ‐ no. (%) | 2 (2.8%) | 0 (0%) | |
| Syncope ‐ no. (%) | 13 (14.1%) | 8 (11.2%) | |
| Seizure ‐ no. (%) | 2 (2.8%) | 0 (0%) | |
| Sudden death, VT, VF ‐ no. (%) | 9 (9.8%) | 6 (8.5%) | |
TABLE 2 Genetic Mutation
| Lead V1, V2 in 4th ICS (n = 83) | Lead V1, V2 only in 2nd or 3rd ICS (n = 57) | p‐value | |
|---|---|---|---|
| Genetic test | |||
| SCN5A mutation positive | 17 (20.5%) | 9 (15.8%) | 0.483 |
| BrS‐ associated genes Pathogenic or Likely Pathogenic | 33 (39.8%) | 26 (45.6%) | 0.475 |
TABLE 3 Outcome
| Lead V1, V2 in 4th ICS (n = 92) | Lead V1, V2 only in 2nd or 3rd ICS (n = 71) | p‐value | |
|---|---|---|---|
| CV events ‐no. (%) | 16 (17.4%) | 7 (9.9%) | 0.171 |
| All‐cause death ‐ no. (%) | 2 (2.2%) | 0 (0%) | 0.211 |
OP‐246‐1‐VT (TRACK 8 ‐ VT)
Left coronary cusp ablation for epicardial substrates of left ventricular summit arrhythmia
Sermsuke Ruengwittayawong; Wipat Phanthawimol; Peerapat Katekangplu
Cardiac Electrophysiology Unit, Department of Cardiology, Central Chest Institute of Thailand, Nonthaburi, Thailand
Objective: To prove that epicardial substrates in LV summit region could be modified and eliminated transmurally from radiofrequency ablation at the left coronary cusp.
Materials and Methods: A 44‐year‐old man without structural heart diseases was referred for catheter ablation of symptomatic frequent premature ventricular contraction (PVC) manifested as single morphology without salvos of ventricular tachycardia. Twelve‐lead electrocardiographic features were suggestive of epicardial LV summit origin in the vicinity of anterior interventricular vein (Figure 1). Left ventricular outflow tract mapping was performed by using 8‐Fr 3.5‐mm irrigated tip, 1–6‐2 mm interelectrode spacing, bidirectional ablation catheter under retrograde transaortic approach.
Results: Distal bipolar electrode recorded local abnormal ventricular activities (LAVA) at basal margin of the left coronary cusp approximately 11 mm below the left main coronary ostium both during PVC and sinus rhythm. LAVA was the earliest signals during PVC displaying as high‐frequency low‐amplitude potentials distinct from far‐field ventricular electrogram 33 ms preceding QRS onset (Figures 2 and 3). Pacing with variable output failed to capture QRS complex. Radiofrequency energy application at this site acutely terminated and suppressed PVC. LAVA during sinus rhythm was completely abolished after successive attempts of RF energy application (Figures 4 and 5) above and below the left coronary cusp. PVC eventually became non‐inducible.
Conclusion: Epicardial LAVA in the LV summit can be mapped and completely eradicated by using a single catheter approach at the left coronary cusp with measurable procedural endpoints.
Supporting Documents

FIGURE 1 Twelve‐lead electrocardiogram demonstrated sinus rhythm with PVC in bigeminal pattern. PVC displayed a QRS duration of 138 ms, rightward inferior axis, rS pattern in lead V1 with R/S ratio of 0.67, precordial R/S transition in lead V3, R wave pattern break in lead V2 (R/S ratio = 0.54), QS morphology in lead I with steep notch on the downstroke deflection, absence of Q wave in inferior leads, delayed time to maximum deflection of 85 ms in lead II, MDI = 0.61 in precordial leads and Q wave ratio of 1.57 in lead aVL/aVR. All surface electrocardiographic features of PVC were consistent with apical site of epicardial LV summit origin in the vicinity of anterior interventricular vein (inaccessible area).
MDI = maximum deflection index; PVC = premature ventricular contraction.


FIGURE 2 (A) Distal bipolar electrode of 3.5‐mm irrigated tip ablation catheter, 1–6‐2 mm interelectrode spacing, placed at basal margin of the left coronary cusp recorded LAVA both during sinus rhythm and PVC. (B) LAVA was the earliest signal during PVC displaying as high‐frequency low‐amplitude potentials distinct from far‐field ventricular electrogram 33 ms preceding QRS onset (red arrow) and initial fractionated signal buried in the far‐field ventricular potentials during sinus rhythm (blue arrow).
ABLd = distal bipolar electrode of ablation catheter; ABLp = proximal bipolar electrode of ablation catheter; HRA = high right atrial catheter; LAVA = local abnormal ventricular activities; RV = right ventricular apex catheter.

FIGURE 3 Three‐dimensional activation mapping of clinical PVC with manual LAVA signal annotation at the left ventricular outflow tract, right coronary cusp, noncoronary cusp, and left coronary cusp in the right/left anterior oblique and right/left lateral projections. LAVA recorded at basal margin of the left coronary cusp approximately 11 mm below left main coronary ostium was the earliest activation signal preceding QRS onset by 33 ms with sharp QS complex on the unipolar electrogram.
purple tag = left main coronary ostium; yellow tag = His potentials; LAO = left anterior oblique; LL = left lateral, MAP = unipolar recording of the ablation catheter; MAP 1–2 = distal bipolar electrode of the ablation catheter; MAP 3–4 = proximal bipolar electrode of the ablation catheter; RAO = right anterior oblique; RL = right lateral; Other abbreviations as in Figure 1.

FIGURE 4 Surface electrocardiogram and intracardiac electrogram after successive attempts of radiofrequency energy application on the LAVA site, above and below the left coronary cusp. PVC disappeared and became non‐inducible. Initial fractionated signal buried in the far‐field ventricular potentials during sinus rhythm (blue arrow) before ablation was completely eradicated.
Pre‐RFA = before radiofrequency ablation; Post‐RFA = after radiofrequency ablation; Other abbreviations as in Figures 1 and 2.

FIGURE 5 Three‐dimensional electroanatomical mapping in left and right anterior oblique projections revealed all 35 ablation sites both above and under the left coronary cusp. Radiofrequency energy was delivered using power‐controlled mode with temperature limit of 50°C (power 30–35 W, 60–120 seconds, local impedance 155–186 ohms, impedance drop not greater than 10%).
purple tag = left main coronary ostium; red pin = successful ablation site; yellow tag = His potentials.
OP‐247‐1‐VT (TRACK 8 ‐ VT)
Mid to long‐term outcome of left versus right‐sided ventricular ectopic/tachycardia ablation
Julian Cheong Kiat Tay; Chi Keong Ching
NHCS, Singapore
Objectives: This study aims to compare outcomes of left versus right‐sided ventricular ectopic (PVC) or ventricular tachycardia (VT) following acutely successful ablation.
Methods: 245 patients (117 left‐sided) who underwent PVC/VT ablation since 2018 were prospectively included. Patients were categorized into either Left or Right‐sided PVC/VT depending on the earliest local activation on intracardiac electrogram or substrate mapping. Primary outcome was all‐cause mortality. Secondary outcome included 1‐year arrhythmia recurrence.
Results: Patients with left‐sided PVC/VT were more likely older, males with diabetes, hypertension, hyperlipidemia, ischemic or valvular heart disease, lower LVEF, prior ICD implantation, on antiarrhythmic drugs, as well as VT as indication for ablation (all p < 0.001).
In‐hospital mortality was 1.6% and 5.3% at 1‐year. Left‐sided ablations were associated with higher complications (p = 0.002), 3‐month (p = 0.01) and 1‐year mortality (p = 0.016) but not in‐hospital mortality (p = 0.051). Overall 1‐year recurrence rate was 10.1% which was not significantly different. On univariate analysis, left‐sided origin, age, hypertension, prior MI, VHD, prior ICD, longer radiofrequency, procedure and fluoroscopy time were associated with 1‐year mortality, but was not significant on multivariate analysis. Mitral valve prolapse (MVP) was associated with higher 1‐year arrhythmia recurrence (OR 6.24; 95%CI 1.51–25.83, p = 0.012) on multivariate analysis.
Conclusion: Patients undergoing left‐sided PVC/VT ablations were expectedly at higher risk of complications with a trend toward increased in‐hospital mortality because of underlying comorbidities. However, long‐term success is comparable to right‐sided ablations. Further studies are required to evaluate MVP as a predictor for PVC/VT recurrence in the context of possible underlying malignant MVP syndromes.
Supporting Documents
TABLE 1 Outcomes
| Variables | Total (n = 245) | Right‐sided (n = 128) | Left‐sided (n = 117) | p‐value |
|---|---|---|---|---|
| In‐hospital all‐cause mortality | 4 | 0 | 4 | 0.051 |
| Complication (%) | 8 | 0 | 8 | 0.002 |
| Cardiac tamponade | 4 | |||
| New AV Block | 1 | |||
| Inadvertent RV puncture (epicardial approach) | 1 | |||
| APO | 1 | |||
| Stroke | 1 | |||
| 3‐month all‐cause mortality (%) | 4 | 0 | 4 | 0.01 |
| Variables | Total (n = 188) | Right‐sided (n = 95) | Left‐sided (n = 93) | p‐value |
| 1‐year all‐cause mortality (%) | 10 | 1 | 9 | 0.016 |
| Recurrent symptoms (%) | 31 | 21 | 11 | 0.095 |
| Recurrence of arrhythmia (%) | 19 | 12 | 7 | 0.143 |
| Redo ablation | 3 (9.7) | 2 (0.0) | 1 (29.2) | 0.530 |
OP‐248‐1‐VT (TRACK 8 ‐ VT)
Impact of novel double‐balloon technique for epicardial ventricular arrhythmias refractory to conventional chemical ablation
Shin Hasegawa; Kazuo Kato; Hiroki Yabuta; Yukihiro Uehara; Shun Kikuchi; Akimitsu Tanaka; Miyuki Ando; Hidekazu Aoyama; Hiroko Goto; Ryosuke Kametani
Nagoya Tokushukai General Hospital, Kasugai, Japan
Objective: Ethanol injection to the coronary vein (CV) (EICV) has become alternative options to the refractory ventricular arrhythmias (VA) to the conventional ablation. However, some would be also refractory to the EICV, because of the anatomical limitation that the culprit lesion should have the CV which can be cannulated and without collateral flows bypassing ethanol.
We investigated the feasibility of the alternative EICV using double‐balloon technique (Heart rhythm 2020;17: 2126‐34) to the VA without optimal CV.
Methods: VA in 4 patients originated from left ventricular (LV) summit and 1 patient from apical epicardium.
All patients who were refractory to RFCA were considered to treat with EICV. However, all patients had rich collateral branches which drained ethanol away off in anterior interventricular vein (AIV) or mid‐cardiac vein (MCV), which suggested we could not perform EICV by using conventional methods. We placed two balloons in tandem where the culprit site, and injected the ethanol between both balloons. We injected 10 ml of an ethanol in each patient.
Result: The median observation period was 185.6 ± 217.0 days, and VA in 4 out of 5 patients cured. We experienced no harmful adverse event during all through the procedures.
Conclusion: The double‐balloon technique for VAs might be effective that were refractory to conventional EICV.
Supporting Documents

OP‐249‐1‐VT (TRACK 8 ‐ VT 1)
Effects of ablation on right ventricular function in right ventricular outflow tract premature ventricular complexes
Jae‐Sun Uhm 1; Je‐Wook Park1; Hee Tae Yu2; Tae‐Hoon Kim2; Boyoung Joung2; Hui‐Nam Pak2; Moon‐Hyoung Lee2; In‐Soo Kim3; Jong Youn Kim3
1 Yongin Severance Hospital, Yonsei University, Yongin, South Korea; 2Severance Hospital, Yonsei University, Seoul, South Korea; 3Gangnam Severance Hospital, Yonsei University, Seoul, South Korea
Background: The relationship between the presence of premature ventricular complexes (PVCs) and right ventricular (RV) dysfunction, and the effects of radiofrequency catheter ablation (RFCA) on RV function are unknown.
Methods: A total of 110 patients (age, 50.8 ± 14.4 years; 30 men) without structural heart disease who had undergone RFCA for RV outflow tract (RVOT) PVCs were retrospectively included. RV function was assessed using fractional area change (FAC) and global longitudinal strain (GLS) before and after RFCA. Clinical data were compared between the RV dysfunction (n = 63) and preserved RV function (n = 47) groups. The relationship between PVC burden and RV function was analyzed. Change in RV function before and after RFCA was compared between patients with successful and failed RFCA.
Results: PVC burden was significantly higher in the RV dysfunction group than in the preserved RV function group (p < 0.001). FAC and GLS were significantly worse in proportion to PVC burden (p < 0.001 and p < 0.001, respectively). The risk factor associated with RV dysfunction was PVC burden [odds ratio (95% confidence interval), 1.092 (1.052–1.134); p < 0.001]. Improvement in FAC (13.0 ± 8.7% and − 2.5 ± 5.6%, respectively; p < 0.001) and GLS (−6.8 ± 5.7% and 2.1 ± 4.2%, respectively; p < 0.001) was significant in the patients with successful RFCA, compared to the patients in whom RFCA failed.
Conclusions: Frequent RVOT PVCs are associated with RV dysfunction. RV dysfunction is reversible by successful RFCA.
Supporting Documents

OP‐250‐1‐VT (TRACK 8 ‐ VT 1)
Short‐term and long‐term effects of noninvasive cardiac radioablation for ventricular tachycardia
Myung‐Jin Cha 1; Won Ick Chang2; Ha Hye Jo1; Ji Hyun Chang2; Chang Heon Choi2; Hak Jae Kim2; Seil Oh2; Clifford Robinson3; Phillip Cuculich3
1 Asan Medical Center, Seoul, South Korea; 2Seoul National University Hospital, Seoul, South Korea; 3Washington University, St Louis, United States
Objective: Noninvasive cardiac radioablation is reported to be effective and safe for the treatment of ventricular tachycardia (VT). This study aimed to analyze the acute and long‐term effects of VT radioablation.
Methods: Patients with intractable VT or premature ventricular contraction (PVC)‐induced cardiomyopathy were included in this study and treated using a single‐fraction 25 Gy dose of cardiac radioablation. To quantitatively analyze the acute response after treatment, continuous electrocardiography monitoring was performed from 24‐hour before to 48‐hour after irradiation and at the 1‐month follow‐up. Long‐term clinical safety and efficacy were assessed one year follow‐up.
Results: From 2019 to 2020, six patients were treated with radioablation for ischemic VT (n = 3), non‐ischemic VT (n = 2), or PVC‐induced cardiomyopathy (n = 1). In the short‐term assessment, the total burden of ventricular beats decreased by 49% within 24‐hour after radioablation and further decreased by 70% at 1‐month. The VT component decreased earlier and more dramatically than the PVC component (decreased by 91% and 57% at 1‐month, respectively). In the long‐term assessment, five patients showed complete (n = 3) or partial (n = 2) remission of ventricular arrhythmias. One patient showed recurrence at 10‐month, which was successfully suppressed with medical treatment. The post‐treatment PVC coupling interval was prolonged (+38 msec at 1‐month). Ischemic VT burden decreased more markedly than non‐ischemic VT burden after radioablation.
Conclusion: In this prospective phase I/II study of 6 patients, without a comparison group, cardiac radioablation appeared to decrease intractable VT burden. A therapeutic effect was apparent within 1–2 days after treatment but was variable by etiology of cardiomyopathy.
OP‐251‐1‐VT (TRACK 8 ‐ VT 1)
Characteristics of pulmonary sinus cusp reentrant VT in structurally normal heart
Ankit Jain
VMMC and Safdarjung Hospital, South Delhi, India
Objectives: To identify characteristics of Supravalvular reentrant VT in structurally normal heart.
Materials and Methods: 18 consecutive patients with idiopathic outflow tract VPC/VT were analyzed. RV and pulmonary cusp angiography were done to precisely localize pulmonary valve and pulmonary sinus cusp. Activation mapping an entrainment mapping was performed above and below the valve whenever possible.
Results: In 16 patients' activation and pace mapping identified earliest activation site below the pulmonary valve and ablation there eliminated the VPCs. In 2 patients earliest activation site was below the pulmonary valve (55 ms and 46 ms earlier then QRS onset) but ablation there was failed. Pleomorphic QRS morphology was also identified in both of these patients Mapping of supravalvular pulmonary sinus cusp with reveres U curve on ablation catheter was done, mid‐diastolic signals were noted and concealed entrainment was seen. Ablation there made the arrhythmia non‐inducible in both these patients. Pleomorphic QRS morphology and failure of ablation at the sufficiently early site may give a clue to reentry at the remote site.
Conclusion: Pulmonary sinus cusp reentry can be identified and ablated in structurally normal hearts by reverse U curve in ablation catheter.
Supporting Documents

FIGURE 1 VT‐induced showed pleomorphic QRS morphology.

FIGURE 2 Concealed entrainment at supravalvular left pulmonary cusp.

FIGURE 3 Reverse U curve at left pulmonary cusp.
OP‐252‐1‐VT (TRACK 8 ‐ VT 1)
Does high‐density mapping improve the efficacy of ablation of papillary muscle arrhythmias?
Sri Sundaram 1; William Choe1; Austin Davies2; Ryan Jordan1; Jehu Matthew1; Daniel Alyesh1
1 South Denver cardiology, Littleton, United States; 2Abbott, Chicago, United States
Background and Objective: The ablation of premature ventricular contractions (PVCs) originating from the papillary apparatus presents unique challenges related to complex anatomy with multiple papillary heads and chordae, with relatively higher rates of recurrence. The objective is to understand the impact of high density (HD) activation mapping on the efficacy of ablation procedures of PVCs originating from the papillary apparatus.
Methods: From 10/25/18 to 11/17/21, there were 39 consecutive ablations performed in 36 patients for PVCs originating from the papillary apparatus (29 posteromedial, 10 anterolateral) performed at a single center. A control group (15 cases) was compared against a study group (24 cases) with HD mapping. HD mapping was defined as using the Advisor HD Grid (20 cases) and Pentaray (4 cases) mapping catheters.
Results: The average age was 71 +/− 13 years, with 10 females (25.6%), LVEF of 48% +/− 12, and an average pre‐procedure PVC burden of 25.5% +/−12.6. HD mapping was associated with better procedural success at 3 months post‐ablation when comparing study to control groups (78.8%, 14/18 vs 53.3%, 8/15; p = 0.005). There was no statistically significant difference in acute procedural success (91.3%, 21/23 vs 87.5%, 12/15; p = 0.08). There were no complications in either arm.
Conclusion: HD mapping is safe to use in ablation of PVCs originating from the papillary apparatus and is associated with a better three‐month ablation outcome when compared to traditional methods. This may be related to more accurate identification of the site of origin and lesion placement.
OP‐254‐1‐VT (TRACK 8 ‐ VT 3)
A case of recurrent ventricular tachycardia in methamphetamine‐associated and ischemic cardiomyopathy
Mark John Sabando 1; Giselle Gervacio2; Frederick Philip Gloria3; Jaime Alfonso Aherrera3; Ace Samson3; Rosa Silvana Bascuña4; Amraphel Nicolas4
1 Division of Cardiovascular Medicine, Department of Medicine, University of the Philippines – Philippine General Hospital, Manila, Philippines; 2Section Head, Section of Electrophysiology, Division of Cardiovascular Medicine, Department of Medicine, University of the Philippines – Philippine General Hospital, Manila, Philippines; 3Section of Cardiac Catheterization and Interventions, Division of Cardiovascular Medicine, Department of Medicine, University of the Philippines – Philippine General Hospital, Manila, Philippines; 4Deparment of Internal Medicine, University of the Philippines – Philippine General Hospital, Manila, Philippines
Objectives: We present a case of an elderly male with amphetamine use presenting with acute coronary syndrome and recurrent ventricular tachycardia who underwent successful revascularization and eventual implantable cardioverter‐defibrillator placement.
Results: A 66‐year‐old male, hypertensive, smoker with a history of chronic amphetamine abuse presented to the emergency room with sudden dyspnea. Electrocardiogram showed anterior and inferior wall ST‐elevation myocardial infarction for which he underwent coronary angiogram showing one vessel disease and percutaneous transluminal coronary angioplasty with stenting of left anterior descending artery. He eventually developed monomorphic ventricular tachycardia with right bundle branch block morphology necessitating electrical cardioversion and went into cardiogenic shock. Subsequent coronary angiogram showed patent stents. Urinary toxicology for methamphetamine was positive. Echocardiography showed dilated left ventricle with reduced systolic function (25%). He underwent intra‐aortic balloon pump and temporary pacemaker insertion for overdrive pacing. He was eventually weaned off from mechanical ventilation, inotropic and mechanical circulatory support, and discharged improved on guideline‐directed medical therapy.
A month later, he presented at the ER for chest heaviness. ECG showed old anteroseptal wall infarct. CA showed patent stents. Myocardial perfusion scintigraphy showed scarred myocardium in the apex, apical and midventricular inferior segments. He had a recurrence of monomorphic VT. He then underwent successful single lead ICD implantation and was sent home improved and stable.
Conclusion: Methamphetamine‐associated cardiomyopathy leads to severe systolic function, left ventricular dilation, enhanced atherosclerotic plaque formation, and susceptibility to cardiac arrhythmias. ICD implantation is valuable in preventing sudden death in patients with sustained ventricular tachycardia.
OP‐255‐1‐VT (TRACK 8 ‐ VT 2)
Intra aortic balloon pump as bridging therapy in acute myocardial infarction complicated with ventricular storm
Ahmad Handayani 1, Kamal Khairazi Ilyas2,3, Anggia Chairuddin Lubis2,3
1 Faculty of Medicine, Universitas Muhammadiyah Sumatera Utara, Medan, Indonesia; 2Adam Malik General Hospital, Medan, Indonesia; 3Universitas Sumatera Utara, Medan, Indonesia
Objectives: The objective is to report a case of a patient with acute anterior extensive STEMI complicated with incessant ventricular arrhythmia who is intolerant of antiarrhythmic drug during acute period.
Materials and Methods: A 40‐year‐old male was referred from rural hospital with late onset acute anterior extensive STEMI complicated with cardiogenic shock. Previously he had an unstable ventricular tachycardia (VT) and converted with electrical cardioversion. He was referred with reduced left ventricular function and unstable hemodynamic.
The patient underwent urgent revascularization, however VT storm occurred, and electrical cardioversion was performed multiple times. More challenges occurred when he could not tolerate amiodarone as well as heart failure medication pillars even after hemodynamic improved. Catheter ablation strategy was also considered, however considering its efficacy and risk in this scenario a decision to optimize medical approach was justified.
A decision to use Intra Aortic Balloon Pump (IABP) as bridging therapy was made. After the IABP insertion, hemodynamic condition was improved, and the patient can tolerate heart failure and antiarrhythmic medication better. After 5 days, the IABP was removed, and no more significant arrhythmias found during follow‐up.
Results: In this case, the use of IABP as bridging therapy to tolerate medication better by improving hemodynamic condition is justified with good clinical outcomes. The patient can tolerate medication better and arrhythmias were dissolved.
Conclusion: Management strategy for ventricular storm during acute myocardial infarction is limited. IABP is an alternative solution as bridging therapy to improve patient's tolerability in unstable hemodynamic condition.
Supporting Documents

FIGURE 1 ECG ion Admission shows ST elevation in V3‐V6.

FIGURE 2 VT in ICCU.
OP‐256‐1‐VT (TRACK 8 ‐ VT 2)
Conduction abnormality associated with abrupt change in paced‐QRS morphology in scar‐mediated ventricular tachycardia
Yuichi Hanaki; Yuki Komatsu; Akihiko Nogami; Masaki Ieda
Department of Cardiology, Faculty of Medicine, University of Tsukuba, Tsukuba, Japan
Objectives: An abrupt change in paced‐QRS morphologies from poor to excellent match may be found at the critical isthmus of scar‐mediated ventricular tachycardia (VT). We hypothesized that the abrupt change in pacemap morphology would be generated by conduction abnormality characterized as wavefront discontinuity in functional substrate mapping. The aim of this study was to investigate this hypothesis.
Material and Methods: We retrospectively studied 15 patients (66 ± 16 years, 13 male, 9 nonischemic) who underwent high‐density substrate mapping and pace‐mapping. Eighteen VTs whose critical sites were determined by direct termination during ablation (n = 9) or pace‐mapping findings (n = 9) were assessed. The pacemap score between waveforms of VT and pace‐mapping, stimulus to QRS interval (S‐QRS), and conduction velocities along the presumed isthmus were evaluated.
Results: Pace‐mapping scores, which were obtained at two adjacent sites along the presumed isthmus, showed 94% (interquartile range [IQR] 88–97%) at the exit side and 45% (IQR 33–55%) at the adjacent entrance side. There was no significant difference in S‐QRS interval at these sites (median 77 ms vs. 93 ms, p = 0.30). Conduction velocity at the presumed isthmus was 0.11 m/sec (IQR 0.07–0.19 m/sec), which was significantly slow than that at areas of exit (0.43 m/sec [IQR 0.18–0.83 m/sec]) and entrance (0.37 m/sec [IQR 0.24–0.69 m/sec]) (p < 0.05 for both).
Conclusion: Abrupt transition of pace‐mapping morphologies appears to be observed across the area with a decent activation slowing and wavefront discontinuity in functional substrate mapping, which may facilitate targeted substrate ablation.
OP‐257‐1‐VT (TRACK 8 ‐ VT 2)
Quinine in place of quinidine for polymorphic VT storm in patients with coronary heart disease
Anand Yadav Pasula, Anindya Ghosh, Ulhas M. Pandurangi, Uday Sankar Das
The Madras Medical Mission Hospital, Chennai, India
Objectives: To study whether Quinine is effective in place of Quinidine in patients with Coronary artery disease and polymorphic Ventricular Tachycardia (VT) storm without active Ischemia when they turn out refractory to usual agents. Quinidine is unavailable in many countries. Quinine is an optical isomer of Quinidine, and has similar effects on conduction time but does not prolong epicardial repolarization time or ventricular refractoriness.
Methods: Quinine was administered in patients with Polymorphic VT storm triggered by short coupled PVCs, post‐MI/ Revascularization beyond 48 hours, and without evidence of active ischemia. VT was refractory to at least beta‐blocker, amiodarone, mexiletine, lidocaine, and Stellate ganglion blockade.
Results: Total of 4 patients who had Polymorphic VT storm triggered by short coupled PVCs, post‐MI, and Revascularization beyond 48 hours were included in the study. All of them received four anti‐arrhythmic drugs and had undergone stellate ganglion block. Quinine was added when all the above measures failed to suppress the electrical storm. All of them are male and had anterior wall myocardial infarction with a mean age of 52.75 + 4.27 years. Mean duration from post revascularization to onset of VT storm 72 + 33 hours. Mean time from onset of VT storm to initiation of quinine 24 + 4.8 hours and dose received1275 + 150 mg/day. The mean time to attain electrical quiescence after initiation of quinine 67 + 6 hours. Three patients survived to discharge.
Conclusion: Quinine is an effective alternative to Quinidine in Arrhythmic storm with recurrent polymorphic VT in patients with coronary disease when other measures are failed.
Supporting Documents

OP‐258‐1‐VT (TRACK 8 ‐ VT 2)
Role of percutaneous stellate ganglion blockade in the treatment of electrical storm: Single‐center experience
Anand Yadav Pasula; Anindya Ghosh; Ulhas M. Pandurangi; Vishnu Priya Ravi
The Madras Medical Mission, Chennai, India
Objectives: To study the efficacy and outcomes of percutaneous stellate ganglion blockade (SGB) in the patients with drug‐refractory electrical storm.
Methods: The study included patients with a drug‐refractory electrical storm. At least two anti‐arrhythmic drugs (AAD) were given before SGB. Bupivacaine was injected in the vicinity of the stellate ganglion under Ultrasound guidance.
Results: A total of 73 procedures were performed on 52 patients (71% males, 60 + 6 years) 0.82% (43/52) had ischemic heart disease. Nearly 69%(36/52) of patients were free from ventricular arrhythmias (VA) at 24 hours after GB and 53%(28/52) were arrhythmia free at 72 hours. Bilateral SGB was done in 16 patients who had failed left‐sided SGB with a success rate of 37%. Heart failure and shock were documented in 65% and 57% respectively. Twenty Four (46%) patients were on both Intra‐aortic balloon counterpulsation and inotrope support. All‐cause mortality was 32% (17/52). Cardiovascular mortality was 28% (15/52). Septic shock in one patient and Ischemic brain stroke was the cause of death in the other patient. All patients who were arrhythmia free after 72 hours of SGB survived to discharge.VA recurrence, poor left ventricular ejection fraction, and failed stellate ganglion blockade were associated with increased mortality. Procedure‐related complications like transient bradycardia (17%), hematoma (15%), hoarseness of voice (13%), persistent ptosis (6%), and monoparesis (6%) were noted, all of which were resolved within two weeks of post‐procedure.
Conclusion: In patients with electrical storms SGB helps to stabilize them hemodynamically, and provides time for titration of the drugs. It acts as bridge therapy before radiofrequency ablation.
OP‐259‐1‐VT (TRACK 8 ‐ VT 2)
Impact of Interelectrode spacing on appearance of functional substrate mapping in scar‐related ventricular tachycardia
Yuto Iioka; Yuki Komatsu; Yuuichi Hanaki; Yasutoshi Shinoda; Akira Kimata; Hiro Yamasaki; Miyako Igarashi; Akihiko Nogami; Masaki Ieda
University of Tsukuba, Tsukuba, Japan
Objective: As the arrhythmogenic substrate of scar‐related ventricular tachycardia (VT) often has three‐dimensional nature, a detailed substrate mapping to assess conduction property on not only the surface of mapping chamber but also intramural myocardium is of importance to identify the ablation target. The objective of this study was to investigate the impact of interelectrode bipolar spacing on appearance of substrate map.
Material and Methods: We retrospectively examined 9 patients (72 ± 6 years, 8 males) who underwent ablation of scar‐related VT. A high‐density substrate mapping during sinus rhythm or ventricular paced rhythm was performed with a linear decapolar (1‐mm electrode size and 2–8‐2–mm interelectrode spacing) in all patients. The pattern of wavefront propagation in substrate mapping was compared between closely‐ and widely‐spaced bipolar electrode maps (CEM and WEM [2‐mm and 8‐mm interelectrode spacing, respectively]).
Results: Among 9 patients, 8 had substrate map depicting the area of activation slowing, wavefront discontinuity, and/or rotational activation pattern. Of these, one patient exhibited no difference between CEM and WEM. In two patients, wavefront propagation was identified in WEM at dense scar area but no obvious potential recorded in CEM. In five patients, WEM showed area with activation slowing that was generated by local fractionated continuous electrograms, where CEM showed wavefront discontinuity as characterized with less‐fractionated split potentials.
Conclusion: CEM that reduces a far‐field effect in scar may demonstrate activation pattern at the mapping surface; however, WEM has a potential to serve as additional information to unveil intramural abnormal conduction at the area of interest.
OP‐260‐1‐VT (TRACK 8 ‐ VT 2)
Epicardial access with CO2 insufflation: A simplified method using injection system meant for peripheral intervention
Suraya Hani Kamsani 1; Yogesh Hiware2; Rohith Stanislaus1; Zunida Ali1; Noor Asyikin Sahat1; Amirzua Ahmad Said1; Azlina Daud1; Gina Dayang Manit1; Halmy Aziman1; Surinder Kaur1; Azlan Hussin1
1 Electrophysiology Unit, Department of Cardiology, National Heart Institute, Kuala Lumpur, Malaysia; 2Abbott (Malaysia), Kuala Lumpur, Malaysia
Background: Accidental right ventricular puncture is a common complication with “dry” percutaneous epicardial access. A method to reduce this is by creating a “safety buffer” between the pericardium and myocardium.
Objectives: We describe 4 patients who underwent VT ablation using pericardial carbon dioxide (CO2) insufflation technique from March to July 2022. An automated CO2 injection system meant for peripheral vascular intervention was used in 3 patients.
Methods: All patients were male (mean age: 52.5 +/− 17.8 years). Femoral venous access into the Coronary Sinus (CS) was obtained for 2 patients whereas right internal jugular vein was used in 1 patient. A decapolar catheter was inserted through a steerable sheath to cannulate the CS. The sheath was then advanced over the catheter which was removed prior to CS venogram. A coronary guidewire and microcatheter were used for intentional perforation of a distal CS branch. Epicardial access was confirmed with contrast injection. CO2 was then injected into the pericardial space via a modified connecting tube from a dedicated injection system in 3 patients.
Results: Mean procedural time was 248.75 +/− 56.03 minutes. An average volume of 38.97+/− 13.72 cc of CO2 was used. The illuminated epicardial space was accessed under fluoroscopy, and the initial guidewire exchanged to a deflectable sheath. The epicardial sheath was then connected to a negative pressure bottle for drainage, and the pericardial space was subsequently mapped. There was no procedural complication noted.
Conclusion: Insufflation of CO2 into the pericardial space facilitates safe percutaneous epicardial access for VT ablation.
OP‐262‐1‐VT (TRACK 8 ‐ VT 3)
Epicardial VT ablation IN a patient with dense pericardial adhesions
Malav Jhala; Preetam Krishnamurthy; Auras Atreya; Sachin Yalagudri; Daljeet Kaur Sagoo; Calambur Narasimhan
AIG Hospitals, Hyderabad, India
“Abstract submitted under supporting document”.
Introduction: Radiofrequency catheter ablation (RFCA) is the first‐line therapy for treatment of drug‐refractory ventricular arrhythmias (VAs). Epicardial VT circuits may be ablate from the pericardial space or the coronary venous system.
Case Presentation: A 35‐year‐old male with non‐ischemic cardiomyopathy, with epicardial scar over lateral wall of left ventricle (cardiac MRI), presented with recalcitrant VT. PET imaging did not show any myocardial uptake. Previous Endocardial and epicardial mapping was unsuccessful and he was referred to our institution. Upfront subxiphoid pericardial access was obtained as the VT ECG revealed an epicardial origin. However, dense adhesions were encountered. We then engaged the coronary sinus (transfemoral medium curl, Agilis sheath, with 6F IMA catheter) and mapped the lateral tributaries where epicardial VT exit was suspected. Wire mapping (0.014” BMW wire) was performed as the target veins were too small to accommodate EP mapping catheters. Early electrograms were identified during clinical VT (activation mapping) and retrograde coronary venous ethanol ablation (RCVEA) was performed using a 1.25 × 10 mm OTW balloon with balloon occlusion (2 injections of 0.6 and 1 mL absolute alcohol). No VT was induced after RCVEA.
Conclusion: In the setting of pericardial adhesions, options include catheter‐adhesiolysis or surgical dissection, both of which can have hemorrhagic complications. The coronary venous system offers excellent access to the LV myocardium, and catheter or wire mapping can be performed (based on vein size). We highlight the role of wire mapping and RCVEA in sites where traditional catheter access is challenging.
Supporting Documents

FIGURE A The fluoroscopic images of the Alcohol ablation are shown. Image 1 Reveals the dense pericardial adhesions on attempted pericardial access. Image 2 shows the mapping of the target veins with the 0.014” BMW wires. Image 3 shows the alcohol instillation with balloon inflation in the target vein. Image 4 shows the final injection after alcohol ablation.

FIGURE B The Event ECG of the patient suggestive of an Epicardial scar VT.
OP‐263‐1‐VT (TRACK 8 ‐ VT 3)
Spiked‐helmet sign: A prelude to polymorphic ventricular tachycardia
Stephen Albert De Castro 1; Raymond dela Cruz1; Isaiah Lugtu2
1 Metropolitan Medical Center, Metro Manila, Philippines; 2Chinese General Hospital, Metro Manila, Philippines
Objective: The Spiked‐helmet sign is an electrocardiographic marker usually associated with critical illness and poor prognosis. Our aim is to shed some light on its pathogenesis and possible electrophysiologic consequences.
Case Presentation: We present a case of an 80‐year‐old woman with severe low flow low gradient aortic stenosis complicated by acute rapid atrial fibrillation and congestive heart failure. She was given an intravenous amiodarone infusion for rhythm conversion. However, she developed frequent runs of non‐sustained and sustained polymorphic ventricular tachycardia on cardiac monitor. Defibrillation at 200 J biphasic was delivered successfully. A repeat twelve lead electrocardiogram showed sinus rhythm with spiked helmet sign, prolonged Qt interval and polymorphic ventricular tachycardia (Figure 1, 2). Intravenous infusion of magnesium sulfate, correction of electrolytes, and withdrawal of amiodarone and other QT‐prolonging drugs brought regression of the spiked‐helmet sign with no recurrence of polymorphic ventricular tachycardia (Figure 3).
Conclusion: Our observation suggests that the spiked‐helmet sign is a prelude to polymorphic ventricular tachycardia. Intravenous magnesium is an effective treatment to stabilize the cardiac membrane, while correction of electrolytes and removal of QT‐prolonging drugs reverses this electrocardiographic abnormality.
Supporting Documents

FIGURE 1 Intermittent runs of polymorphic ventricular tachycardia (black arrow) interspersed with periods of sinus rhythm with “Spiked‐helmet” Sign (dashed arrow) and prolonged Qt interval of 0.48 sec.

FIGURE 2 12 L ECG after IV magnesium infusion showed sinus tachycardia with Spiked‐helmet Sign and a markedly prolonged Qtc interval of 0.69 sec.

FIGURE 3 Repeat ECG prior to discharge showed resolution of the Spiked‐helmet Sign with a Qtc interval of 0.36 sec.
OP‐264‐1‐VT (TRACK 8 ‐ VT 3)
Repeated stellate ganglion blockade for the treatment of electrical storm in patients with nonischemic cardiomyopathy
Chang Cui; Xiaokai Zhou; Yue Zhu; Minglong Chen
The First Affiliated Hospital of Nanjing Medical University, Nanjing, China
Objectives: This study sought to describe our institutional experience with providing repeated percutaneous stellate ganglion blockade (R‐SGB) as a treatment for drug‐refractory electrical storm in patients with nonischemic cardiomyopathy (NICM).
Materials and Methods: This study included 8 consecutive patients who had drug‐refractory electrical storm and underwent R‐SGB between June 1, 2021, and January 31, 2022. Lidocaine (10 mL, 1%) was injected in the vicinity of the left stellate ganglion under the guidance of ultrasound, once per day for 7 days. Data were collected for patient clinical characteristics, immediate and long‐term outcomes, and procedure‐related complications.
Results: Totally, 5 patients with dilated cardiomyopathy, 2 patients with arrhythmogenic right ventricular cardiomyopathy and 1 patient with hypertrophic cardiomyopathy were enrolled. Clinical characteristics included age, 51.5 ± 13.6 years; men, 100%; and left ventricular ejection fraction, 37.8 ± 6.6%. After the treatment of R‐SGB, 75% of patients were free of electrical storm. 24 h Holter monitoring showed a significant reduction in ventricular tachycardia (VT) episodes from 43 [13.25, 276.25] to 1 [0.25, 34.00] first day following R‐SGB (p < 0.05) and 0.5 [0.00, 19.25] after whole R‐SGB process. There were no procedure‐related major complications. The mean follow‐up was 4.8 ± 1.1 months, and the median time of recurrent VT was 2 months.
Conclusion: Minimally invasive R‐SGB was a safe and effective method to attenuate electrical storm in patients with NICM.
Supporting Documents

OP‐265‐V‐VT
Electrocardiographic characteristics of idiopathic ventricular arrhythmias difficult to eliminate by catheter ablation from RVOT endocardium
Yoshiaki Inoue; Kinya Shirota; Hiroshige Ishii; Takashi Shimizu; Yoichiro Iwasaki; Daiki Tsujimoto; Fumiyasu Hirano
Matsue Red Cross Hospital, Matsue, Japan
Objective: QRS morphology of left bundle branch block (LBBB) and inferior axis pattern might indicate ventricular arrhythmias (VAs) originating from right ventricular outflow tract (RVOT). However, some cases were difficult to ablate VAs from RVTO endocardium and required additional catheter ablation (ABL) measures. The aim of this study was to evaluate electrocardiographic (ECG) to distinguish VAs difficult to eliminate by ABL from RVOT endocardium.
Materials and Methods: Thirty‐one consecutive patients (age 47 ± 14 years, 12 male) who underwent CA of VAs was enrolled in this study. VAs of all patients had LBBB and inferior axis. In 25 cases VAs were eliminated by ablation from RVOT endocardium (S‐group). However, VAs of 6 cases were not (F‐group).
Results: ECG analysis revealed QS pattern in lead I (100%vs 8%; p < 0.0001), lager R‐wave ratio (III/II) (1.19 + −0.11 vs 0.90 ± 0.16; p < 0.001) and Q‐wave ratio (aVL/aVR) (1.62 ± 0.53 vs 0.83 ± 0.41; p < 0.001) were significant in F‐group rather than S‐group respectively. Activation interval between ABL site of RVOT endocardium and QRS onset of VAs was no significant difference between two groups. In 6 patients of F‐group, VAs of one patient was eliminated by re‐do ABL from RVOT endocardium, one required ABL from distal coronary vein, two patients required long‐duration (≥180 sec) radiofrequency ABL from RVOT endocardium, one required bipolar ABL and two patients did not undergo re‐do ABL because of their mild symptoms.
Conclusion: These ECG findings could be useful to predict VAs difficult to eliminate by ABL from RVOT endocardium and the need for additional measures to treat these VAs.
OP‐266‐V‐VT
An unusual cause of bidirectional ventricular tachycardia: Andersen‐Tawil syndrome
Tsun Hung Wong 1; Sit Yee Kwok2; Siu Ling Tsao3
1 Department of Paediatrics and Adolescent Medicine, Tseung Kwan O Hospital, Hong Kong SAR; 2Department of Paediatrics and Adolescent Medicine, Hong Kong Children Hospital, Hong Kong SAR; 3Department of Paediatrics and Adolescent Medicine, University of Hong Kong, Hong Kong SAR
Background: Bidirectional Ventricular Tachycardia (VT) is an unusual rhythm. Its differential diagnoses are limited, but important. Here we introduce a case of asymptomatic bidirectional VT with dysmorphism. The diagnosis was confirmed genetically.
Case: A 14‐year‐old girl was referred by Student Health Service for asymptomatic irregular heartbeat. 12‐lead ECG showed frequent ventricular ectopy with alternating axis, with a normal corrected QT interval of 432 ms. Holter showed 9.2% ventricular ectopy with non‐sustained runs of bidirectional VT. Longest run consisted of 16 beats at a heart rate of 130 per minute. Physical examination showed micrognathia and clinodactyly. She also reported episodes of weakness following prolonged rest. A provisional diagnosis of Andersen‐Tawil Syndrome (ATS) was made and was confirmed by genetic testing with a targeted gene panel. A heterozygous pathogenic variant NM_000891.3 (KCNJ2):c.244C > T p.(Arg82Trp) was identified in the KCNJ2 gene.
Decision Making: ATS is an important channelopathy as a differential diagnosis of bidirectional VT, apart from catecholaminergic polymorphic VT. Recognition of the dysmorphic features and the history of periodic paralysis helped raise suspicion for ATS. Flecainide was effective in reducing the amount of ventricular ectopy in this case.
Conclusion: Detailed history taking and physical examination are crucial in the diagnosis of ATS, which carries a risk of life‐threatening arrhythmic event and has an important genetic implication. Cascade screening is recommended.
Supporting Documents

OP‐267‐V‐VT
Diagnostic validation of smart wearable device embedded with single‐lead electrocardiogram for arrhythmia detection
Hao Wang 1; Yutao Guo2
1 Department of Cardiology, The Second Medical Centre, Chinese PLA General Hospital, Beijing, China; 2Pulmonary Vessel and Thrombotic Disease, Sixth Medical Centre, Chinese PLA General Hospital, Beijing, China
Objective: In this study, we hypothesized that the information obtained with smartphone‐operated single lead ECG can be used to accurately detect AF and common ectopic beats.
Research Design and Methods: Between 2020 Jun and 2021 Apr, 656 subjects (431 males and 225 females) aged from 19 to 93 years (median 65 years) who participated in the Mobile Health [mHealth] Technology for Improved Screening, Patient Involvement and Optimizing Integrated Care in Atrial Fibrillation [MAFA II] Study were enrolled in this study. The validity of smartphone‐embedded single lead ECG a an tool for the detection of arrhythmias including AF and ectopic beats was compared with simultaneously performed 12 lead ECG assessed by cardiologists as the reference standard.
Results: The results show that the screening results of the arrhythmia screening module are highly consistent with those ECG‐based interpretations. Detailed results are as bellows:
Three‐class classification.
For sinus rhythm subjects, recall: 97.6%, precision: 96.5%, F1 score: 97.0%;
For atrial fibrillation subjects, recall: 96.7%, precision: 96.9%, F1 score: 96.8%;
For extrasystole subjects, recall: 92.8%, precision: 94.2%, F1 score: 93.5%;
Macro F1 score: 95.8%.
Four‐class classification.
For sinus rhythm subjects, recall: 97.6%, precision: 96.5%, F1 score: 97.0%;
For atrial fibrillation subjects, recall: 96.7%, precision: 96.9%, F1 score: 96.8%;
For premature atrial contraction subjects, recall: 90.5%, precision: 89.4%, F1 score: 89.9%;
For premature ventricular contraction subjects, recall: 86.1%, precision: 89.6%, F1 score: 87.8%;
Macro F1 score: 92.9%.
Conclusion: The test results are highly consistent with the clinical ECG detection results, which is effective for arrhythmia screening.
OP‐268‐V‐VT
Electrical isolation of abnormal substrate: A new endpoint of ablation in arrhythmogenic right ventricular cardiomyopathy
Nan Wu; Gang Yang; Minglong Chen
The First Affiliated Hospital of Nanjing Medical University, Nanjing, China
Objectives: Benefits of abnormal substrate isolation are uncertain during catheter ablation of ventricular tachycardia (VT) in patients with arrhythmogenic right ventricular cardiomyopathy (ARVC). This observational study aims to explore the feasibility and efficacy of abnormal substrate isolation in ARVC patients with VT.
Materials and Methods: Eight consecutive ARVC patients with VT who underwent catheter ablation and achieved the endpoint of electric isolation of abnormal substrates were included. Induced VTs which were localized by activation, entrainment, and pace maping were eliminated. Detailed voltage mapping was performed during sinus rhythm, and area with fractionated or late potentials were further homogenized. A circumferential linear lesion was deployed along the low‐voltage area border zone and electric isolation was achieved.
Results: All eight patients had extensive endocardial low‐voltage area (114.2 ± 90.8 cm2, 49.8 ± 32.1%) and dense scar (61.1 ± 42.7 cm2, 25.5 ± 15.2%). Stable hemodynamical VTs were induced in 6/8 patients and finally eliminated. Electrical isolation of abnormal substrate was achieved in 5/8 (62.5%) patients via endocardial approach and 3/8 (37.5%) patients via a combination of endocardial and epicardial approach, resulted in isolated potential (6/8, 75%) or non‐capture (2/8, 25%) during high output pacing inside the encircled area. During a median follow‐up of 43 months (range 24–53), 7/8 (85.7%) patients remained free of sustained VT.
Conclusions: Electrical isolation of abnormal substrate is feasible and effective in VT patients with ARVC. Substrate isolation can be achieved by endocardial approach in a majority of VT patients with late‐stage ARVC, and associated with excellent rhythm control.
Supporting Documents
Keywords: ventricular tachycardia; arrhythmogenic right ventricular cardiomyopathy; catheter ablation; electrical isolation

