

Abstract
The prevailing view of metazoan gene regulation is that individual genes are independently regulated by their own dedicated sets of transcriptional enhancers. Past studies reported long-range gene-gene associations1–3, but their functional significance in regulating transcription remains uncertain and controversial. Here we employ quantitative single cell live imaging methods to provide the first demonstration of co-dependent transcriptional dynamics of genes separated by large genomic distances in living Drosophila embryos. We find extensive physical and functional associations of distant paralogous genes, including co-regulation by shared enhancers and co-transcriptional initiation over distances of nearly 250kb. Regulatory inter-connectivity depends on promoter-proximal tethering elements and perturbations in these elements uncouple transcription and alter the bursting dynamics of distant genes, suggesting a role of genome topology in the formation and stability of co-transcriptional hubs. Transcriptional coupling is detected throughout the fly genome and encompasses a broad spectrum of conserved developmental processes, suggesting a general strategy for long-range integration of gene activity.
Gene regulation is thought to fundamentally differ in prokaryotes and eukaryotes. In the former, tightly clustered genes engaged in a common process are regulated by a shared switch located near the core promoter (e.g., bacterial operons4). This type of organization facilitates coordinated transcriptional responses to different environmental stimuli. In higher eukaryotes, individual genes are regulated by multiple enhancers scattered across large genomic distances to produce complex profiles of expression5–7. However, eukaryotic genomes abound with divergent duplicated genes (aka paralogs) that are engaged in common developmental and cellular processes and display overlapping patterns of expression in time and space8–12. These genes are sometimes found in close linear proximity13, but are more commonly separated by large distances (20 kb to 250 kb or more)14–16. Here, we explore the possibility that such genes are regulated by shared switches, despite their genomic separation.
A surprisingly large fraction of cell fate specification genes in the developing fly embryo are organized as pairs or triplets of distal genes that exhibit overlapping spatiotemporal pattens of expression15,16 (Fig. 1). Micro-C chromosome conformation capture assays17,18 performed during the critical period of cell fate specification (2–3 hrs after fertilization) revealed extensive connectivity between the promoter regions of these genes (Extended Data Fig. 1–4, Table 1). Automated analysis of whole genome Micro-C maps identified ~200 long-range focal contacts (i.e. high connectivity between noncontiguous DNA sequences)19, with nearly half corresponding to promoter-promoter associations (Fig. 1a, and methods).
Figure 1|. Pervasive long-range promoter-promoter connectivity of genes with shared enhancers.
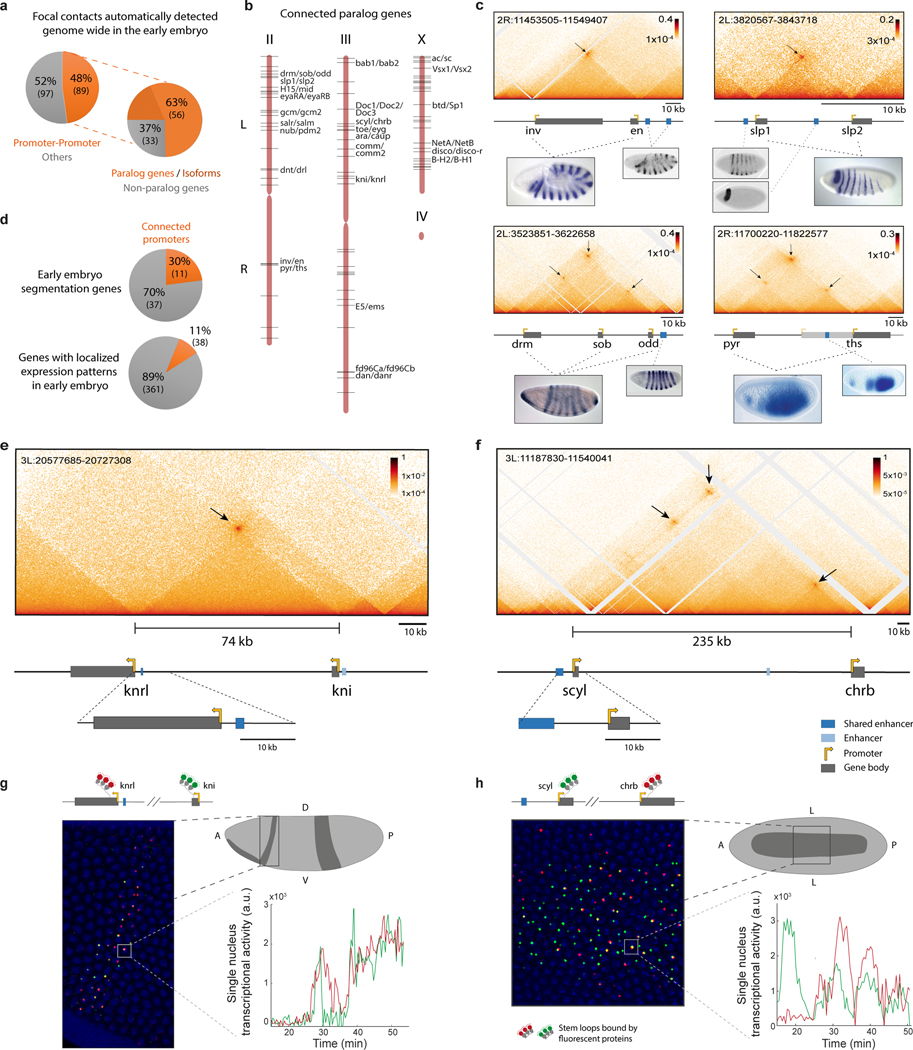
a, Focal contacts are automatically detected (methods) on Micro-C data of nuclear cycle 14 (nc14) Drosophila embryos. Shown is the percentage of focal contacts corresponding to promoter-promoter connectivity (orange, Table 1a, with other focal contacts commonly involving a single anchor in a promoter region, possibly capturing enhancer-promoter interactions28 (grey, Table 1b). On the right is the percentage of promoter-promoter contacts of paralog genes (orange) and different isoforms of the same gene (dark orange) versus non-paralog genes (grey) (Table 1a). b, Schematic showing the distribution of all connected paralog genes (black lines) throughout the Drosophila genome. The named examples are shown in detail in Extended Data Fig. 1–4. c, e-f, Micro-C contact map of the inv/en, slp1/slp2, drm/sob/odd, pyr/ths (c), knrl/kni (e) and scyl/chrb (f) loci. Focal contacts between promoter proximal regions are marked with a black arrow. Below is a schematic representation (to scale) of the locus (enhancer marked in dark blue corresponds to the presented overlapping pattern). For c, in situ images15,16 show the overlapping expression pattern of the paralog genes and a reporter line of the putative shared enhancers48,49. d, Percentage of genes engaged in promoter-promoter connectivity amongst early fly embryo segmentation genes50 (Table 3) or genes with localized expression patterns (Table 4). g, Simultaneous live imaging of knrl and kni transcription in the anterior stripe domain (21–34% egg length). Intronic insertions of stem loops lead to fluorescent coat proteins binding to nascent transcripts (see methods). See supplemental videos 1 and 5. The inset on the bottom right shows an example of the raw data per single nucleus, i.e. transcriptional traces over time, during nc14 for knrl (red) and kni (green). h, Simultaneous live imaging of scyl and chrb transcription, in the midline dorsal band (40–60% egg length). See supplemental video 2 and 6. Inset shows transcriptional traces over time, during nc14 for scyl (green) and chrb (red). D=Dorsal, V=Ventral and L=Lateral.
Table 1a -.
Promoter-promoter focal contacts.
| Chromosome x | Anchor coordinates x1 | Anchor coordinates x2 | Chromosome y | Anchor coordinates y1 | Anchor coordinates y2 | value | Distance between anchors (bp) | Gene associated with anchor x | Gene associated with anchor y |
|---|---|---|---|---|---|---|---|---|---|
|
| |||||||||
| chrX | 12086000 | 12086400 | chrX | 12202800 | 12203200 | 188.1702 | 116400 | Ten-a | CG15734 |
| chr2L | 5403600 | 5404000 | chr2L | 5461200 | 5461600 | 159.76843 | 57200 | H15 | mid |
| chr3L | 1366800 | 1367200 | chr3L | 1463600 | 1464000 | 147.59592 | 96400 | ru | rho |
| chr3L | 20620800 | 20621200 | chr3L | 20695200 | 20695600 | 139.11737 | 74000 | knrl | kni |
| chrX | 16149200 | 16149600 | chrX | 16216800 | 16217200 | 125.28895 | 67200 | disco | disco-r |
| chr3L | 11247600 | 11248000 | chr3L | 11487200 | 11487600 | 124.9115 | 239200 | scyl | chrb |
| chr2R | 11710000 | 11710400 | chr2R | 11789600 | 11790000 | 101.53123 | 79200 | pyr | ths |
| chr2L | 3538800 | 3539200 | chr2L | 3606400 | 3606800 | 97.77793 | 67200 | drm | odd |
| chr3L | 1102000 | 1102400 | chr3L | 1177200 | 1177600 | 81.473495 | 74800 | bab1 | bab2 |
| chr2L | 11358400 | 11358800 | chr2L | 11447600 | 11448000 | 74.074196 | 88800 | salr | salm |
| chr3L | 11248000 | 11248400 | chr3L | 11428400 | 11428800 | 73.21434 | 180000 | scyl | CG7560 |
| chr2L | 19189600 | 19190000 | chr2L | 19363200 | 19363600 | 71.78921 | 173200 | dnt | drl |
| chr2L | 6178800 | 6179200 | chr2L | 6252400 | 6252800 | 70.21177 | 73200 | smal | Ddr |
| chr2R | 11475600 | 11476000 | chr2R | 11528000 | 11528400 | 68.36679 | 52000 | inv | en |
| chrX | 14654000 | 14654400 | chrX | 14749600 | 14750000 | 67.40401 | 95200 | NetA | NetB |
| chrX | 17314000 | 17314400 | chrX | 17396800 | 17397200 | 65.09279 | 82400 | B-H2 | B-H1 |
| chrX | 3369200 | 3369600 | chrX | 3451600 | 3452000 | 60.477844 | 82000 | Myc | CG12535 |
| chr3L | 11428400 | 11428800 | chr3L | 11487200 | 11487600 | 54.90754 | 58400 | CG7560 | chrb |
| chrX | 18243600 | 18244000 | chrX | 18312400 | 18312800 | 54.829514 | 68400 | upd2 | upd1 |
| chrX | 369600 | 370000 | chrX | 395600 | 396000 | 53.291443 | 25600 | ac | sc |
| chr2L | 21828400 | 21828800 | chr2L | 21899200 | 21899600 | 45.347168 | 70400 | tsh | CG11629 |
| chr3L | 15700000 | 15700400 | chr3L | 15729200 | 15729600 | 37.443756 | 28800 | comm2 | comm |
| chr3R | 11353200 | 11353600 | chr3R | 11372400 | 11372800 | 37.023735 | 18800 | KP78a | pros |
| chrX | 17768000 | 17768400 | chrX | 17789600 | 17790000 | 35.873432 | 21200 | unc-4 | OdsH |
| chr3R | 12783600 | 12784000 | chr3R | 12915200 | 12915600 | 33.266586 | 131200 | beat_Vc | beat_Vb |
| chrX | 5560400 | 5560800 | chrX | 5594000 | 5594400 | 31.120886 | 33200 | Vsx2 | Vsx1 |
| chrX | 20257600 | 20258000 | chrX | 20389200 | 20389600 | 30.813257 | 131200 | CG17065 | jb |
| chr3R | 13877200 | 13877600 | chr3R | 13901600 | 13902000 | 29.48958 | 24000 | E5 | ems |
| chr3L | 6352400 | 6352800 | chr3L | 6400000 | 6400400 | 28.804068 | 47200 | CG13300 | CG42747 |
| chr2L | 12617600 | 12618400 | chr2L | 12678400 | 12679200 | 22.703676 | 60000 | nub | pdm2 |
| chr3R | 25137600 | 25138000 | chr3R | 25184400 | 25184800 | 22.632332 | 46400 | danr | dan |
| chrX | 11180800 | 11181600 | chrX | 11293600 | 11294400 | 22.2221 | 112000 | CG15200 | CG44422 |
| chr2L | 7134000 | 7134400 | chr2L | 7157600 | 7158000 | 21.21138 | 23200 | Pvf3RA | Pvf3RB |
| chr3L | 9004400 | 9004800 | chr3L | 9041200 | 9041600 | 20.6487 | 36400 | Doc3 | Doc1 |
| chr2R | 11756000 | 11756400 | chr2R | 11790000 | 11790400 | 20.595043 | 33600 | thsRA | thsRB |
| chr2L | 19135200 | 19135600 | chr2L | 19158400 | 19158800 | 20.29543 | 22800 | bratRA | bratRB |
| chrX | 2126000 | 2126400 | chrX | 2140800 | 2141200 | 19.747017 | 14400 | ph-d | ph-p |
| chr2L | B199600 | B200000 | chr2L | B266000 | B266400 | 19.691555 | 66000 | CG34393 | CG3347 |
| chr2L | 6076000 | 6076400 | chr2L | 6091200 | 6091600 | 19.073635 | 14800 | Kr-h1 | CR43801 |
| chr3L | 9019200 | 9019600 | chr3L | 9041200 | 9041600 | 18.561771 | 21600 | doc2 | doc1 |
| chr2L | 9581600 | 9582000 | chr2L | 9608000 | 9608400 | 18.13013 | 26000 | gcm | gcm2 |
| chr3R | 8477600 | 8478400 | chr3R | 8528800 | 8529600 | 17.940216 | 50400 | CG45263 | CG11741 |
| chr3L | 12434400 | 12434800 | chr3L | 12467600 | 12468000 | 17.224781 | 32800 | toe | eyg |
| chr2L | 3538400 | 3539200 | chr2L | 3580800 | 3581600 | 17.177822 | 41600 | drm | sob |
| chrX | 4206400 | 4207200 | chrX | 4280800 | 4281600 | 17.15356 | 73600 | Fas2 | CG15578 |
| chrX | 9693600 | 9694400 | chrX | 9728800 | 9729600 | 15.078944 | 34400 | btd | Sp1 |
| chr2L | 9256400 | 9256800 | chr2L | 9326000 | 9326400 | 14.596973 | 69200 | Ggamma30a | CG17005 |
| chr3L | 21584800 | 21585200 | chr3L | 21598400 | 21598800 | 14.366667 | 13200 | TfAP-2RA | TfAP-2RB |
| chr2L | 3825200 | 3825600 | chr2L | 3836400 | 3836800 | 14.3404 | 10800 | slp1 | slp2 |
| chr2R | 11710400 | 11710800 | chr2R | 11756000 | 11756400 | 13.192287 | 45200 | pyr | ths |
| chr3R | 26106000 | 26106400 | chr3R | 26129600 | 26130000 | 13.036941 | 23200 | CG31324RA | CG31324RB |
| chr3L | 12580400 | 12580800 | chr3L | 12609200 | 12609600 | 12.965447 | 28400 | ara | caup |
| chr3R | 28546800 | 28547200 | chr3R | 28585200 | 28585600 | 12.362288 | 38000 | miF2 | fkh |
| chrX | 18726000 | 18726400 | chrX | 18774000 | 18774400 | 12.12433 | 47600 | CCKLR-17D1 | CCKLR-17D3 |
| chr2R | 11592800 | 11593200 | chr2R | 11616000 | 11616400 | 11.623441 | 22800 | touRA | touRB |
| chrX | 4636000 | 4636400 | chrX | 4647600 | 4648000 | 11.612551 | 11200 | pon | mrpl30 |
| chr2L | 5288800 | 5289200 | chr2L | 5305200 | 5305600 | 11.452713 | 16000 | vriRA | vriRB |
| chrX | 3742000 | 3742400 | chrX | 3777600 | 3778000 | 11.33893 | 35200 | tlkRA | tlkRB |
| chr2L | 2612000 | 2612800 | chr2L | 2676800 | 2677600 | 10.97102 | 64000 | CG15395 | CG31690 |
| chrX | 4411600 | 4412000 | chrX | 4426800 | 4427200 | 10.957249 | 14800 | biRA | biRB |
| chr3R | 4835200 | 4835600 | chr3R | 4852400 | 4852800 | 10.918218 | 16800 | opa | CG14659 |
| chr3L | 14131200 | 14132000 | chr3L | 14177600 | 14178400 | 10.263438 | 45600 | sox213 | D |
| chr2R | 22243600 | 22244000 | chr2R | 22270400 | 22270800 | 10.109038 | 26400 | dveRA | dveRB |
| chr3L | 16891200 | 16892000 | chr3L | 16980800 | 16981600 | 10.071191 | 88800 | Lmpt | Exn |
| chr3L | 19663600 | 19664000 | chr3L | 19682800 | 19683200 | 9.809684 | 18800 | tey | CG8765 |
| chr3R | 4453200 | 4453600 | chr3R | 4478400 | 4478800 | 9.733258 | 24800 | CG31522 | CG31523 |
| chr3L | 9004400 | 9004800 | chr3L | 9019200 | 9019600 | 9.161534 | 14400 | Doc3 | Doc2 |
| chr2L | 6536000 | 6536400 | chr2L | 6546800 | 6547200 | 8.876781 | 10400 | eyaRA | eyaRB |
| chrX | 19162400 | 19162800 | chrX | 19175200 | 19175600 | 8.78479 | 12400 | RhoGAP183 | CG7556 |
| chrX | 18666000 | 18666400 | chrX | 18693200 | 18693600 | 8.482177 | 26800 | Cyp18a1 | CR45514 |
| chr2L | 1954400 | 1954800 | chr2L | 1972400 | 1972800 | 8.166542 | 17600 | ermRA | ermRB |
| chrX | 1135200 | 1135600 | chrX | 1163200 | 1163600 | 7.7505803 | 27600 | CG3655 | eIF4E7 |
| chr2L | 3580800 | 3581600 | chr2L | 3606400 | 3607200 | 7.663934 | 24800 | sob | odd |
| chr3L | 377600 | 378400 | chr3L | 432000 | 432800 | 7.595992 | 53600 | trh | CG13891 |
| chrX | 843200 | 844000 | chrX | 884800 | 885600 | 7.401195 | 40800 | CG43867RA | CG43867RB |
| chr2L | 15731600 | 15732000 | chr2L | 15743200 | 15743600 | 7.1868925 | 11200 | CycERA | CycERB |
| chr3R | 25080800 | 25081200 | chr3R | 25094400 | 25094800 | 6.6252913 | 13200 | fd96Ca | fd96Cb |
| chr3R | 8680800 | 8681200 | chr3R | 8698000 | 8698400 | 6.5660143 | 16800 | hb | CG33325 |
| chrX | 15626400 | 15626800 | chrX | 15646400 | 15646800 | 6.3409004 | 19600 | Sog | CG8117 |
| chrX | 1342000 | 1342400 | chrX | 1370000 | 1370400 | 6.2808013 | 27600 | Naa30A | ssx |
| chr2R | 16960800 | 16961200 | chr2R | 16973600 | 16974000 | 6.210223 | 12400 | Cbp53E | CG9010 |
| chr3R | 7304000 | 7304800 | chr3R | 7345600 | 7346400 | 6.0146227 | 40800 | rn | nxf4 |
| chrX | 10262400 | 10263200 | chrX | 10292000 | 10292800 | 5.739061 | 28800 | Hk | Alpha-Man-I |
| chr2L | 20770400 | 20770800 | chr2L | 20783200 | 20783600 | 5.6091113 | 12400 | cad | Pomp |
| chrX | 10877600 | 10878400 | chrX | 10899200 | 10900000 | 5.360511 | 20800 | Ork1 | CG1582 |
| chr3L | 11876000 | 11876400 | chr3L | 11892800 | 11893200 | 5.3544207 | 16400 | Sprn | CG6938 |
| chr2L | 222400 | 223200 | chr2L | 248800 | 249600 | 5.330725 | 25600 | kisRA | kisRB |
| chrX | 6001200 | 6001600 | chrX | 6013200 | 6013600 | 5.298385 | 11600 | mab-21 | CG4766 |
| chr2L | 12020800 | 12021600 | chr2L | 12048800 | 12049600 | 5.075041 | 27200 | Wdr81 | Plzf |
Paralog Genes
Alternative Promoters from same gene
Non-Paralog Genes
Most of these promoter-promoter contacts correspond to paralogous genes, while a smaller number correspond to widely separated alternative promoters for individual genes (Fig. 1a, Table 1). The former class of interconnected genes include a variety of segmentation genes, such as the gap genes knirps-related (knrl)/knirps (kni), the pair-rule genes sloppy-paired 1/2, and the segment polarity genes engrailed/invected (Fig. 1, Table 3). Many dorsal-ventral patterning genes also display this organization, including Dorsocross1/2/3, thisbe/pyramus and scylla (scyl)/charybde (chrb) (Fig. 1; Fig.S2). Interconnected paralogs are also seen for regulatory genes controlling a variety of developmental processes at later stages of the life cycle including neurogenesis and the morphogenesis of adult appendages (e.g., Sox21/Dichaete and bric-a-brac1/2).
Table 3 -.
Genes affecting segmentation patterning (adapted from PMID:27501451) showing promoter-promoter connectivity.
| Class | Locus | Name | Human ortholog(s) |
|---|---|---|---|
| Gap | gt | giant | — |
| hb | hunchback | — | |
| a | Knirps | — | |
| Kr | Krüppel | BCL6 | |
| tll | tailless | NR2E1 | |
| Pair rule | eve | even-skipped | EVX1, EVX2 |
| ftz | fushi tarazu | — | |
| h | hairy | HES1, HES4 | |
| odd | odd-skipped | OSR2, OSR1 | |
| opa | odd-paired | ZIC2, ZIC5, ZIC3 | |
| prd | paired | PAX3/5/6/7/8 | |
| run | runt | RUNX1/2 | |
| slp | sloppy-paired | FOXG1 | |
| Segment polarity | arm | armadillo | ß-Catenin, CTNN31 |
| ci | cubitus | Gli | |
| gsb | gooseberry | PAX3/5/6/7/8 | |
| hh | hedgehog (bar-3) | SHH, sonic hedgehog | |
| ptc | patched (tufted) | PTCH2 | |
| wg | wingless | WNT1 | |
| Segment pattern | arr | arrow | LRP5 |
| en | engrailed | EN1 | |
| lin | lines | LINS1 | |
| mid | midline | TBX10 | |
| nkd | naked (naked cuticle) | NKD1/2 | |
| otd | orthodenticle | OTX1 | |
| smo | smooth (smoothened) | SMO | |
| upd | unpaired | — | |
| Head defect | bhe | broad head | — |
| brh | brown head | — | |
| btd | buttonhead | SP1/3/5 | |
| cli | clift (eyes absent) | EYA4 | |
| cra | crack | — | |
| fkh | forkhead | FOX31, FOXC1 | |
| lea | leak (robo2) | Robo-2 | |
| sal | spalt | — | |
| sli | slit | SLIT1/2/3 | |
| thi | thick head | — |
Show promoter-promoter connectivity
We were able to identify putative shared enhancers for over three-fourths of the inter-connected paralogs displaying overlapping patterns of expression (Table 2, and methods). These enhancers reside in regions of open chromatin20,21 and map within 20kb of one of the gene pairs (or trios) (Fig. 1; Extended Data Fig. 1–4, Table 1). In some cases multiple shared enhancers appear to function in an additive pattern to produce composite co-expression profiles, as seen for the segmentation genes slp1 and slp2 (Fig. 1c). We estimate that 30% of segmentation genes, and at least 11% of all genes showing localized expression in the early embryo, contain distant interconnected paralogs (Tables 3,4). This long-range coupling challenges the current view of eukaryotic gene regulation, whereby individual genes are controlled by their own dedicated sets of enhancers.
Table 2-.
Expression patterns of connected genes and putative shared enhancers.
| Gene associated with anchor x | Gene associated with anchor y | Putative shared enhancer reference |
|---|---|---|
|
| ||
| H15 | mid | DOI: 10.1242/bio.013565 |
| ru | rho | VT24016+ VT24017 |
| knrl | kni | Fig. S6 |
| disco | disco-r | DOI: 10.1016/j.ydbio.2007.06.017 |
| scyl | chrb | Fig. S6 |
| pyr | ths | DOI: 10.1101/gad.1166404 |
| drm | odd | DOI: 10.1242/dev.062141 |
| ba31 | ba32 | DOI: 10.1371/journal.pgen.1003581 |
| salr | salm | DOI:10.1016/S0925-4773(97)00103-2 |
| dnt | drl | VT9853 |
| smal | Ddr | |
| inv | en | DOI: 10.1016/j.ydbio.2014.08.021 |
| NetA | NetB | VT61926 |
| B-H2 | B-H1 | VT63203 |
| upd2 | upd1 | |
| ac | sc | VT54805 |
| comm2 | comm | |
| unc-4 | OdsH | |
| beat_Vc | beat_Vb | |
| Vsx2 | Vsx1 | |
| E5 | ems | VT41290 |
| CG13300 | CG42747 | |
| nub | pdm2 | VT6450 |
| danr | dan | VT47167 |
| Doc3 | Doc1 | |
| ths | pyr | DOI: 10.1101/gad.1166404 |
| ph-d | ph-p | |
| doc2 | doc1 | |
| gcm | gcm2 | VT4849 |
| toe | eyg | DOI: 10.1016/j.ydbio.2007.12.037 |
| drm | sob | DOI: 10.1242/dev.062141 |
| btd | Sp1 | |
| slp1 | slp2 | VT1965 + VT1966 + VT1971 |
| ara | caup | VT29754 + VT29765 |
| CCKLR-17D1 | CCKLR-17D3 | |
| sox213 | D | VT30548 |
| CG31522 | CG31523 | |
| Doc3 | Doc2 | |
| sob | odd | DOI: 10.1242/dev.062141 |
| fd96Ca | fd96Cb | DOI: 10.3389/fcell.2021.723927 |
| mab-21 | CG4766 | |
| Ten-a | CG15734 | |
| scyl | CG7560 | |
| Myc | CG12535 | |
| CG7560 | chrb | |
| tsh | CG11629 | |
| KP78a | pros | |
| CG17065 | jb | |
| CG15200 | CG44422 | |
| CG34393 | CG3347 | |
| Kr-h1 | CR43801 | |
| CG45263 | CG11741 | |
| Fas2 | CG15578 | |
| Ggamma30a | CG17005 | |
| miF2 | fkh | |
| pon | mrpl30 | |
| CG15395 | CG31690 | |
| opa | CG14659 | |
| Lmpt | Exn | |
| tey | CG8765 | |
| RhoGAP183 | CG7556 | |
| Cyp18a1 | CR45514 | |
| CG3655 | eIF4E7 | |
| trh | CG13891 | |
| hb | CG33325 | |
| Sog | CG8117 | |
| Naa3QA | ssx | |
| Cbp53E | CG9010 | |
| rn | nxf4 | |
| Hk | Alpha-Man-I | |
| cad | Pomp | |
| Ork1 | CG1582 | |
| Sprn | CG6938 | |
| Wdr81 | Plzf | |
Show overlapping expression patterns
No gene expression data for at least one of the genes
Do not show expression overlap in publicly available data
At least one of the genes is not expressed in early embryo
Table 4 -.
Genes showing localized expression patterns in the blastoderm with connected promoters.
| Genes with localized expression patterns in the blastoderm | |
|---|---|
|
| |
| CG1056 | 5-HT2 |
| CG4173 | 2-Sep |
| CG3705 | aay |
| CG3796 | ac |
| CG12131 | Adam |
| CG5992 | Adgf-A |
| CG13388 | Akap200 |
| CG3752 | Aldh |
| CG1070 | Alhambra |
| CG5656 | Alp1 |
| CG1031 | alpha-Est1 |
| CG2198 | Ama |
| CG8827 | Ance |
| CG1028 | Antp |
| CG5393 | apt |
| CG10571 | ara |
| CG4531 | argos |
| CG18375 | ASPP |
| CG2969 | Atet |
| CG7986 | Atg18a |
| CG3624 | babos |
| CG9598 | bbg |
| CG1034 | bcd |
| CG10173 | Best2 |
| CG5249 | Blimp-1 |
| CG5295 | bmm |
| CG7088 | bnb |
| CG5059 | BNIP3 |
| CG4608 | bnl |
| CG32796 | boi |
| CG14430 | bou |
| CG10021 | bowl |
| CG10719 | brat |
| CG9653 | brk |
| CG16793 | brv2 |
| CG3838 | brwl |
| CG14025 | Bsg25D |
| CG8049 | Btk29A |
| CG5461 | bun |
| CG13969 | bwa |
| CG1759 | cad |
| CG6445 | Cad74A |
| CG7563 | CalpA |
| CG5685 | Calx |
| CG2102 | cas |
| CG1435 | CBP |
| CG17265 | Ccdc85 |
| CG8439 | Cct5 |
| CG6742 | cen31A |
| CG10082 | CG10082 |
| CG10283 | CG10283 |
| CG10479 | CG10479 |
| CG1103 | CG1103 |
| CG1146 | CG1146 |
| CG11696 | CG11696 |
| CG12177 | CG12177 |
| CG12420 | CG12420 |
| CG13289 | CG13290 |
| CG13360 | CG13360 |
| CG13607 | CG13607 |
| CG13784 | CG13784 |
| CG13894 | CG13894 |
| CG13912 | CG13912 |
| CG1434 | CG1434 |
| CG14427 | CG14427 |
| CG14657 | CG14657 |
| CG15628 | CG15628 |
| CG17724 | CG17724 |
| CG18549 | CG18549 |
| CG2162 | CG2162 |
| CG2865 | CG2865 |
| CG2915 | CG2915 |
| CG3036 | CG3036 |
| CG3097 | CG3097 |
| CG31038 | CG31038 |
| CG31431 | CG31431 |
| CG31871 | CG31371 |
| CG32G26 | CG32026 |
| CG32399 | CG32399 |
| CG32982 | CG32932 |
| CG33099 | CG33099 |
| CG3625 | CG3625 |
| CG4133 | CG4133 |
| CG4702 | CG4702 |
| CG5002 | CG5002 |
| CG5522 | CG5522 |
| CG5888 | CG5888 |
| CG6051 | CG6051 |
| CG6398 | CG6398 |
| CG6885 | CG6885 |
| CG7800 | CG7800 |
| CG8001 | CG8001 |
| CG8066 | CG8066 |
| CG8289 | CG8239 |
| CG8312 | CG8312 |
| CG8388 | CG8388 |
| CG8654 | CG8654 |
| CG8788 | CG8788 |
| CG8960 | CG8960 |
| CG9005 | CG9005 |
| CG9215 | CG9215 |
| CG9986 | CG9986 |
| CG7533 | chrb |
| CG5813 | chif |
| CG11798 | chn |
| CG2125 | ci |
| CG8443 | ciu |
| CG17894 | cnc |
| CG17943 | comm |
| CG7554 | comm2 |
| CG1621 | Coop |
| CG2530 | corto |
| CG8502 | Cpr49Ac |
| CG7663 | Cpr78Cb |
| CG7450 | CrebA |
| CG5814 | CycB3 |
| CG3938 | CycE |
| CG6292 | CycT |
| CG6816 | Cyp18a1 |
| CG6578 | Cyp306a1 |
| CG10391 | Cyp310a1 |
| CG3050 | Cyp6d5 |
| CG2140 | Cyt-b5 |
| CG5893 | D |
| CG3835 | D2hgdh |
| CG11849 | dan |
| CG13651 | danr |
| CG1772 | dap |
| CG8380 | DAT |
| CG6224 | dbo |
| CG5887 | desat1 |
| CG9908 | disco |
| CG3619 | Dl |
| CG32146 | dlp |
| CG10798 | dm |
| CG7780 | DNaseII |
| CG12489 | dnr1 |
| CG5133 | Doc1 |
| CG5187 | Doc2 |
| CG11347 | DOR |
| CG11652 | Dph1 |
| CG8704 | dpn |
| CG1897 | Dr |
| CG17348 | drl |
| CG10016 | drm |
| CG3365 | drongo |
| CG3132 | Ect3 |
| CG7915 | Ect4 |
| CG15085 | edl |
| CG10079 | Egfr |
| CG30426 | egg |
| CG12919 | eiger |
| CG7266 | Eip71CD |
| CG9883 | Elba2 |
| CG6755 | EloA |
| CG1007 | emc |
| CG9015 | en |
| CG7005 | Esp |
| CG8933 | exd |
| CG8254 | exex |
| CG4221 | Fbxl7 |
| CG11922 | fd96Cb |
| CG10917 | fj |
| CG10002 | fkh |
| CG10746 | fok |
| CG10033 | for |
| CG9238 | Gbs-70E |
| CG12245 | gcm |
| CG30115 | GEFmeso |
| CG13695 | gk |
| CG6207 | GlcAT-P |
| CG8442 | Glu-RI |
| CG12802 | Glut4EF |
| CG5058 | grh |
| CG4345 | grim |
| CG10176 | grnd |
| CG11628 | Grp1 |
| CG3388 | gsb |
| CG7952 | gt |
| CG31043 | gukh |
| CG11208 | Hacl |
| CG7428 | halo |
| CG9786 | hb |
| CG4261 | Hel89B |
| CG9768 | hkb |
| CG10293 | how |
| CG1242 | Hsp83 |
| CG11990 | hyx |
| CG11966 | ich |
| CG6736 | Ilp4 |
| CG1934 | ImpE2 |
| CG15009 | ImpL2 |
| CG10160 | ImpL3 |
| CG17835 | inv |
| CG30092 | jbug |
| CG33182 | Kdm4B |
| CG7210 | kel |
| CG5575 | ken |
| CG9322 | kmr |
| CG4761 | knrl |
| CG3340 | Kr |
| CG3839 | l(1)sc |
| CG15095 | l(2)08717 |
| CG16765 | l(3)10615 |
| CG32464 | l(3)82Fd |
| CG3953 | l(3)IX-14 |
| CG6930 | l(3)neo38 |
| CG1264 | lab |
| CG12369 | Lac |
| CG10236 | LanA |
| CG15658 | Lapsyn |
| CG18446 | Lime |
| CG13333 | link |
| CG32105 | Lmx1a |
| CG10895 | lok |
| CG32434 | loner |
| CG6860 | Lrch |
| CG11136 | Lrt |
| CG32372 | ltl |
| CG11254 | mael |
| CG15002 | mas |
| CG7538 | Mcm2 |
| CG3879 | Mdr49 |
| CG31385 | Meltrin |
| CG11100 | Mes2 |
| CG15162 | MESR3 |
| CG1771 | mew |
| CG3359 | mfas |
| CG31045 | Mhcl |
| CG13777 | milt |
| CG4123 | Mipp1 |
| CG14080 | Mkp3 |
| CG3297 | mnd |
| CG13037 | mRpS34 |
| CG10145 | mspo |
| CG8153 | mus210 |
| CG7593 | Naa40 |
| CG6844 | nAcRalpha-96Ab |
| CG10637 | Nak |
| CG4675 | Ndae1 |
| CG17256 | Nek2 |
| CG11450 | net |
| CG18657 | NetA |
| CG10521 | NetB |
| CG11988 | neur |
| CG16876 | NimC4 |
| CG4491 | noc |
| CG1763 | nod |
| CG11051 | Nplp2 |
| CG9704 | Nrt |
| CG6246 | nub |
| CG7867 | nuf |
| CG3779 | numb |
| CG7571 | Oatp74D |
| CG3851 | odd |
| CG1212 | p130CAS |
| CG3424 | path |
| CG12021 | Patj |
| CG5109 | Pcl |
| CG12287 | pdm2 |
| CG12212 | peb |
| CG17725 | Pepck |
| CG10924 | Pepck2 |
| CG3400 | Pfrx |
| CG8147 | phu |
| CG10108 | phyl |
| CG8486 | Piezo |
| CG4710 | Pino |
| CG6117 | Pka-C3 |
| CG1561 | pkm |
| CG3978 | pnr |
| CG9952 | ppa |
| CG14801 | prage |
| CG11765 | Prx2540–2 |
| CG8144 | ps |
| CG6899 | Ptp4E |
| CG11212 | Ptr |
| CG1447 | Ptx1 |
| CG31629 | Pvf3 |
| CG33207 | pxb |
| CG3027 | pyd3 |
| CG8556 | Rac2 |
| CG33529 | Rapgap1 |
| CG11992 | Rel |
| CG1004 | rho |
| CG32149 | RhoGAP71E |
| CG1225 | RhoGEF3 |
| CG9366 | RhoL |
| CG7230 | rib |
| CG8194 | RNaseX25 |
| CG8975 | RnrS |
| TE19126 | roo{}311 |
| CG8092 | row |
| CG3178 | Rrp1 |
| CG4125 | rst |
| CG1849 | run |
| CG7642 | ry |
| CG4385 | S |
| CG4922 | sala |
| CG6464 | salm |
| CG3766 | scat |
| CG31695 | scw |
| CG10130 | Sec61beta |
| CG5661 | Sema-5c |
| CG32423 | shep |
| CG8603 | Shrm |
| CG7224 | Sirup |
| CG31133 | Slimp |
| CG16738 | slp1 |
| CG2939 | slp2 |
| CG31640 | smal |
| CG31534 | smash |
| CG3956 | sna |
| CG14112 | SNCF |
| CG3242 | sob |
| CG9224 | sog |
| CG18024 | SoxN |
| CG1539 | spdo |
| CG30023 | sprt |
| CG3992 | srp |
| CG7938 | Sry-beta |
| CG31317 | stumps |
| CG3497 | Su(H) |
| CG6725 | Sulf1 |
| CG32306 | Svil |
| CG6889 | tara |
| CG10281 | TfIIFalpha |
| CG12284 | th |
| CG8846 | Thor |
| CG7895 | tin |
| CG1232 | tipE |
| CG14026 | tkv |
| CG6868 | tld |
| CG12026 | Tmhs |
| CG9660 | toc |
| CG6863 | tok |
| CG3048 | Traf1 |
| CG31721 | Trim9 |
| CG11280 | trn |
| CG8651 | trx |
| CG1374 | tsh |
| CG11326 | Tsp |
| CG30118 | Ttd14 |
| CG1856 | ttk |
| CG9398 | Tulp |
| CG10619 | tup |
| CG2956 | twi |
| CG10388 | Ubx |
| CG2762 | ush |
| CG4827 | veil |
| CG10728 | vls |
| CG5123 | W |
| CG4889 | wg |
| CG6531 | wgn |
| CG8458 | Wnt8 |
| CG17045 | yellow-e3 |
| CG2913 | yin |
| CG1046 | zen |
| CG1048 | zen2 |
| CG1322 | zfh1 |
| CG1449 | zfh2 |
With connected promoters
To explore the possibility that distant paralogs are coordinately regulated by shared enhancers we conducted comprehensive analyses of knrl/kni and scyl/chrb, which are regulated by two of the major patterning systems in early embryos, Bicoid (anterior-posterior)12 and BMP signaling (dorsoventral)9, respectively (Fig. 1g,h). They also possess both common and distinctive properties, such as similarities in overall organization but widely differing genomic distances, 74kb for knrl/kni and 235kb for scyl/chrb (Extended Data Fig. 1). To investigate co-transcriptional gene activity, in time and space, we employed live single cell transcription imaging22–24. Stem loops were inserted into the respective endogenous transcription units using CRISPR-targeted genome editing (see methods). Importantly, homozygous fly lines containing these stem loops are viable, suggesting little impact on the normal activities of the host genes. Simultaneous live transcription imaging in 2–3 hr embryos reveals overlapping expression patterns9,12,25, and concordant activities within individual nuclei (Fig. 1g,h).
Quantitative analysis of individual nuclei identified physical proximity of co-expressed transcription foci (Fig. 2a). Consistent with previously documented distances of ~350nm for long range enhancer-promoter interactions23,26, we find that knrl and kni are separated by a mean distance of ~320nm, while the more distantly mapping scyl and chrb foci are separated by ~470nm. Nonetheless, these distances are significantly smaller than those seen for uncoupled control genes, both at the population level and for individual nuclei tracked over time (scyl/chrb vs chrb/CG11652, Fig. 2a; Extended Data Fig. 5). Strikingly, we detected co-occurring transcriptional initiation events within a time scale of ~90 seconds for both knrl/kni (74kb) and scyl/chrb (235kb) (Fig. 2b,c). We also observe a higher frequency of knrl and kni co-initiation events when the two genes are linked in cis as compared with a trans-homolog arrangement (Fig. 2b, Extended Data Fig. 5k–l). More generally, both gene pairs show higher frequencies of co-initiation as compared with randomized controls (Fig. 2b,c). These observations suggest interconnectivity in the transcriptional dynamics of distant genes, as we discuss below.
Figure 2|. Distant inter-connected genes show physical proximity and co-initiation within single nuclei.

a, Live measurements of instantaneous distances between florescent foci marking transcribing genes (during peak activity in nc14, see methods). From left to right: for a control reporter gene with interlaced MS2 and PP7 stem loops driven by the hb-p2 enhancer (N=3 embryos, n>9.6* nuclei), for knrl/kni tagged genes (N=13, n>1.9*), for scyl/chrb tagged genes (N=6, n>8.7*), for chrb-CG11652 (N=10, n>2.5*) tagged genes (see corresponding Micro-c map in Extended Data Fig. 5i). Schematic drawings show the genomic distance between measured florescent foci. Boxplot plots within violins, show median, edges are 25th, 75th percentiles, whiskers extend to non-outlier data points (Mann Whitney/KS p value comparing between any two distributions <1*, also when using 1/100 of data points). Bootstrapping STD are shown in black. Insets on top show dx,dy,dz trajectories of 4 nuclei from the corresponding genotype. See Extended Data Fig. 5 for complementary measures. b, Examples of simultaneous transcriptional measurements of kni (green) and knrl (red) from a single nucleus (every 21sec); as a series of images and representative transcriptional traces (raw data- light color, smoothed- dark color, normalized to respective maxima). Detected co-initiation events are marked by asterisk. The computed frequency of co-initiation events (within 1.5min) out of knrl initiation events, across all measured nuclei (in purple, N=7 embryos with the genes simultaneously tagged in cis, n=274 nuclei, 677 knrl initiation events considered). In comparison, the frequency of co-initiation computed when genes are tagged in trans alleles (in blue, N=6 embryos, n=232 nuclei, and 595 knrl initiation events). A boxplot showing the distribution of such frequencies computed by 100 random shuffling of the single-nucleus associations between green and red traces in the cis tagged embryos (see methods), is in gray (center is median, edges are 25th, 75th percentiles, whiskers extend to non-outlier data points). See data split to individual embryos in Extended Data Fig. 5.k. c, Similar to b, but for scyl (green) and chrb (red) transcriptional measurements (every 30 sec). Computed frequency of co-initiation (N=5, n=400 nuclei, and 675 chrb initiation events considered) compared to random shuffling.
We used a combination of genome editing, Micro-C contact maps and quantitative live imaging to explore the basis for transcriptional co-activation of knrl/kni and scyl/chrb. We first identified shared enhancers driving localized patterns of expression common to each gene pair; we focus on a shared anterior stripe enhancer located upstream of knrl and a shared dorsal midline enhancer located upstream of scyl (Fig.1g,h; Extended Data Fig. 6). For the newly identified anterior stripe enhancer a targeted deletion provides direct evidence that it regulates both the distal kni gene in addition to proximal knrl. Mutant embryos exhibit a loss of both expression patterns in the anterior stripe, and deficiency homozygotes are lethal (Fig. 3a–c, blue line).
Figure 3|. Manipulations to promoter-proximal tethering elements alter knrl/kni transcriptional dynamics.

a, Schematic illustrations of CRISPR-edited fly lines; stem loops permit monitoring real-time transcription of knrl and kni (‘control line’ in purple), with a replacement of the putative shared enhancer (blue) or promoter proximal tethering elements (orange). b-c, Simultaneous live imaging of knrl and kni, in the anterior stripe domain (21–34% egg length), as shown in Fig. 1g. The mean transcriptional activity of knrl b and kni c in the domain over time during nc14 (arbitrary units) ± SEM is shown for the lines in a (N=7,7,6 embryos respectively). d, kni mean transcriptional activity (arbitrary units) ± SEM (N=6 embryos) for a line with the kni tether element replaced (N=6) versus control. e, Fly viability score (see methods) for the control allele, an allele with a replacement encompassing the knrl tethering elements, or the enhancer crossed to a deficiency allele lacking the entire knrl/kni locus (mean ± STD across N=9,5,5 independent crosses, each with >90 progeny scored). f, Mean kni transcriptional activity per active nucleus (mean ± SEM) over time from 30min into nc14. g, Number of kni transcriptionally active nuclei (mean ± SEM) over time in nc14, in the domain. Inset shows the cumulative number of active nuclei. Measures presented in f and g correspond to embryos in c. h, Representative examples of kni transcriptional traces from the control (top) and the tether replacement (bottom). Transcriptional onset time, ON and OFF durations are denoted. i, Distribution of onset times from all kni transcriptionally active nuclei of the control (purple) and the tether replacement (orange). Boxplot plots within violins, show median, edges are 25th, 75th percentiles, whiskers extend to non-outlier data points (two sided Mann Whitney or KS p value comparing the distribution <= 4.1*). j, Distribution of ON durations pooled from all kni active nuclei of the control and the tether replacement (same nuclei as in i). Inset shows the cumulative distribution of ON durations on all pooled nuclei (line) and on individual embryos (mean ± SEM, N=7). See distributions of overall time ON per nucleus, OFF to ON transition and OFF durations Extended Data Fig. 8. See methods for a detailed description the presented measures.
The Micro-C maps provide sufficient resolution to distinguish the shared enhancers from the sequences directly underlying long-range focal contacts between gene pairs (Extended Data Fig. 6). The latter sequences contain a distinctive signature of transcription factors (TFs), including Trithorax-like/GAF, CLAMP, and Ph, seen across all interconnected genes (Extended Data Fig. 6; Extended Data Fig. 1–4). Based on the binding peaks of these TFs within distinct regions of open chromatin20,21, we were able to subdivide these sequences into a series of discrete elements, that we hereafter designate “tethering elements”27,28 (Extended Data Fig. 6). We postulate that these elements contribute to physical and functional associations between the promoter regions of interconnected genes. Notably, they do not bind CTCF, although binding is detected in the vicinity of the tethering elements proximal to knrl and scyl (Extended Data Fig. 6a,b; further analysis in Extended Data Fig. 7,9). Additionally, tethering elements do not show enhancer activities when attached to reporter genes and tested in transgenic embryos (Extended Data Fig. 6c,d). Targeted replacements of tethering elements (hereafter ‘removal’) resulted in severely diminished contacts with distal genes, yet did not significantly alter either of the corresponding TADs (see Extended Data Fig. 7a–e). We next consider the transcriptional consequences of removing different tethering elements, beginning with knrl/kni (Fig. 3; Fig.S8).
Removal of the knrl tethering elements resulted in a severe loss of knrl expression, likely due to local effects on promoter function, possibly involving previously established roles of GAF/Trl21,29. More surprisingly, we also observed a significant reduction in kni transcription, 74kb away (Fig. 3a–c; Fig.S8). A loss of kni activity in the anterior stripe is also seen upon a reciprocal removal of the kni tethering element, although expression in posterior regions governed by kni-proximal enhancers is retained (Fig. 3d; Extended Data Fig. 7g). The targeted removal of the knrl tethering elements does not alter the enhancer sequence, but nonetheless causes a severe loss in viability, approaching the phenotype observed upon removing the enhancer (Fig. 3e). This phenotype is probably due to reduced kni transcription since deletion of the knrl transcription start site (TSS) produces milder effects (Extended Data Fig. 8l–o). Moreover, diminished viability associated with a large deletion in knrl that removes the shared enhancer, tethering elements, TSS and 5’ coding regions, is rescued by inserting the anterior stripe enhancer upstream of kni (Extended Data Fig. 8o). This insertion also rescues the loss in transcription that occurs when the kni tethering element is removed (Extended Data Fig. 7g). These observations point to a role of promoter-proximal tethering elements in tuning the co-activation of knrl/kni by the shared enhancer over large linear distances. This is supported by genetic complementation experiments, which indicate increased viability of the cis configuration of the shared enhancer and tethering elements as compared with the trans arrangement of regulatory elements (Extended Data Fig. 8p).
In order to obtain a more detailed understanding of the nature of this long-range tuning we performed quantitative analyses of kni transcription in individual nuclei of live embryos upon removal of knrl tethering elements. While there is only a minor diminishment in transcription levels within active nuclei (Fig. 3f), we observe a significant reduction in the number of instantaneously active nuclei (Fig. 3g). This loss appears to be stochastic within the normal limits of the anterior stripe, arising from both a pronounced delay in the onset of kni transcription as well as altered transcriptional bursting dynamics, with reduced durations of active (ON) periods of Pol II release (Fig. 3g–i). These observations suggest that enhancer-promoter communication is less stable upon removal of promoter-proximal tethering elements. This view is strengthened by the analysis of the scyl/chrb locus where shared enhancers work over “vertebrate-style” distances of nearly 250kb (Fig. 4).
Figure 4|. Tethering elements are important for long-range co-regulation of scyl and chrb.

a, Schematic illustrations of CRISPR-edited fly lines; stem loops permit monitoring real-time transcription of scyl and chrb “control line” in purple), with a partial (upstream tether) replacement of the tethering elements (green) or a full replacement of the tethering elements (orange). b-c, Simultaneous live imaging of scyl and chrb, in the midline dorsal band (40–60% egg length), as shown in Fig. 1h. The mean transcriptional activity of scyl b and chrb c in the domain over time during nc14 (arbitrary units) ± SEM (N=5 embryos) is shown for the lines in a. d, Mean chrb transcriptional activity per active nucleus (mean ± SEM) over time from 35min into nc14. e, Number of chrb transcriptionally active nuclei (mean ± SEM) over time in nc14, in the domain. f, Cumulative number of chrb transcriptionally active nuclei (mean ± SEM) over time in nc14, in the domain. g, Representative example of chrb transcriptional traces from the control (top) and the partial tether replacement (bottom). h, Distribution of ON durations pooled from all chrb active nuclei of the control, the partial and full tether replacements. Inset shows the cumulative distribution of ON durations on all pooled nuclei (line) and on individual embryos (mean ± SEM, N=5). See Extended Data Fig. 9e, for distribution of overall fraction of time ON per nucleus. i, Same as h but for OFF duration. j, Fraction of nuclei that show transcriptional activity of both scyl and chrb (detected MS2 and PP7 persistent signals), out of scyl active nuclei, in non-overlapping 5min windows. Bars show mean ± SEM (N=5). k, Proposed model for disruption of co-regulation upon removal of promoter proximal tethering elements.
The organization of tethering elements in the 5’ scyl regulatory region provided an opportunity to distinguish the activities of enhancer-proximal and promoter-proximal elements (Fig. 4a). As seen for knrl/kni, removal of both tethers results in a severe loss of scyl transcription, as well as marked reduction in chrb transcription (Fig. 4a–c; Extended Data Fig. 9). There is only a modest effect on the levels of chrb transcription in active nuclei, but a massive diminishment in the number of instantaneously active nuclei (Fig. 4d,e). Only a third of the expected number of nuclei exhibit chrb transcription throughout the one-hour interval of analysis (Fig. 4f). Active nuclei display reduced ON periods, as seen for knrl/knrl, but also extended OFF periods, possibly related to the significantly larger distance separating scyl and chrb (Fig. 4g–i). The removal of the enhancer-proximal tether results in a selective reduction of chrb transcription without significantly altering scyl transcription (green lines, Fig. 4b,c). This represents a significant decoupling in the co-transcriptional dynamics of scyl and chrb expression, with a reduced number of co-active nuclei at any given timepoint (Fig. 4j). These observations lend additional support to our proposal that tethering elements contribute to coordinated expression of distant paralogs (Fig. 4k).
In summary, we have presented evidence for coordinate regulation of distant genes by shared enhancers. Distant paralogs were shown to interact in 3D over large genomic distances through associations of discrete promoter-proximal tethering elements that underly co-dependent transcriptional dynamics of the interconnected genes. We propose the term “topological operon” to highlight co-regulation by shared enhancers, evocative of the shared switches used by bacterial operons.
The co-transcriptional dynamics we observe within topological operons are consistent with the occurrence of co-transcriptional hubs containing shared pools of transcriptional activators and Pol II7,30–32. The large distances separating co-transcribing loci and the short timescales of co-initiation events could be manifestations of molecular crowding within shared transcriptional microenvironments26,33. Further support stems from small deletions that impair transcription of the proximal gene and lead to an increase in the transcription of the distal gene (e.g, knrl TSS or scyl tether, Extended Data Fig. 8,9). These could reflect instances of promoter competition for shared but limiting transcriptional resources within a common hub.
While we have emphasized co-activation, topological operons might also foster co-repression of interconnected genes in inactive tissues since tethering elements often bind subunits of the PRC1 Polycomb complex34–36. Furthermore, long-range connectivity within topological operons appear to afford a greater degree of regulatory flexibility than that permitted by polycistronic genes within bacterial operons. For example, kni is regulated in the presumptive abdomen by nearby enhancers that produce only weak and sporadic activation of knrl. Consistent with recent studies suggesting a general maintenance of long-range associations across tissues25,37,38, we find physical proximity of co-expressed transcription foci in the anterior stripe and abdominal domains (Fig.S5i). It is conceivable that even subtle changes in 3D organization are sufficient to mediate distinct modes of co-regulation in different tissues. This regulatory flexibility is also seen for other cases of long-range associations3,39–41 (e.g., globin42 and HoxD43), and might reflect the greater demands imposed by complex cell types.
Topological operons account for a substantial fraction of gene activity in the early Drosophila embryo. They also account for a variety of developmental processes during later stages of the Drosophila life cycle (Extended Data Fig. 1–4, Table 1). Many of these genes have known orthologs in vertebrates44, including those regulating the patterning of the central nervous system (ac, D, en, ems), eye development (Vsx2), TOR signaling (scylla), cardiovascular development (H15) and morphogenesis of adult appendages (bab1/2) (Extended Data Fig. 1–4, Table 1).
Several recent studies have uncovered widespread gene-gene associations in different human tissues, including distant paralogs2,3,6,39. They share a strong correlation in chromatin modifications and are enriched for matching eQTLs3, raising the possibility that they may be transcriptionally coupled as seen in this study. Our identification of promoter-proximal tethering elements, distinct from enhancers, provides a new perspective for cross-regulatory influences of distant promoters45,46. The contributions of tethering elements to long-range promoter coupling and enhancer-promoter interactions28 in Drosophila also provide a foundation for the characterization of comparable elements in vertebrates47.
Topological operons might not be restricted to paralogous genes, and it remains to be seen whether they also interconnect unrelated genes encoding different components of common biological pathways, as seen for bacterial operons. We anticipate that topological operons are likely to be a general feature of metazoan genomes, providing a strategy to integrate and coordinate the activities of distant regulatory genes engaged in complex cellular and developmental processes.
Methods
Plasmid construction
The MS2 and PP7 stem loops cassette for knrl/kni lines were produced by a series of cloning duplicating the below annealed oligos. The final cassette consists of 24 stem loops (12 repetitions of the initial annealed oligos)
MS1 oligo1:
CTAGTTACGGTACTTATTGCCAAGAAAGCACGAGCATCAGCCGTGCCTCCAGGTCGAATCTTCAAACGACGACGATCACGCGTCGCTCCAGTATTCCAGGGTTCATCC
MS2 oligo 2:
CTAGGGATGAACCCTGGAATACTGGAGCGACGCGTGATCGTCGTCGTTTGAAGATTCGACCTGGAGGCACGGCTGATGCTCGTGCTTTCTTGGCAATAAGTACCGTAA
PP7 oligo 1:
CTAGTTACGGTACTTATTGCCAAGAAAGCACGAGACGATATGGCGTCCGTGCCTCCAGGTCGAATCTTCAAACGACGAGAGGATATGGCCTCCGTCGCTCCAGTATTCCAGGGTTCATCC
PP7 oligo 2:
CTAGGGATGAACCCTGGAATACTGGAGCGACGGAGGCCATATCCTCTCGTCGTTTGAAGATTCGACCTGGAGGCACGGACGCCATATCGTCTCGTGCTTTCTTGGCAATAAGTACCGTAA
The MS2 and PP7 stem loop cassettes used to tag the scyl/chrb locus have been previously described22.
A hbP2PP2E-MS2PP7-labZ-tub3’UTR reporter was made using an initial hbP2PP2E reporter plasmid24 and interlaced MS2-PP7 stem cassette23).
A nanos>SV40NLS-3xmKate2-PCP, His2Av-eBFP2 was produced by cloning 3xmKate223 instead of mCherry in a nanos > SV40NLS-mCherry-PCP, His2Av-eBFP2 expression plasmid previously used51. All 2attP-dsRed plasmids were made by cloning homology arms into a previously used 2attp-dsRed plasmid52. All 2attB-insert plasmid were made by cloning the inserts into a previously used 2attB-insert plasmid23. Plasmid maps and cloning details are available upon request.
Transgenic fly generation
knrl/kni locus CRISPR genome editing:
For the endogenous tagging of kni and knrl and manipulation to the promoter region of the genes a two-step transgenic strategy was used. First, a CRISPR-mediated replacement of the kni region (upstream regulatory regions and coding region) with a 2attp-dsRed cassette was performed, resulting in the hereinafter ‘kni null’ allele. The homology arms were amplified from the genomic DNA of the nos-Cas9/CyO injection line53 (BDSC #78781). The two Cas9 cutting guide RNAs sequences used are [GGGAGGGCTTGATTCGGGAAAGG] and [CTTGAAGCTCATTAATTCCACGG]. Loss of kni protein was verified by antibody staining as previously described54, corresponding segmentation defects were detected and PCRs from the dsRed to the flanking genomic regions were performed. The deleted region of kni (total ~8.9kb) was PCR amplified from the nos-Cas9/CyO line and cloned into a 2attB plasmid. MS2 stem loops (see description above) were cloned into the second intron. This 2attB-insert was subsequently delivered into the 2attp site in the “kni-null” line, by co-injection with phiC31 integrase (RMCE injection with ~0.25ug/ul [DNA] and hsp-PhiC31 DNA ~0.1ug/ul). Flies were screened for loss of dsRed and PCR verified for the presence of the insert in the correct orientation, with primers from inside the insert to the flanking genomic regions. A similar approach was used for all other manipulations of the kni upstream region, i.e. specific sub regions within the 2attb insert were replaced by cloning ‘inert’ sequences of the same length (see Extended Data Fig. 6 for sub elements replaced). Specifically fragment of the lacZ gene was used for the kni tether replacement (spanning chr3L: 20695490–20696331). The modified 2attB-insert was delivered into the same 2attp site as described above.
Tagging of knrl was done in the same manner, with the starting line being the kni-MS2 tagged line. A CRISPR-mediated replacement of the knrl region (including ~4kb upstream the TSS and extending into the first intron) with a 2attp-dsRed cassette was performed using guides [CACGTTTTCGCGCTTATTTCTGG] and [TCAACAACAACAACCATGCAAGG], resulting in the hereinafter ‘knrl null’ allele. The deleted region (total ~5.3kb) was PCR amplified into a 2attB-plasmid. PP7 stem loops (see above) were cloned into the first intron. An RMCE injection as above delivered the 2attB insert into the 2attP site, resulting in ‘knrl-PP7-kni-MS2’. Manipulations to knrl upstream region were obtained by replacing corresponding regions (e.g. tethering elements / enhancer) in the 2attB-insert plasmid subsequently delivered into the same 2attP site (see Extended Data Fig. 6, for sub elements replaced). Knrl tether region replaced spans chr3L:20620657–20622205 (or up to 20622803, for the extended replacement including the upstream CTCF binding region), Knrl TSS region deletion spans chr3L:20620487–20620657, the anterior stripe enhancer region replaced spans chr3L:20622810–20624645. Replacement sequences were derived from the yellow gene (and verified to not contain binding sites for major regulators) and maintained the same length of the fragments replaced (further constructs details are available upon request). Transgenic flies were crossed to female virgins of a line expressing Cre recombinase to excise elements from the upstream end of the 2attB inserted cassette that were flanked by lox sequences and are not used in this study. A line with a deletion extending from the upstream kni region to knrl first intron (hereinafter ‘knrl/kni null’ allele) was produced as above by CRISPR injection with the above kni-upstream guide [GGGAGGGCTTGATTCGGGAAAGG] and the knrl-downstream guide [TCAACAACAACAACCATGCAAGG], and a corresponding 2attp-dsRed plasmid. Reporter lines (Extended Data Fig. 6) were made by cloning PCR amplified tethering/enhancer regions from the nos-Cas9/CyO line into a eve core promoter-MS2-yellow reporter plasmid51, and injected into BDSC #9750. hbP2PP2E-MS2PP7-labZ-tub3’UTR reporter gene was injected into BDSC #27388. A new line of fluorescence-tagged maternal proteins was produced by injecting nanos>SV40NLS-3xmKate2-PCP, His2Av-eBFP2 plasmid described above into BDSC #9750, and subsequently recombining transgenic flies with nanos>MCP-GFP24, to obtain a fly with 3xmKate2-PCP, MCP-GFP, His2Av-eBFP2. All injections were performed at BestGene.
scyl-chrb locus CRISPR genome editing: For the endogenous tagging of scyl and chrb the MS2 and PP7 cassettes were respectively and individually inserted in the introns of the genes using the pBS-MS2-loxP-GFP-loxP and pBS-PP7-loxP-dsRed-loxP donor plasmids as described previously51. Homozygous female flies carrying the chrb-PP7 allele were then crossed to homozygous male flies carrying the scyl-MS2 allele and the progeny was screened for recombinants carrying both scyl-MS2 (GFP) and chrb-PP7 (dsRed) alleles in the same chromosome. The GFP and dsRED cassettes were excised from this line by crossing homozygous males to female virgins of a line expressing Cre recombinase: sna[Sco]/CyO; Dr/TM3, Sb. The scyl-MS2 chrb-PP7 line was then crossed to the nos-Cas9/CyO in order to generate the nos-Cas9/CyO; scyl-MS2 chrb-PP7 injection line. Subsequent genome editing was performed by inserting 1kb homology arms amplified from genomic DNA of the nos-Cas9/CyO injection line into the 2attP-dsRed donor plasmid and respective gRNAs into the pCFD3 plasmid. One donor 2attP-dsRed was then co-injected with two pCFD3 gRNA expression plasmids into nos-Cas9/CyO; scyl-MS2 chrb-PP7 embryos. The scyl tethering elements replacement spans chr3L:11246031–11252233, the upstream tether replacement spans chr3L:11246031–11248304 and the downstream chr3L: 11252068–11252233 and the intervening CTCF replacement spans ch3L:11248424–11248827). The His2Av-eBFP2, nos>SV40NLS-mCherry-PCP/CyO; nos>MCP-GFP55 detection line was used throughout this study to visualize transcription at the scyl-chrb locus.
Micro-C
Experimental protocol
Micro-C was preformed as described in the protocol in Ing-Simmons et al.38.
Fly embryos for the above described CRISPR lines were collected on yeasted apple juice plates at 25C. The embryos were collected for one hour, then incubated at 25C for 2 hours to enrich for nc14 embryos. Embryos were collected in mesh, dechorionated for 2 mins in 2.6% sodium hypochlorite, rinsed with water, and transferred to glass vials containing 3.5mL PBST (0.1% Triton-X in PBS), 6.5mL N-heptane, and 1mL of fresh 16% formaldehyde. Vials were placed in a horizontal shaker for 15mins at 250rpm. Subsequent to initial cross-linking, 3.7mL of 2M Tris-HCl pH7.5 was added, and the mixture was shaken for 5mins to quench the reaction. The top layer was removed, being careful to not remove any embryos, and the vial was spun down at 600rpm to pellet embryos. Embryos were washed twice in PBST, and stored at 4C until enough embryos were collected for manual sorting. Embryos were manually sorted using a mouth pipette to remove those of inappropriate stages. Finally, embryos were crosslinked again in 10mL of 3mM DSG (Thermo) and EGS (Thermo) in PBST for 45mins at room temperature with passive mixing. The reaction was quenched again by adding 3.7mL of 2M Tris-HCl pH7.5, washed twice with PBST, and stored at −80C. Micro-C libraries were constructed according to17, with modifications. At least 300 nc14 embryos were used per library. Embryos were crushed in a low-bind eppendorf tube with liquid nitrogen cooled plastic pestles using 500uL buffer MB1 (50mM NaCl, 10mM Tris, 5mM MgCl2, 1mM CaCl2, 0.2% NP-40, 1X PIC). Chromatin was digested with a pre-determined amount of Micrococcal Nuclease (Worthington Biochem) to yield 90% monomer vs 10% dimer given the appropriate number of embryos (4units for 300 nc14 embryos). Libraries were pair-end sequenced on an Illumina Novaseq S1 100nt Flowcell, with read 1 length 50 cycles, index read length 6 cycles, and read 2 length 50 cycles.
Following samples were obtained:
| Sample | Total paired-end reads |
|---|---|
| knrl/kni – control (‘knrl-PP7-kni-MS2’) -replicate1 | 5.38E+08 |
| knrl/kni – control (‘knrl-PP7-kni-MS2’)- replicate2 | 4.44E+08 |
| knrl/kni - kni tether replacement -replicate1 | 4.78E+08 |
| knrl/kni - kni tether replacement -replicate1 | 2.92E+08 |
| knrl/kni - knrl extended tethers replacement -replicate1 | 3.79E+08 |
| knrl/kni - knrl extended tethers replacement -replicate2 | 1.78E+08 |
| knrl/kni - knrl tethers replacement -replicate1 | 6.07E+08 |
| knrl/kni - knrl tethers replacement -replicate2 | 5.12E+08 |
| Additional control – for extra genomic coverage-replicate1 | 4.44E+08 |
| Additional control – for extra genomic coverage-replicate2 | 5.38E+08 |
| scyl tethers replacement -replicate1 | 3.91E+08 |
| scyl tethers replacement -replicate1 | 5.12E+08 |
| scyl/chrb - control (‘scyl-MS2 chrb-PP7’) -replicate1 | 2.94E+08 |
| scyl/chrb - control (‘scyl-MS2 chrb-PP7’) -replicate2 | 7.45E+08 |
Micro-C analysis
Micro-C data was analyzed according to 4DN Hi-C analysis pipeline. Briefly, paired-end reads were mapped to dm6 reference genome, or custom built references with CRISPR-mediated replacement sequences within, using bwa v0.7.1756. Valid alignments were then filtered using pairtools v0.2.2 to retain uniquely aligned reads with mapping quality of at least 3. Reads were assigned to 100bp genomic bins, and “inward”/”outward” reads assigned to adjacent bins (separated by less than 50bp) were removed. Matrix aggregation and normalization were performed using Cooler v0.8.357, using the built-in ICE balancing method. Contact matrices were visualized using HiGlass58.
Virtual 4C interaction frequencies shown in Extended Data Figs. 6,7, were generated using FANC59 (v0.9.13) in 800bp bins. Sequencing reads were mapped to custom genome, differing from dm6 in the CRISPR replaced regions and including the precise sequence used for the replacement (see description in transgenic fly generation above). We centered the virtual 4C view points on the regions of the tethering elements upstream knrl (view point coordinates: chr3L:20,620,490–20,622,290, dm6), the enhancer regions upstream of knrl (coordinates: 20,622,800–20,624,600) or the region of tethering elements upstream kni (view point coordinates are: chr3L:20,694,340–20,697,00 in dm6). We centered the virtual 4C view points on the regions of the tethering elements upstream scyl (view point coordinates: chr3L:11,252,400–11,246,000, dm6), the enhancer regions upstream of scyl (coordinates: chr3L:11,243,600–11,237,200) or the region of tethering elements upstream chrb. For the latter, in the profiles shown in Extended Data Fig. 7, view point coordinates in the ‘intact’ line, with no regions replaced, are chr3L:11,486,465–11,489,366. In the mutant in which the region encompassing tethering elements was replaced (by a shorter dsRed cassette, see above) the corresponding view point is centered on the same sequence (now at chr3L:11,481,625–11,484,526). Micro-C interaction frequencies are presented with respect to the distance from the view point (see X axis). Sequences at the same distance from the view point in the ‘intact’ line and mutant are identical for all regions downstream of scyl tether, and are ~4.8kb shifted in regions upstream of the scyl tether. Insulation scores shown in Extended Data Fig. 7a,b, were computed using FAN-C (v0.9.9)59, at 800bp resolution, on the knrl/kni control (x2 replicates), knrl tethers replacement (X2 replicated), scyl/chrb control (x2 replicates) and scyl tethers replacement (x2 replicates). Insulation scores were calculated with window sizes of 10kb that was found to be optimal in including pronounced boundaries but minimizing false-positives.
Automated loop calling on genome-wide Micro-C data
Loci with focal contacts (off-diagonal dots / localized high connectivity) were detected from contact matrices of the nc14 Micro-C maps (on a combined dataset consisting of the two knrl/kni control samples and the two scyl/chrb control samples). Initial calling was performed by the SIP_HiC_v1.6.119, with 400 and 800bp bin resolution. Parameters used: -g 3.0 -min 2.0 -max 2.0 -mat 5000 -d 25 -res 400 -sat 0.01 -t 2800 -nbZero 4 -factor 2 -fdr 0.05 -del true -cpu 1 -isDroso false. All contact with a value >5 were considered for further analysis. We used the Cooler57 “Marginals” file to identify genomic regions with low micro-C data coverage (marginals < 500), and filtered out any putative focal contacts with an anchor within 2 kb of a low-coverage region. A subset of 29 contacts with both anchors overlapping (within 1kb) a CP190 ChIP-seq peak60 were excluded, to avoid focusing on TAD boundary based interactions. Notably these interactions look visually distinct in the micro-C maps, as they clearly appear continuous to a TAD boundary, as opposed to the focal contacts that are at the heart of this study that appear in the micro-C data as localized high connectivity, internal to a TAD, surrounded by lower interaction frequency. Additional 4 artifact contacts (appearing as a large cross in the micro-C contact maps) were removed. Resulting focal contacts were further classified as promoter proximal if they are found within a permissive 4.5 kb of a TSS (5’ end of a FlyBase r6.40 “mRNA” annotation61). Table1 includes 2 tabs listing all detected focal contacts: promoter-promoter (Table1a) and others (Table1b). These correspond to the pie chart in Fig. 1a. The proportion of early segmentation genes engaged in promoter-promoter connectivity (Fig. 1d) was calculated by crossing the list of genes involved in promoter-promoter focal contacts (Table1) with the list genes involved in segmentation patterning provided by the Heidelberg mutant screen50 (Table3).
Table 1b -.
Other focal contacts.
| Chromosome anchor x | Anchor coordinates x1 | Anchor coordinates x2 | Chromosome anchor y | Anchor coordinates y1 | Anchor coordinates y2 | value |
|---|---|---|---|---|---|---|
|
| ||||||
| chr3R | 2874800 | 2875200 | chr3R | 3255200 | 3255600 | 398.56952 |
| chrX | 14470000 | 14470400 | chrX | 14512800 | 14513200 | 152.99977 |
| chr2L | 1764800 | 1765600 | chr2L | 1817600 | 1818400 | 109.90778 |
| chr2R | 15010800 | 15011200 | chr2R | 15109600 | 15110000 | 100.80788 |
| chr3R | 6848800 | 6849200 | chr3R | 6893200 | 6893600 | 98.58301 |
| chr2L | 16422800 | 16423200 | chr2L | 16486000 | 16486400 | 97.43673 |
| chr2L | 1420400 | 1420800 | chr2L | 1460800 | 1461200 | 64.61392 |
| chrX | 8624800 | 8625200 | chrX | 8676400 | 8676800 | 63.648254 |
| chr3L | 10736800 | 10737200 | chr3L | 10856800 | 10857200 | 58.94601 |
| chr2L | 21899200 | 21900000 | chr2L | 22024000 | 22024800 | 53.856373 |
| chr3L | 18186000 | 18186400 | chr3L | 18234000 | 18234400 | 52.263878 |
| chr3R | 16898800 | 16899200 | chr3R | 16918800 | 16919200 | 48.069557 |
| chrX | 4411200 | 4412000 | chrX | 4508000 | 4508800 | 46.60713 |
| chr3R | 11269200 | 11269600 | chr3R | 11312400 | 11312800 | 45.893944 |
| chr3R | 22839200 | 22839600 | chr3R | 22898400 | 22898800 | 37.12024 |
| chr3L | 12653200 | 12653600 | chr3L | 12692800 | 12693200 | 36.476826 |
| chr3R | 7000800 | 7001200 | chr3R | 7037200 | 7037600 | 35.837337 |
| chrX | 4426800 | 4427200 | chrX | 4508400 | 4508800 | 35.10234 |
| chr3L | 6789600 | 6790400 | chr3L | 6904000 | 6904800 | 33.371754 |
| chr2R | 6574800 | 6575200 | chr2R | 6610000 | 6610400 | 32.803196 |
| chrX | 8757600 | 8758000 | chrX | 8806000 | 8806400 | 31.551168 |
| chr3R | 12244400 | 12244800 | chr3R | 12278800 | 12279200 | 31.055393 |
| chrX | 2973600 | 2974000 | chrX | 3026000 | 3026400 | 29.204554 |
| chr3R | 16719600 | 16720000 | chr3R | 16730400 | 16730800 | 26.055058 |
| chr2R | 17265200 | 17265600 | chr2R | 17335600 | 17336000 | 25.590618 |
| chrX | 11532000 | 11532800 | chrX | 11559200 | 11560000 | 24.41179 |
| chr3L | 7554000 | 7554400 | chr3L | 7604800 | 7605200 | 24.38685 |
| chr2L | 7544400 | 7544800 | chr2L | 7590800 | 7591200 | 23.809784 |
| chr3R | 29345600 | 29346000 | chr3R | 29376400 | 29376800 | 23.196545 |
| chrX | 12716000 | 12716400 | chrX | 12742400 | 12742800 | 22.746534 |
| chr3R | 13449600 | 13450400 | chr3R | 13538400 | 13539200 | 21.476505 |
| chr3R | 16920400 | 16920800 | chr3R | 16948400 | 16948800 | 21.454744 |
| chr3L | 14579200 | 14579600 | chr3L | 14600800 | 14601200 | 21.191729 |
| chrX | 17345600 | 17346000 | chrX | 17397200 | 17397600 | 20.159845 |
| chrX | 4590000 | 4590400 | chrX | 4617200 | 4617600 | 19.650389 |
| chr2R | 12996400 | 12996800 | chr2R | 13038800 | 13039200 | 18.674715 |
| chrX | 7608000 | 7608400 | chrX | 7626800 | 7627200 | 18.573505 |
| chr3L | 3845600 | 3846000 | chr3L | 3878800 | 3879200 | 18.473673 |
| chr2R | 12704800 | 12705200 | chr2R | 12742800 | 12743200 | 18.305841 |
| chr2R | 12884400 | 12884800 | chr2R | 12904000 | 12904400 | 18.056175 |
| chrX | 18929600 | 18930400 | chrX | 19028000 | 19028800 | 17.11845 |
| chr2R | 12958400 | 12958800 | chr2R | 12980800 | 12981200 | 16.58441 |
| chr3L | 13684400 | 13684800 | chr3L | 13738000 | 13738400 | 16.145144 |
| chrX | 5993600 | 5994400 | chrX | 6024000 | 6024800 | 14.899683 |
| chr2R | 12958400 | 12958800 | chr2R | 12985600 | 12986000 | 12.956169 |
| chr2R | 8030800 | 8031200 | chr2R | 8051200 | 8051600 | 12.781614 |
| chr2L | 19820000 | 19820400 | chr2L | 19859600 | 19860000 | 12.661807 |
| chr3R | 31689200 | 31689600 | chr3R | 31724800 | 31725200 | 12.531688 |
| chrX | 17313600 | 17314000 | chrX | 17346000 | 17346400 | 12.301324 |
| chrX | 7604800 | 7605600 | chrX | 7626400 | 7627200 | 12.17616 |
| chrX | 2293200 | 2293600 | chrX | 2306000 | 2306400 | 11.922717 |
| chr2L | 7071200 | 7071600 | chr2L | 7139600 | 7140000 | 11.728405 |
| chr3R | 13794800 | 13795200 | chr3R | 13812800 | 13813200 | 11.628369 |
| chr3R | 29257600 | 29258000 | chr3R | 29304000 | 29304400 | 11.574565 |
| chr2R | 15024800 | 15025200 | chr2R | 15108400 | 15108800 | 11.501921 |
| chr3L | 21460400 | 21460800 | chr3L | 21476400 | 21476800 | 10.449656 |
| chr2L | 16588000 | 16588400 | chr2L | 16601200 | 16601600 | 10.423383 |
| chr3R | 14346400 | 14346800 | chr3R | 14382400 | 14382800 | 9.967561 |
| chr2L | 7119600 | 7120000 | chr2L | 7157600 | 7158000 | 9.906028 |
| chr3L | 10289600 | 10290000 | chr3L | 10308000 | 10308400 | 9.801118 |
| chr3L | 1380000 | 1380400 | chr3L | 1401200 | 1401600 | 9.531276 |
| chr3R | 6933200 | 6933600 | chr3R | 6970000 | 6970400 | 9.439683 |
| chr3L | 7781600 | 7782000 | chr3L | 7805200 | 7805600 | 9.027398 |
| chrX | 14099200 | 14100000 | chrX | 14176000 | 14176800 | 8.939507 |
| chr3R | 14347200 | 14347600 | chr3R | 14373600 | 14374000 | 8.723641 |
| chr2L | 14444000 | 14444800 | chr2L | 14488800 | 14489600 | 8.679204 |
| chr2L | 23B36000 | 23B36800 | chr2L | 23372000 | 23372800 | 8.5804 |
| chr2R | 14799200 | 14799600 | chr2R | 14814400 | 14814800 | 8.504361 |
| chr2L | 701600 | 702000 | chr2L | 714800 | 715200 | 8.315931 |
| chrX | 12350400 | 12351200 | chrX | 12388800 | 12389600 | 8.006271 |
| chr3L | 3681600 | 3682000 | chr3L | 3710400 | 3710800 | 7.5296316 |
| chrX | 7297200 | 7297600 | chrX | 7320800 | 7321200 | 7.4440293 |
| chr3R | 7936800 | 7937200 | chr3R | 7963600 | 7964000 | 7.4337816 |
| chr3R | 21606000 | 21606400 | chr3R | 21618400 | 21618800 | 7.3371224 |
| chr3R | 16403600 | 16404000 | chr3R | 16414000 | 16414400 | 7.2458205 |
| chr2L | 20464400 | 20464800 | chr2L | 20488000 | 20488400 | 7.220922 |
| chr2L | 3231600 | 3232000 | chr2L | 3265200 | 3265600 | 7.179898 |
| chrX | 3676400 | 3676800 | chrX | 3695600 | 3696000 | 7.1535516 |
| chr2L | 14262800 | 14263200 | chr2L | 14287600 | 14288000 | 6.827476 |
| chr2L | 18319200 | 18320000 | chr2L | 18364000 | 18364800 | 6.6493125 |
| chrX | 4972400 | 4972800 | chrX | 5003200 | 5003600 | 6.520591 |
| chr3L | 10949600 | 10950400 | chr3L | 10989600 | 10990400 | 6.48225 |
| chr2R | 14072000 | 14072800 | chr2R | 14114400 | 14115200 | 6.349194 |
| chr2R | 6514400 | 6515200 | chr2R | 6572800 | 6573600 | 6.2324615 |
| chrX | 12734800 | 12735200 | chrX | 12750400 | 12750800 | 6.1270657 |
| chr2L | 3199600 | 3200000 | chr2L | 3231200 | 3231600 | 6.1019993 |
| chr3R | 16702800 | 16703200 | chr3R | 16715600 | 16716000 | 6.0835986 |
| chr3L | 14153200 | 14153600 | chr3L | 14173200 | 14173600 | 6.001325 |
| chr3L | 4372000 | 4372400 | chr3L | 4400800 | 4401200 | 5.905132 |
| chr2R | 7169600 | 7170400 | chr2R | 7206400 | 7207200 | 5.7623053 |
| chr3R | 19816800 | 19817200 | chr3R | 19839200 | 19839600 | 5.7253637 |
| chr2L | 7901600 | 7902000 | chr2L | 7914800 | 7915200 | 5.707727 |
| chr2R | 15008000 | 15008800 | chr2R | 15078400 | 15079200 | 5.5755816 |
| chr3L | 12351200 | 12351600 | chr3L | 12368000 | 12368400 | 5.4956417 |
| chr2L | 14294000 | 14294400 | chr2L | 14308400 | 14308800 | 5.349495 |
| chr2L | 9019200 | 9020000 | chr2L | 9071200 | 9072000 | 5.3381977 |
| chr3R | 9174400 | 9175200 | chr3R | 9213600 | 9214400 | 5.2030654 |
The list of genes showing localized expression patterns in the early embryo was obtained by filtering the BDGP in situ database15 for genes that show expression during embryonic stage 4–6 in the ventral ectoderm anlage in situ nascendi, dorsal ectoderm anlage in situ nascendi, endoderm anlage in situ nascendi or mesoderm anlage in situ nascendi. This particular set of filters was chosen because it provided the most complete list of genes with localized expression patterns at the blastoderm stage. This filtering resulted in a list of 361 genes (Table4) that was then crossed with the genes involved in promoter-promoter focal contacts (Table1) to calculate the proportion of genes with localized expression patterns in the early embryo engaged in promoter-promoter connectivity (Fig. 1d). The list of connected genes showing overlapping expression patterns was created by manually verifying in situ data for each of the connected genes both in the BDGP in situ database15,16 and published literature. Putative shared enhancers were identified by checking a public database49 and published literature for reporters, made with sequences located within 20kb from the connected genes TSSs, which matched the expression pattern of the connected genes (Table2).
Microscopy and imaging:
Knrl/kni live transcription imaging: Experiments were performed with fly crosses from MCP-GFP, mKate-PCP, His2Av-eBFP2 homozygous female virgins and males carrying a knrl-PP7-kni-MS2 allele (with or without manipulations in the kni or knrl upstream regions). Resulting trans-heterozygote female virgins were collected and mated with homozygous males carrying sna-MS2 reporter genes62 (or Oregon-R flies, for reporter imaging). Sna expression pattern was used to select against poorly positioned lateral embryos. The resulting embryos were dechorionated and mounted between a semipermeable membrane and a coverslip (18 mm × 18 mm) and embedded in Halocarbon oil 27 (Sigma). Embryos were imaged using a Zeiss LSM 880 confocal microscope (Zen software 2.3 SP1). Plan-Apochromat 40× / 1.3N.A. oil immersion objective was. Three laser lines at 405nm, 488nm and 561nm were used to excite the blue, green and red fluorophores, respectively. Power measurements were conducted prior to every imaging session to ensure constant imaging condition. 561 laser was ramped up 15min into nuclear cycle 14, to avoid bleaching from prolonged exposure (after verifying no transcriptional events in this cannel precede this time point). Imaging setting used: Voxel size for all images was set at 250nm x 250nm x 500nm, and the total volume imaged was about 125 × 116 ×1 0 μm. Frame interval for all time-lapse videos was 21s. Images were taken at 500 × 464 × 21 voxels and focused on the anterior half of latterly positioned embryos (encompassing 21–34% egg length domain used in transcription analysis). Embryos were imaged from mitosis 13 until cephalic furrow formation in nuclear cycle 14.
Knrl/kni distance measurements: Crosses were performed as above and the resulting trans-heterozygote female virgins were mated with homozygous males from the hbP2PP2E-MS2PP7-labZ or the knrl-PP7/kni-MS2 line. Same mounting and microscope were used as in the above transcription measurements.
Imaging setting used: Voxel size for all images was set at 105nmx105nmx360nm, and the total volume imaged was about 96.61×37.97×7.56 μm. Frame interval for all time-lapse videos was 30s. Images were taken at 916×320×22 voxels and peak regions of expression; within the anterior hb domain for the hbP2PP2E -MS2PP7-lacZ or encompassing the knrl/kni anterior stripe for knrl-PP7/kni-MS2. A 25min time window of peak activity was used for analysis (starting at 25min into nc14 for knrl-PP7/kni-MS2 and at 20min into nc14 for the hbP2PP2E -MS2PP7-labZ).
Scyl/chrb live transcription imaging: Experiments were performed with fly crosses from MCP-GFP, mCherry-PCP, His2Av-eBFP2 homozygous female virgins and yw males. Resulting trans-heterozygote female virgins were collected and mated with homozygous males carrying a scyl-MS2/chrb-PP7 allele (with or without or manipulations in the scyl upstream regions). Mounting conditions were the same as used for the knrl/kni lines. A different Zeiss LSM 880 confocal microscope was used (Zen software 2.3 SP1) but microscopy parameters were as described above. Imaging setting used: Voxel size for all images was set at 277nmx277nmx500nm, and the total volume imaged was about 142×142×10 μm. Frame interval for all time-lapse videos was 21s. Images were taken at 512×512×21 voxels and focused on the in the midline dorsal band of dorsally positioned embryos (encompassing 40–60% egg length domain used in transcription analysis). Embryos were imaged from mitosis 13 until cephalic furrow formation in nuclear cycle 14.
Scyl/chrb distance measurements: Crosses were performed as in the live transcription imaging (above) and the resulting trans-heterozygote female virgins were mated with homozygous males from the hbP2PP2E-MS2PP7-labZ, the scyl-MS2/chrb-PP7 or the chrb-PP7/CG11652-MS2 line. Same mounting and microscope were used as in the above transcription measurements. Imaging setting used: Voxel size for all images was set at 105nmx105nmx360nm, and the total volume imaged was about 76×76×9μm. Frame interval for all time-lapse videos was 32s. Images were taken at 724×724×25 voxels at the midline dorsal band starting 20min into nc14.
Image processing and data analysis
All image processing and data analysis was performed using MATLAB (R2017b).
Nuclear segmentation and tracking: Images from the nuclei-labeled channel (His-BFP) were pre-processed with gaussian blurring and hole filling, and then binarized (employing Otsu’s methods). A watershed transformation was performed on the distance matrix calculated from the binarized image to get the segmentation for each frame, and a nuclear mask was calculated from each segmented region. A voronoi based tracking of nuclei was then preformed that was subsequently used to establish mitosis timing (a birth time of a nucleus is its first detection as one of two distinct daughter nuclei).
Spot segmentation and intensity measurements: A difference of gaussian was applied to the area of each segmented nucleus, and candidate spot areas were collected based on a threshold on the std from the mean (threshold was calibrated after extensive testing and manual curation). Minimum volume threshold was applied to prune small false positives, and spots centroids were computed as the center of mass of distinct areas surpassing the threshold. Spot tracking was performed based on centroid x,y,z coordinates, linking most likely spots in consecutive time points, and thereby further pruning spot candidates to obtain at most one spot per time-point. Subsequent interpolation provides x,y,z coordinates for short time intervals where spots were not detected, or random position within the nucleus was chosen if no spot was detected for very long interval. A backtracking step to identify lowly expressing spots (usually in the ramping up or ramping down phases of transcription) was performed, by using a slightly more permissive threshold in time points immediately before or after spots were detected, in spatial proximity to these detected spots. This overall procedure results in x,y,z spot coordinates per nucleus per time point and an assignment of ‘transcriptional status’ (active or in-active) based on whether the spots was initially detected (above thresholds) or not. A 3D sphere (2.5 pixel radios) surrounding the center of the spot is used to compute mean intensity from participating pixels. Mean background intensity (due to the freely diffusing maternally deposited fluorophores) is computed in the area surrounding the identified spots and subtracted from spot intensity.
Computation of transcriptional properties: Embryos were aligned in developmental time based on mitosis entering nuclear cycle 14. Time zero was defined as the time in which the maximal number of nuclei birth events (see nuclei segmentation above) was detected. Graphs presenting transcriptional measurements a function of time are plotted between 3-to-61min, that is after the large majority of nuclei were already ‘born’ and up to the time of drastic cell movements associated with gastrulation. Embryos were aligned spatially by taking a zoomed out, full embryo, image from which %egg length could be assigned to every pixel in the zoomed-in frame of view. Transcription analysis was subsequently performed on a same domain for all embryos used (21–34% egg length for knrl/kni and 40–60% egg length for scyl/chrb). All nuclei that are found within the domain throughout the entire analysis time window (from mitosis time to 65 min into nuclear cycle 14) are considered domain nuclei and participate in the computation of the below measures. As described above each such nucleolus has a segmented spot at any given time with an associated (background subtracted) intensity and a status indicting if this is a transcriptionally active spot (see above). The intensity per embryo was first normalized by the embryos mean background intensity relative to reference experiment, in order to reduce embryo-to-embryo variability stemming from small fluctuations in laser power between different imaging sessions.
Mean transcriptional activity in the domain per embryo per time point is the mean intensity of all spots associated with nuclei within the domain (this includes both transcriptionally active spots and in-active “background” spots).
Number of active nuclei in the domain per embryo per time is the count of how many of these spots were assigned a transcriptionally active state at that time point.
The mean intensity in active nuclei is the mean intensity of only the spots that were assigned a transcriptionally active state at that time point.
These measures are plotted with a 2min averaging window. A mean and SEM over multiple embryos is plotted (mean and STD is plotted in Extended Data Fig. 8,9 as well as measures per individual embryos of the main lines discussed, as area under the curve or averaged activity in a maximal activity widow).
Transcriptional onset, ON and OFF durations (and transitions) were computed for all single traces from “potentially active nuclei” (nuclei showing more than 6/10 time points of activity during the analysis time window for scyl/chrb and knrl/kni respectively). For each nucleus the first time of transcriptional activity (followed by a consecutive time-point with transcriptional activity, to ensure a persistent initiation event) was identified. From this time-point onwards (until 60in into nc14), the lengths of stretches of transcriptional activity (i.e. segmented spot is assigned a transcriptionally active state in consecutive time points), hereinafter ‘ON durations’, or inactivity, hereinafter ‘OFF durations’, were extracted. Distributions of all polled durations, across embryos with the same genotype are shown in Figs 3,4. We further compute the number of transitions between OFF stretches to ON stretch per nucleus or the overall fraction of time a nucleus was ON (for the same time widow and ‘potentially active nuclei’ described above); these statistics are pooled also across embryos with the same genotype and presented, per genotype, in Extended Data Fig. 8,9.
Frequency of co-initiation events was computed on single nucleus transcription traces from ‘potentially active nuclei’ (see above), over a time window between 15-to-51min into nc14. Each nucleus has two corresponding traces, one for each of the paralog genes, one in the green channel and one in the red. The above-described imaging setting allow for generally comparable detection in these channels based on testing with an MS2-PP7 interlaced line (see control in Extended Data Fig. 5j). The analysis first involved identifying initiation events in each channel and relating these to the closest event in the other channel (see full description below). A difficulty in this analysis stems from differential length of the two genes transcription units: while stem loops are inserted in comparable distances from the genes TSS (~1.3–15kb away), kni with stem loops is ~3.5–4.3kb (depending on which promoter is utilized), whereas knrl is ~25kb. Scyl with stem loops is ~5.3kb, and chrb is ~13kb. Given the nature of our transcriptional tagging system these create significant differences in the persistency of the signal stemming from a transcriptional initiation event. Therefore, straightforward approaches of directly correlating the traces from the two genes were not applicable. Some of the tested genes are highly active (e.g. kni and scyl) or extremely long (i.e. knrl), so when a significant reduction in activity is observed, intensity often does not reach background level (an OFF state) prior to increasing again. Thus solely relying on the genes transitions from OFF to ON significantly undercount what we define as “initiation events”. For this reason, in addition to accounting for OFF-to-ON events identify ‘decrease in activity-to-increase’ events. These events involve a substantial and persistence reduction in a transcriptional activity followed by a substantial and persistence increase. They are identified by smoothing the transcriptional traces, identifying local minima and verifying subsequent increase, until the following local maxima, reaches at least 20% of the maximal activity of the trace (several thresholds were tested with the goal of avoiding false counts due to signal fluctuations (largely comparable results were obtained with values of 20%−30%). We pool ‘OFF-to-ON’ events with ‘decrease-to-increase’ events per nucleus, removing any duplicate counts stemming from an event being detected by both approaches. Events in one channel are paired with the closest event on the other channel. As the longer (and less bursty) gene is still a limiting factor in our sensitivity in detecting initiation events, we compute co-initiation out of the initiation events detected for this gene. Namely, we compute what was the frequency of knrl initiation events that were detected within 1.5min of a kni initiation event, out of all knrl detected initiation events. Pooled data from all embryos is shown in Fig. 2b (data per embryo is shown in Extended Data Fig. 5k). Similarly, we compute what was the frequency of chrb initiation events that were detected within 1.5min of a scyl initiation events, out of all chrb detected initiation events (Fig. 2c).
As a control, we use the same set of nuclei, and perform a random shuffling of the associations between the green and the red traces. Shuffling is done per embryo, to avoid introducing embryo-to-embryo variability into our analysis, i.e. a red trace will be matched with a randomly selected green trace from the pool of ‘potentially active nuclei’ in the same embryo. Events are computed for the newly created pairs of transcriptional traces, and pooled across embryos. This procedure is repeated 100 times to obtain a distribution of ‘random’ frequencies of co-initiations. Importantly, this control preserves the overall initiation frequency in each channel. It should further be noted that he pool of nuclei used in the randomization are spatially neighbors (within 13% or 20% egg length, for knrl/kni and scyl/chrb respectively) within the same embryo, thereby likely sharing similar concentrations of general transcription machinery proteins and trans activators binding the enhancer governing the measured transcriptional activity. This accounts for the relatively high frequency of transcriptional co-initiation observed for this ‘random’ control. Given this manner by which we preform our ‘random’ control a higher frequency of co-initiation than that observed in this control pertains to the single nucleus, cis linked nature of the two transcriptional foci. For both gene sets, the frequency of co-initiation in the data falls outside the distribution computed by this ‘random’ shuffling control.
As a further control we performed a similar measurement and analysis for the knrl/kni gene when these were tagged in trans alleles rather than in cis. While again preserving the overall frequency of initiation of the tested genes (see comparison of mean activity in cis versus trans in Extended Data Fig. 5k) initiation of the two genes is now further restricted to the same nucleus. As expected from the limited spatial domain of activity this control overlaps with the high end of the random shuffling distribution.
In addition, we imaged embryos where the gene kni was tagged in the intron with an interlaced MS2-PP7 cassette. Notably these embryos were imaged in the same conditions as the knrl/kni data, which are slightly suboptimal for this interlaced line (green signal is slightly higher). Despite the inherent difficulty in relating events in two channels with different fluorophores, and the high activity of kni, lacking quiescence OFF period, thereby complicating detection of initiation events, applying our approach to this dataset shows a high degree of detected co-initiation (Extended Data Fig. 5k).
Computation of distances: Nuclei were segmented based on the His-BFP signal as described above. Instantaneous distances between fluorescent foci were computed at any given time point by RMS distance of spots (x,y,z) centroids coordinates (see above described spot segmentations). Outliers due to false spot segmentation showing unreasonably high distances were removed. Chromatic aberrations correction was performed as previously described23. In brief calibration was data-driven. Raw instantaneous spot-pair distances from all nuclei at all time points in all available embryos from an imaging batch (usually for ~2 weeks of measurements, n>7000) were pooled and analyzed as a function of the spot-pair positions in the image field of view. A multivariate normal regression model (Ai = piβ + ei, i=x,y,z) was applied in order to get the correction matrix β, where Ai is the 3-D response vector for the chromatic aberration, pi is the spot position with a constant term and ei is a normally distributed error. For each spot pair, chromatic aberration was calculated using β, and the calibrated distances were used in further analysis. As we previously found that the majority of the localization errors in this type of measurements result from dynamic properties of our live embryos23, we used a live embryo control to better gauge these, see the above described hbP2PP2E -MS2PP7-lacZ fly line (distances are shown in Fig. 2 and Extended Data Fig. 5). Distances for MS2-to-PP7 serve as a co-localization control for the corresponding channels. As in our previous study23 employing the correction matrix from these embryos instead of the data (genotype specific) driven one resulted in highly similar results. The mean after chromatic correction, represents the localization error (eL). For example, for the distance between the MS2 (blue) and PP7 (red) spots with the imaging setup used in Fig. 2, this mean is 134nm and the STDs for the lateral and axial direction are 60 nm and 156 nm, respectively (Extended Data Fig. 5).
Viability scores
Virgins from a the fly line with the ‘knrl/kni null allele’ (an allele carrying large deletion extending from upstream kni region to knrl first intron, as described above), balanced with a Tm3,sb (stubble) allele were crosses with either Tm3,sb balanced or homozygous lines with CRISPR modification of the knrl and kni region. These lines are the above described ‘knrl-PP7/kni-MS2’ and their derivative, i.e. including replacements of the knrl upstream sequence encompassing the tethering elements, or the knrl-proximal enhancer. Additional crosses also involved the ‘kni-null allele’ or ‘knrl-null allele’ described above (Extended Data Fig. 8).
All crosses were done with 8–12 virgins and 8–12 males, and kept at . Parent flies were removed after ~5 days. Progeny was counted, as balanced (stubble) or not balanced, for up to ~22days (ensuring the count is only for F1). In each cross at least 90 F1 flies were counted. Viability score per cross was computed by dividing the fraction of balanced flies by the expected one. That is, as virgin mothers were balanced in all crosses, if fathers were balanced, the expected ratio of balanced progeny to total progeny is 1/3. If fathers were homozygous, the expected ratio of balanced progeny to total progeny is 1/2.
Data Availability
All Micro-C data is available under GEO accession number: GSE173518.
The following publicly available databases and data sets were used: FlyBase r6.40 (https://flybase.org/) using dm6 reference genome, BDGP in situ database (https://insitu.fruitfly.org/), Fly Enhancer @ stark lab (https://enhancers.starklab.org/). ChIP-seq data for Zelda: GSE30757, Cohesin: GSE54529, CTCF+CP190: GSE30740, Pc: GSE68983, Pho+Ph: GSE77342, Cg: GSE77582, CLAMP: GSE39271 and GAF: GSE152773. RAMPAGE TSS profiling: GSE36213
ATAC-seq data: GSE152771.
Code Availability
Custom codes (MATLAB) used for image processing and data analysis can be made available on request. All details of algorithms are described in the Methods.
Extended Data
Extended Data Figure 1|. Long range promoter-promoter connectivity is a pervasive feature of the Drosophila genome.
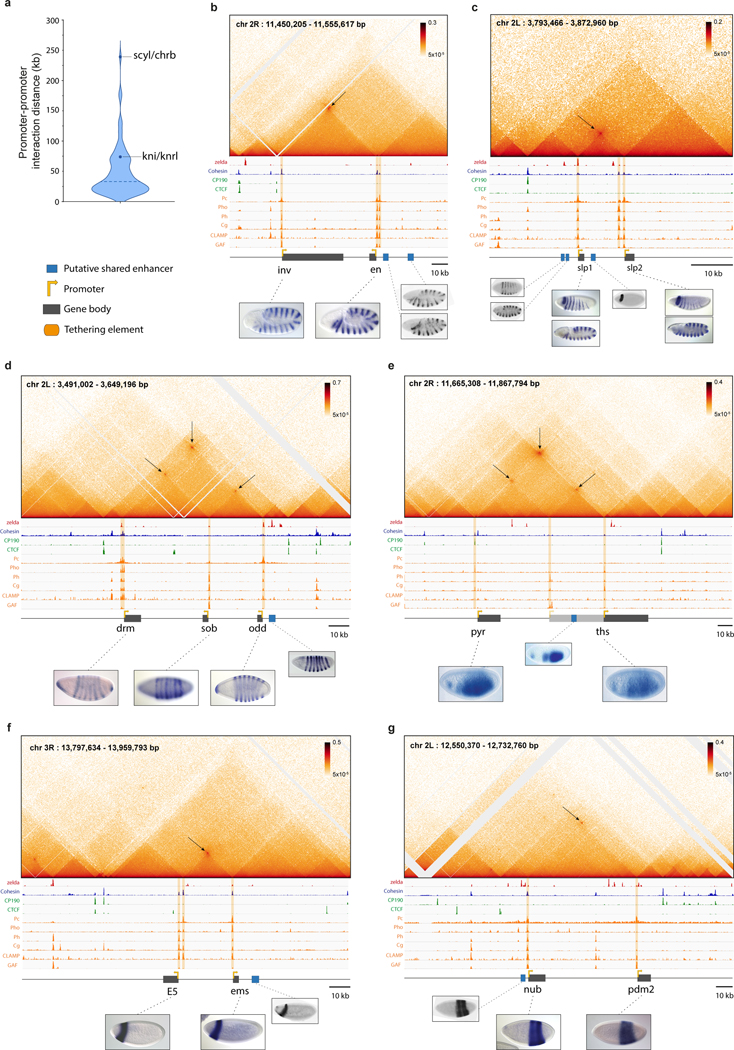
a, Promoter-promoter interaction distances distribution of connected genes. b-g, Micro-C contact map of the inv/en (b), slp1/slp2 (c), odd/sob/drm1 (d), pyr/ths2 (e), E5/ems (f) and nub/pdm2 (g) loci. Below, aligned to the map, are auto-scaled chip-seq tracks for Zelda (3h embryo)3 in red, Cohesin RAD21 (Kc167 cells)4 in blue, CP190 (Kc167 cells5), CTCF (Kc167 cells)5 in green, and in orange: Pc (2–4h embryos)6, Pho (3rd instar larva)7, Ph (3rd instar larva7), Cg (3rd instar larva)8, CLAMP (Kc167 cells)9 and GAF (2–4h embryo10). The orange tracks correspond to proteins that show binding at the anchors of promoter-proximal regions displaying high connectivity (tethering elements). A schematic representation (to scale) of the locus is displayed below, with in situ images showing the overlapping expression pattern between the paralog genes 11–14 and a reporter line of the putative shared enhancers15.
Extended Data Figure 2|. Long range promoter-promoter connectivity is a pervasive feature of the Drosophila genome (cont’d).
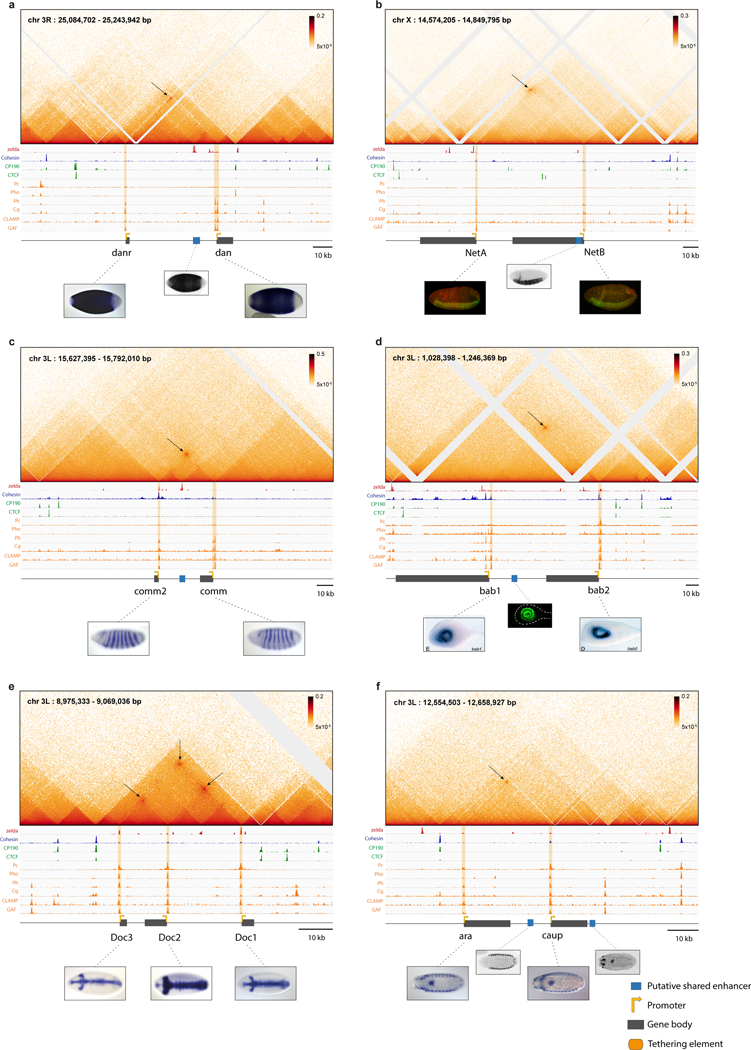
a-f, Same as Extended Data Fig. 1 for dan/danr (a), NetA/NetB (b), comm/comm2 (c), bab1/bab216,17 (d), Doc1/Doc2/Doc3 (e) and ara/caup (f) loci.
Extended Data Figure 3|. Long range promoter-promoter connectivity is a pervasive feature of the Drosophila genome (cont’d).
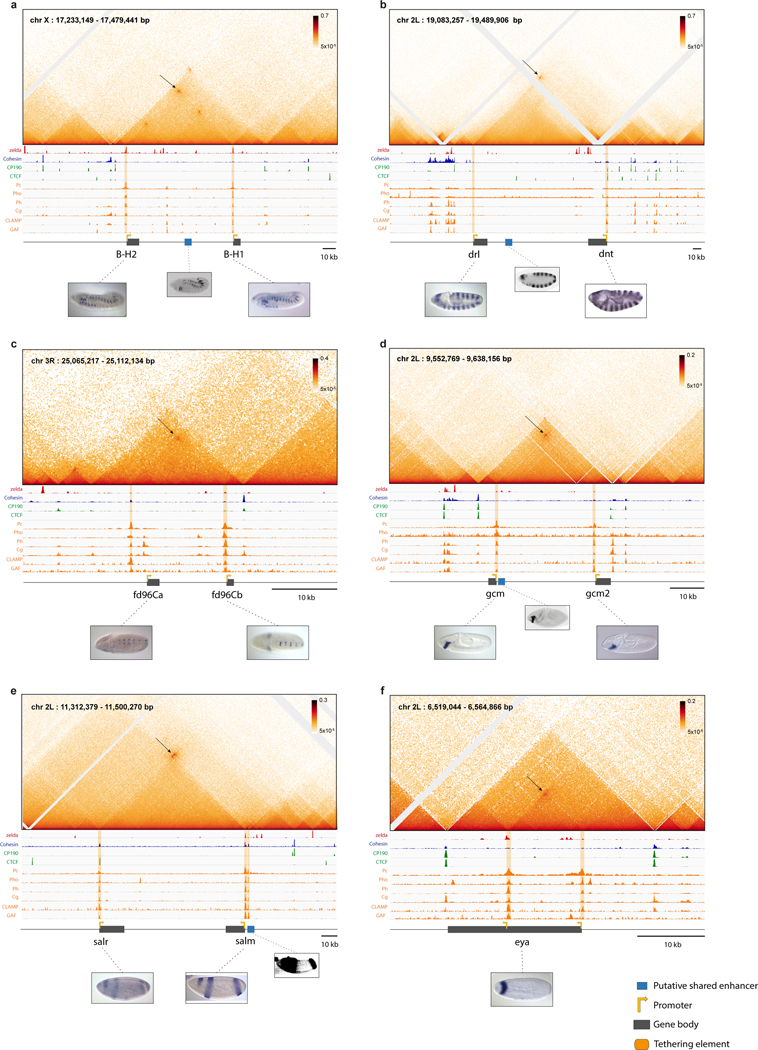
a-f, Same as Extended Data Fig. 1 for B-H2/B-H1 (a), drl/dnt (b), fd96Ca/fd96Cb (c), gcm/gcm2 (d), salr/salm18 (e) and eya (f) loci.
Extended Data Figure 4|. Long range promoter-promoter connectivity is a pervasive feature of the Drosophila genome (cont’d).

a-f, Same as Extended Data Fig. 1 for ac/sc19 (a), toe/eyg (b), btd/Sp120 (c), disco-r/disco21 (d), Vsx2/Vsx122 (e) and H15/mid23,24 (f) loci.
Extended Data Figure 5|. Time averaged distance measurements and co-initiation controls.

a, Shown are the X,Y,Z distances (mean ± STD, N=3, n>1.2×10⁴) between the MS2 and PP7 based foci in a control reporter line, with interlaced stem loops, measured in the same imaging conditions as the scyl/chrb / chrb/CG11652 data (see methods). Spot localization errors are the presented STD values of this co-localization control. b-d, f-h, Distribution of average/95% percentile distances across non overlapping time windows in individual nuclei (with both foci detected for at least half of the time points in the window). Boxplots within the violin plots, show median, edges are 25th, 75th percentiles, whiskers extend to non-outlier data points (for the comparison of any two distributions within the same panel Mann Whitney or KS tests p value << 1*). b-c, Distributions of time averaged distance measurements between fluorescent foci marking transcribing genes (corresponding to the instantaneous data plotted in Fig.2). From left to right: for a co-localization control reporter gene with interlaced MS2 and PP7 stem loops driven by the Hunchback (hb) p2promoter/enhancer, for the scyl/chrb tagged genes and for the chrb/CG11652 tagged genes. Across non-overlapping 5min time windows (b), or 25min widows (c). d, Distribution of the 95% percentile distance across 25min widows from individual nuclei. e, Same as a but for co-localization control measured in the same imaging conditions (see methods) as the knrl/kni data (mean ± STD, N=3, n>1.6×10⁴). f-h, Same as b,c,d except that knrl/kni is compared to the corresponding co-localization control. i, Instantaneous distances for a control reporter gene with interlaced MS2 and PP7, and for knrl/kni tagged genes measured in the anterior stripe domain (as in Fig. 2a), and posterior domain (regulated by enhancers proximal to kni. Boxplots within the violin plots, show median, edges are 25th, 75th percentiles, whiskers extend to non-outlier data points. j, Micro-C map encompassing the scyl/chrb/CG11652 region. Arrows mark the focal contact between scyl and chrb and the lack of such focal contact between chrb and CG11652. k, Computed frequency of co-initiation events (within 1.5min) out of knrl initiation events, across all measured nuclei in individual embryos, for embryos where the genes are tagged in cis (purple) or in trans (blue) is shown. The pooled data from these embryos are presented in Fig. 2b. A boxplot showing the distribution of such frequencies computed by 100 random shuffling of the single-nucleus associations between green and red traces in the cis tagged embryos (see methods), is shown in gray (center is median, edges are 25th, 75th percentiles, whiskers extend to non-outlier data points). As an additional control frequency of co-initiation events (within 1.5min) is also computed for embryos where the kni gene is tagged with tan interlaced MS2-PP7 cassette. To serve as an appropriate control, imaging was done with the same condition as the knrl/kni tagged embryos imaging (consequently green signal is slightly stronger). l, Mean transcriptional activity in the anterior stripe domain (arbitrary units) ± SEM over time in nc14 for the cis-tagged (purple, N=7) and trans-tagged (blue, N=6) embryos shown in j.
Extended Data Figure 6|. Detailed characterization of knrl/kni and scyl/chrb upstream regions displaying connectivity.

a-b, Micro-C contact map of knrl/kni (a) and scyl/chrb (b) loci. Below, aligned to the map, are auto-scaled chip-seq tracks of ATAC-seq (2–4h embryo)10, for Zelda (3h embryo)3 in red, Cohesin RAD21 (Kc167 cells)4 in blue, CP190 (Kc167 cells), CTCF (Kc167 cells)5 in green, and in orange: Pc (2–4h embryos)6, Pho (3rd instar larva)7, Ph (3rd instar larva)7, CLAMP (Kc167 cells)9 and GAF (2–4h embryo)10. The orange tracks correspond to proteins that show binding at the anchors of promoter-proximal regions displaying high connectivity (‘tethering elements’). A schematic representation (to scale) of the locus, including the genes, the defined ‘tethering elements’ and putative shared enhancers is shown below. For knrl/kni an additional enhancer is illustrated (light blue) upstream of kni, this represents known enhancers driving an abdominal domain of kni transcription and to a lesser extent also knrl25. This region is also thought to encompass an enhancer contributing to an anterior cap pattern displayed by both genes26. In this study we focus on the shared anterior stripe enhancer illustrated in dark blue. Below these schematics is a zoom-in image of the focal contact in the Micro-C maps, aligned with the same set of above described chip-seq tracks. c, Images of live transcription measurements (mid nuclear cycle 14, nc14) of a reporter, with either the extended tethering region upstream of knrl (left) or the putative knrl/kni shared enhancer (right), placed upstream an eve-core promoter-MS2-yellow gene. See corresponding supplemental videos 3 and 4. The extended tether reporter has no pronounced transcription during the majority of nc14 (none detected up to ~55min into nc14, and <5 nuclei showing brief transcription as the cephalic furrow is forming). In contrast, the enhancer reporter recapitulates the endogenous anterior stripe pattern of knrl/kni. At later stages of embryonic development a sequence encompassing the large majority of the tethering elements and extending (~360bp) into the enhancer showed transcriptional activity in a reporter assay27, but such activity is not seen during nc14. d, In situ images15 of an embryo at mid nc14 from a reporter line for the putative scyl/chrb shared enhancer (left) showing expression across the dorsal midline, corresponding the domain of activity of scyl and chrb (VT29052). Reporters containing the sequences of tethering elements upstream of scyl (center and right) show no detectable transcription (VT29054, VT29056). e, Virtual 4C contact maps computed from Micro-C data for two replicates of control lines with the viewpoint (1.8kb) anchored at the knrl promoter proximal tethering elements on top and at the enhancer on the bottom, center to center shift of 2.3kb (t-test p value comparing area under the virtual 4c curves encompassing the kni promoter-proximal region, [71 to 79kb] for the tether view point and [68 to 76kb] for the enhancer view point = 0.0065). f, Virtual 4C contact maps for two replicates of control lines with the viewpoint (6.4kb) anchored at the scyl tethering elements on top and at the enhancer on the bottom, center to center shift of 8.8kb (t-test p value comparing area under the virtual 4c curves encompassing the chrb promoter-proximal region, [232 to 245kb] for the tether view point and [241 to 254kb] for the enhancer view point = 0.0013).
Extended Data Figure 7|. Loss of long-range connectivity upon removal of tethering elements.

a, Micro-C contact map of a CRISPR-edited line, with a replacement of the knrl-proximal tethering elements (corresponding to the orange line in Fig. 3). Inset shows the control line map for comparison. Two replicates are combined for better visualization in these maps. Note loss of focal contact between the genes in the mutant. Insulation score (see methods) along the knrl/kni loci is shown below for the control line (2 replicates in purpure) and the tether deletion (2 replicates orange). Note the similar insulation landscape outside of the replaced region, and specifically maintenance of TAD boundaries upstream of knrl and downstream of kni. b, Micro-C contact map of a CRISPR-edited line, with a replacement of the scyl tethering elements (corresponding to the orange line in Fig. 4). Inset shows the control line map for comparison. Two replicates are combined for better visualization in these maps. Note loss of focal contact between the genes in the mutant. Insulation score (see methods) along the scyl/chrb loci is shown below for the control line (2 replicates in purpure) and the tether deletion (2 replicates orange). Note the similar insulation landscape outside of the replaced region. c, Virtual 4C contact maps computed based on Micro-C data for the control line (2 replicates in purple), a line with the knrl tethering elements replaced (2 replicates in orange), a line with an extended replacement of the knrl tethers encompassing also the adjacent CTCF (2 replicates in gray), a line with kni tethering element replaced (2 replicates in blue). The viewpoint is anchored on the kni tethering element region (see exact coordinated in methods). Interaction frequency over the knrl promoter proximal region (encompassing the tethering elements) is significantly reduced in all mutants compared to wt (t-test p value comparing each mutant genotype to wt by the area under the virtual 4 curve between [−79 to −71kb] = 0.0036 – 0.0041). d, Virtual 4C contact maps computed based on Micro-C data for the control line (2 replicates in purple), and a line with the scyl tethers replaced (2 replicates in orange). The viewpoint is anchored on the chrb tethering element region (see exact coordinated in methods). Interaction frequency over the scyl upstream region (encompassing the tethering elements) is significantly reduced in the mutant compared to wt (t-test p value comparing mutant genotype to wt by the area under the virtual 4c curve between [−246 to −234kb] = 0.0004). e, Similar to c, but with viewpoint anchored on the knrl tethers. Interaction frequency over the kni promoter proximal region (encompassing the tethering element) is reduced in all mutants compared to wt (t-test p value comparing each mutant genotype to wt by the area under the virtual 4c curve between [68 to 76kb] = 0.0042–0.0049). Inset shows data for a slightly shifted viewpoint (2.3kb), from the adjacent shared enhancer, as in Fig. 6e. f, knrl and kni mean transcriptional activity (arbitrary units) ± SEM over time in nc14, in the anterior stripe domain for a control line (in purple, N=7), a line with a replacement of the knrl tethering elements (in orange, N=7, as in Fig.3) and a line with an extended replacement encompassing also the adjacent CTCF (in gray, N=4), corresponding to the micro-C data in c,e. g, kni mean transcriptional activity (arbitrary units) ± SEM over time, in nc14, in the anterior stripe domain (for flies with only kni intronic MS2 stem loops). Shown are transcriptional measurements for a line with the kni tether element replaced (in green, N=6), with a corresponding micro-C map (matching the virtual 4c profiles in c,e) and a full embryo image. The latter shows kni transcriptional activity in the posterior domain is retained, in contrast to loss of activity in the anterior domain (see also supplemental video S7). Also shown are transcriptional measurements from a line in which in addition to the replacement of the kni tether deletion a copy of the shared enhancer was introduced upstream of kni (in blue, N=5), recovering kni transcriptional activity in the anterior stripe domain.
Extended Data Figure 8|. Impact of manipulations of the knrl upstream region on both knrl and distal kni.

a, Schematic illustrations of CRISPR-edited fly lines; introducing stem loops to monitor real-time transcription of the co-regulated genes knrl and kni (‘control line’ in purple), with a replacement of the putative shared enhancer (in blue) or promoter proximal tethering elements (in orange). b, knrl mean transcriptional activity in the anterior stripe domain (21–34% egg length) as shown in Fig. 3b, but with STD (instead of SEM) over time in nc14, for the lines illustrated in a (N=7,7,6 respectively). c, Number of knrl transcriptionally active nuclei (mean ± SEM) over time in nc14, in the domain. Inset shows mean knrl transcriptional activity per active nucleus (mean ± SEM) over time from 30min into nc14. d, kni mean transcriptional activity in the anterior stripe domain as shown in Fig. 3c, but with STD (instead of SEM) over time in nc14 (N=6 for enhancer replacement and 7 for others). e, Distribution of the fraction of time ON per nucleus for all kni transcriptionally active nuclei, for the control (purple) and the tether replacement (orange) lines. For each nucleus ON durations from first robust onset are summed and divided by the overall duration of activity (from first onset to 60min into nc14). Boxplots within violins, show median, edges are 25th, 75th percentiles, whiskers extend to non-outlier data points. P value of two sided Mann Whitney or KS test comparing the two distributions <= 1.9*. f, Distribution of the number of ‘OFF-to-ON’ transitions per nucleus (normalized to a 30min period, see methods) on the same nuclei as in e, for the control line (purple) and the tether replacement (orange). Boxplots within violins, show median, edges are 25th, 75th percentiles, whiskers extend to non-outlier data points. P value of two sided Mann Whitney or KS test comparing the two distributions <= 8.3*. g, Distribution of OFF durations pooled from all kni active nuclei of the control and the tether replacement. Inset shows the cumulative distribution of OFF durations on all pooled nuclei (line) and on individual embryos (mean ± SEM, N=7). Complementary to ON durations distributions in Fig. 3j. h, For the lines illustrates in a, the area under the curve of kni mean transcriptional activity (the data used in Fig. 3c,d) is shown for individual embryos. Mann Whitney p value for all comparison <= 0.0012. i, Same as h, but shown is the averaged activity in a widow of maximal activity, between 38–46min into nc14. Mann Whitney p value for all comparison <= 0.0012. j, Same as h but for the number of active nuclei. Mann Whitney p value for all comparison <= 0.0012. k, Same as i but for the number of active nuclei. Mann Whitney p value for all comparison <= 0.0012. l, Schematic illustrations of CRISPR-edited fly lines; the control line with both knrl and kni tagged (in purple), a partial tether replacement, encompassing the knrl downstream tether (dark green), a partial tether replacement, encompassing the knrl upstream tether and the adjacent CTCF site (in yellow) and a line with the knrl transcription start site (TSS) region (170bp encompassing knrl TSS28) deleted (in black). m, knrl mean transcriptional activity (arbitrary units) ± SEM, in the anterior stripe domain over time in nc14, for the lines illustrated in l (N=7,7,5,4 respectively). n, Same as m but for kni. o, Viability score (see methods) for the line with knrl TSS region deleted, a line with a replacement encompassing the upstream region of knrl and extending into the gene, a line with this same replacement but with the enhancer repositioned upstream of kni, crossed to a deficiency allele lacking the entire knrl/kni locus. Shown is mean ± STD across (N=4,3,5) independent crosses, each with >90 progeny scored. p, Viability score for a wt allele crossed to a deficiency allele lacking the entire knrl/kni locus, and a line with the replacement of knrl upstream region, extending into the gene, on one allele and a replacement of the kni upstream and gene region on the other allele. Shown is mean ± STD across N=4,6 independent crosses, each with >90 progeny scored.
Extended Data Figure 9|. Impact of manipulations of scyl upstream region on both scyl and distal chrb.

a, Schematic illustrations of CRISPR-edited fly lines; introducing stem loops to monitor real-time transcription of the co-regulated genes scyl and chrb (‘control line’ in purple), with a partial (upstream tether) replacement of the tethering elements (in green) or a full replacement of the tethering elements (‘in orange). b, scyl mean transcriptional activity in the dorsal midline (see Fig. 4b), but with STD (instead of SEM) over time in nc14 (N=5 embryos), for the lines illustrated in a. c, Number of scyl transcriptionally active nuclei (mean ± SEM) over time in nc14, in the dorsal midline domain. Inset shows mean scyl transcriptional activity per active nucleus (mean ± SEM) over time from 30min into nc14. d, chrb mean transcriptional activity in the domain (see Fig. 4c), but with STD (instead of SEM), over time in nc14 (N=5 embryos). e, Distribution of the fraction of time ON per nucleus for all chrb transcriptionally active nuclei, for the control (purple) and, upstream tether replacement (green) and tethers replacement (orange) lines. For each nucleus ON durations from first robust onset are summed and divided by the overall duration of activity (from first onset to 60min into nc14). Boxplots within violins, show median, edges are 25th, 75th percentiles, whiskers extend to non-outlier data points. P value of two sided Mann Whitney or KS test comparing the control to the tethers replacements <= 2.7*, for upstream tether replacements vs tethers replacements < 0.061. f, For the lines illustrates in a, the area under the curve of chrb mean transcriptional activity (the data used in Fig. 4c,d) is shown for individual embryos. Mann Whitney p value for control vs replacements lines = 0.0079, for upstream tether replacements vs tethers replacements = 0.056. g, Same as f, but shown is the averaged activity in a widow of maximal activity, between 50–8min into nc14. Mann Whitney p value for all comparison = 0.0079. h, Same as f but for the number of active nuclei. Mann Whitney p value for control vs replacements lines = 0.0079, for upstream tether replacements vs tethers replacements = 0.056. k, Same as g but for the number of active nuclei. Mann Whitney p value for all comparison = 0.0079. j, Schematic illustrations of CRISPR-edited fly lines; the control line with both scyl and chrb tagged (in purple), a line with the downstream tether replaced (in black) and a line with the CTCF site replaced (in light green). k, scyl mean transcriptional activity (arbitrary units) ± SEM, in the midline dorsal band, over time in nc14 (N=4–5 embryos), for the lines illustrated in j. l, Same as k, but for chrb.
Supplementary Material
Acknowledgments
We thank all members of the Levine and Gregor labs for discussions and comments on the manuscript, and Eric Wieschaus for critical suggestions at various stages of the project. We thank M. Jordan Rowley for his assistance with the SIP algorithm used for the automatic detection of focal contacts, and Evangelos Gatzogiannis for his invaluable help with live imaging microscopy. We thank Benjamin Zoller for his contribution to the imaging analysis pipeline. This work was supported in part by the U.S. National Science Foundation, through the Center for the Physics of Biological Function (PHY-1734030), and by National Institutes of Health Grants R01GM097275 (T.G.), U01DA047730 (T.G. and M.S.L.), and U01DK127429 (T.G. and M.S.L.). The work was additionally supported by National Institutes of Health grant R35 GM118147 (M.S.L.). M.L. is the recipient of a Human Frontier Science Program fellowship (LT000852/2016-L), EMBO long-term postdoctoral fellowship (ALTF 1401-2015), and the Rothschild postdoctoral fellowship.
Footnotes
The authors declare no competing interests
Supplementary Information is available for this paper
References
- 1.Schoenfelder S. et al. Preferential associations between co-regulated genes reveal a transcriptional interactome in erythroid cells. Nat Genet 42, 53–61, doi: 10.1038/ng.496 (2010). [DOI] [PMC free article] [PubMed] [Google Scholar]
- 2.Li G. et al. Extensive promoter-centered chromatin interactions provide a topological basis for transcription regulation. Cell 148, 84–98, doi: 10.1016/j.cell.2011.12.014 (2012). [DOI] [PMC free article] [PubMed] [Google Scholar]
- 3.Jung I. et al. A compendium of promoter-centered long-range chromatin interactions in the human genome. Nature Genetics 51, 1442–1449, doi: 10.1038/s41588-019-0494-8 (2019). [DOI] [PMC free article] [PubMed] [Google Scholar]
- 4.Jacob F. & Monod J. Genetic regulatory mechanisms in the synthesis of proteins. J Mol Biol 3, 318–356, doi: 10.1016/s0022-2836(61)80072-7 (1961). [DOI] [PubMed] [Google Scholar]
- 5.Long HK, Prescott SL & Wysocka J. Ever-Changing Landscapes: Transcriptional Enhancers in Development and Evolution. Cell 167, 1170–1187, doi: 10.1016/j.cell.2016.09.018 (2016). [DOI] [PMC free article] [PubMed] [Google Scholar]
- 6.Sanyal A, Lajoie BR, Jain G. & Dekker J. The long-range interaction landscape of gene promoters. Nature 489, 109–113, doi: 10.1038/nature11279 (2012). [DOI] [PMC free article] [PubMed] [Google Scholar]
- 7.Furlong EEM & Levine M. Developmental enhancers and chromosome topology. Science 361, 1341–1345, doi: 10.1126/science.aau0320 (2018). [DOI] [PMC free article] [PubMed] [Google Scholar]
- 8.Lunde K, Biehs B, Nauber U. & Bier E. The knirps and knirps-related genes organize development of the second wing vein in Drosophila. Development 125, 4145–4154 (1998). [DOI] [PubMed] [Google Scholar]
- 9.Scuderi A, Simin K, Kazuko SG, Metherall JE & Letsou A. scylla and charybde, homologues of the human apoptotic gene RTP801, are required for head involution in Drosophila. Dev Biol 291, 110–122, doi: 10.1016/j.ydbio.2005.12.014 (2006). [DOI] [PubMed] [Google Scholar]
- 10.Cheng Y. et al. Co-regulation of invected and engrailed by a complex array of regulatory sequences in Drosophila. Dev Biol 395, 131–143, doi: 10.1016/j.ydbio.2014.08.021 (2014). [DOI] [PMC free article] [PubMed] [Google Scholar]
- 11.Stathopoulos A, Tam B, Ronshaugen M, Frasch M. & Levine M. pyramus and thisbe: FGF genes that pattern the mesoderm of Drosophila embryos. Genes Dev 18, 687–699, doi: 10.1101/gad.1166404 (2004). [DOI] [PMC free article] [PubMed] [Google Scholar]
- 12.Rothe M, Wimmer EA, Pankratz MJ, González-Gaitán M. & Jäckle H. Identical transacting factor requirement for knirps and knirps-related gene expression in the anterior but not in the posterior region of the Drosophila embryo. Mechanisms of Development 46, 169–181, doi: 10.1016/0925-4773(94)90069-8 (1994). [DOI] [PubMed] [Google Scholar]
- 13.Zinani OQH, Keseroğlu K, Ay A. & Özbudak EM Pairing of segmentation clock genes drives robust pattern formation. Nature 589, 431–436, doi: 10.1038/s41586-020-03055-0 (2021). [DOI] [PMC free article] [PubMed] [Google Scholar]
- 14.Michalak P. Coexpression, coregulation, and cofunctionality of neighboring genes in eukaryotic genomes. Genomics 91, 243–248, doi: 10.1016/j.ygeno.2007.11.002 (2008). [DOI] [PubMed] [Google Scholar]
- 15.Tomancak P. et al. Global analysis of patterns of gene expression during Drosophila embryogenesis. Genome Biol 8, R145, doi: 10.1186/gb-2007-8-7-r145 (2007). [DOI] [PMC free article] [PubMed] [Google Scholar]
- 16.Hammonds AS et al. Spatial expression of transcription factors in Drosophila embryonic organ development. Genome Biol 14, R140, doi: 10.1186/gb-2013-14-12-r140 (2013). [DOI] [PMC free article] [PubMed] [Google Scholar]
- 17.Hsieh T-HS et al. Resolving the 3D Landscape of Transcription-Linked Mammalian Chromatin Folding. Molecular Cell 78, 539–553.e538, doi: 10.1016/j.molcel.2020.03.002 (2020). [DOI] [PMC free article] [PubMed] [Google Scholar]
- 18.Krietenstein N. et al. Ultrastructural Details of Mammalian Chromosome Architecture. Molecular Cell 78, 554–565.e557, doi: 10.1016/j.molcel.2020.03.003 (2020). [DOI] [PMC free article] [PubMed] [Google Scholar]
- 19.Rowley MJ et al. Analysis of Hi-C data using SIP effectively identifies loops in organisms from C. elegans to mammals. Genome Res 30, 447–458, doi: 10.1101/gr.257832.119 (2020). [DOI] [PMC free article] [PubMed] [Google Scholar]
- 20.Cusanovich DA et al. The cis-regulatory dynamics of embryonic development at single-cell resolution. Nature 555, 538–542, doi: 10.1038/nature25981 (2018). [DOI] [PMC free article] [PubMed] [Google Scholar]
- 21.Gaskill MM, Gibson TJ, Larson ED & Harrison MM GAF is essential for zygotic genome activation and chromatin accessibility in the early Drosophila embryo. eLife 10, doi: 10.7554/elife.66668 (2021). [DOI] [PMC free article] [PubMed] [Google Scholar]
- 22.Fukaya T, Lim B. & Levine M. Enhancer Control of Transcriptional Bursting. Cell 166, 358–368, doi: 10.1016/j.cell.2016.05.025 (2016). [DOI] [PMC free article] [PubMed] [Google Scholar]
- 23.Chen H. et al. Dynamic interplay between enhancer–promoter topology and gene activity. Nature Genetics 50, 1296–1303, doi: 10.1038/s41588-018-0175-z (2018). [DOI] [PMC free article] [PubMed] [Google Scholar]
- 24.Garcia HG, Tikhonov M, Lin A. & Gregor T. Quantitative imaging of transcription in living Drosophila embryos links polymerase activity to patterning. Curr Biol 23, 2140–2145, doi: 10.1016/j.cub.2013.08.054 (2013). [DOI] [PMC free article] [PubMed] [Google Scholar]
- 25.Ghavi-Helm Y. et al. Enhancer loops appear stable during development and are associated with paused polymerase. Nature 512, 96–100, doi: 10.1038/nature13417 (2014). [DOI] [PubMed] [Google Scholar]
- 26.Benabdallah NS et al. Decreased Enhancer-Promoter Proximity Accompanying Enhancer Activation. Molecular Cell 76, 473–484.e477, doi: 10.1016/j.molcel.2019.07.038 (2019). [DOI] [PMC free article] [PubMed] [Google Scholar]
- 27.Calhoun VC, Stathopoulos A. & Levine M. Promoter-proximal tethering elements regulate enhancer-promoter specificity in the Drosophila Antennapedia complex. Proc Natl Acad Sci U S A 99, 9243–9247, doi: 10.1073/pnas.142291299 (2002). [DOI] [PMC free article] [PubMed] [Google Scholar]
- 28.Batut PJ et al. Genome organization controls transcriptional dynamics during development. Science 375, 566–570, doi: 10.1126/science.abi7178 (2022). [DOI] [PMC free article] [PubMed] [Google Scholar]
- 29.Judd J, Duarte FM & Lis JT Pioneer-like factor GAF cooperates with PBAP (SWI/SNF) and NURF (ISWI) to regulate transcription. Genes & Development 35, 147–156, doi: 10.1101/gad.341768.120 (2021). [DOI] [PMC free article] [PubMed] [Google Scholar]
- 30.Tsai A. et al. Nuclear microenvironments modulate transcription from low-affinity enhancers. Elife 6, doi: 10.7554/eLife.28975 (2017). [DOI] [PMC free article] [PubMed] [Google Scholar]
- 31.Mir M. et al. Dynamic multifactor hubs interact transiently with sites of active transcription in Drosophila embryos. Elife 7, doi: 10.7554/eLife.40497 (2018). [DOI] [PMC free article] [PubMed] [Google Scholar]
- 32.Tsai A, Alves MR & Crocker J. Multi-enhancer transcriptional hubs confer phenotypic robustness. Elife 8, doi: 10.7554/eLife.45325 (2019). [DOI] [PMC free article] [PubMed] [Google Scholar]
- 33.Li J. et al. Single-gene imaging links genome topology, promoter-enhancer communication and transcription control. Nat Struct Mol Biol 27, 1032–1040, doi: 10.1038/s41594-020-0493-6 (2020). [DOI] [PMC free article] [PubMed] [Google Scholar]
- 34.Eagen KP, Aiden EL & Kornberg RD Polycomb-mediated chromatin loops revealed by a subkilobase-resolution chromatin interaction map. Proc Natl Acad Sci U S A 114, 8764–8769, doi: 10.1073/pnas.1701291114 (2017). [DOI] [PMC free article] [PubMed] [Google Scholar]
- 35.Ogiyama Y, Schuettengruber B, Papadopoulos GL, Chang JM & Cavalli G. Polycomb-Dependent Chromatin Looping Contributes to Gene Silencing during Drosophila Development. Mol Cell 71, 73–88 e75, doi: 10.1016/j.molcel.2018.05.032 (2018). [DOI] [PubMed] [Google Scholar]
- 36.Kyrchanova O. et al. The bithorax complex iab-7 Polycomb response element has a novel role in the functioning of the Fab-7 chromatin boundary. PLoS Genet 14, e1007442, doi: 10.1371/journal.pgen.1007442 (2018). [DOI] [PMC free article] [PubMed] [Google Scholar]
- 37.Espinola SM et al. Cis-regulatory chromatin loops arise before TADs and gene activation, and are independent of cell fate during early Drosophila development. Nat Genet 53, 477–486, doi: 10.1038/s41588-021-00816-z (2021). [DOI] [PubMed] [Google Scholar]
- 38.Ing-Simmons E. et al. Independence of chromatin conformation and gene regulation during Drosophila dorsoventral patterning. Nat Genet 53, 487–499, doi: 10.1038/s41588-021-00799-x (2021). [DOI] [PMC free article] [PubMed] [Google Scholar]
- 39.Di Giammartino DC et al. KLF4 is involved in the organization and regulation of pluripotency-associated three-dimensional enhancer networks. Nature Cell Biology 21, 1179–1190, doi: 10.1038/s41556-019-0390-6 (2019). [DOI] [PMC free article] [PubMed] [Google Scholar]
- 40.Fanucchi S, Shibayama Y, Burd S, Marc & Musa. Chromosomal Contact Permits Transcription between Coregulated Genes. Cell 155, 606–620, doi: 10.1016/j.cell.2013.09.051 (2013). [DOI] [PubMed] [Google Scholar]
- 41.Spilianakis CG & Flavell RA Long-range intrachromosomal interactions in the T helper type 2 cytokine locus. Nature Immunology 5, 1017–1027, doi: 10.1038/ni1115 (2004). [DOI] [PubMed] [Google Scholar]
- 42.Allahyar A. et al. Enhancer hubs and loop collisions identified from single-allele topologies. Nature Genetics 50, 1151–1160, doi: 10.1038/s41588-018-0161-5 (2018). [DOI] [PubMed] [Google Scholar]
- 43.Montavon T. et al. A regulatory archipelago controls Hox genes transcription in digits. Cell 147, 1132–1145, doi: 10.1016/j.cell.2011.10.023 (2011). [DOI] [PubMed] [Google Scholar]
- 44.Alliance of Genome Resources, C. Alliance of Genome Resources Portal: unified model organism research platform. Nucleic Acids Res 48, D650–D658, doi: 10.1093/nar/gkz813 (2020). [DOI] [PMC free article] [PubMed] [Google Scholar]
- 45.Dao LTM et al. Genome-wide characterization of mammalian promoters with distal enhancer functions. Nat Genet 49, 1073–1081, doi: 10.1038/ng.3884 (2017). [DOI] [PubMed] [Google Scholar]
- 46.Diao Y. et al. A tiling-deletion-based genetic screen for cis-regulatory element identification in mammalian cells. Nat Methods 14, 629–635, doi: 10.1038/nmeth.4264 (2017). [DOI] [PMC free article] [PubMed] [Google Scholar]
- 47.Pachano T. et al. Orphan CpG islands amplify poised enhancer regulatory activity and determine target gene responsiveness. Nat Genet 53, 1036–1049, doi: 10.1038/s41588-021-00888-x (2021). [DOI] [PMC free article] [PubMed] [Google Scholar]
- 48.Schroeder MD, Greer C. & Gaul U. How to make stripes: deciphering the transition from non-periodic to periodic patterns in Drosophila segmentation. Development 138, 3067–3078, doi: 10.1242/dev.062141 (2011). [DOI] [PMC free article] [PubMed] [Google Scholar]
- 49.Kvon EZ et al. Genome-scale functional characterization of Drosophila developmental enhancers in vivo. Nature 512, 91–95, doi: 10.1038/nature13395 (2014). [DOI] [PubMed] [Google Scholar]
- 50.Wieschaus E. & Nusslein-Volhard C. The Heidelberg Screen for Pattern Mutants of Drosophila: A Personal Account. Annu Rev Cell Dev Biol 32, 1–46, doi: 10.1146/annurev-cellbio-113015-023138 (2016). [DOI] [PubMed] [Google Scholar]
- 51.Lim B, Heist T, Levine M. & Fukaya T. Visualization of Transvection in Living Drosophila Embryos. Molecular Cell 70, 287–296.e286, doi: 10.1016/j.molcel.2018.02.029 (2018). [DOI] [PMC free article] [PubMed] [Google Scholar]
- 52.Rogers WA, Goyal Y, Yamaya K, Shvartsman SY & Levine MS Uncoupling neurogenic gene networks in the Drosophila embryo. Genes Dev 31, 634–638, doi: 10.1101/gad.297150.117 (2017). [DOI] [PMC free article] [PubMed] [Google Scholar]
- 53.Ren X. et al. Optimized gene editing technology for Drosophila melanogaster using germ line-specific Cas9. Proc Natl Acad Sci U S A 110, 19012–19017, doi: 10.1073/pnas.1318481110 (2013). [DOI] [PMC free article] [PubMed] [Google Scholar]
- 54.Dubuis JO, Samanta R. & Gregor T. Accurate measurements of dynamics and reproducibility in small genetic networks. Molecular Systems Biology 9, 639, doi: 10.1038/msb.2012.72 (2013). [DOI] [PMC free article] [PubMed] [Google Scholar]
- 55.Fukaya T, Lim B. & Levine M. Rapid Rates of Pol II Elongation in the Drosophila Embryo. Curr Biol 27, 1387–1391, doi: 10.1016/j.cub.2017.03.069 (2017). [DOI] [PMC free article] [PubMed] [Google Scholar]
- 56.Li H. & Durbin R. Fast and accurate short read alignment with Burrows-Wheeler transform. Bioinformatics 25, 1754–1760, doi: 10.1093/bioinformatics/btp324 (2009). [DOI] [PMC free article] [PubMed] [Google Scholar]
- 57.Abdennur N. & Mirny LA Cooler: scalable storage for Hi-C data and other genomically labeled arrays. Bioinformatics 36, 311–316, doi: 10.1093/bioinformatics/btz540 (2020). [DOI] [PMC free article] [PubMed] [Google Scholar]
- 58.Kerpedjiev P. et al. HiGlass: web-based visual exploration and analysis of genome interaction maps. Genome Biol 19, 125, doi: 10.1186/s13059-018-1486-1 (2018). [DOI] [PMC free article] [PubMed] [Google Scholar]
- 59.Kruse K, Hug CB & Vaquerizas JM FAN-C: a feature-rich framework for the analysis and visualisation of chromosome conformation capture data. Genome Biol 21, 303, doi: 10.1186/s13059-020-02215-9 (2020). [DOI] [PMC free article] [PubMed] [Google Scholar]
- 60.Wood AM et al. Regulation of chromatin organization and inducible gene expression by a Drosophila insulator. Mol Cell 44, 29–38, doi: 10.1016/j.molcel.2011.07.035 (2011). [DOI] [PMC free article] [PubMed] [Google Scholar]
- 61.Larkin A. et al. FlyBase: updates to the Drosophila melanogaster knowledge base. Nucleic Acids Res 49, D899–D907, doi: 10.1093/nar/gkaa1026 (2021). [DOI] [PMC free article] [PubMed] [Google Scholar]
- 62.Bothma JP et al. Enhancer additivity and non-additivity are determined by enhancer strength in the Drosophila embryo. eLife 4, doi: 10.7554/elife.07956 (2015). [DOI] [PMC free article] [PubMed] [Google Scholar]
Associated Data
This section collects any data citations, data availability statements, or supplementary materials included in this article.
Supplementary Materials
Data Availability Statement
All Micro-C data is available under GEO accession number: GSE173518.
The following publicly available databases and data sets were used: FlyBase r6.40 (https://flybase.org/) using dm6 reference genome, BDGP in situ database (https://insitu.fruitfly.org/), Fly Enhancer @ stark lab (https://enhancers.starklab.org/). ChIP-seq data for Zelda: GSE30757, Cohesin: GSE54529, CTCF+CP190: GSE30740, Pc: GSE68983, Pho+Ph: GSE77342, Cg: GSE77582, CLAMP: GSE39271 and GAF: GSE152773. RAMPAGE TSS profiling: GSE36213
ATAC-seq data: GSE152771.