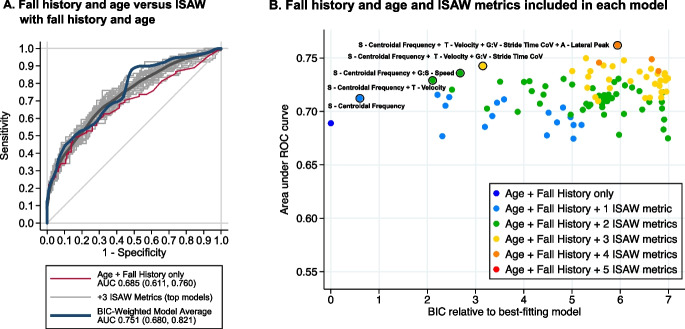
Fig. 4.
ROC curves for discriminating between fallers and non-fallers with each model including fall history and age with ISAW metrics, and model that includes fall history and age, only, is shown in red (A). B Plot of best-fitting 100 models for distinguishing future fallers from non-fallers based on AUC versus best-fitting models (Bayesian information criterion (BIC) best is zero on this scale) for ISAW metrics alone (color-coded by number of ISAW metrics) and fall history and age with ISAW metrics. The strongest models are circled in black with a list of the included ISAW metrics. Notice that sway (S) was the most commonly included ISAW domain

