

Abstract
Improving air flow and ventilation in an indoor environment is central to mitigating the airborne transmission of aerosols. Examples include, COVID-19 or similar diseases that transmit by airborne aerosols or respiratory droplets. While there are standard guidelines for enhancing the ventilation of space, the effect of a ceiling fan on the ventilation has not been explored. Such an intervention could be critical, especially in a resource-limited setting. In the present work, we numerically study the effect of a rotating ceiling fan on indoor air ventilation using computational fluid dynamics (CFD) simulations. In particular, we employ RANS turbulence model and compare the computed flow fields for a stationary and rotating fan in an office room with a door and window. While a re-circulation zone spans the whole space for the stationary fan, stronger re-circulation zones and small stagnation zones appear in the flow-field inside the room for the case of a rotating fan. The re-circulation zones help bring in fresh air through the window and remove stale air through the door, thereby improving the ventilation rate by one order of magnitude. We briefly discuss the chances of infection by aerosols via flow-fields corresponding to stationary and rotating fans.
Graphical Abstract
Keywords: Fluid flow, Computational fluid dynamics, Airborne transmission
Introduction
Transmission of COVID-19 occurs primarily through SARS-CoV-2 virus-laden droplets and aerosols inhaled directly or transmitted from contaminated surfaces (Bourouiba 2020; Mittal et al. 2020; Stockman et al. 2021; Jayaweera et al. 2020; Siddiquie et al. 2020; Mariam et al. 2021; Chea et al. 2021). Effective mitigation measures necessitate clear understanding of droplet and aerosol transport in air (Agrawal and Bhardwaj 2020, 2021; Chaudhuri et al. 2022), droplet retention by a surface (Bhardwaj and Agrawal 2020; Chatterjee et al. 2021), droplet evaporation kinetics in different environments (Bhardwaj and Agrawal 2020; Chatterjee et al. 2021; Shyam et al. 2022), and interaction of droplet with a surface of personal protective equipment (Bhardwaj and Agrawal 2020; Mittal et al. 2020; Kumar et al. 2021; Narayan et al. 2022).
Aerosols are generated during exhalation, talking, coughing, sneezing, and other activities (Bourouiba 2020; Simha and Rao 2020; Stockman et al. 2021). The viral-laden droplets deposited on the surface may be taken care of to a great extent by regular workplace sanitation and frequent hand washing. However, the virus’s airborne transmission during inhalation is still a significant concern in indoor environments, for example, workplaces, offices, elevators, schools, and colleges (Sinha et al. 2022; Sen 2021; Liu et al. 2021). For instance, Quinn and Russo (2022) studied impact of using outdoor spaces in primary schools on play and learning of the students. According to the World health organization (WHO), the “three Cs” describing the settings where the transmission is more likely are: (i) Crowded places, (ii) Close-contact settings (especially where people have conversations very near each other) such as (iii) Confined and enclosed spaces with poor ventilation. The transmission risk further increases if these “3Cs” overlap.
Various studies have been conducted on the transmission in the outdoor environment (Qian et al. 2006; Behera et al. 2021). However, the distribution of aerosols in an indoor environment differs significantly due to the appearance of different flow patterns. Some of the generated aerosols exit the system through ventilation in indoor environments, also known as displacement ventilation (Linden 1999; Bhagat et al. 2020; Yang et al. 2022). For instance, Bhagat et al. (2020) concluded that indoor ventilation should enhance vertical stratification, that could be helpful in removing stale warm air near the ceiling. Some droplets deposit on surfaces in the room and may settle or re-enter the air, and others may be directly inhaled. On the other hand, in mixing ventilation, a mixing of air is achieved to obtain a uniform spatial distribution of temperature for thermal comfort (Linden 1999). Maximizing the fraction of particles that exit the system and minimizing aerosol deposition on people is vital to reduce the transmission (Wang et al. 2021; Mirikar et al. 2021). The spread and distribution of droplets in an indoor environment are dependent on the surfaces or obstructions present, ventilation rates, location of the ventilation, and re-circulation and stagnation zones. Examples of some of the recent interventions to improve indoor ventilation in the context of COVID-19 are optimizing location of outlet vents (Mariam et al. 2021). In addition, it has been shown that the use of air-purifiers significantly reduces indoor airborne transmission risk (Dbouk et al. 2021).
A brief literature survey shows that identifying the re-circulation and stagnation zones and the ventilation rates inside indoor conditions becomes essential to minimize the airborne transmission of the virus. Ceiling fans, in general, are used in indoor conditions for thermal comfort, but in many situations, they can also help provide better mixing ventilation. However, the benefit of employing a ceiling fan in mitigating the spread of aerosols and understanding their transmission has not been studied, to the best of our knowledge. While the use of a ceiling fan has been recommended for better air mixing by WHO, to the authors’ knowledge, there is no study available to directly improve the ventilation by a ceiling fan in the context of reducing aerosols transmission. Keeping these issues in mind, we have simulated a typical office to understand the natural ventilation of the room without a fan, and the change in flow pattern with the fan turned on. The focus of this study is on finding out the possible stagnation and re-circulation zones in the room where the virus-laden droplets may get trapped, thereby increasing the chances of infection for the occupants in the room.
In this paper, we first estimate the requirements of indoor ventilation if an infected person is present in a given room (“Ventilation requirements”). Second, we employ three-dimensional computational fluid dynamics (CFD) simulations to compute the flow field in the presence of a rotating ceiling fan in a typical office room (“Numerical methodology”). Third, we compare and contrast the flow fields at different fan speeds and locate associated stagnation and recirculation zones (“Effect of fan speed on flow-field”). Lastly, we quantify the improvement in ventilation by the ceiling fan as a function of its speed (“Improvement in ventilation”) and discuss the implications of these results in mitigating the airborne transmission of aerosols (“Implications in mitigating airborne transmission”).
Ventilation Requirements
We estimate how much improvement in the ventilation is required in the room, as per WHO guidelines. The office room with realistic dimensions considered in this study is shown in Fig. 1a. The room air ventilation is quantified by air change per hour, ACH, the ratio of fresh air volume entering into a given space in one hour, and total space volume (V). It is given by Chartier and Pessoa-Silva (2009); Bazant and Bush (2021),
| 1 |
where Q is the volumetric flow rate of fresh air [ms] entering the room of volume [m]. Often Q is expressed in L/s (liters per second) and is also known as the ventilation rate. It is calculated as follows,
| 2 |
where is the area through which fresh air enters the room, and V is the magnitude of airflow velocity through this area. As expected, a higher ACH and Q correspond to better ventilation.
Fig. 1.

a Computational domain of the room with rotating ceiling fan. All dimensions shown are in meters. b Computational domain of the fan. c Mesh for the room. d Zoomed-in view of the mesh around the ceiling fan
According to WHO guidelines [34], a ventilation rate of 60 L/s/patient is required in health-care settings while 10 L/s/person is needed in non-healthcare settings. We consider that a baseline ventilation rate is available in the considered room by the opening of some part of the window and door. The typical ACH in an indoor environment is 8 and we consider 20% of this value, i.e., 1.6, as a conservative estimate. A conservative 20% opening of window and door is assumed for this baseline ventilation to be available in the room. The volume of the room is 49.8 m, and the area of the window and door are 2.9 and 2.1 m, respectively (Fig. 1a). The values of area through which the ventilation is available by the window and door are 0.6 and 0.4 m, respectively, with 20% availability of the area for the ventilation. Thus, the total area of the ventilation is 1 m and the available ventilation rate computed using Eq. 2 is 22 L/s. While this ventilation satisfies the requirement of two persons as per WHO guidelines [34], the required ventilation is 120 L/s for two infected persons and 60 L/s for six healthy persons in the room. Considering a worst-case scenario of 6 infected persons in the room, we need a ventilation rate of 360 L/s as per WHO guidelines. Therefore, the required ventilation could be one order of magnitude larger than the baseline ventilation. Overall, these first-order calculations demonstrate the importance of improving the ventilation rate in mitigating aerosols transmission even if baseline ventilation is already available in an indoor environment.
Numerical Methodology
We carried out high-fidelity, three-dimensional computational fluid dynamics (CFD) simulations to understand the role of a ceiling fan in improving ventilation. We employed Reynolds Averaged Navier-Stokes equations (RANS) to simulate the flow in the room, using a commercial CFD software, Ansys Fluent 2020R2 (2020). A multiple reference frame approach along with the standard k - turbulence model was used to simulate the rotating fan inside the room (Fig. 1a). The details of the methodology are provided in the following sub-sections.
Simulation Setup
Numerical simulations in this study are conducted for a typical office room (Fig. 1a). The dimensions of the office are as follows: office room dimension is 4.6 m (Z) 3 m (X) 3.6 m (Y) with 1.1 m 1.9 m door and 2.4 m 1.2 m window. A three-dimensional model of the office room was generated in the ANSYS modeler (Fig. 1a, b). The fan dimensions in the present study are the same as that of the ceiling fan (fan number 1) mentioned in Chen et al. (2018), and it is installed at 0.3 m below the ceiling surface and the center of the office room. The geometry of the ceiling fan studied in this work were obtained from an open-source CAD library (Grabcad Library 2022). The ceiling fan has a diameter of 1.2 m with 4 mm of blade thickness, where 1.5 m diameter and 0.17 m thickness of disc-shaped region encloses the ceiling fan (Zadravec et al. 2007; Firouz 2017; Chen et al. 2018). The blades of the fan and walls of the room were modeled as no-slip surface. An unstructured mesh consisting of tetrahedral elements was generated, as shown in Fig. 1c, d.
The following boundary conditions are prescribed in the model. The blades of the fan and walls of the room were modeled as no-slip surfaces. As discussed earlier, we considered a baseline natural ventilation in the room of 22 L/s. Figure 2 illustrates the boundary conditions applied on the door and window, where the area of = 0.4 m and = 0.6 m are 20% of the total area of the door and window, respectively. The remaining areas are denoted by and . We prescribe a velocity inlet boundary condition on and and a pressure outlet boundary condition on and , as illustrated in Fig. 2. The magnitude of inlet velocity using a conservative ventilation rate of 22 L/s is 0.022 m/s. Thus, using the coordinate system shown in Fig. 1a. the inlet velocity vector applied on window and door are (0, 0, 0.022) m/s and (0, 0, − 0.022) m/s, respectively. In the present study, ventilation rate Q through the window or door is computed by numerically integrating the following equation,
| 3 |
where A is the total area of the window and door, is the velocity vector, is the normal outward unit vector on the window or door, and dA is the elemental area.
Fig. 2.
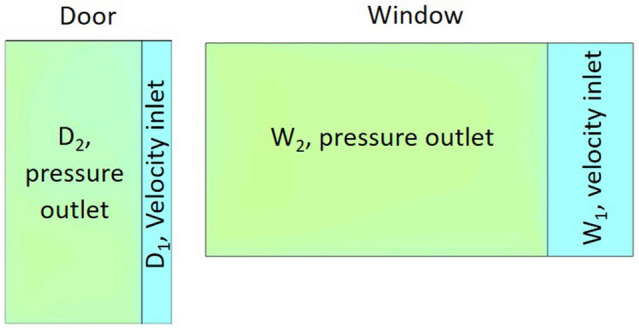
Boundary conditions applied on the door and window. The areas of and are 20% of the total area of the door and window, respectively, and velocity inlet boundary condition is imposed on and . and are the 80% area of the door and window, respectively, and pressure outlet boundary condition is applied on and
Choice of Turbulence Model
To simulate turbulent airflow inside a room, in general, three CFD models are available, namely, Direct Numerical Simulation (DNS), Large Eddy Simulation (LES), and Reynolds-Averaged Navier-Stokes (RANS). While DNS and LES are the most common approaches, they are computationally expensive compared to the RANS. The RANS is widely used by several commercial CFD software because it is the least computationally expensive of the three approaches. RANS is based on solving the time-averaged flow field governing equations. This means that all the unsteadiness is considered part of the turbulence and averaged out. On the other hand, LES is based on the spatial filtering of the turbulent structures. The fluid flow is separated into large eddies and small eddies. The governing equations solve the larger ones, and the smaller ones are approximated and described by suitable subgrid-scale models. Despite their reliability, LES models are time-consuming, and for this reason, they are seldom used unless a high precision is required. On the contrary, RANS models require less computing time but careful validation of the obtained results. We employed RANS to simulate the flow in the room, using a commercial CFD software, Ansys Fluent 2020R2 (2020). In particular, we employ the standard model. The spatial discretization used in the present solver is second-order accurate. The SIMPLE (Semi-Implicit Method for Pressure Linked Equations) algorithm (Patankar 2018) is used for pressure velocity coupling.
The multiple reference frame (MRF) method simulates the rotating motion of ceiling fans. In this method, the rotating wall surfaces of the fan are treated as stationary boundaries with respect to the rotating disc-shaped region. The acceleration of the fluid is supplemented by additional terms that appear in the Navier-Stokes equations, which is solved in this rotating reference frame. The MRF method is often used for steady-state conditions compared to dynamic mesh methods generally used for transient conditions (Lien and Ahmed 2010; Pichurov et al. 2015). Generally, three types of turbulence models have been used in the simulations of a rotating fan (Zhu et al. 2014; Jain et al. 2004; Babich et al. 2017): standard , realizable , and SST . Since with the MRF technique, the standard turbulence model works well (Chen et al. 2018), we employ the standard turbulence model in the present study.
Grid-Size Independence Study
A grid-size independence test was conducted with three grids with the following number of unstructured tetrahedral cells: 5.0, 7.2 and 12.5 million. In these three sets of the grids, the finer grid sizes are = 0.04 m, 0.025 m, and 0.01 m and coarser grid sizes are = 0.15 m, 0.11 m, and 0.08 m, respectively. The finer grid size is used in a disc region enclosing the ceiling fan, which ensures that the fluid dynamics near the body is computed accurately. The grids are plotted in Fig. 1c, d. We compare the profile of resultant velocity magnitude along the Z direction. The computed results indicates that a gird with 7.2 million grids shows an insignificant difference compared to a finer mesh of 12.5 million (Fig. 3). Consequently, grid with 7.2 million cells was considered adequate and employed for all further simulations.
Fig. 3.
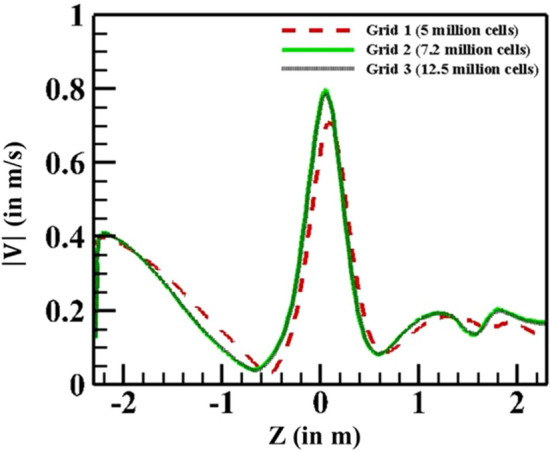
Grid-size independence test results for resultant velocity magnitude plotted at X = 0, Y = − 1.8 along the Z direction in the YZ plane for office room with ceiling fan rotating at 115 RPM
Validation of Flow-Field with a Rotating Ceiling Fan
Before carrying out full-scale simulations involving a three-blade rotating fan, a detailed validation study was performed for a rotating fan inside an indoor room against computational results of Chen et al. (2018). We consider the dimensions of the ceiling fan (fan number 1) mentioned in Chen et al. (2018). The computational domain and boundary conditions are kept the same as in the previous study (Chen et al. 2018). As mentioned earlier, we applied the MRF model to analyze the effect of rotating ceiling fans in a classroom. MRF is computationally inexpensive compared to another popular method, the dynamic mesh technique. The validation has been carried out for a single fan in a classroom rotating at 115 RPM with a 2.5 m ceiling height, and the distance between ceiling and fan is 0.3 m. In this code-validation study, the coordinate system is the same as Chen et al. (2018). The computed velocity distribution along Y-direction at different vertical locations from the ground is shown in Fig. 4 and is compared with published data. A very good agreement between the present numerical model and the numerical results of Chen et al. (2018) was observed. This detailed validation exercise, comprising two velocity components and three locations, helps induce confidence in the results presented in the present paper. We note that Chen et al. (2018) validated their numerical simulations with their experiments. Since we have validated our numerical results with Chen et al., our numerical study has been indirectly validated with those experiments.
Fig. 4.

Comparison of simulated velocity profiles with Chen et al. (2018) at different locations from the floor at a 1.7 m, b 1.1 m, c 0.6 m, d 0.1 m
Results and Discussion
Effect of Fan Speed on Flow-Field
We explain salient features of computed flow field and its role in improving ventilation by employing the ceiling fan. We consider three cases of fan speed (i) 0 RPM i.e, a stationary fan (ii) 115 RPM (iii) 250 RPM. The selected fan speeds of 0, 115, and 250 RPM roughly correspond to a ceiling fan’s typical speed control. The airflow distribution inside the room for these cases is shown in Figs. 5 and 6. Specifically, Fig. 5a−e shows the velocity vector field for five different YZ planes for the three cases. The following X locations of the planes, X = − 1.4, − 1.1, 0, 1.1, 1.4 m, are selected to elucidate the flow in regions near the door, window, and walls. The flow fields in different XZ planes are shown in Fig. 6a−d.
Fig. 5.

Velocity vectors showing flow field in various YZ planes at locations a b c d e . Three consecutive vectors have not been plotted to illustrate the flow field clearly
Fig. 6.

Velocity vectors showing flow field in various XZ planes at locations a b c d
In the case of 0 RPM, the flow is almost stagnant at compared to the rotating fan cases. A straight jet-like flow with re-circulation regions at the top and bottom of the YZ plane can be seen in Fig. 5d. This is attributed to the velocity inlet condition imposed at the window through the presence of baseline ventilation. Similarly, a jet-like flow is seen in the XZ plane due to the velocity inlet boundary condition considered on the door and window due to baseline ventilation already present in the room (Fig. 6b-d). Consequently, a re-circulation zone with a small velocity appears in the middle of the room.
For the cases of the rotating fan, a larger magnitude of the velocity with the fan as compared to without a fan is evident from Figs. 5 and 6. Thus, the air circulation is much stronger for 115 and 250 RPM cases than in the 0 RPM case. The amount of air circulation in the room can be gauged by comparing the velocity vectors with the reference vector, which is 50 times larger than the stationary fan. The flow pattern on the symmetry plane (X = 0) shown in Fig. 5c. The flow field in this figure reveals that re-circulation regions are formed on either side of the impingement as the jet emanating from the rotating fan hits the floor. A re-circulation zone can be observed on the right side of the jet at 115 RPM, whereas on the left half near the door (Fig. 5a, b), there is the absence of a re-circulation zone since the spreading jet leaves through the door. After hitting the floor, the impinging jet spreads on the right half and strikes the wall below the window. Therefore, the wall helps form a re-circulation zone on the right half. The re-circulation zone forms on both sides of the jet after because of the presence of the wall region. The intensity of the re-circulation region increases as the fan speed increases to 250 RPM. Figure 6 shows the flow field at various XZ or horizontal planes at different fan speeds. The re-circulation zones are quite prominent at planes X = − 1.8 and − 2.1 m except for two extreme planes at X = − 0.6 and − 3.0 m. The intensity of re-circulation at 250 RPM is also higher in the horizontal plane. In Fig. 7, we quantitatively plot Z velocity profile at X = − 1.1 m plane, containing both window and door areas. It is negative at 0 RPM and shows that most of the flow is from door to window. On the contrary, the flow direction is from the window to the door for the rotating fan since fresh air enters through the window.
Fig. 7.

Z velocity profile for YZ plane at location X =− 1.1 m for different fan speeds a 0 RPM b 115 RPM c 250 RPM
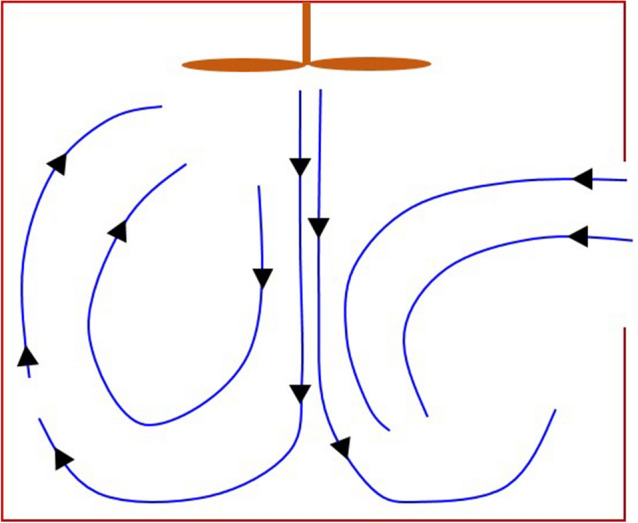
We compare and contrast the flow-field in these three cases to understand the effect of the fan as follows. The earlier discussion of the flow field suggests the existence of two types of zones, namely, re-circulation and stagnation zone. The stagnation zone has around zero absolute velocity. Figure 8 schematically illustrates re-circulation and stagnation zones for stationary and rotating fans, plotted in the YZ plane for both cases. In the case of the stationary fan, the re-circulation and stagnation regions extend horizontally over the length of the room and are present near the floor and ceiling of the room (Fig. 8a). However, the rotation of the fan leads to two stronger re-circulation regions near the floor, one is slightly away from the door, and the second is close to the wall below the window (Fig. 8b). As discussed earlier, this is attributed to jet-like flow resulting from the rotating fan. Two stagnation zones also appear near to ceiling for the case of rotating fan, as shown in Fig. 8b.
Fig. 8.

Schematic of the flow field inside the room at different fan speeds a 0 RPM and b 115 RPM
Improvement in Ventilation
We quantify the ventilation rate and ACH for stationary and rotating fan cases further. Table 1 lists the computed initial and modified ventilation rates and ACH values. As discussed earlier, the initial values correspond to the baseline ventilation already present in the room.
Table 1.
Computed initial and modified ventilation rate and ACH for different cases of fan speed
| Case | Fan | Initial | Modified | Initial | Modified |
|---|---|---|---|---|---|
| number | speed | ventilation rate | ventilation rate | ACH | ACH |
| RPM | [L/s] | [L/s] | [/hr] | [/hr] | |
| 1 | 0 | 22.1 | 22.7 | 1.6 | 1.62 |
| 2 | 115 | 22.1 | 249.6 | 1.6 | 17.8 |
| 3 | 250 | 22.1 | 517.8 | 1.6 | 36.9 |
The data in Table 1 shows that an increase in fan speed improves the ventilation rate and ACH significantly. The computed ventilation increases linearly with an increase in fan speed. This finding is consistent with the general perception and is the primary reason for the use of fans in domestic and office rooms. The ventilation rate at 250 RPM is adequate for the worst-case scenario of 6 infected persons in the room, which needs a 360 L/s ventilation rate, as per WHO guidelines. The increase in ventilation with the fan speed can be explained by contours of normal velocity (Z component) magnitude on door and window, plotted in Fig. 9a-c. While the fan is stationary, no flow is observed through the outlet of the window and door, i.e., and (Fig. 9a). The ventilation depends on the flow that is coming into the room from 20% of the window and door i.e., and and thereby, a lower value of ACH is obtained (Table 1). However, the fan rotation induces a strong flow into the room from the area of the window, which is confirmed by normal velocity contours in Fig. 9b,c. Similarly, a strong outflow from the room through the area of the door is noted in Fig. 9b,c. Therefore, a larger ventilation rate and ACH in the case of rotating fan are attributed to a larger inflow and outflow through the window and door, respectively.
Fig. 9.

Z-component velocity contours at the window and door, where red represents outflow and inflow, at door and window, respectively. Difference cases of the speed of the fan are shown a 0 RPM b 115 RPM c 250 RPM
Implications in Mitigating Airborne Transmission
We discuss the implications of the present results in mitigating aerosols transmission, which may occur through airborne virus-laden droplets or aerosols. In the case of a stationary fan, aerosols may get trapped in the stagnation zone, thereby remain floated for a very long duration because of the absence of flow in this zone. This may lead to higher chances of infection. In particular, the vertical extent of both the re-circulation and stagnation regions present near the floor is approximately 4 feet in size. A person’s height in a sitting position is also close to 4 feet. Therefore, when the fan is not running, the probability of getting infected by the virus increases for a person sitting in the room.
By contrast, the stagnation zones shift near the ceiling for a rotating fan, and the re-circulation regions are created near the floor move towards the corner of the room. The re-circulation zone at the bottom of the window helps bring fresh air from outside, increasing the ventilation rate. While the re-circulation region can also lead to the transmission of the virus, the associated ventilation rate is very high. Because of the higher ventilation rate, the probability of transmission of the virus will be relatively lower in the case of rotating fans. Therefore, it is highly recommended that the doors and windows always be kept open in indoor conditions, and the ceiling fans should run at their maximum speed.
Conclusions and Recommendations
In closure, we employed the RANS-based standard k- turbulence model to simulate and resolve the flow field of typical office space with a single ceiling fan. Code validation and grid-size convergence studies were performed to ensure the fidelity of the simulations. The present simulations demonstrate that the ventilation rate and ACH improve significantly (by one order of magnitude) for a rotating fan compared to without the fan. The ventilation is found to increase linearly with an increase in fan speed. This augmentation in the ventilation is explained using the flow field inside the room. In the present geometrical configuration of the room, a rotating fan pulls fresh air into the room from the window area and pushes air out of the door. The movement of air from window to door (or in the opposite direction) depends on the relative position of door and window, and the direction of rotation of the fan. A stronger re-circulation zone forms below the window by an impinging jet emanating from the rotating fan and helps in bringing fresh air from the window. Regarding the airborne transmission of aerosols, we also briefly discuss the chances of infection via flow-fields for a stationary and rotating fan. The present findings suggest that to reduce the probability of infection, doors and windows of an indoor environment should be kept open, and ceiling fans should run at the maximum speed possible since it improves the ventilation substantially. Additionally, a person is advised to sit or remain in the regions below the ceiling fan and avoid the locations of inlets and exits in the same plane of the ceiling fan, since the recirculation regions created near inlets and exit may transmit aerosols.
The present findings are particularly significant because fans are commonly employed in most tropical countries. Typical offices have a door and window and therefore the present insights should have wide applicability. There are however certain limitations of the model presented here. The presence of multiple fans, human subjects, and furniture is not considered in the room. The effect of multiple rotating fans on ventilation and the actual movement of aerosols inside the room are some of the issues that could be addressed in the future.
Acknowledgements
We gratefully acknowledge the financial support through an internal grant from Industrial Research and Consultancy Centre (IRCC), IIT Bombay.
Footnotes
Publisher's Note
Springer Nature remains neutral with regard to jurisdictional claims in published maps and institutional affiliations.
References
- Agrawal A, Bhardwaj R. Reducing chances of COVID-19 infection by a cough cloud in a closed space. Phys Fluids. 2020;32(10):101704. doi: 10.1063/5.0029186. [DOI] [PMC free article] [PubMed] [Google Scholar]
- Agrawal A, Bhardwaj R. Probability of COVID-19 infection by cough of a normal person and a super-spreader. Phys Fluids. 2021;33(03):031704. doi: 10.1063/5.0041596. [DOI] [PMC free article] [PubMed] [Google Scholar]
- Ansys Fluent 2020R2 (2020) https://www.ansys.com/products/fluids/ansys-fluent
- Babich F, Cook M, Loveday D, Rawal R, Shukla Y. Transient three-dimensional cfd modelling of ceiling fans. Build Environ. 2017;123:37–49. [Google Scholar]
- Bazant MZ, Bush JW. A guideline to limit indoor airborne transmission of covid-19. Proc Natl Acad Sci. 2021;118:17. doi: 10.1073/pnas.2018995118. [DOI] [PMC free article] [PubMed] [Google Scholar]
- Behera S, Bhardwaj R, Agrawal A. Effect of co-flow on fluid dynamics of a cough jet with implications in spread of covid-19. Phys Fluids. 2021;33(10):101701. doi: 10.1063/5.0064104. [DOI] [PMC free article] [PubMed] [Google Scholar]
- Bhagat RK, Wykes MD, Dalziel SB, Linden P. Effects of ventilation on the indoor spread of covid-19. J Fluid Mech. 2020;903:28. doi: 10.1017/jfm.2020.720. [DOI] [PMC free article] [PubMed] [Google Scholar]
- Bhardwaj R, Agrawal A. How coronavirus survives for days on surfaces. Phys Fluids. 2020;32:111706. doi: 10.1063/5.0033306. [DOI] [PMC free article] [PubMed] [Google Scholar]
- Bhardwaj R, Agrawal A. Likelihood of survival of coronavirus in a respiratory droplet deposited on a solid surface. Phys Fluids. 2020;32(6):061704. doi: 10.1063/5.0012009. [DOI] [PMC free article] [PubMed] [Google Scholar]
- Bhardwaj R, Agrawal A. Tailoring surface wettability to reduce chances of infection of covid-19 by a respiratory droplet and to improve the effectiveness of personal protection equipment. Phys Fluids. 2020;32(8):081702. doi: 10.1063/5.0020249. [DOI] [PMC free article] [PubMed] [Google Scholar]
- Bourouiba L. Turbulent gas clouds and respiratory pathogen emissions: potential implications for reducing transmission of covid-19. Jama. 2020;323(18):1837–1838. doi: 10.1001/jama.2020.4756. [DOI] [PubMed] [Google Scholar]
- Chartier Y, Pessoa-Silva C. Natural ventilation for infection control in health-care settings. World Health Organization; 2009. [PubMed] [Google Scholar]
- Chatterjee S, Murallidharan JS, Agrawal A, Bhardwaj R. Why coronavirus survives longer on impermeable than porous surfaces. Phys Fluids. 2021;33(2):021701. doi: 10.1063/5.0037924. [DOI] [PMC free article] [PubMed] [Google Scholar]
- Chatterjee S, Murallidharan JS, Agrawal A, Bhardwaj R. How coronavirus survives for hours in aerosols. Phys Fluids. 2021;33(8):081708. doi: 10.1063/5.0059908. [DOI] [PMC free article] [PubMed] [Google Scholar]
- Chaudhuri S, Kasibhatla P, Mukherjee A, Pan W, Morrison G, Mishra S, Murty VK. Analysis of overdispersion in airborne transmission of covid-19. Phys Fluids. 2022;34(5):051914. [Google Scholar]
- Chea B, Bolt A, Agelin-Chaab M, Dincer I. Assessment of effectiveness of optimum physical distancing phenomena for covid-19. Phys Fluids. 2021;33(5):051903. doi: 10.1063/5.0046429. [DOI] [PMC free article] [PubMed] [Google Scholar]
- Chen W, Liu S, Gao Y, Zhang H, Arens E, Zhao L, Liu J. Experimental and numerical investigations of indoor air movement distribution with an office ceiling fan. Build Environ. 2018;130:14–26. [Google Scholar]
- Dbouk T, Roger F, Drikakis D. Reducing indoor virus transmission using air purifiers. Phys Fluids. 2021;33(10):103301. doi: 10.1063/5.0064115. [DOI] [PMC free article] [PubMed] [Google Scholar]
- Firouz HN, Sarrafzadeh M-H, Zarghami R. Frontiers international conference on wastewater treatment and modelling. Springer; 2017. Modelling a multiple reference frame approach in an oxidation ditch of activated sludge wastewater treatment; pp. 713–717. [Google Scholar]
- Grabcad Library (2022) https://grabcad.com/library
- Jain A, Upadhyay RR, Chandra S, Saini M, Kale S. Experimental investigation of the flow field of a ceiling fan. Heat Transf Summer Conf. 2004;4692:93–99. [Google Scholar]
- Jayaweera M, Perera H, Gunawardana B, Manatunge J. Transmission of covid-19 virus by droplets and aerosols: a critical review on the unresolved dichotomy. Environ Res. 2020;188:109819. doi: 10.1016/j.envres.2020.109819. [DOI] [PMC free article] [PubMed] [Google Scholar]
- Kumar B, Chatterjee S, Agrawal A, Bhardwaj R. Evaluating a transparent coating on a face shield for repelling airborne respiratory droplets. Phys Fluids. 2021;33(11):111705. doi: 10.1063/5.0073724. [DOI] [PMC free article] [PubMed] [Google Scholar]
- Lien S-TJ, Ahmed NA. Numerical simulation of rooftop ventilator flow. Build Environ. 2010;45(8):1808–1815. [Google Scholar]
- Linden PF. The fluid mechanics of natural ventilation. Annu Rev Fluid Mech. 1999;31(1):201–238. [Google Scholar]
- Liu H, He S, Shen L, Hong J. Simulation-based study of covid-19 outbreak associated with air-conditioning in a restaurant. Phys Fluids. 2021;33(2):023301. doi: 10.1063/5.0040188. [DOI] [PMC free article] [PubMed] [Google Scholar]
- Mariam A, Magar M, Joshi PS, Rajagopal A, Khan Rao MM, Sapra BK. Cfd simulation of the airborne transmission of covid-19 vectors emitted during respiratory mechanisms: revisiting the concept of safe distance. ACS omega. 2021;6(26):16876–16889. doi: 10.1021/acsomega.1c01489. [DOI] [PMC free article] [PubMed] [Google Scholar]
- Mirikar D, Palanivel S, Arumuru V. Droplet fate, efficacy of face mask, and transmission of virus-laden droplets inside a conference room. Phys Fluids. 2021;33(6):065108. doi: 10.1063/5.0054110. [DOI] [PMC free article] [PubMed] [Google Scholar]
- Mittal R, Meneveau C, Wu W. A mathematical framework for estimating risk of airborne transmission of covid-19 with application to face mask use and social distancing. Phys Fluids. 2020;32(10):101903. doi: 10.1063/5.0025476. [DOI] [PMC free article] [PubMed] [Google Scholar]
- Mittal R, Ni R, Seo J-H. The flow physics of covid-19. J Fluid Mech. 2020;894:F2. [Google Scholar]
- Narayan Y, Chatterjee S, Agrawal A, Bhardwaj R. Assessing effectiveness and comfortability of a two-layer cloth mask with a high-efficiency particulate air (hepa) insert to mitigate covid-19 transmission. Phys Fluids. 2022;34(6):061703. [Google Scholar]
- Patankar SV. Numerical heat transfer and fluid flow. CRC Press; 2018. [Google Scholar]
- Pichurov G, Srebric J, Zhu S, Vincent RL, Brickner PW, Rudnick SN. A validated numerical investigation of the ceiling fan’s role in the upper-room uvgi efficacy. Build Environ. 2015;86:109–119. [Google Scholar]
- Qian H, Li Y, Nielsen PV, Hyldgaard C-E, Wong TW, Chwang A. Dispersion of exhaled droplet nuclei in a two-bed hospital ward with three different ventilation systems. Indoor Air. 2006;16(2):111–128. doi: 10.1111/j.1600-0668.2005.00407.x. [DOI] [PubMed] [Google Scholar]
- Quinn A, Russo A. Adaptive school grounds design in response to covid-19: Findings from six primary schools in south east England. Build Environ. 2022;215:108946. doi: 10.1016/j.buildenv.2022.108946. [DOI] [PMC free article] [PubMed] [Google Scholar]
- Sen N. Transmission and evaporation of cough droplets in an elevator: numerical simulations of some possible scenarios. Phys Fluids. 2021;33(3):033311. doi: 10.1063/5.0039559. [DOI] [PMC free article] [PubMed] [Google Scholar]
- Shyam S, Mondal PK, Wongwises S. Survivability of a particle laden sessile coughed and sneezed droplet subjected to different ambient conditions. Int J Therm Sci. 2022;176:107525. [Google Scholar]
- Siddiquie R, Agrawal A, Joshi S. Surface alterations to impart antiviral properties to combat covid-19 transmission. Trans Indian Natl Acad Eng. 2020;5:343–347. doi: 10.1007/s41403-020-00096-9. [DOI] [PMC free article] [PubMed] [Google Scholar]
- Simha PP, Rao PSM. Universal trends in human cough airflows at large distances. Phys Fluids. 2020;32(8):081905. doi: 10.1063/5.0021666. [DOI] [PMC free article] [PubMed] [Google Scholar]
- Sinha K, Yadav M, Jayakrishnan R, Kumaraswamy G, Murallidharan JS, Kumar V. Field experiments to identify and eliminate recirculation zones to improve indoor ventilation: Comparison with cfd. Trans Indian Natl Acad Eng. 2022;7:1–6. doi: 10.1007/s41403-022-00335-1. [DOI] [PMC free article] [PubMed] [Google Scholar]
- Stockman T, Zhu S, Kumar A, Wang L, Patel S, Weaver J, Spede M, Milton DK, Hertzberg J, Toohey D, et al. Measurements and simulations of aerosol released while singing and playing wind instruments. ACS Environ Au. 2021;1(1):71–84. doi: 10.1021/acsenvironau.1c00007. [DOI] [PMC free article] [PubMed] [Google Scholar]
- Wang J-X, Cao X, Chen Y-P. An air distribution optimization of hospital wards for minimizing cross-infection. J Clean Prod. 2021;279:123431. doi: 10.1016/j.jclepro.2020.123431. [DOI] [PMC free article] [PubMed] [Google Scholar]
- Yang R, Ng CS, Chong KL, Verzicco R, Lohse D. Do increased flow rates in displacement ventilation always lead to better results? J Fluid Mech. 2022;932:5–6. [Google Scholar]
- Zadravec M, Basic S, Hribersek M. The influence of rotating domain size in a rotating frame of reference approach for simulation of rotating impeller in a mixing vessel. J Eng Sci Technol. 2007;2(2):126–138. [Google Scholar]
- Zhu S, Srebric J, Rudnick SN, Vincent RL, Nardell EA. Numerical modeling of indoor environment with a ceiling fan and an upper-room ultraviolet germicidal irradiation system. Build Environ. 2014;72:116–124. doi: 10.1016/j.buildenv.2013.10.019. [DOI] [PMC free article] [PubMed] [Google Scholar]