

SUMMARY
Improved identification of antitumor T cells is needed to advance cancer immunotherapies. CD39 expression is a promising surrogate of tumor-reactive CD8+ T cells. Here, we comprehensively profiled CD39 expression in human lung cancer. CD39 expression enriched for CD8+ T cells with features of exhaustion, tumor reactivity, and clonal expansion. Flow cytometry of 440 lung cancer biospecimens revealed weak association between CD39+ CD8+ T cells and tumoral features, such as PD-L1, tumor mutation burden, and driver mutations. Immune checkpoint blockade (ICB), but not cytotoxic chemotherapy, increased intratumoral CD39+ CD8+ T cells. Higher baseline frequency of CD39+ CD8+ T cells conferred improved clinical outcomes from ICB therapy. Furthermore, a gene signature of CD39+ CD8+ T cells predicted benefit from ICB, but not chemotherapy, in a phase III clinical trial of non-small cell lung cancer. These findings highlight CD39 as a proxy of tumor-reactive CD8+ T cells in human lung cancer.
Keywords: Immune checkpoint blockade, non-small cell lung cancer, T cell receptors, tumor mutation burden, CD8+ T cells
eTOC BLURB
Factors predicting benefit of immune checkpoint blockade (ICB) are needed. Here, Chow et al demonstrate that CD39 expression marks tumor-reactive CD8+ T cells. High baseline levels of CD39+ CD8+ T cells is associated with ICB efficacy in lung cancer. Thus, CD39 is a potential tumor-extrinsic biomarker for guiding cancer management.
INTRODUCTION
Lung cancer is the leading cause of cancer death in the world. Immune checkpoint blockade (ICB) has been a remarkable clinical advance in the treatment of lung cancer; however, most patients do not respond to ICB therapy and many of those who initially respond eventually develop recurrent and progressive disease1,2. While programmed death- ligand 1 (PD-L1) on tumor cells and tumor mutation burden (TMB) have been validated as predictors of benefit from ICB in lung cancer3,4, there is an opportunity to further refine these biomarkers by incorporating features of CD8+ T cells, which are critical mediators of ICB efficacy.
Total CD8+ T cell content alone is not a reliable predictor of clinical benefit from ICB5–9. Part of the reason for this lack of predictive benefit is that a large and variable proportion of CD8+ T cells in the tumor microenvironment are bystander T cells that lack tumor reactivity10,11. CD8+ T cells that express CD39 are enriched for features of a clonal, proliferative lymphocyte population that express high levels of activation/exhaustion (e.g. programmed cell death- 1, PD-1) and cytotoxicity (e.g. granzyme B) markers2,11–14. Moreover, CD39 is highly expressed on empirically defined neoantigen- and tumor-associated antigen-reactive T cells in lung cancer and melanoma15–18. In this study, we characterized human CD39+ CD8+ T cells in lung cancer with single cell sequencing, TCR cloning, and tumor co-culture assays. Furthermore, to investigate the utility of CD39 as a biomarker in ICB, we evaluated the tumoral features associated with %CD39+ among CD8+ T cells from 440 clinical samples of human lung cancer and investigated whether baseline abundance of CD39+ CD8+ T cells was associated with ICB efficacy in patients with lung cancer.
RESULTS
CD8+ T cells with high expression of CD39 are enriched for features of exhaustion, tumor reactivity, and clonal expansion
To characterize CD8+ T cells expressing protein CD39, we sorted CD3+ T cells from four non-small cell lung cancer (NSCLC) biospecimens and performed single cell cellular indexing of transcriptomes and epitopes (CITE)/RNA/T cell receptor (TCR)seq19. The four NSCLC samples comprised a range of histologies (e.g. adenocarcinoma and squamous), driver mutations (KRAS and EGFR), stages (e.g. early and metastatic), and anatomic sites (e.g. lung, pleural fluid, and brain) (Table S1). None of these patients had received prior ICB at the time of sample collection. After coarse clustering, we visualized distinct clusters of regulatory T cells, CD4+ T cells, CD8+ T cells, and an additional T cell NOS (not otherwise specified) cluster (Fig. 1A, Table S2A). We focused our subsequent analyses on CD8+ T cells since this subset has the greatest known contribution to anti-tumor immunity. The 896 single CD8+ T cells that passed quality control were divided by CD39 protein expression (assessed by oligo-tagged anti-CD39 antibody) into high (hi), intermediate (int), and negative (neg) groups. Transcriptional dropout is a well-known limitation of single cell RNAseq, and oligonucleotide-tagged antibodies to surface molecules (e.g. CITE-seq) represents a strategy to overcome this hurdle20. Concordantly, CITEseq detected protein expression of CD39 and other activation markers in many cells in which there was absent transcriptional expression (Fig. S1A). Genes that were differentially expressed by CD39hi CD8+ T cells included the exhaustion marker LAYN, tissue residence marker ITGAE (encoding CD103), and the activation markers CXCL13, GNLY, HLADRA, and VCAM1 (Table S2B). CD39hi CD8+ T cells showed the highest gene expression of ENTPD1 (encoding CD39), PDCD1 (encoding PD-1), ITGAE, CXCL13, TNFRSF4 (encoding OX-40), HAVCR2 (encoding TIM-3), and LAG3, which are features of tumor-reactive CD8+ T cells (Fig. S1B)21. Assessment of extracellular protein expression by CITE-seq revealed that CD39hi CD8+ T cells across the four samples consistently expressed the highest protein PD-1, CD103, OX40, 4–1BB, and LAG-3 (Fig. 1B). Concordantly, CD39hi CD8+ T cells expressed the highest transcriptomic signature score for T cell exhaustion22 and tumor reactivity21 and lowest score for progenitor exhausted CD8+ T cells23,24 (Fig. 1C–D, Fig. S1C, Table S3).
Figure 1. Single-cell CITE/RNA/TCR-sequencing reveals that CD39hi CD8+ T cells are enriched for features of exhaustion, tumor reactivity, and clonal proliferation in human lung cancer.

A) UMAP of sorted CD3+ T cells from four patients with lung cancer (Table S1). Clusters are annotated on left panel. Surface levels of CD4, CD8, and CD39 as assessed by CITEseq antibody-derived tags (adt) are depicted in right three panels. B) Levels of various proteins (column) across the four samples (row) as determined by CITEseq adt levels. C-G) Scaled scores for exhaustion, tumor reactivity, tumor specific, virus specific, and proliferation gene signatures (Table S4). H) Clonal proportion among CD8+ T cells of clonotypes that were categorized by mean CD39 expression. Statistical significance was determined with two-way ANOVA with Tukey’s multiple comparisons test and p value is indicated if <0.05.
We next evaluated whether the gene expression profiles of CD39hi CD8+ T cells in our dataset overlapped with previously reported gene signatures of CD8+ T cells that were reactive to tumor-associated or viral-associated antigens15,16. CD39hi CD8+ T cells in our dataset indeed expressed the highest ‘tumor specific’ and ‘MANA-TIL (mutation-associated neoantigen-tumor infiltrating lymphocyte)’ signature scores and lowest ‘virus specific’ and ‘influenza’ signatures (Fig. 1E–F, S1D–E). CD39hi CD8+ T cells also expressed the highest proliferation score and both CD39int and CD39hi CD8+ T cells comprised a higher clonal proportion among all CD8+ T cells (Fig. 1G–H). Thus, our single cell CITE/RNA/TCR sequencing demonstrated that CD39hi CD8+ T cells express features of exhaustion, tumor reactivity, and clonal expansion.
CD39+ CD8+ T cells are enriched for tumor reactivity
We developed patient-derived xenograft models from two of the patients from which we obtained single cell CITE/RNA/TCR sequencing – MSK 1087 and 1111. We sought to empirically determine whether CD39 expression enriched for CD8+ T cells that were tumor- reactive. In order to circumvent the potential confounder of differential degrees of T cell exhaustion among CD39hi, CD39int, and CD39neg CD8+ T cells, we cloned TCRα and TCRβ sequences from CD8+ T cells from MSK 1087 and 1111 and retrovirally transduced them into healthy donor PBMCs that underwent CRISPR/Cas9 editing to disrupt the endogenous TCRα and TCRβ constant chain sequences (Fig. 2A, Table S4). CRISPR/Cas9 editing of the endogenous TCR constant chains led to efficient endogenous TCR disruption, as indicated by >90% decrease in surface CD3 expression (Fig. 2B). Viral transduction (marked by truncated EGFR (EGFRt) expression) with a donor TCR restored CD3 expression in a subset of the T cells. TCR transduction with an NY-ESO1 TCR mediated TCR reactivity (as assessed by 4–1BB upregulation in the EGFRt+ population16) against a lung cancer cell line H522 (HLA-A*02:01) that was transduced to overexpress NY-ESO1 (H522-NY-ESO1) (Fig. 2B). Across the two models, 6 of 39 tested TCRs were tumor-reactive (Fig. 2C–E). 33%, 15.8%, and 7.1% of tested CD39hi, CD39int, and CD39neg CD8+ TCRs mediated tumor reactivity, respectively (Fig. 2F). Thus, CD39 expression on CD8+ T cells enriches for the TCRs that can recognize tumor antigens.
Figure 2. CD39 enriches for tumor-reactive TCRs in lung cancer.

A) Schematic outlining the parallel derivation of a patient-derived xenograft for MSK 1087 and MSK 1111 and cloning and transduction of candidate CD39neg, CD39int, and CD39hi TCRs into healthy donor CD8+ T cells deleted for endogenous TCRs. The cultured PDX cells and transduced donor CD8+ T cells were co-cultured for 24 hours and 4–1BB expression was evaluated on transduced T cells. B) Flow cytometry plots of CD3 and EGFRt expression on untransduced TRAC/TRBC-edited CD8+ T (left top panel) or TRAC/TRBC-edited CD8+ T transduced with donor NY-ESO1 TCR (left bottom panel, blue box indicates transduced population). C) Flow cytometry plots of CD8+ and 4–1BB expression for NY-ESO1 TCR-transduced T cells that were cultured alone (right top panel), with H522-NYESO1 (right middle), or H522-NYESO1 with anti-MHC I (right lower). C) Flow cytometry plots of CD8+ and 4–1BB expression for MSK 1087 TCR 2-transduced T cells that were cultured alone (top panel), with MSK 1087 PDX (middle), or MSK 1087a PDX with anti-MHC I (lower). D) Bar plots of %4–1BB among EGFRt+ transduced T cells that were cultured alone (left solid bar in each series of three bars), with MSK 1087 PDX cells (middle bar with black dash), or with MSK 1087 PDX cells treated and anti-MHC I (right bar with white dash). Red bars indicate TCRs that are tumor-reactive (the %4–1BB level for the culture with PDX tumor cells is ≥5% higher than the culture with only T cells). E) Bar plots of %4–1BB among EGFRt+ transduced T cells that were cultured alone (left solid bar), with MSK 1111 PDX cells (middle bar with black dash), or with MSK 1111 PDX cells treated and anti-MHC I (right bar with white dash). Red bars indicate TCRs that are tumor-reactive. F) Tabulation of reactive TCRs after co-culture with patient-matched PDX tumor cells.
CD39 expression is dependent on antigen-specific TCR engagement
Murine CD8+ T cells increase CD39 expression after polyclonal and antigen-specific activation, but the kinetics are distinct from that of other activation/exhaustion markers, such as phosphatidylserine, CD44 and PD-125. Whereas phosphatidylserine, CD44, and PD-1 peak quickly and attenuate after activation, CD39 levels are slower to rise and persist for a long period on the cell surface. Polyclonal activation of human CD8+ T cells show the same kinetic distinction between CD39 and the other activation/exhaustion markers. We next profiled the expression of CD39 on human CD8+ T cells during the course of antigen-specific T cell stimulation. To evaluate this, we utilized commercially available CD8+ T cells recognizing NY-ESO1 presented on HLA-A*02:01 (73.74% enrichment by tetramer analysis). In contrast to TCR-transduced cells, these cells underwent peptide stimulation through an endogenous TCR, which more closely approximated antigen-experienced T cells that have completed priming in the secondary lymphoid organs. Moreover, placing these post-primed cells into co-culture with tumor targets more closely approximated the context of T cell-tumor cell encounter in the tumor microenvironment, where CD39 is most upregulated (see below Fig. S4). Co-culture with H522-NY-ESO1, but not the parental H522 cell line, induced CD8+ T cell proliferation (indicated by Cell Trace Violet dilution) and rapid expression of 4–1BB and PD-1 (Fig. 3A–C). CD39 expression increased more slowly over the course of a 10-day co-culture and did not attenuate as quickly as 4–1BB and PD-1 (Fig. 3A–C). Thus, although frequently co-expressed (Fig. 1B), there are differences in the kinetics of expression between CD39, PD-1, and 4–1BB after antigen stimulation.
Figure 3. CD39 is durably expressed after antigen-specific stimulation.

A) Flow cytometry plots of CTV and 4–1BB levels of NY-ESO1-specific CD8+ T cells that were cultured with no tumor cells (far left plot), H522-NY-ESO1 (top row of plots), or parental H522 (bottom row of plots) for the indicated number of days. B) Flow cytometry plots of CD39 and PD-1 levels of NY-ESO1-specific CD8+ T cells that were cultured with no tumor cells (far left plot), H522-NY-ESO1 (top row of purple plots), or parental H522 (bottom row of orange plots) for the indicated number of days. C) Levels of %4–1BB+, %PD-1+, or %CD39+ among NY-ESO1-specific CD8+ T cells during co-culture with H522-NY-ESO1 (purple line) or parental H522 (orange line). D) Levels of %4–1BB+, %PD-1+, or %CD39+ among NY-ESO1-specific CD8+ T cells during co-culture with parental H522 pulsed with the NY-ESO1 altered peptide ligands SLLMWITQC (black line), SLLNWITQC (red line), SLLPWITQC (blue line), or SLLSWITQC (green line).
To further characterize how antigen-specific stimulation culminates in CD39 expression, we utilized the same CD8+ T cells that were enriched for NY-ESO1 reactivity and placed them into co-culture with parental H522 cells that were pulsed with the NY-ESO1 peptide SLLMWITQC at varying concentrations. Whereas the 10μg/ml concentration of peptide induced 4–1BB and PD-1 reactivity, there was minimal upregulation of 4–1BB and PD-1 at either 0.1 or 1μg/ml concentrations (Fig. S2A–B). All three peptide concentrations resulted in increased expression of CD39 by 10 days after coculture, and the highest CD39 expression was observed at the 10μg/ml concentration (Fig. S2C). Therefore, antigen-specific TCR stimulation induces CD39 expression in a time- and antigen density-dependent manner.
Altered peptide ligands (APLs) are single amino acid changes in the TCR-facing surface of the peptide that confer differences in TCR signal strength26. Since the M4 position of the NY-ESO1 peptide SLLMWITQC is essential for TCR binding27, we generated the APLs SLLNWITQC, SLLPWITQC, and SLLSWITQC. As assessed by 4–1BB and PD-1 increase, the amino acid change from Methionine (M) to Asparagine (N) resulted in mildly increased TCR avidity, whereas the change to proline (P) or serine (S) substantially reduced TCR avidity (Fig. 2D, S2A–C). For all four peptides, CD39 expression increased over time during co-culture and the degree of of increase matched the rank order of observed TCR avidity (SLLNWITQC > SLLMWITQC > SLLSWITQC > SLLPWITQC). Hence, we observed that the expression of CD39 on human CD8+ T cells is dependent on TCR signal strength.
CD39 expression on CD8+ T cells is a non-redundant biomarker
We assessed CD39, Tim-3, 4–1BB, and PD-1 expression by flow cytometry to compare their relative staining resolution, as defined by the separation of the positive and negative population. FACS-based detection of CD39 consistently yielded higher resolution compared to the other three markers (Fig. 4A). The enhanced resolution of CD39 compared to 4–1BB and PD-1 was consistent with the observed more durable expression of CD39 in CD8+ T cells (Fig. 3A–C25). Due to the staining resolution of the CD39 marker and its association with tumor reactivity, we utilized CD39 expression on CD8+ T cells to estimate the frequency of tumor-reactive CD8+ T cells in lung cancer clinical samples. From August 2018 to September 2021, we evaluated 440 fresh lung cancer clinical specimens by flow cytometry for CD39 expression on CD8+ T cells. These biospecimens ranged across stages (I-IV) and lung cancer subtypes (lung adenocarcinoma, squamous cell cancer, and small cell lung cancer) (Table S5A). The median frequency of CD8+ T cells was 13.0% (of CD45+) and median %CD39+ was 15.65% (of CD8+ T cells), and these were utilized as cutoffs in the study. On univariate analysis, CD39 expression on CD8+ T cells had a weak correlation with total CD8+ T cells, smoking history, TMB, and PD-L1 (Fig. S3A–D). Since TMB ≥ 10 mutations/megabase and PD-L1 ≥ 50% represent subgroups with favorable clinical outcomes from ICB therapy3,4, we assessed the frequency of CD39-expressing cells in these subpopulations. When divided into 4 subgroups by PD-L1 and TMB expression, the %CD39+ among tumor CD8+ T cells from the two TMB ≥ 10 mutations/megabase subgroups (both PD-L1 < 50% and ≥ 50%) was nearly two-fold higher than the TMB < 10 and PD-L1 < 50% subgroup (Fig. S3E). In contrast, the proportion of CD8+ T cells (Fig. S3F) showed less variation. There was largely no association of CD39 expression on CD8+ T cells with lung cancer stage with the exception of a reduction in stage IVA tumors (Fig. S3G). This was consistent with reduced CD39 expression on CD8+ T cells in pleural fluid and pleural metastases biospecimens relative to the lung biospecimens (Fig. S3H). Due to the more fluid nature of this microenvironment, the stability of tumor cell-CD8+ T cell interaction may be reduced, resulting in reduced CD39 expression. Pleural and peritoneal cavities are immunosuppressed microenvironments due to the presence of Tim-4+ cavity-resident macrophages25, and this may contribute to the reduced proportion of CD8+ T cells expressing CD39 in these anatomic compartments.
Figure 4. CD39 expression among intratumoral CD8+ T cells varies with lung cancer subtype.

A) Representative flow cytometry staining of CD39, Tim-3, 4–1BB, and PD-1 on DAPI− CD45+ CD3+ CD8++ T cells from MSK 1105b. Left plot represents fluorescence minus one (FMO) and right plot represents the CD8+ T cells stained with the indicated antibody. B-C) Violin plots of %CD39+ (among CD8++ T cells) and %CD8+ (among CD45+) for various histological subtypes/driver mutation categories among the 440-sample cohort. Dashed lines indicate the median and 75th percentile CD39 level for entire 440-sample cohort. Red bars indicate histological subtypes/driver mutations with above median %CD39 values.
%CD39+ on CD8+ T cells showed two patterns of expression among the lung cancer subtypes. ALK fusion, ROS1 fusion, RET fusion, MET exon 14 fusion, BRAF V600E, and EGFR mutant (except exon 20 insertion) lung adenocarcinomas, which are not associated with tobacco use, had below median CD39 expression on CD8+ T cells (Fig. 4B, Table S5B). The reduced CD39 expression on EGFR mutant lung cancer tumors was in line with a prior report11. In contrast, CD39 expression on lung adenocarcinomas with KRAS G12C, G12D, and G12V mutations were above median. Other KRAS mutations – including G12A, G12R, G12S, G13C, G13D, Q61H, and Q61R, which are known to be oncogenic per OncoKB28 – were also associated with above median %CD39+ on CD8+ T cells. The median proportion of CD39+ CD8+ T cells in adenocarcinomas with an ERBB2 (HER2) driver mutation and squamous lung cancers also had above median CD39 levels on CD8+ T cells. These findings are consistent with KRAS and squamous lung cancers being associated with tobacco use, which are correlated with a higher number of tumor mutations and neoantigens to which CD8+ T cells can react. Small cell lung cancer is also associated with tobacco use and high TMB levels (Fig. S3I); yet, this subtype of lung cancer only had a median CD39 level of 14.0%. This may partially explain the relatively low level of additive efficacy of ICB in SCLC29,30 and may be related to reduced MHC I expression on small cell lung cancer cells31,32, which would impair antigen-induced CD39 expression (Fig. 3). Even among the lung cancer subtypes with higher CD39 expression, there was a wide range of CD39 levels (Fig. 4B), suggesting that even for a given driver mutation, there is substantial heterogeneity in tumor-reactive CD8+ T cell immunosurveillance. Total CD8+ T cell infiltration, TMB, and PD-L1 were overall not associated with consistent differences across lung cancer histological subtypes (Fig. 4C, S3I–J).
We performed multivariate analyses to determine the clinical and molecular features that best correlate with CD39 expression on CD8+ T cells. We included tissue site, stage, histology, driver mutation, TMB, smoking history, and PD-L1 as potential covariates. We also included human leukocyte antigen (HLA) heterozygosity33,34 in the model and also the number of predicted neoantigens and strong binding neoantigens from next-generation sequencing of tumor biopsies by MSK-IMPACT35. A linear model predicted the variance in %CD39 on CD8+ T cells at an adjusted R-squared of 0.24, which suggested that the features in the model poorly predict the variance observed in CD39 levels (Table S5C). In the model, only TMB, PD-L1, pericardial metastases, and prior chemotherapy passed significance thresholds of P < 0.05. Since some of the features in the dataset had few observations and to avoid overfitting, we also applied a lasso regression with 10-fold cross validation. The lambda was selected based on the root-mean-square error (RMSE) and the model achieved an R-squared of 0.17 with a RMSE of 1.5 at lambda = 0.1 (Table S5D). At higher lambdas, the algorithm removed all predictors, which suggested that there was no linear combination of any regressed parameters that predicted CD39 levels well. Overall, these results indicated that CD39 expression on CD8+ T cells is a feature of the tumor that is non-redundant to the tumoral parameters that currently guide therapy in lung cancer (e.g. histology, driver alterations PD-L1, and TMB).
CD39 is upregulated on CD8+ T cells in the tumor microenvironment
We next examined the patterns of tissue-specific expression for CD39 and thus performed CD39 staining on CD8+ T cells from matched peripheral blood and tumor samples with varied anatomic sites (e.g. the brain, lymph node, and lung). In all three cases, CD39+ CD8+ T cells were preferentially observed in the tumor tissue and not in the peripheral blood (Fig. S4A). This was in agreement with our findings that CD8+ T cell interactions with cancer cells drive the expression of CD39 (Fig. 3) and that CD39 is expressed at higher levels in regions of a resected tumor with viable cancer cells compared to regions without viable tumor, normal adjacent regions, and lymph nodes36. Since there was a small CD39+ population of intermediate intensity in the peripheral blood, we evaluated whether this population gave rise to the CD39+ CD8+ T cells in the tumor tissue. To address this question, we sorted CD39− and CD39+ CD8+ T cells from the peripheral blood and CD39− or CD39+ from the tumor tissue. We then performed bulk TCR sequencing analysis and assessed for clonal overlap. As assessed by the Morisita Index, there was minimal clonal overlap between CD39+ CD8+ T cells from the peripheral blood and CD39+ CD8+ T cells from tumor tissue, suggesting that circulating CD39+ CD8+ T cells may not be the dominant precursors for the CD39+ CD8+ T cells in the tumor microenvironment (Fig. S4A–C).
Due the durability of CD39 expression (Fig. 3 and 25), we next assessed the robustness of CD39 levels across spatially and temporally distinct lesions. We analyzed 12 paired samples in which two anatomically distinct lesions were simultaneously assessed (e.g. two resected lung lesions, lymph node and primary lung lesions, or pleural metastasis and fluid). We noted reasonable concordance across spatially distinct lesions (Fig. S4D), as exemplified by the low %CD39+ on CD8+ T cells from the paired pleural metastasis and fluid from MSK 1266 (Fig. S4E). There was one case of divergent CD39 levels. MSK 1372a and b were simultaneous resections of two right-sided separate primary lung cancer lesions with marked differences in CD39 expression (59.0% vs. 92.5%; Fig. S4F). Consistent with being separate primary lesions, these two tumors were comprised of two different KRAS driver mutations with differential levels of TMB, which may underly the divergence of CD39 expression. We also followed %CD39+ on CD8+ T cells from the same anatomic site multiple times (e.g. recurrent pleural effusions, initial lung biopsy followed by resection, and serial resections for recurrent disease in the brain). The %CD39+ on CD8+ T cells across nine patients were largely durable over time, including for three brain lesions that were resected over the course of nine months (MSK 1265; Fig. S4G–H). These findings highlighted that %CD39+ on CD8+ T cells is increased in proximity to the tumor and that CD39 levels on CD8+ T cells are relatively preserved across spatially and temporally distinct lesions in the same patient.
PD-1/PD-L1 axis blockade increases the frequency of CD39+ CD8+ T cells
Since our data and prior reports11,15 demonstrate that tumor antigen-reactive CD8+ T cells express CD39 in lung cancer, we sought to leverage CD39 as a proxy for anti-tumor CD8+ T cell immunosurveillance. Chemotherapy can result in ‘immunogenic cell death’ that can prime an anti-tumor CD8+ T cell response37. We reasoned that %CD39+ on CD8+ T cells would be increased in patients after cytotoxic chemotherapy if such immune priming occurred. Analogously, ICB therapy expands the pool of antigen-specific CD8+ T cells that infiltrate the tumor38, which we reasoned might be reflected in increased CD39+ CD8+ T cells in the tumor. Thus, we evaluated in our dataset whether the %CD39+ among CD8+ T cells increased with either cytotoxic chemotherapy and/or ICB therapy.
We first investigated the 218 patients in our cohort with stage IV lung cancer who were treated with or without chemotherapy and/or ICB in the prior three or six months. Both total CD8+ infiltration and %CD39+ on CD8+ T cells were unchanged in patients receiving cytotoxic chemotherapy in the preceding three or six months (Fig. 5A–D). Total CD8+ infiltration was also unchanged in patients receiving prior ICB therapy (Fig. 5A,C). In contrast, CD8+ T cells from patients that received ICB in the prior three or six months expressed higher levels of CD39 (Fig. 5B,D). In patients that received both cytotoxic chemotherapy and ICB therapy in the prior three or six months, %CD39+ on CD8+ T cells was unchanged compared to patients that had not received chemotherapy or ICB, which is consistent with chemotherapy and ICB having opposing effects on CD39 expression (Fig. 5B,D).
Figure 5. PD-1 axis blockade increases the frequency of CD39+ CD8+ tumor-infiltrating lymphocytes.

A-B) %CD8+ (among CD45+) or %CD39 (among CD8+ T cells) from 218 biospecimens obtained from patients with stage IV metastatic disease that did or did not receive chemotherapy or ICB therapy in the prior 3 months. Statistical significance was assessed by two-tailed student’s t test. C-D) %CD8+ (among CD45+) or %CD39 (among CD8+ T cells) from 218 biospecimens obtained from patients with stage IV metastatic disease that did or did not receive chemotherapy or ICB therapy in the prior 6 months. Statistical significance assessed by two-tailed student’s t test. E-F) %CD8+ (among CD45+) or %CD39 (among CD8+ T cells) from 208 biospecimens obtained from patients with early stage (stage I-III) NSCLC. Statistical significance was assessed by two-tailed student’s t test. *p<0.05, ***p<0.001.
Since the stage IV lung cancer cohort is quite heterogeneous, we subsequently examined 208 early-stage (stage I-III) NSCLC biospecimens from patients that did or did not receive neoadjuvant therapy prior to sample collection. Among early-stage patients with NSCLC, we again did not observe differences in total CD8+ T cell infiltration with preceding neoadjuvant chemotherapy; however, neoadjuvant immunotherapy did increase total CD8+ T cell infiltration (Fig. 5E). Patients who underwent neoadjuvant chemotherapy had reduced %CD39+ on CD8+ T cells compared to patients without neoadjuvant therapy; in contrast, in patients who underwent neoadjuvant ICB, we observed an increase in CD39 expression on CD8+ T cells (Fig. 5F). Thus, across two clinical cohorts, we did not find evidence for ‘immunogenic cell death’ with standard cytotoxic chemotherapy utilized for lung cancer; however, we did discover that ICB exposure was associated with an enhanced infiltration of CD39+ CD8+ T cells. This is consistent with the concept that ICB results in clonal expansion and infiltration of tumor-reactive CD8+ T cells38.
Since anti-tumor efficacy is associated with the development of immune-related adverse events (IRAE) in patients treated with ICB (reviewed in 39), we examined whether CD39 expression on CD8+ T cells was associated with IRAEs in our dataset. From our cohort of 440 patients treated with ICB, we performed a retrospective review for IRAEs. Among the patients with or without a history of IRAEs, there was no difference in incidence that was associated with total CD8+ T cell abundance, %CD39+ on CD8+ T cells, TMB, or PD-L1 (Fig. S4I–L). This suggests that IRAE development is independent of the magnitude of tumor-reactive CD8+ T cells.
CD39 expression on CD8+ T cells portends benefit from ICB therapy
We next evaluated whether CD39 expression on CD8+ T cells had prognostic significance in our dataset. We first assessed 188 patients with stage I-IIIA lung cancer at the time of resection and correlated %CD39+ on CD8+ T cells with differential recurrence-free survival (RFS). Since CD39 expression was modulated by prior ICB (Fig. 5F), we excluded patients who had previously received neoadjuvant ICB in this analysis. Across this early-stage resection cohort, we did not observe differences in RFS based on total CD8+ T cells or %CD39+ among CD8+ T cells utilizing the median or top quartile cutoff values from the total 440 patient dataset (Fig. S5A–L). The data for CD8+ T cells is in line with a published prospective cohort of early-stage NSCLC resection specimens which showed no differences in clinical outcomes based on total CD8+ T cell abundance40. Similarly, neither total CD8+ T cells or %CD39+ among CD8+ T cells resulted in differential progression-free survival (PFS) in the 26 stage IV lung cancer patients undergoing cytotoxic chemotherapy without ICB (Fig. S5M–P). Hence, CD39 expression on CD8+ T cells was not prognostic for lung cancer in our dataset.
We next asked whether we could find evidence that %CD39+ on CD8+ T cells was associated with response to ICB. There were 23 patients in our cohort from whom we obtained baseline clinical biospecimens (defined as prior to or within three weeks of commencing ICB therapy) (Fig. 6A, Table S5E). Although the tumoral PD-L1, TMB, and %CD8+ were not different between non-responders (stable disease/progression of disease) and responders (partial response) to ICB, we observed that responders had higher %CD39+ on CD8+ T cells (Fig. 6B–E). While total CD8+ infiltration did not differentiate PFS in these patients (Fig. 6F, S5Q), patients with higher %CD39+ on CD8+ T cells had an improved PFS (Fig. 6G, S5R). Responders also had higher PD-1 staining intensity on CD8+ T cells and above median PD-1 expression on CD8+ T cells was associated with improved PFS (Fig. S5S–T).
Figure 6. Baseline intratumoral CD39+ CD8+ T cells portends improved outcomes from immune checkpoint blockade in lung cancer.
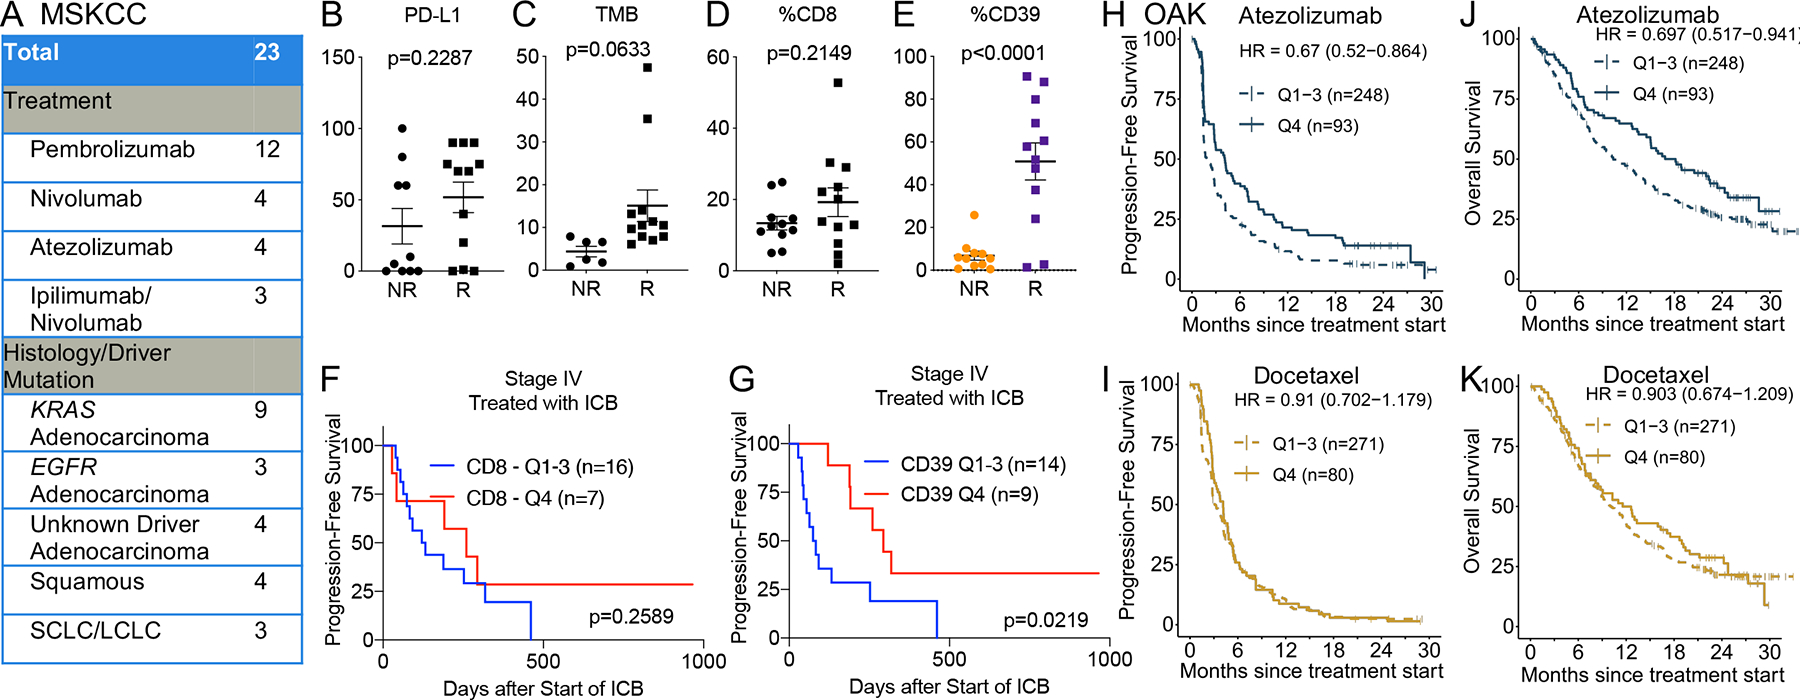
A) Cohort of stage IV lung cancer patients at MSKCC who received ICB monotherapy. SCLC = small cell lung cancer; LCLC = large cell lung cancer. B-E) Tumor proportion score for PD-L1, tumor mutation burden, %CD8+ (among CD45+), and % CD39 (among CD8+ T cells) among non-responders (NR) or responders (R) to ICB in the cohort described in A). Statistical significance was determined by Mantel-Cox test. F-G) Kaplan-Meier survival curve of progression-free survival for patients described in cohort A) based on stratification for top quartile (Q4) or bottom 75% level (Q1-Q3) of CD8+ T cells (F) and CD39 on CD8+ T cells (G). H-K) Progression-free and overall survival of patients with stage IV lung cancer in the phase III OAK clinical trial who were randomized to treatment with atezolizumab (H, J) or docetaxel (I, K). The patients were stratified by top quartile (Q4) or bottom 75% level (Q1–3) of a signature score for CD39+ CD8+ T cells.
To further validate that baseline abundance of CD39+ CD8+ T cells was associated with clinical benefit from ICB, we derived a 23-gene signature score of CD39+ CD8+ T cells from our lung cancer single cell dataset that included ENTPD1, CXCL13, PDCD1, and ZNF683. We utilized this gene signature score to evaluate whether this was predictive of benefit from ICB in a dataset of baseline tumor transcriptomes of patients with NSCLC who were randomized to docetaxel chemotherapy or atezolizumab ICB in the phase III OAK clinical trial41,42. We observed that patients receiving atezolizumab with above median or top quartile expression of the CD39+ CD8+ T cell signature had a longer PFS and OS compared to those with below median or bottom 75% level of the gene expression signature, respectively (Fig. 6H–K, S6A–D). This improvement in survival was not observed in the patients who were treated with docetaxel, which again indicates that baseline CD39+ CD8+ T infiltration is not prognostic in lung cancer. The predictive value of the CD39+ CD8+ T cell signature was also assessed in a multivariate model including a general T cell signature (TBX21, ITK, CD3D, CD3E, CD3G, TRAC, TRBC1, TRBC2, CD28, CD5, TRAT1)43. The signature score for CD39+ CD8+ T cells trended towards significance (HR = 0.72 (CI 0.50–1.04), p-val = 0.077) in the atezolizumab arm of OAK, but no effect was seen in the docetaxel arm (HR = 1.12 (CI 0.76–1.66), p=0.56), suggesting that the previous results may be specific and independent of total T cell infiltration (Fig. S6E–F). Thus, the abundance of baseline ‘exhausted’ CD8+ T cells was associated with clinical benefit from ICB therapy.
DISCUSSION
Lung cancer therapy is currently guided by tumor cell-intrinsic features, including histology, driver alterations, PD-L1 and TMB. Integration of tumor cell-extrinsic features such as the immune infiltrate can potentially lead to improved therapeutic options for patients with lung cancer. This is exemplified by the ‘lung cancer activation module’, consisting of activated T cells, plasma cells, and macrophages, that is a predictor of response to immunotherapy44. Since CD8+ T lymphocytes are the critical effectors in ICB therapy, features of these cells can also potentially serve as a non-redundant biomarker of response to ICB. Although methods to empirically verify tumor reactivity have improved substantially in sensitivity and throughput (e.g. MANA-FEST45 and 4–1BB assay16), there remains a need in certain contexts for simple proxies to distinguish and quantify the tumor-reactive CD8+ T cell sub-population from bystanders without cognate TCR reactivity. We observed from single-cell profiling of heterogeneous lesions that CD8+ T cells expressing high levels of CD39 were enriched for features of exhaustion, tumor reactivity and clonal expansion. We empirically verified with TCR cloning of CD8+ T cells that CD39 enriched for tumor reactivity. This is consistent with prior reports in melanoma, head and neck cancer12, and lung cancer18 demonstrating that CD39 can be utilized to identify tumor-reactive T cells. While our manuscript did not examine the role of CD39 on CD4+ T cells, Hanada and colleagues demonstrated in four patients with lung cancer that 45% of CD8+ T cells and 66% of CD4+ T cells with a combination of protein CD39 and transcript CXCL13 expression were neoantigen-reactive18. Hence, protein CD39 can be leveraged to ‘pan’ for tumor-reactive TCRs and facilitate TCR discovery for adoptive T cell therapies.
Motivated by these findings and reports that tumor-reactive CD8+ T cells express CD392,11,12,15,16,18,21, we profiled CD39 expression on CD8+ T cells on 440 lung cancer biospecimens obtained at MSKCC. We observed that CD39 on CD8+ T cells is expressed more highly in tobacco-associated lung cancer genotypes and poorly correlates with TMB and tumoral PD-L1. Hence, CD39 is a biomarker that is non-redundant to tumoral features of lung cancer. %CD39+ on CD8+ T cells is likely dependent on other variables not captured in our dataset, including native T cell repertoire, HLA subtype, peptide binding, and likely the intersection of these three highly diverse attributes. CD39 expression increases on CD8+ T cells in the tumor microenvironment in response to secondary encounter with the tumor antigen and is generally stable across space and time. Finally, we demonstrate that although %CD39+ on CD8+ T cells was not prognostic in any of the patient cohorts that we examined, it was associated with clinical benefit, but not IRAEs, from ICB therapy. This suggest that the tumor-reactive CD39+ CD8+ T cells that exert immune pressure in the microenvironments are infrequently the same clones that mediate IRAEs in lung cancer.
There have been conflicting data regarding whether the presence of CD8+ T cells expressing markers of exhaustion can predict clinical benefit from ICB. Single-cell RNAseq of tumors from metastatic melanoma revealed that a CD8+ T cell state called CD8+_B, which is enriched in ENTPD1, PDCD1, CD38, HAVCR2, and LAG3, is preferentially expressed in non-responders to ICB8. Also, the use of multiplex immunofluorescence staining in lung cancer suggests that an ‘effector burnt out’ (EBO) CD8+ T effector population preferentially expressing PD-1 and LAG-3, but not CD39, was enriched in patients who did not derive durable benefit from ICB and that these patients had reduced overall survival46. On the other hand, lung cancer patients with high pre-treatment levels of PD-1 by flow cytometry or immunofluorescence demonstrated a greater response rate and progression-free survival2,47. Moreover, high levels of intratumoral CD39+ CD8+ T cells is associated with response to ICB therapy in lung cancer48. These findings dovetail with other studies that revealed that high levels of CD8+ T cells with features of exhaustion prior to ICB are associated with improved clinical benefit in colorectal cancer and ER+ breast cancer49,50. Our data demonstrated that PD-1 and CD39 expression on CD8+ T cells are both predictive of improved outcomes from ICB therapy in lung cancer.
Limitations of the Study
There are several limitations of this study that we acknowledge. First, the primary CD39 expression data was derived from patients treated at a single center. Second, while we profiled CD39 on CD8+ T cells, our data did not capture the likely contribution/modulation of other immune cell types such as CD4+ T cells, B cells, innate lymphoid cells, and myeloid cells. Lastly, our cohort to assess the predictive significance of CD39 expression on CD8+ T cells in stage IV lung cancer treated with ICB monotherapy was limited to 23 patients despite >3 years of fresh tissue collection. Part of this limited sample size is attributable to the routine incorporation of cytotoxic chemotherapy to ICB for frontline treatment of the majority of patients with lung cancer. Due to the limited size of this cohort, we combined pre-treatment and early-on treatment (within 3 weeks of the start of ICB) as baseline samples, which may merge biologically distinct samples. By utilizing a gene signature of CD39+ CD8+ T cells to differentiate outcomes in a phase III clinical trial of lung cancer patients randomized to ICB or chemotherapy, we were able to orthogonally validate the results from this relatively small cohort. Despite these limitations, the data presented here contribute to our understanding of CD39 on CD8+ T cells in the context of lung cancer, including factors that modulates its pattern of expression. Our study identified CD39 on CD8+ T cells as a biomarker that is non-redundant to TMB and PD-L1, and which can be captured on clinical samples to serve as a proxy of the tumor-reactive CD8+ T cell population. Subsequent studies can also leverage CD39 to enrich for TCR candidates from CD8+ T cells to evaluate for TCR-based immunotherapies.
STAR METHODS
Resource Availability
Lead Contact
Further information and requests will be fulfilled by the lead contact, Charles M. Rudin (rudinc@mskcc.org).
Materials Availability
PDX lines from MSK 1087 and 1111 are available and can be requested from the lead contact.
Data and Code Availability
Single cell data for lung cancer biospecimens are in the process of upload to NIH GEO (Series GSE218262). Bulk TCR sequencing data are in the process of upload to Adaptive Biotechnologies Immunoseq Immune Access (Accession Number https://doi.org/10.21417/AC2022I).
EXPERIMENTAL MODEL AND SUBJECT DETAILS
Human biospecimens
Fresh primary tumors, metastatic lesions and pleural/peritoneal/pericardial effusions were obtained from August 2018 to September 2021 with permission from the MSKCC IRB. Informed consent was collected from all patients enrolled in this study. Clinical samples were annotated with tumor histology and driver mutation. Adenocarcinoma, adenosquamous, and NSCLC NOS tumors were annotated by their molecular driver mutations, if known. The category ‘Unknown Driver’ refers to adenocarcinoma, adenosquamous, and NSCLC NOS histology tumors for which a driver mutation (defined as ‘known to be oncogenic’ by OncoKB28) was not identified; notably, this category does not include squamous or small cell histology biospecimens. With the exception of a single case in which a tumor sample with squamous histology harbored a MET exon 14 mutation and two transformed small-cell lung cancer tumors with EGFR mutations, squamous and small-cell lung cancers were annotated by their histology.
Cell lines
A cell line could be derived from the MSK 1111 PDX and was maintained in RPMI supplemented with 10% human serum, 1% penicillin/streptomycin, 0.1% amphotericin, 1X GlutaMax, 1mM sodium pyruvate, and 1X minimum essential amino acids (complete media). The PDX from MSK 1087 could not be propagated in cell culture and cryopreserved PDX cells (>80% human EPCAM+) were utilized immediately after thawing. Virus-producing cell lines (H29 and RD114-envelope producers) were previously described51,52. H522 cell line was maintained in complete media. H522-NY-ESO1 was generated by transduction with NY-ESO1-GFP lentiviral plasmids lentiviral particles Lentiviral production and transduction were performed as previously described53. GFP+ cells were flow-sorted (BD Aria) and expanded prior to cryopreservation. All cell lines were cultured in a 5% CO2 incubator at 37°C and passaged every 2–3 days.
Co-culture of NY-ESO1-reactive T cells with cognate antigen
Cryopreserved healthy donor CD8+ T cells enriched for NY-ESO1-reactive T cells were obtained from Charles River. Notably, these cells were previously expanded ex vivo in the presence of NY-ESO1 peptide and cryopreserved prior to purchase. The certificate of analysis indicates that the cells were 98% viable with 73.74% of the cells were positive for staining with CD8+ and HLA-A*02:01-NY-ESO1 tetramer. These CD8+ T cells were labeled with 1μM of Cell Trace Violet per manufacturer’s instructions and then plated at 2.5×10⁴ viable T cells per 100μl of complete T cell media in a 24W plate in ‘reservoir’ wells.
1×10⁵ irradiated (30Gy, Cesium source irradiator) H522 or H522-NYESO1 tumor cells were cultured for 24 hours with 10ng/ml of IFNγ) and plated onto a 96W flat-bottom plate. On days 1, 4, 7, 8, 9, and 10 after this plating of the tumor cells, 100μl of the CTV-labeled NY-ESO1-reactive T cells were added from the reservoir well to the respective co-culture well and flow cytometry (see below) was performed on day 11 after the initial tumor cell plating, which coincides with day 10, 7, 4, 3, 2, and 1 of T cell co-culture, respectively. CD8+ T cells from the reservoir well was utilized as a ‘no co-culture’ condition.
For the peptide-pulsed experiments, 1×10⁵ irradiated H522 tumor cells were cultured for 24 hours with 10ng/ml of IFNγ) and plated onto a 96W flat-bottom plate. On days 1, 4, 7, 9, and 10 after this plating of the tumor cells, 100μl of the CTV-labeled NY-ESO1-reactive T cells were added from the reservoir well to the respective co-culture well and flow cytometry (see below) was performed on day 11 after the initial tumor cell plating, which coincides with day 10, 7, 4, 2, and 1 of T cell co-culture, respectively. CD8+ T cells from the reservoir well was utilized as a ‘no co-culture’ condition.
METHOD DETAILS
Single-cell transcriptome sequencing
Sorted or dissociated tumor cells were stained with Trypan blue and Countess II Automated Cell Counter (ThermoFisher) was used to assess both cell number and viability. Following QC, the single-cell suspension was loaded onto Chromium Chip A or Next GEM Chip K and GEM generation, cDNA synthesis, cDNA amplification, and library preparation of 700–3,300 cells proceeded using the Chromium Single Cell 5’ Reagent Kit or Next GEM Single Cell 5’ Kit v2 according to the manufacturer’s protocol. cDNA amplification included 14–16 cycles and 5.8 ng-20 ng of the material was used to prepare sequencing libraries with 16 cycles of PCR. Indexed libraries were pooled equimolar and sequenced on a NovaSeq 6000 in a PE26/91 or PE28/91 run using the NovaSeq 6000 SP or S1 Reagent Kit. An average of 108 million reads were generated per sample.
Single-cell TCR (V(D)J) analysis from RNA
An aliquot of complementary DNA (cDNA) generated using the methods described above was used to enrich for V(D)J regions using the Chromium Single Cell V(D)J Enrichment Kit Human T Cell according to the manufacturer’s protocol with 10 cycles of PCR during enrichment and 9 cycles during library preparation. Indexed libraries were pooled equimolar and sequenced on a NovaSeq 6000 in a PE150 or PE26/91 run using the NovaSeq 6000 SP or S4 Reagent Kit. An average of 24 million paired reads was generated per sample.
Cell surface protein feature barcode analysis
Amplification products generated using the methods described above included both cDNA and feature barcodes tagged with cell barcodes and unique molecular identifiers. Smaller feature barcode fragments were separated from longer amplified cDNA using a 0.6X cleanup with aMPure XP beads. Libraries were constructed using the Chromium Single Cell 5’ Feature Barcode Library Kit according to the manufacturer’s protocol with 9 cycles of PCR. Indexed libraries were pooled equimolar and sequenced on a NovaSeq 6000 in a PE26/91 or PE28/91 run using the NovaSeq 6000 SP or S2 Reagent Kit. An average of 60 million paired reads was generated per sample.
Single cell CITE/RNA/TCR analysis
Single-cell sequencing data were aligned to the Genome Reference Consortium Human Build 38 (GRCh38) using Cell Ranger in order to obtain T cell clonotypes, feature barcoding, CITEseq antibody detection and gene expression profiles associated with individual single cells. Each data type was matched to create a UMI matrix and cells were filtered out based on three metrics: (1) cells with fewer than 200 detectable genes; (2) cells with more than 3000 detectable genes; (3) cells that had fewer than 5% percentage of counts related to mitochondrial genes. Data normalization, Principal Component Analysis and subsequent Uniform Manifold Approximation and Projections (UMAP) were performed on the dataset using Seurat. The differential expression comparisons were generated using the DESeq2 package with selected genes. After filtering, we created subclusters of cells using the Louvain algorithm. Raw counts were normalized by library size per cell. CD39neg was defined as a normalized value of 0 for adt_CD39. CD39int was defined as the adt_CD39 level between 0 and 1.0 (non-inclusive) since 1.0 was the mean of all non-zero values for adt_CD39 among all the cells in the CD8+ cluster. CD39hi was defined as adt_CD39 level greater than or equal to 1.0. Signature scores for exhaustion, proliferation and tumor reactivity were calculated by AddModuleScore in Seurat. Clonal proportion was calculated as the fractional representation of all CD8+ clones by clonotypes that were categorized by mean adt_CD39 expression with the same cutoffs for CD39neg, CD39int, and CD39hi as above.
Empiric testing of TCR reactivity
TCR fragments for positive control NY-ESO1 TCR or candidate CD39hi, CD39int, and CD39neg CD8+ T cell sequences (Table S5) were constructed as previously described54. We joined the TRB and TRA chains (with human TRAC and TRBC chains) with a furin SGSG P2A linker, cloned the TCR constructs into an SFG γ-retroviral vector55 and sequence-verified all plasmids with Sanger sequencing. We transfected retrovirus vectors into H29 cells using calcium phosphate to produce VSV-G pseudo-typed retroviruses51. We next used Polybrene and viral-containing supernatants to generate stable RD114-enveloped producer cell lines52. We collected and concentrated virus-containing supernatants using Retro-X™ Concentrator.
Deletion of endogenous TCR in healthy donor PBMC was achieved as previously described56 with some modifications. CD8+ T cells from healthy donors were initially separated with negative selection for CD8+ T cells and cryopreserved in Bambanker media. CD8+ T cells were thawed and then incubated with DNAse I for 20 minutes at 37°C and then activated for 48 hours with anti-CD3/CD28 Dynabeads. Activated CD8+ T cells were then electroporated with a Cas9 ribonucleoprotein and guide RNAs targeting the TRAC and TRBC sequences via 4D-Nucleofector. The electroporated CD8+ T cells were then rested overnight in complete media supplemented with IL-2 (240IU/ml) and IL-15 (10ng/ml) (complete T cell media). The guide RNA sequences utilized are as follows:
TRAC gRNA sequence
5′-C*A*G*GGUUCUGGAUAUCUGUGUUUUAGAGCUAGAAAUAGCAAGUUAAAAUAAG GCUAGUCCGUUAUCAACUUGAAAA AGUGGCACCGAGUCGGUGCU*U*U*U-3′
TRBC gRNA sequence
5′-GCAGUAUCUGGAGUCAUUGA-3′
Asterisk (*) represents 2′-O-methyl 3′ phosphorothioate. Endogenous TCR deletion efficiency was >90%, as assessed by CD3 assessment in untransduced TRAC/TRBC-edited cells.
For T cell transductions, we coated non-tissue culture treated 24-well plates with Retronectin as per the manufacturer’s protocol. We plated a 0.5×10⁶ activated electroporated T cells per well, and centrifuged cells for 1 hour at room temperature at 400g (acceleration 3, brake 0). Successfully transduced T cells were utilized in co-culture assays with matched tumor targets (H522-NYESO1, MSK 1087 PDX cells, or MSK 1111 PDX-derived cell line) between 7–10 days post transduction or cryopreserved for future use. In order to enhance MHC I expression, tumor targets were incubated with 10ng/ml of human IFN for 24 hours prior to addition of T cells.
1×10⁵ IFNγ-treated tumor targets were co-cultured with 1×10⁵ total T cells after transduction in a 96 well V bottom plate in complete T cell medium. 10μg/ml of anti-MHC I (clone W6/32) were added to some wells to assess for MHC I dependence. %4–1BB was evaluated by flow cytometry (see below) on EGFRt+ transduced CD8+ T cells. TCRs were considered reactive if the %4–1BB was ≥5% higher in the well with PDX co-culture (without anti-MHC I) compared to the T cells alone16.
Flow cytometry
Cells were incubated with TruFCX to block nonspecific binding, and then stained (15 min, 4 °C) with appropriate dilutions of various combinations of fluorochrome-conjugated anti-human antibodies. The stained cells were acquired on a LSRII Flow Cytometer or BD Aria cell sorter and the data were processed using FlowJo software. Doublets and dead cells were excluded based on forward scatter (FSC) and side scatter (SSC) and 4′,6-diamidino-2-phenylindole staining (DAPI, 1 μg/ml). All depicted flow cytometry plots were pre-gated on non-debris (by FSC and SSC), viable (DAPI−) single CD45+ CD3+ cells, unless otherwise indicated in the Figure legend. Gating for %4–1BB, %PD-1, and %CD39 was determined by gating of fluorescence minus one (FMO). PD-1 mean fluorescence intensity was measured for a subset of samples.
Bulk TCR sequencing of CD39- and CD39+ populations
From MSK 1265b, 1322a, and 1336a, CD39− and CD39+ CD8+ T cell populations were flow-sorted from the peripheral blood and tissues on a BD Aria cell sorter. Cell pellets were initially frozen at −80°C and then genomic DNA (gDNA) was extracted with the AllPrep DNA/RNA Mini kit. gDNA was then shipped to Adaptive Biotechnologies for bulk TCR sequencing.
Immune-related adverse events annotation
Patient charts were analyzed for the period from the start of immunotherapy treatment until six months after treatment. Physicians’ notes and lab work were analyzed for identification of IRAE, including colitis, pneumonitis, hypothyroidism, arthralgias or other events and if the patient was treated with steroids. Patients with and without IRAE were assessed for a difference in CD39+ CD8+ T cell abundance, total CD8+ T cell infiltrate, TMB, or PD-L1 expression.
Clinical outcomes analyses
RFS assessment was performed on 188 biospecimens obtained from stage I-IIIA lung cancer who did not receive neoadjuvant ICB and were not lost to follow up after resection. For the PFS assessment in stage IV patients not treated with ICB, only patients that received at least two cycles of platinum-based chemotherapy were included in the analysis (n=26). For the PFS assessment in stage IV patient treated with ICB, only patients that received at least two cycles of ICB without chemotherapy were included in the analysis (n=23). The median cutoffs for %CD8+ among CD45+ and %CD39 among CD8++ of 13.0 and 15.7, respectively, and top quartile (Q4) cutoff of 20.6 and 37.23, respectively, were selected from the 440-sample cohort. The PD-1 cutoff of 750 was selected to divide the cohort above and below the median for the stage IV cohort. Response criteria were annotated per RECIST v1.1.
A gene expression signature suitable for estimation of CD39+ CD8+ T cells from bulk RNA-seq of NSCLC tumors was derived by first identifying genes that were differentially expressed by CD39hi CD8+ T cells from the human scRNAseq dataset. To eliminate signals from other cell types present in the tumor microenvironment, we filtered against independent NSCLC scRNA-seq data57 to only select genes expressed in the T/NK cell compartment, as described previously42. We further refined the signatures by selecting genes that were well correlated with ENTPD1 (Spearman R >0.5) in bulk NSCLC tumor RNA-seq from the OAK clinical trial42. Single sample gene signature scores were assigned to bulk RNA-seq samples from OAK by taking the median z-score of the genes that comprise the signature. Multivariate Cox models compared the association with survival of the signature score of CD39+ CD8+ T and a general T cell infiltration score (Table S4).
Progression-free survival was plotted for lung patients that were randomized and treated with atezolizumab or docetaxel chemotherapy on the Phase 3 OAK clinical trial41. PFS curves were stratified by either the median expression or top quartile (Q4) vs bottom 3 quartiles (Q1–3) of expression of the CD39+ CD8+ T cell gene signature.
QUANTIFICATION AND STATISTICAL ANALYSIS
Multivariate analyses
We used the R package caret58 to implement the glmnet59 algorithm and evaluate the performance of a lasso regression model using 10-fold cross-validation. The data was centered and scaled during preprocessing and lambda was chosen based on the minimal RMSE value. Additionally, a linear model was evaluated using the R function “lm”. In both models, the response variable, CD39 expression, was log base 2 transformed as well as the predictor variables TMB and total neoantigens per sample.
Statistical analysis
Data are expressed and statistical analyses were performed as described in the Figure legend for each analysis. Statistical significance was determined by two-way ANOVA with Tukey’s multiple comparison test, student’s t test or Mantel-Cox log-rank test using Prism 7 software as indicated.
Supplementary Material
Table S1 (Related to Fig 1). Clinical features of four lung cancer clinical biospecimens that underwent single cell CITE/RNA/TCR sequencing.
Table S2A (Related to Fig 1). Differentially expressed genes for CD8+, CD4+, Treg, and T cell NOS clusters from single cell CITE/RNA/TCR sequencing.
Table S2B (Related to Fig 1). Differentially expressed genes for CD39hi CD8+ T cells compared to all other CD8+ T cells from single cell CITE/RNA/TCR sequencing.
Table S3 (Related to Fig 1). List of gene signatures used for scoring.
Table S4 (Related to Fig 2). Successfully cloned TCR sequences for testing of tumor reactivity.
Table S5A (Related to Fig 4). Clinical and molecular features of 440 patient lung cancer cohort.
Table S5B (Related to Fig 4). Median and mean values for %CD39 on CD8+ T cells among lung cancer subtypes.
Table S5C (Related to Fig 4). Linear regression multivariate analysis of %CD39 on CD8+ T cells.
Table S5D (Related to Fig 4). Lasso regression multivariate analysis of %CD39 on CD8+ T cells.
Table S5E (Related to Fig 6). Clinical and molecular features of 23 stage IV lung cancer patients who received immune checkpoint blockade therapy without chemotherapy.
Key resources table.
| REAGENT or RESOURCE | SOURCE | IDENTIFIER |
|---|---|---|
| Antibodies | ||
| CD45-BV510 | Biolegend | Cat# 368526, RRID:AB_2687377 |
| CD3-BV650 | Biolegend | Cat# 304044, RRID:AB_2563812 |
| CD8+-PerCP-Cy5.5 | Biolegend | Cat# 344710, RRID:AB_2044010 |
| CD8+-BV510 | Biolegend | Cat# 344732, RRID:AB_2564624 |
| EGFR-PE/Cy7 | Biolegend | Cat# 352909, RRID:AB_2562158 |
| 4-1BB-PE | Biolegend | Cat# 309804, RRID:AB_31478 |
| PD-1-APC/Fire 750 | Biolegend | Cat# 329954, RRID:AB_2616721 |
| PD-1-PerCP/Cy5.5 | Biolegend | Cat# 329914, RRID:AB_1595461 |
| CD39-APC | Biolegend | Cat# 328210, RRID:AB_1953234 |
| CD39-PE/Cy7 | Biolegend | Cat# 328212, RRID:AB_2099950 |
| CD4-Alexa Fluor 700 | Biolegend | Cat# 357418, RRID:AB_2616933 |
| Human TruStain FcX™, BioLegend, Human TruStain FcX™ Blocking Buffer | Biolegend | Cat# 422302, RRID:AB_2818986 |
| TotalSeq(TM)-C Human Universal Cocktail, V1.0 | Biolegend | Cat# 399905, RRID:AB_2876728 |
| TotalSeq™-C0251 anti-human Hashtag 1 Antibody | Biolegend | Cat# 394661, RRID:AB_2801031 |
| TotalSeq™-C0252 anti-human Hashtag 2 Antibody | Biolegend | Cat# 394663, RRID:AB_2801032 |
| TotalSeq™-C0253 anti-human Hashtag 3 Antibody | Biolegend | Cat# 394665, RRID:AB_2801033 |
| TotalSeq™-C0254 anti-human Hashtag 4 Antibody | Biolegend | Cat# 394667, RRID:AB_2801034 |
| TotalSeq™-C0255 anti-human Hashtag 5 Antibody | Biolegend | Cat# 394669, RRID:AB_2801035 |
| Anti-MHC I | BioXCell | Cat# BE0079, RRID:AB_1107730 |
| Bacterial and virus strains | ||
| One Shot™ Stbl3™ Chemically Competent E. coli | ThermoFisher Scientific | Cat# C737303 |
| NY-ESO1-GFP Lentiviral Plasmids | SinoBiological | Cat# HG15611-ACGLN |
| Biological samples | ||
| Tumor tissue from NSCLC patients | Resection, biopsy and effusion biospecimens from patients with informed consent at Memorial Sloan Kettering Cancer Center. | This study |
| MSK 1087 PDX | MSKCC Rudin Lab | This study |
| MSK 1111 PDX | MSKCC Rudin Lab | This study |
| Healthy donor PBMCs | New York Blood Center | Leukopheresis pack |
| NY-ESO1-reactive T cells (donor 401) | Charles River | Cat# ASTC-1093 |
| Chemicals, peptides, and recombinant proteins | ||
| RPMI | Corning | Cat# 10-041-CV |
| Human serum | Gemini Biosciences | Cat# 100-512-100 |
| Penicillin/streptomycin | Gibco | Cat# 15140122 |
| Amphotericin | Gibco | Cat# 15290026 |
| Glutamax | Gibco | Cat# 35050061 |
| Minimum essential amino acids | Millipore Sigma | Cat# M7145 |
| Sodium pyruvate | Gibco | Cat# 11360070 |
| Tumor Dissociation Kit, human | Miltenyi | Cat# 130-095-929 |
| Polybrene | Sigma | Cat# TR-1003-G |
| Retro-X Concentrator | Takara | Cat# 631455 |
| Retronectin GMP grade | Takara | Cat# T202 |
| EasySep™ Human CD8++ T Cell Isolation Kit | Stem Cell Technologies | Cat# 17953 |
| DNase I Solution (1 mg/mL) | Stem Cell Technologies | Cat# 100-0762 |
| IL-2 | Peprotech | Cat# 200-02 |
| IL-15 | Peprotech | Cat# 200-15 |
| IFNγ | Peprotech | Cat# 300-02 |
| Cell Trace Violet | Invitrogen | Cat# C34557 |
| Dynabeads™ Human T-Activator CD3/CD28 for T Cell Expansion and Activation | Invitrogen | Cat# 11132D |
| Bambanker Serum Free Cell Freezing Medium | VWR | Cat# 101974-112 |
| Dapi, for nucleic acid staining | Sigma-Aldrich | Cat# D9542-50MG |
| Critical commercial assays | ||
| NEBuilder® HiFi DNA Assembly Cloning Kit | New England BioLabs | Cat# E5520S |
| Chromium Chip A | 10X Genomics | Cat# PN-230027 |
| Next GEM Chip K | 10X Genomics | Cat# PN-1000286 |
| Chromium Single Cell 5’ Reagent Kit | 10X Genomics | Cat# PN-1000006 |
| Next GEM Single Cell 5’ Kit v2 | 10X Genomics | Cat# PN-1000263 |
| Chromium Single Cell V(D)J Enrichment Kit Human T Cell | 10X Genomics | Cat# PN-1000005 |
| Chromium Single Cell 5’ Feature Barcode Library Kit | 10X Genomics | Cat# PN-1000080 |
| NovaSeq 6000 SP Reagent Kit v1.5 | Illumina | Cat# 20028401 |
| NovaSeq 6000 S1 Reagent Kit v1.5 | Illumina | Cat# 20028319 |
| NovaSeq 6000 S4 Reagent Kit v1.5 | Illumina | Cat# 20028312 |
| NovaSeq 6000 S2 Reagent Kit v1.5 | Illumina | Cat# 20028316 |
| aMPure XP beads | Beckman Coulter | Cat# A63882 |
| 4D-Nucleofector | Lonza | Cat# V4XP-3024 |
| Sanger Sequencing | Azenta Life Sciences | Custom |
| AllPrep DNA/RNA Mini Kits | Qiagen | Cat# 80204 |
| Deposited data | ||
| Single cell CITE/RNA/TCRseq of MSK 1087, 1111, 1222, and 1256 | NCBI GEO | GSE218262 |
| Bulk TCR sequencing of MSK 1265b, 1322a, and 1336a | Adaptive Biotechnologies ImmuneAccess | https://doi.org/10.21417/AC2022I |
| Raw and processed RNA-seq data from OAK | European Genome-phenome Archive | EGAS00001005013 |
| Relevant clinical data from OAK | European Genome-phenome Archive | EGAS00001005013 |
| Experimental models: Cell lines | ||
| H522 | ATCC | RRID:CVCL_1567 |
| H522-NY-ESO1 | This paper | |
| 293T H29 packaging cell line | MSKCC Sadelain Lab | REF53 |
| 293T RD114-envelope cell line | MSKCC Sadelain Lab | REF54 |
| Oligonucleotides | ||
| Cas9 RNP | QB3 UC Berkley Macrolab Facility | Cas9-NLS purified protein |
| Human TRAC gRNA | Synthego | CRISPRevolution sgRNA EZ Kit, custom-made (sequence in text) |
| Human TRBC gRNA | Synthego | CRISPRevolution sgRNA EZ Kit, custom-made (sequence in text) |
| G block fragments for TCR cloning | IDT | Custom-made (sequences in Table S5) |
| Recombinant DNA | ||
| SFG retroviral plasmid with EGFRt marker | MSKCC Sadelain Lab | This study |
| Software and algorithms | ||
| FlowJo | TreeStar | Version 10.8.1 |
| Prism | Graphpad | Version 9.0.0 |
| Seurat | https://github.com/satijalab/seurat | Version 3.1.1 |
| CellRanger | 10X Genomics | Version 3.1.0 |
| Caret R package | https://CRAN.R-project.org/package=caret | Version 6.0-93 |
HIGHLIGHTS.
CD39+ CD8+ T cells express features of exhaustion and tumor reactivity.
CD39 expression enriches for CD8+ TCRs with tumor reactivity.
CD39 on CD8+ T cells is non-redundant to tumor-based biomarkers.
CD39+ CD8+ T cells are predictive of benefit from immune checkpoint blockade.
ACKNOWLEDGEMENTS
We are grateful for experimental support from the MSKCC Molecular Cytology Core Facility, Flow Cytometry Core Facility, and Integrated Genomics Operation Core (funded by the NCI Cancer Center Support Grant (CCSG, P30 CA08748), Cycle for Survival, and the Marie-Josée and Henry R. Kravis Center for Molecular Oncology). We are grateful for manuscript editing provided by Dr. Clare Wilhelm and Reeja Thomas. This research was funded in part through the NIH NCI CCSG P30 CA008748, NCI R01 CA056821, U24 CA213274, P01 CA129243, R01 CA197936, R37 CA259177 (CAK), Cancer Research Institute CRI3176 (CAK), Stony-Wold Herbert Fund, International Association of Lung Cancer Research (IASLC)/ International Lung Cancer Foundation (ILCF), the MSKCC Society Grant, the Ludwig Collaborative and Swim Across America Laboratory, the Emerald Foundation, the Parker Institute for Cancer Immunotherapy at MSKCC, the Department of Medicine at MSKCC, Stand Up To Cancer (SU2C)-American Cancer Society Lung Cancer Dream Team Translational research grant (SU2C-AACR-DT17–15), Mark Foundation for Cancer Research (Grant #19–029-MIA), and Kay Stafford Fund. AC was supported by an MSKCC Investigational Cancer Therapeutics Training Program fellowship (T32 CA-009207) and Clinical Investigator Award from National Cancer Institute (K08 CA-248723).
Footnotes
DECLARATION OF INTERESTS
CAK received research grant support from Kite/Gilead; is on the Scientific and/or Clinical Advisory Boards of Achilles Therapeutics, Aleta BioTherapeutics, Bellicum Pharmaceuticals, Catamaran Bio, Obsidian Therapeutics, and T-knife, and has performed consulting services for Bristol Myers Squibb, PACT Pharma, and Roche/Genentech. CAK is a co-inventor on patent applications related to TCRs targeting public neoantigens unrelated to the current work. MDH received research grant from BMS; personal fees from Achilles, Arcus, AstraZeneca, Blueprint, BMS, Genentech/Roche, Genzyme, Immunai, Instil Bio, Janssen, Merck, Mirati, Natera, Nektar, Pact Pharma, Regeneron, Shattuck Labs, Syndax, as well as equity options from Arcus, Factorial, Immunai, and Shattuck Labs. A patent filed by MSKCC related to the use of tumor mutational burden to predict response to immunotherapy (PCT/US2015/062208) is pending and licensed by PGDx. JDW is a Consultant for: Amgen, Apricity, Ascentage Pharma, Astellas, AstraZeneca, Bicara Therapeutics, Boehringer Ingelheim, Bristol Myers Squibb, CellCarta, Chugai, Daiichi Sankyo, Dragonfly, Georgiamune, Idera, Imvaq, Larkspur, Maverick Therapeutics, Merck, Psioxus, Recepta, Tizona, Trishula, Sellas, Surface Oncology, Werewolf Therapeutics. JDW receives Grant/Research Support from: Bristol Myers Squibb and Sephora. JDW has Equity in: Apricity, Arsenal IO, Ascentage, Beigene, Imvaq, Linneaus, Georgiamune, Maverick, Tizona Pharmaceuticals and Trieza. JDW is a co-inventor on the following patent application: Xenogeneic (Canine) DNA Vaccines, Myeloid-derived suppressor cell (MDSC) assay, Anti-PD1 Antibody, Anti-CTLA4 antibodies, Anti-GITR antibodies and methods of use thereof, Newcastle Disease viruses for Cancer Therapy, and Prediction of Responsiveness to Treatment With Immunomodulatory Therapeutics and Method of Monitoring Abscopal Effects During Such Treatment. JDW and TM are co-inventors on patent applications related to CD40 and in situ vaccination (PCT/US2016/045970). TM is a consultant for Immunos Therapeutics and Pfizer. TM is a cofounder of and equity holder in IMVAQ Therapeutics. TM receives research funding from Bristol-Myers Squibb, Surface Oncology, Kyn Therapeutics, Infinity Pharmaceuticals, Peregrine Pharmaceuticals, Adaptive Biotechnologies, Leap Therapeutics, and Aprea Therapeutics. TM is an inventor on patent applications related to work on oncolytic viral therapy, alpha virus–based vaccine, neoantigen modeling, CD40, GITR, OX40, PD-1, and CTLA-4. C.M.R. has consulted regarding oncology drug development with AbbVie, Amgen, Ascentage, AstraZeneca, BMS, Celgene, Daiichi Sankyo, Genentech/Roche, Ipsen, Loxo and PharmaMar and is on the scientific advisory boards of Elucida, Bridge and Harpoon.
Publisher's Disclaimer: This is a PDF file of an unedited manuscript that has been accepted for publication. As a service to our customers we are providing this early version of the manuscript. The manuscript will undergo copyediting, typesetting, and review of the resulting proof before it is published in its final form. Please note that during the production process errors may be discovered which could affect the content, and all legal disclaimers that apply to the journal pertain.
REFERENCES
- 1.Ribas A, and Wolchok JD (2018). Cancer immunotherapy using checkpoint blockade. Science 359, 1350–1355. 10.1126/science.aar4060. [DOI] [PMC free article] [PubMed] [Google Scholar]
- 2.Thommen DS, Koelzer VH, Herzig P, Roller A, Trefny M, Dimeloe S, Kiialainen A, Hanhart J, Schill C, Hess C, et al. (2018). A transcriptionally and functionally distinct PD-1(+) CD8(+) T cell pool with predictive potential in non-small-cell lung cancer treated with PD-1 blockade. Nat Med 24, 994–1004. 10.1038/s41591-018-0057-z. [DOI] [PMC free article] [PubMed] [Google Scholar]
- 3.Hellmann MD, Ciuleanu TE, Pluzanski A, Lee JS, Otterson GA, Audigier-Valette C, Minenza E, Linardou H, Burgers S, Salman P, et al. (2018). Nivolumab plus Ipilimumab in Lung Cancer with a High Tumor Mutational Burden. N Engl J Med 378, 2093–2104. 10.1056/NEJMoa1801946. [DOI] [PMC free article] [PubMed] [Google Scholar]
- 4.Reck M, Rodriguez-Abreu D, Robinson AG, Hui R, Csoszi T, Fulop A, Gottfried M, Peled N, Tafreshi A, Cuffe S, et al. (2016). Pembrolizumab versus Chemotherapy for PD-L1-Positive Non-Small-Cell Lung Cancer. N Engl J Med 375, 1823–1833. 10.1056/NEJMoa1606774. [DOI] [PubMed] [Google Scholar]
- 5.Riaz N, Havel JJ, Makarov V, Desrichard A, Urba WJ, Sims JS, Hodi FS, Martin-Algarra S, Mandal R, Sharfman WH, et al. (2017). Tumor and Microenvironment Evolution during Immunotherapy with Nivolumab. Cell 171, 934–949 e916. 10.1016/j.cell.2017.09.028. [DOI] [PMC free article] [PubMed] [Google Scholar]
- 6.Verma V, Shrimali RK, Ahmad S, Dai W, Wang H, Lu S, Nandre R, Gaur P, Lopez J, Sade-Feldman M, et al. (2019). PD-1 blockade in subprimed CD8 cells induces dysfunctional PD-1(+)CD38(hi) cells and anti-PD-1 resistance. Nat Immunol 20, 1231–1243. 10.1038/s41590-019-0441-y. [DOI] [PMC free article] [PubMed] [Google Scholar]
- 7.Helmink BA, Reddy SM, Gao J, Zhang S, Basar R, Thakur R, Yizhak K, Sade-Feldman M, Blando J, Han G, et al. (2020). B cells and tertiary lymphoid structures promote immunotherapy response. Nature 577, 549–555. 10.1038/s41586-019-1922-8. [DOI] [PMC free article] [PubMed] [Google Scholar]
- 8.Sade-Feldman M, Yizhak K, Bjorgaard SL, Ray JP, de Boer CG, Jenkins RW, Lieb DJ, Chen JH, Frederick DT, Barzily-Rokni M, et al. (2018). Defining T Cell States Associated with Response to Checkpoint Immunotherapy in Melanoma. Cell 175, 998–1013 e1020. 10.1016/j.cell.2018.10.038. [DOI] [PMC free article] [PubMed] [Google Scholar]
- 9.Osorio JC, Arbour KC, Le DT, Durham JN, Plodkowski AJ, Halpenny DF, Ginsberg MS, Sawan P, Crompton JG, Yu HA, et al. (2019). Lesion-Level Response Dynamics to Programmed Cell Death Protein (PD-1) Blockade. J Clin Oncol 37, 3546–3555. 10.1200/JCO.19.00709. [DOI] [PMC free article] [PubMed] [Google Scholar]
- 10.Scheper W, Kelderman S, Fanchi LF, Linnemann C, Bendle G, de Rooij MAJ, Hirt C, Mezzadra R, Slagter M, Dijkstra K, et al. (2019). Low and variable tumor reactivity of the intratumoral TCR repertoire in human cancers. Nat Med 25, 89–94. 10.1038/s41591-018-0266-5. [DOI] [PubMed] [Google Scholar]
- 11.Simoni Y, Becht E, Fehlings M, Loh CY, Koo SL, Teng KWW, Yeong JPS, Nahar R, Zhang T, Kared H, et al. (2018). Bystander CD8(+) T cells are abundant and phenotypically distinct in human tumour infiltrates. Nature 557, 575–579. 10.1038/s41586-018-0130-2. [DOI] [PubMed] [Google Scholar]
- 12.Duhen T, Duhen R, Montler R, Moses J, Moudgil T, de Miranda NF, Goodall CP, Blair TC, Fox BA, McDermott JE, et al. (2018). Co-expression of CD39 and CD103 identifies tumor-reactive CD8 T cells in human solid tumors. Nat Commun 9, 2724. 10.1038/s41467-018-05072-0. [DOI] [PMC free article] [PubMed] [Google Scholar]
- 13.Li H, van der Leun AM, Yofe I, Lubling Y, Gelbard-Solodkin D, van Akkooi ACJ, van den Braber M, Rozeman EA, Haanen J, Blank CU, et al. (2018). Dysfunctional CD8 T Cells Form a Proliferative, Dynamically Regulated Compartment within Human Melanoma. Cell. 10.1016/j.cell.2018.11.043. [DOI] [PMC free article] [PubMed] [Google Scholar]
- 14.Yost KE, Satpathy AT, Wells DK, Qi Y, Wang C, Kageyama R, McNamara KL, Granja JM, Sarin KY, Brown RA, et al. (2019). Clonal replacement of tumor-specific T cells following PD-1 blockade. Nat Med 25, 1251–1259. 10.1038/s41591-019-0522-3. [DOI] [PMC free article] [PubMed] [Google Scholar]
- 15.Caushi JX, Zhang J, Ji Z, Vaghasia A, Zhang B, Hsiue EH, Mog BJ, Hou W, Justesen S, Blosser R, et al. (2021). Transcriptional programs of neoantigen-specific TIL in anti-PD-1-treated lung cancers. Nature. 10.1038/s41586-021-03752-4. [DOI] [PMC free article] [PubMed] [Google Scholar]
- 16.Oliveira G, Stromhaug K, Klaeger S, Kula T, Frederick DT, Le PM, Forman J, Huang T, Li S, Zhang W, et al. (2021). Phenotype, specificity and avidity of antitumour CD8(+) T cells in melanoma. Nature 596, 119–125. 10.1038/s41586-021-03704-y. [DOI] [PMC free article] [PubMed] [Google Scholar]
- 17.Lowery FJ, Krishna S, Yossef R, Parikh NB, Chatani PD, Zacharakis N, Parkhurst MR, Levin N, Sindiri S, Sachs A, et al. (2022). Molecular signatures of antitumor neoantigen-reactive T cells from metastatic human cancers. Science, eabl5447. 10.1126/science.abl5447. [DOI] [PMC free article] [PubMed] [Google Scholar]
- 18.Hanada KI, Zhao C, Gil-Hoyos R, Gartner JJ, Chow-Parmer C, Lowery FJ, Krishna S, Prickett TD, Kivitz S, Parkhurst MR, et al. (2022). A phenotypic signature that identifies neoantigen-reactive T cells in fresh human lung cancers. Cancer Cell. 10.1016/j.ccell.2022.03.012. [DOI] [PMC free article] [PubMed] [Google Scholar]
- 19.Stoeckius M, Hafemeister C, Stephenson W, Houck-Loomis B, Chattopadhyay PK, Swerdlow H, Satija R, and Smibert P (2017). Simultaneous epitope and transcriptome measurement in single cells. Nat Methods 14, 865–868. [DOI] [PMC free article] [PubMed] [Google Scholar]
- 20.Gohil SH, Iorgulescu JB, Braun DA, Keskin DB, and Livak KJ (2021). Applying high-dimensional single-cell technologies to the analysis of cancer immunotherapy. Nat Rev Clin Oncol 18, 244–256. 10.1038/s41571-020-00449-x. [DOI] [PMC free article] [PubMed] [Google Scholar]
- 21.van der Leun AM, Thommen DS, and Schumacher TN (2020). CD8(+) T cell states in human cancer: insights from single-cell analysis. Nat Rev Cancer 20, 218–232. 10.1038/s41568-019-0235-4. [DOI] [PMC free article] [PubMed] [Google Scholar]
- 22.Guo X, Zhang Y, Zheng L, Zheng C, Song J, Zhang Q, Kang B, Liu Z, Jin L, Xing R, et al. (2018). Global characterization of T cells in non-small-cell lung cancer by single-cell sequencing. Nat Med 24, 978–985. 10.1038/s41591-018-0045-3. [DOI] [PubMed] [Google Scholar]
- 23.Gueguen P, Metoikidou C, Dupic T, Lawand M, Goudot C, Baulande S, Lameiras S, Lantz O, Girard N, Seguin-Givelet A, et al. (2021). Contribution of resident and circulating precursors to tumor-infiltrating CD8(+) T cell populations in lung cancer. Sci Immunol 6. 10.1126/sciimmunol.abd5778. [DOI] [PubMed] [Google Scholar]
- 24.Miller BC, Sen DR, Al Abosy R, Bi K, Virkud YV, LaFleur MW, Yates KB, Lako A, Felt K, Naik GS, et al. (2019). Subsets of exhausted CD8(+) T cells differentially mediate tumor control and respond to checkpoint blockade. Nat Immunol 20, 326–336. 10.1038/s41590-019-0312-6. [DOI] [PMC free article] [PubMed] [Google Scholar]
- 25.Chow A, Schad S, Green MD, Hellmann MD, Allaj V, Ceglia N, Zago G, Shah NS, Sharma SK, Mattar M, et al. (2021). Tim-4(+) cavity-resident macrophages impair anti-tumor CD8(+) T cell immunity. Cancer Cell 39, 973–988 e979. 10.1016/j.ccell.2021.05.006. [DOI] [PMC free article] [PubMed] [Google Scholar]
- 26.Zehn D, Lee SY, and Bevan MJ (2009). Complete but curtailed T-cell response to very low-affinity antigen. Nature 458, 211–214. 10.1038/nature07657. [DOI] [PMC free article] [PubMed] [Google Scholar]
- 27.Ishihara M, Kitano S, Kageyama S, Miyahara Y, Yamamoto N, Kato H, Mishima H, Hattori H, Funakoshi T, Kojima T, et al. (2022). NY-ESO-1-specific redirected T cells with endogenous TCR knockdown mediate tumor response and cytokine release syndrome. J Immunother Cancer 10. 10.1136/jitc-2021-003811. [DOI] [PMC free article] [PubMed] [Google Scholar]
- 28.Chakravarty D, Gao J, Phillips SM, Kundra R, Zhang H, Wang J, Rudolph JE, Yaeger R, Soumerai T, Nissan MH, et al. (2017). OncoKB: A Precision Oncology Knowledge Base. JCO Precis Oncol 2017. 10.1200/PO.17.00011. [DOI] [PMC free article] [PubMed] [Google Scholar]
- 29.Horn L, Mansfield AS, Szczesna A, Havel L, Krzakowski M, Hochmair MJ, Huemer F, Losonczy G, Johnson ML, Nishio M, et al. (2018). First-Line Atezolizumab plus Chemotherapy in Extensive-Stage Small-Cell Lung Cancer. N Engl J Med 379, 2220–2229. 10.1056/NEJMoa1809064. [DOI] [PubMed] [Google Scholar]
- 30.Paz-Ares L, Dvorkin M, Chen Y, Reinmuth N, Hotta K, Trukhin D, Statsenko G, Hochmair MJ, Ozguroglu M, Ji JH, et al. (2019). Durvalumab plus platinum-etoposide versus platinum-etoposide in first-line treatment of extensive-stage small-cell lung cancer (CASPIAN): a randomised, controlled, open-label, phase 3 trial. Lancet 394, 1929–1939. 10.1016/S0140-6736(19)32222-6. [DOI] [PubMed] [Google Scholar]
- 31.Nguyen EM, Taniguchi H, Chan JM, Zhan YA, Chen X, Qiu J, de Stanchina E, Allaj V, Shah NS, Uddin F, et al. (2022). Targeting Lysine-Specific Demethylase 1 Rescues Major Histocompatibility Complex Class I Antigen Presentation and Overcomes Programmed Death-Ligand 1 Blockade Resistance in SCLC. J Thorac Oncol 17, 1014–1031. 10.1016/j.jtho.2022.05.014. [DOI] [PMC free article] [PubMed] [Google Scholar]
- 32.Burr ML, Sparbier CE, Chan KL, Chan YC, Kersbergen A, Lam EYN, Azidis-Yates E, Vassiliadis D, Bell CC, Gilan O, et al. (2019). An Evolutionarily Conserved Function of Polycomb Silences the MHC Class I Antigen Presentation Pathway and Enables Immune Evasion in Cancer. Cancer Cell 36, 385–401 e388. 10.1016/j.ccell.2019.08.008. [DOI] [PMC free article] [PubMed] [Google Scholar]
- 33.Chowell D, Krishna C, Pierini F, Makarov V, Rizvi NA, Kuo F, Morris LGT, Riaz N, Lenz TL, and Chan TA (2019). Evolutionary divergence of HLA class I genotype impacts efficacy of cancer immunotherapy. Nat Med 25, 1715–1720. 10.1038/s41591-019-0639-4. [DOI] [PMC free article] [PubMed] [Google Scholar]
- 34.Chowell D, Morris LGT, Grigg CM, Weber JK, Samstein RM, Makarov V, Kuo F, Kendall SM, Requena D, Riaz N, et al. (2018). Patient HLA class I genotype influences cancer response to checkpoint blockade immunotherapy. Science 359, 582–587. 10.1126/science.aao4572. [DOI] [PMC free article] [PubMed] [Google Scholar]
- 35.Zehir A, Benayed R, Shah RH, Syed A, Middha S, Kim HR, Srinivasan P, Gao J, Chakravarty D, Devlin SM, et al. (2017). Mutational landscape of metastatic cancer revealed from prospective clinical sequencing of 10,000 patients. Nat Med 23, 703–713. 10.1038/nm.4333. [DOI] [PMC free article] [PubMed] [Google Scholar]
- 36.Pai JA, Chow A, Sauter JL, Mattar M, Rizvi H, Woo HJ, Shah N, Uddin F, Quintanal-Villalonga A, Chan JM, et al. (2021). Regional and clonal T cell dynamics at single cell resolution in immune checkpoint blockade. bioRxiv, 2021.2009.2027.461389. [Google Scholar]
- 37.Galluzzi L, Buque A, Kepp O, Zitvogel L, and Kroemer G (2017). Immunogenic cell death in cancer and infectious disease. Nat Rev Immunol 17, 97–111. 10.1038/nri.2016.107. [DOI] [PubMed] [Google Scholar]
- 38.Yost KE, Chang HY, and Satpathy AT (2021). Recruiting T cells in cancer immunotherapy. Science 372, 130–131. 10.1126/science.abd1329. [DOI] [PubMed] [Google Scholar]
- 39.Das S, and Johnson DB (2019). Immune-related adverse events and anti-tumor efficacy of immune checkpoint inhibitors. J Immunother Cancer 7, 306. 10.1186/s40425-019-0805-8. [DOI] [PMC free article] [PubMed] [Google Scholar]
- 40.Federico L, McGrail DJ, Bentebibel SE, Haymaker C, Ravelli A, Forget MA, Karpinets T, Jiang P, Reuben A, Negrao MV, et al. (2021). Distinct tumor-infiltrating lymphocyte landscapes are associated with clinical outcomes in localized non-small cell lung cancer. Ann Oncol. 10.1016/j.annonc.2021.09.021. [DOI] [PMC free article] [PubMed] [Google Scholar]
- 41.Mazieres J, Rittmeyer A, Gadgeel S, Hida T, Gandara DR, Cortinovis DL, Barlesi F, Yu W, Matheny C, Ballinger M, and Park K (2021). Atezolizumab Versus Docetaxel in Pretreated Patients With NSCLC: Final Results From the Randomized Phase 2 POPLAR and Phase 3 OAK Clinical Trials. J Thorac Oncol 16, 140–150. 10.1016/j.jtho.2020.09.022. [DOI] [PubMed] [Google Scholar]
- 42.Patil NS, Nabet BY, Muller S, Koeppen H, Zou W, Giltnane J, Au-Yeung A, Srivats S, Cheng JH, Takahashi C, et al. (2022). Intratumoral plasma cells predict outcomes to PD-L1 blockade in non-small cell lung cancer. Cancer Cell 40, 289–300 e284. 10.1016/j.ccell.2022.02.002. [DOI] [PubMed] [Google Scholar]
- 43.Bagaev A, Kotlov N, Nomie K, Svekolkin V, Gafurov A, Isaeva O, Osokin N, Kozlov I, Frenkel F, Gancharova O, et al. (2021). Conserved pan-cancer microenvironment subtypes predict response to immunotherapy. Cancer Cell 39, 845–865 e847. 10.1016/j.ccell.2021.04.014. [DOI] [PubMed] [Google Scholar]
- 44.Leader AM, Grout JA, Maier BB, Nabet BY, Park MD, Tabachnikova A, Chang C, Walker L, Lansky A, Le Berichel J, et al. (2021). Single-cell analysis of human non-small cell lung cancer lesions refines tumor classification and patient stratification. Cancer Cell 39, 1594–1609 e1512. 10.1016/j.ccell.2021.10.009. [DOI] [PMC free article] [PubMed] [Google Scholar]
- 45.Danilova L, Anagnostou V, Caushi JX, Sidhom JW, Guo H, Chan HY, Suri P, Tam A, Zhang J, Asmar ME, et al. (2018). The Mutation-Associated Neoantigen Functional Expansion of Specific T Cells (MANAFEST) Assay: A Sensitive Platform for Monitoring Antitumor Immunity. Cancer Immunol Res 6, 888–899. 10.1158/2326-6066.CIR-18-0129. [DOI] [PMC free article] [PubMed] [Google Scholar]
- 46.Sanmamed MF, Nie X, Desai SS, Villaroel-Espindola F, Badri T, Zhao D, Kim AW, Ji L, Zhang T, Quinlan E, et al. (2021). A burned-out CD8+ T-cell subset expands in the tumor microenvironment and curbs cancer immunotherapy. Cancer Discov. 10.1158/2159-8290.CD-20-0962. [DOI] [PMC free article] [PubMed] [Google Scholar]
- 47.Kumagai S, Togashi Y, Kamada T, Sugiyama E, Nishinakamura H, Takeuchi Y, Vitaly K, Itahashi K, Maeda Y, Matsui S, et al. (2020). The PD-1 expression balance between effector and regulatory T cells predicts the clinical efficacy of PD-1 blockade therapies. Nat Immunol 21, 1346–1358. 10.1038/s41590-020-0769-3. [DOI] [PubMed] [Google Scholar]
- 48.Yeong J, Suteja L, Simoni Y, Lau KW, Tan AC, Li HH, Lim S, Loh JH, Wee FYT, Nerurkar SN, et al. (2021). Intratumoral CD39(+)CD8(+) T Cells Predict Response to Programmed Cell Death Protein-1 or Programmed Death Ligand-1 Blockade in Patients With NSCLC. J Thorac Oncol. 10.1016/j.jtho.2021.04.016. [DOI] [PubMed] [Google Scholar]
- 49.Chalabi M, Fanchi LF, Dijkstra KK, Van den Berg JG, Aalbers AG, Sikorska K, Lopez-Yurda M, Grootscholten C, Beets GL, Snaebjornsson P, et al. (2020). Neoadjuvant immunotherapy leads to pathological responses in MMR-proficient and MMR-deficient early-stage colon cancers. Nat Med 26, 566–576. 10.1038/s41591-020-0805-8. [DOI] [PubMed] [Google Scholar]
- 50.Terranova-Barberio M, Pawlowska N, Dhawan M, Moasser M, Chien AJ, Melisko ME, Rugo H, Rahimi R, Deal T, Daud A, et al. (2020). Exhausted T cell signature predicts immunotherapy response in ER-positive breast cancer. Nat Commun 11, 3584. 10.1038/s41467-020-17414-y. [DOI] [PMC free article] [PubMed] [Google Scholar]
- 51.Gallardo HF, Tan C, Ory D, and Sadelain M (1997). Recombinant retroviruses pseudotyped with the vesicular stomatitis virus G glycoprotein mediate both stable gene transfer and pseudotransduction in human peripheral blood lymphocytes. Blood 90, 952–957. [PubMed] [Google Scholar]
- 52.Ghani K, Wang X, de Campos-Lima PO, Olszewska M, Kamen A, Riviere I, and Caruso M (2009). Efficient human hematopoietic cell transduction using RD114- and GALV-pseudotyped retroviral vectors produced in suspension and serum-free media. Hum Gene Ther 20, 966–974. 10.1089/hum.2009.001. [DOI] [PMC free article] [PubMed] [Google Scholar]
- 53.Wohlhieter CA, Richards AL, Uddin F, Hulton CH, Quintanal-Villalonga A, Martin A, de Stanchina E, Bhanot U, Asher M, Shah NS, et al. (2020). Concurrent Mutations in STK11 and KEAP1 Promote Ferroptosis Protection and SCD1 Dependence in Lung Cancer. Cell Rep 33, 108444. 10.1016/j.celrep.2020.108444. [DOI] [PMC free article] [PubMed] [Google Scholar]
- 54.Gros A, Parkhurst MR, Tran E, Pasetto A, Robbins PF, Ilyas S, Prickett TD, Gartner JJ, Crystal JS, Roberts IM, et al. (2016). Prospective identification of neoantigen-specific lymphocytes in the peripheral blood of melanoma patients. Nat Med 22, 433–438. 10.1038/nm.4051. [DOI] [PMC free article] [PubMed] [Google Scholar]
- 55.Riviere I, Brose K, and Mulligan RC (1995). Effects of retroviral vector design on expression of human adenosine deaminase in murine bone marrow transplant recipients engrafted with genetically modified cells. Proc Natl Acad Sci U S A 92, 6733–6737. 10.1073/pnas.92.15.6733. [DOI] [PMC free article] [PubMed] [Google Scholar]
- 56.Eyquem J, Mansilla-Soto J, Giavridis T, van der Stegen SJ, Hamieh M, Cunanan KM, Odak A, Gonen M, and Sadelain M (2017). Targeting a CAR to the TRAC locus with CRISPR/Cas9 enhances tumour rejection. Nature 543, 113–117. 10.1038/nature21405. [DOI] [PMC free article] [PubMed] [Google Scholar]
- 57.Wu F, Fan J, He Y, Xiong A, Yu J, Li Y, Zhang Y, Zhao W, Zhou F, Li W, et al. (2021). Single-cell profiling of tumor heterogeneity and the microenvironment in advanced non-small cell lung cancer. Nat Commun 12, 2540. 10.1038/s41467-021-22801-0. [DOI] [PMC free article] [PubMed] [Google Scholar]
- 58.Kuhn M (2008). Building Predictive Models in R Using the caret Package. Journal of Statistical Software 28, 1–26. 10.18637/jss.v028.i05.27774042 [DOI] [Google Scholar]
- 59.Friedman J, Hastie T, and Tibshirani R (2010). Regularization Paths for Generalized Linear Models via Coordinate Descent. J Stat Softw 33, 1–22. [PMC free article] [PubMed] [Google Scholar]
Associated Data
This section collects any data citations, data availability statements, or supplementary materials included in this article.
Supplementary Materials
Table S1 (Related to Fig 1). Clinical features of four lung cancer clinical biospecimens that underwent single cell CITE/RNA/TCR sequencing.
Table S2A (Related to Fig 1). Differentially expressed genes for CD8+, CD4+, Treg, and T cell NOS clusters from single cell CITE/RNA/TCR sequencing.
Table S2B (Related to Fig 1). Differentially expressed genes for CD39hi CD8+ T cells compared to all other CD8+ T cells from single cell CITE/RNA/TCR sequencing.
Table S3 (Related to Fig 1). List of gene signatures used for scoring.
Table S4 (Related to Fig 2). Successfully cloned TCR sequences for testing of tumor reactivity.
Table S5A (Related to Fig 4). Clinical and molecular features of 440 patient lung cancer cohort.
Table S5B (Related to Fig 4). Median and mean values for %CD39 on CD8+ T cells among lung cancer subtypes.
Table S5C (Related to Fig 4). Linear regression multivariate analysis of %CD39 on CD8+ T cells.
Table S5D (Related to Fig 4). Lasso regression multivariate analysis of %CD39 on CD8+ T cells.
Table S5E (Related to Fig 6). Clinical and molecular features of 23 stage IV lung cancer patients who received immune checkpoint blockade therapy without chemotherapy.
Data Availability Statement
Single cell data for lung cancer biospecimens are in the process of upload to NIH GEO (Series GSE218262). Bulk TCR sequencing data are in the process of upload to Adaptive Biotechnologies Immunoseq Immune Access (Accession Number https://doi.org/10.21417/AC2022I).