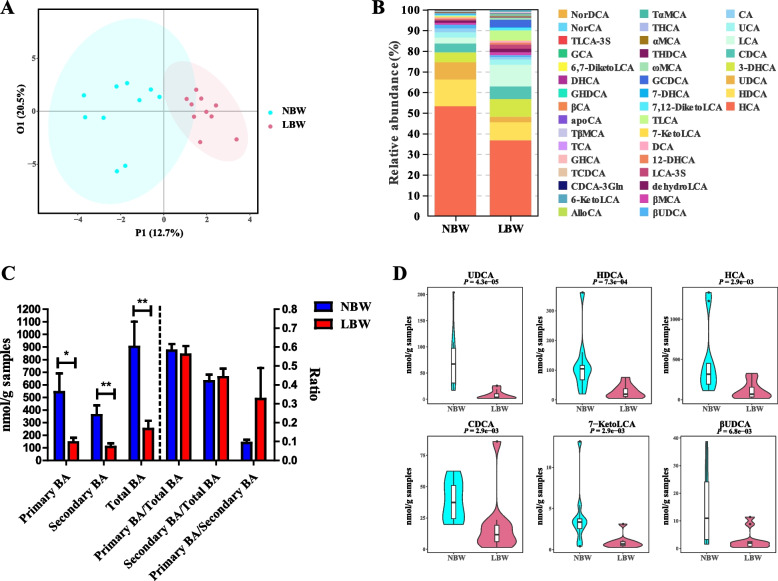
Fig. 1.
Fecal bile acid (BA) profiles of low birth weight (LBW) and normal birth weight (NBW) piglets 2 days after birth (n = 10). A OPLS-DA score plot of the fecal BA profiles. B Relative abundances of BAs in the feces of NBW and LBW piglets. C The concentration of primary BAs, secondary BAs, total BAs, and the ratio of primary BAs to total BAs, primary BAs to total BAs, and primary BAs to secondary BAs. D Violin plots of the six most differentially abundant fecal BAs. Data are presented as means ± SEM in panels C and D. *P < 0.05, **P < 0.01

