Fig. 1.

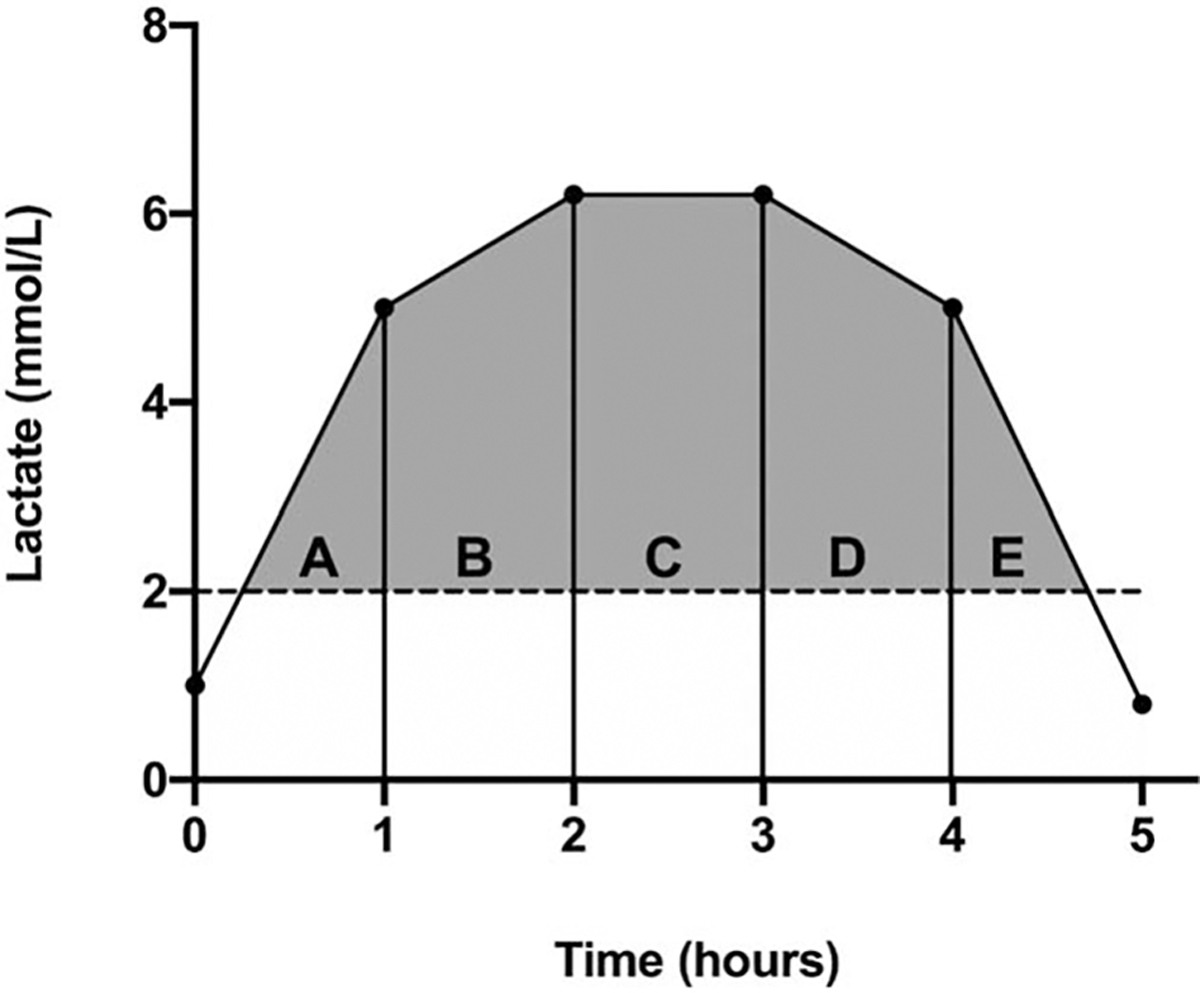
The lactate area under the curve (AUC) above the upper normal limit of lactate (2.0 mmol/L) was calculated using the trapezoidal method based on five possible scenarios depicted in (A–E).

The lactate area under the curve (AUC) above the upper normal limit of lactate (2.0 mmol/L) was calculated using the trapezoidal method based on five possible scenarios depicted in (A–E).