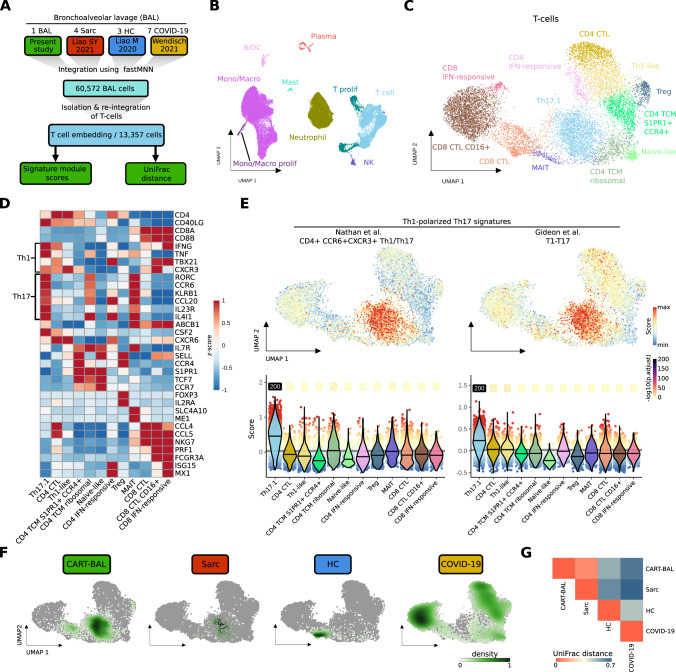
Fig. 3. scRNA-seq data integration reveals phenotypic similarities between T-cells from CART-BAL and patients suffering from pulmonary sarcoidosis.
A Schematic depicting the integration workflow of BAL data from present study with BAL data from sarcoidosis, healthy controls and COVID-19 ARDS using fastMNN. T-cells were isolated and re-integrated. Signature module scores and UniFrac distances were computed. B UMAP embedding of 60,572 cells from the integrated datasets colored by cell type. C UMAP embedding of 13,357 T-cells isolated from the integrated datasets and re-integrated, colored by T-subsets. D Heatmap showing the z-score of mean log-normalized expression of selected genes per T-subset. E Cell-based gene set module scores of two Th1-polarized Th17 gene signatures. Top: Projected onto the UMAP embedding from C. Bottom: depiction as violin plots across T-subsets (violin color). Lines in violins show median scores per T-subset. Grey lines indicate the average scores across all T-cells. Dot color specifies the signature module score and numbers specify -log10 transformed adjusted p-values (one-sided Wilcoxon rank-sum test against the average; −log10(p.adjust) with value ‘infinite’ (p.adjust = 0) were set to 200). F Kernel density estimations of cells from the four conditions (CART-BAL, Sarc, HC, COVID-19) used in data integration shown as UMAP overlay for individual conditions. G Heatmap showing the correlations between T-cells of integrated conditions by UniFrac distances. BAL bronchoalveolar lavage, Sarc sarcoidosis, HC healthy control, Mono/Macro monocytes, and macrophages, CTL cytotoxic T-lymphocyte, TCM central memory T-cell, MAIT mucosal-associated invariant T-cell.

