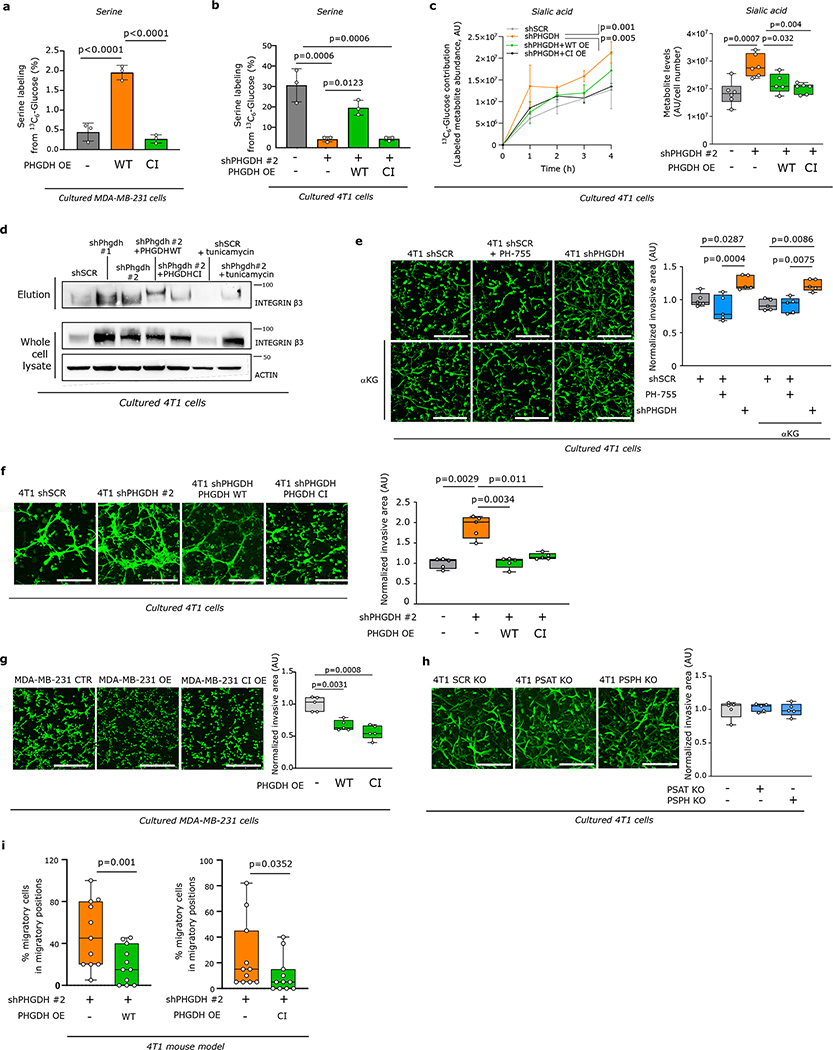
Extended Data Figure 9. Low PHGDH protein expression, but not low catalytic activity, promotes sialic acid synthesis and drives metastatic dissemination.
a-b. Measurement of serine m+3 labeling enrichment after incubation of (a) MDA-MB-231 control (CTR), PHGDH (PHGDH OE) overexpressing and catalytic inactive PHGDH (PHGDH CI OE) overexpressed cells or (b) 4T1 cells upon Phgdh knockdown (shPHGDH), Phgdh-silencing with wildtype (shPHGDH + wt OE) and catalytic inactive overexpression (shPHGDH + CI OE) for 24h in culture medium containing 13C6-glucose (n=3). Error bars represent s.d. from mean. One-way ANOVA with Holm-Sidak’s multiple comparison test.
c. Dynamic labeling using 13C6-glucose and total abundance of sialic acid in 4T1 cells upon Phgdh knockdown (shPHGDH), Phgdh-silenced cells with wildtype (shPHGDH + wt OE) and catalytic inactive overexpression (shPHGDH + CI OE) cells. Left panel, p values refer to comparison of shSCR or shPHGDH + CI OE vs shPHGDH (n=3). For sialic acid abundance, the solid lines indicate the median, the boxes extend to the 25th and 75th percentiles, the whiskers span the minimum and maximum values (n=6). One-way ANOVA with Holm-Sidak’s multiple comparison test.
d. Levels of glycosylated integrin β3 (elution) after WGA-mediated isolation of β-1,4-GlcNAc- and sialic acid-linked proteins from total lysates of 4T1 control (shSCR), Phgdh knockdown (shPHGDH) cells, and Phgdh-silenced 4T1 cells with wildtype (shPHGDH +wt OE) and catalytic inactive (shPHGDH + CI OE) overexpression. The last two samples correspond to tunicamycin treated (48h, 0.05 μg/ml) 4T1 control (shSCR) and Phgdh knockdown (shPHGDH). Total levels of integrin β3 from the whole cell lysate and actin as housekeeper are shown. One representative experiment is shown (n=3).
e. Invasive capacityof 4T1 cells upon treatment with the PHGDH catalytic inhibitor PH-775 (1 μM) for 72h and rescue with cell-permeable α-ketoglutarate (αKG, 1 mM) in a 3D matrix. The invasive area was stained with calcein green. Representative images are depicted in the left panel (scale bar 500 μm), quantification in the right panel. Each dot represents a different, randomly selected microscopy field. The solid lines indicate the median, the boxes extend to the 25th and 75th percentiles, the whiskers span the smallest and the largest values (n=5). One-way ANOVA with Tukey’s multiple comparison test.
f-h. Invasive ability of 4T1 control (shSCR), Phgdh knockdown (shPHGDH) cells and Phgdh-silenced 4T1 cells with wildtype (shPHGDH +wt OE) and catalytic inactive overexpression (shPHGDH + CI OE) (f); MDA-MB-231 control (CTR), PHGDH wildtype overexpression (OE) and catalytic inactive overexpression (CI OE) cells (g); 4T1 control (SCR KO), Psat (PSAT KO) and Psph knockout cells (PSPH KO) (h) in 3D matrix. The invasive area was stained with calcein green. Representative images are depicted in the left panel (scale bar 500 μm), quantification in the right panel. Each dot represents a different microscopy field (n=5). The solid lines indicate the median, the boxes extend to the 25th and 75th percentiles, the whiskers span the minimum and maximum values. Welch and Brown-Forsythe ANOVA with Dunnett’s multiple comparison.
i. Percentage of migratory cells per migratory position (n=11) in the primary tumor of the orthotopic (m.f.p.) 4T1 mouse model assessed by time-lapse intravital imaging. Mice were injected with a mixture of 4T1 shPHGDH-Dendra and 4T1 shPHGDH with overexpression of wildtype (shPHGDH + wt OE) (n=8) or catalytic inactive (shPHGDH + wt CI) PHGDH-mTurquoise (n=8). The solid lines indicate the median, the boxes extend to the 25th and 75th percentiles, the whiskers span the minimum and the maximum values. Unpaired t test with Welch’s correction, two-tailed.

